1. Introduction
Buffering capacity (BC) is an important physiochemical property of food that expresses the resistance of the food to a change in pH with the addition of an acid or a base [
1,
2], thus having a direct influence on the absorption of hydrogen ions and, therefore, on the regulation of gastric juice pH [
3]. In the context of gastric digestion, food BC may play a key regulatory role in digestion by influencing the gastric pH, especially by modulating the activity of gastric enzymes, the solubility of dietary ingredients, the gastric breakdown of food nutrients, and, therefore, the absorption of nutrients across the gastrointestinal tract [
4]. Furthermore, the gastric pH acts as a barrier against foodborne pathogens [
5] and may affect the gastrointestinal microbiota [
6].
Therefore, the BC of food and dietary ingredients has frequently been the focus of research in the context of human gastric digestion [
2,
7,
8,
9]. For example, Salaün et al. (2005) analysed the BC of dairy products and it was found that the BC depends on the composition of minerals and proteins [
7]. In Al-Dabbas et al. (2010), the BCs of legumes, almonds, lettuce stem, carob, liquorice root, and raw cow milk were measured, reporting a strong positive correlation of BC with protein and aspartic and glutamic acid contents [
8]. In Mennah-Govela et al. (2020), the BCs of thirty commercially available foods were measured, identifying the protein content and initial pH of the food as the most important determiners of BC [
2]. In more recent research by Ebert et al. (2021), ash, selected minerals, and amino acids, with a pKa in the range of foodstuffs, e.g., aspartic and glutamic acid, were detected as key influencing factors on overall food BC. In the study, wet texturized plant proteins were analysed for their BC, and the results were compared to the BC of pork meat [
9].
To the authors’ knowledge, there are no studies dealing with the BC of canine food or dietary ingredients. This is surprising, taking into account the importance of BC not only for canine gastric digestion but also for canine health, such as gastric hyperacidity, gastroesophageal reflux, gastric hypoacidity or dilation–volvulus syndrome [
10], food allergenicity [
11], and dental health [
12]. In addition, the design of oral canine drugs and pharmaceuticals requires knowledge of the food’s BC, too [
13]. It has also to be mentioned that a dog’s diet is very complex, extending from the inclusion of meat, meat products, offal, and bones to dairy, eggs, and marine food products, and further to plant-based ingredients, such as grains, legumes, oilseeds, and vegetables, as well as various mineral supplements and feed additives [
14]. These dietary ingredients are commonly fed as a commercially available complete food, either as dry kibbles or wet food, but also as a homemade diet. Therefore, both the ingredients and the manufacturing method may affect the BC of the dog food. Knowledge of the BC and pH of canine food may help in predicting the effects of the diet on digestion and gut health in dogs. The aim of this study was to analyze and compare the BCs of a variety of commercial dry and wet dog foods as well as homemade dog food in relation to their manufacturing method and nutrient composition. Our hypothesis was that, besides the protein content of the dog food, the manufacturing method will also have a major influence on its BC in the context of gastric digestion.
2. Materials and Methods
2.1. Dog Foods Used in the Experiment
In this experiment, a total of 30 complete dog-food samples were investigated, including randomly collected commercially available dry and canned foods as well as homemade dog food, with 10 different foods in each manufacturing method. The tested samples were dog foods prepared for healthy adult dogs (see
Supplementary Materials).
The commercial dog foods were purchased from different local supermarkets and pet stores to cover the variability of products with different producers, ingredients, and nutrient compositions. Dog food intended for particular nutritional purposes was not used. For compliance with nutritional standards, the producers of the commercial complete dog foods had to be members of the “Industrieverband Heimtier (IHV) e.V.” or the “Österreichische Heimtierfuttermittel Vereinigung (ÖHTV)”. Membership in one of these associations obliges the companies to produce their dog food according to the Fediaf Guidelines [
15], both in terms of declaration and the current recommended nutrient levels for complete dog food.
The homemade dog foods used common ingredients and were calculated to provide enough energy and nutrients for an adult, inactive dog using an Excel® calculation program (“CarnivoreDiet” ©, A. Lucke, Vetmeduni, Vienna, Austria) according to nutrient requirements of dogs (National Research Council 2006). The meat used for the homemade diets was bought frozen and already minced in local pet stores. The vegetables were bought fresh in a local supermarket. The homemade dog-food diets were prepared and mixed on the same day as the analysis of the BC took place. The meat was cooked, and only the green tripe was used raw in some homemade diets. The amount of used ingredients to formulate the homemade food was calculated to meet the nutrient recommendations of an adult dog with a 7 kg body weight and weighed with a scale (ME4002®, Mettler Toledo, USA). Mineral supplements were added on top of the diet to ensure a well-balanced diet before mixing it together.
2.2. Sample Preparation
For the sample preparation of BC measurement, 150 g of commercial dog food or the entire homemade dog food was mixed in a knife mill (Grindomix® GM 200, Retsch, Haan, Germany). Canned dog food was homogenized five times for each for ten seconds at a speed of 5000 rotations per minute (rpm), dry dog food ten times for each for ten seconds at 5000 rpm, and homemade dog food three times for each for 30 s at 5000 rpm. Different mixing times were necessary to obtain comparable textures of the different dog food types. The texture of the dog food was not measured; the right texture was decided after visual judgment.
Afterwards, 5 g of homogenized food and 15 g of deionized water (B30, Adrona, Riga, Latvia) were weighed (ME4002®, METTLER TOLEDO, Columbus, USA) and mixed in a 100 mL beaker. The final weight of each sample was 20 g. The rest of the homogenized food and an aliquot of at least 100 g of unhomogenized dry and wet dog food were frozen for further analyses. Homemade dog food was only frozen homogenised.
For the measurement of the BC, a 0.16 M HCl solution was needed. Therefore, to a 0.1 mol/l ampoule for the preparation of Volumetric Solutions (ROTI®VOLUM, Carl Roth GmbH + Co. KG, Karlsruhe, Germany), distilled water was added until a total volume of 625 mL was reached.
2.3. Measurement of the Buffering Capacity
The measurement of the BC was done by the acid titration method described previously [
2]. In brief, aliquots of 0.5–2 mL of 0.16 M HCl were added to the sample until an endpoint of pH < 2 was reached [
2]. The measurements of pH were carried out with a portable pH meter with a DHS electrode (pH 7
®, Xs-Instruments, Carpi, Italy). The electrode was calibrated at room temperature using a standard buffer solution (Technical Buffer Solution, Mettler Toledo, Greifensee, Switzerland) and had to reach an accuracy from 95 to 105% before measuring the pH.
Before starting the titration, the pH values of the undiluted wet and homemade dog food were measured. Afterwards, the initial pH of the food samples consisting of 5 g food and 15 g deionized water of dry, wet, and homemade food was measured. To do so, the feed samples were stirred with a magnetic stirrer (MR Hei-Standard®, Heidolph Instruments, Schwabach, Germany) for a total of 5 min at 250 rpm. Then, 0.5 mL of 0.16 M HCl were added, and the samples were stirred for 30 s. After each addition of 0.5 mL of 0.16 M HCl, the pH value was measured. This procedure was repeated until the pH of the sample was below 2. To speed up the titration, the amount of 0.16 M HCl added per step was increased to 1 mL from a cumulative addition of 7 mL and to 2 mL from a cumulative addition of 30 mL of hydrochloric acid.
For quality control, a duplicate sample was measured for each dog food and each pH measurement was performed in triplicate.
2.4. Nutrient-Composition Analysis
All food samples were analysed for dry matter (DM), ash, crude protein (CP), ether extracts (EE), acid detergent fibre (ADF), and neutral detergent fibre (NDF) according to the guidelines of the Association of German Agricultural Analytic and Research Institutes [
16]. The DM concentration was determined by oven-drying the samples at 103 °C for at least 4 h (method 3.1). The ash concentration was analyzed by combustion in a muffle furnace overnight at 580 °C (method 8.1). Ether extract was determined using the Soxhlet extraction system (method 5.1.2) and CP using the Kjeldahl method (method 4.1.1). A Fibretherm FT12 (Gerhardt GmbH and Co. KG, Königswinter, Germany) was used to obtain neutral detergent fibre assayed with a heat-stable α-amylase and expressed exclusive of residual ash (method 6.5.1). The nonfibre carbohydrates (NFC) were calculated as NFC = 100 − (NDF + CP + EE + ash). The homemade and wet-food samples had to be freeze-dried due to their high water content. For this purpose, the samples were deep-frozen overnight at minus 20 °C and then dried for 24 h under high-vacuum conditions (Lyovapor L-200, Büchi Labortechnik GmbH, Essen, Germany). After this process, the cooked and wet food samples were also dried overnight at 103 °C.
2.5. Calculations
All calculations were done with Excel (Microsoft Excel, Microsoft Corporation®, Redmond, USA). First, the average of each triplicate pH measurement was calculated; this was also done with the duplicate of each sample. For further calculations, the average of each sample and its duplicate were used.
The calculation of the buffering capacity was based on acid titration curves [
17].
Based on the total buffering capacity, the buffering capacity per gram of DM of the dog food was calculated. Also, the HCl use per g of DM was calculated based on the total HCl use.
2.6. Statistical Analysis
For the statistical analysis of the data, the SAS (Version 9.4, SAS institute, Cary, NC, USA) was used. First, the data were tested for normality using the UNIVARIATE procedure of SAS. The homogeneity of the variances was tested graphically after checking the data for outliers using Cook’s D in SAS. Then, an analysis of variance (ANOVA) using the MIXED procedure of SAS was performed. The factor food type was defined as a fixed effect in the model statement and the independent food sample nested within the food type as a random effect. The Kenward–Roger method was used to approximate the degrees of freedom. A Tukey adjustment was applied to compare the means.
A multiple regression analysis was performed with the backward elimination procedure to evaluate the influence of different dietary effects on HCl use per g of DM and BC per g of DM with PROC REG of SAS. The variance inflation factor (VIF) was computed to prevent multicollinearity among the predictors. The fitness of the model was tested using R2 and the root mean square error (RMSE). The p < 0.05 was considered significant and 0.05 ≤ p < 0.10 as a tendency.
4. Discussion
The aim of this study was to analyze the BC and the HCl amount needed to acidify the food, as an indication of the gastric acidity of commercial dog food and homemade dog food in relation to their nutrient compositions. Therefore, the buffering capacities of 30 complete dog foods, each of ten different types of commercial dry and wet dog food, and homemade dog food were measured and parameters that influenced the buffering capacity were evaluated. To the best of our knowledge, this is the first study to evaluate canine food for BC.
In our study, we could observe differences in initial pH, BC/g of DM, and used HCl/g of DM among the different food types. The lowest initial pH was dry food with a mean pH of 5.62, followed by homemade food, with a mean pH of 6.31. The highest pH was wet food, with a mean pH of 6.77. A possible explanation for the high initial pH in wet food could be the significantly higher CP content in wet compared to dry food. A study identified that feedstuffs with a high protein content have an initial pH around neutrality [
18]. Homemade food had no significantly different protein content in the DM compared to dry food but had a significantly higher initial pH. Giger-Reverdin emphasized in her study that feedstuffs which retained water had lower initial pH values than feedstuffs of the same protein content but with a lower water-holding capacity [
18]. The difference between these two different food types could be explained through the different DM content and preservatives or palatants, like phosphoric acid, citric acid, and mixed tocopherols that are added to dry food to enhance the palatability [
19] or inhibit the growth of pathogens [
20]. In this context, it is also interesting to mention that a low pH in dog food could possibly increase the risk of caries because it lowers the pH of the saliva [
4,
12].
There are also differences in the BC per gram of DM among the food types. The highest BC per gram of dry matter was wet food, with a mean of 2.72, followed by homemade food with a mean of 1.86. The lowest BC per gram of DM was dry food, with a mean of 1.83. It is no surprise that wet food had the highest BC per gram of DM because it also had the highest CP content. There was no significant difference in the BC per gram of DM between dry and homemade food; this was due to the similar CP content of these two food types.
The highest use of HCl per gram of DM was wet food, with a mean of 13.2 mL, followed by homemade food, with a mean of 8.15 mL. The lowest use of HCl per gram of DM was dry food with a mean of 6.69 mL. According to our results from the multiple regression, ash (p = 0.059) had a tendency to affect the HCl use and wet food had a significantly higher ash content than the other food types. This finding, in combination with the high CP content of the wet food, could explain the high HCl use.
For all food types, there was a wide range in the values of BC for their own food type. This could be explained through their different nutrient composition, but also individual ingredients could have an influence on the initial pH, the BC per gram of DM and the HCl use per gram of DM. However, measuring the BC in commonly used ingredients in dog food would be necessary to prove the theory. In view of the results, the question arises whether the different food types have a different influence on gastric pH in dogs. There are no studies that measured the gastric pH of dogs during digestion and provided information on the BC of the used food. However, it is possible to calculate with our data the amount of gastric acid needed and the time to reach the gastric pH under two. It is estimated that dogs have postprandial gastric acid secretion around 1.5 mL per kg body mass per minute ([
21], p. 42). For instance, if we take a 10 kg dog that is fed a meal of 70 g of food DM and take the mean acidity values of each food type, for wet food 924 mL gastric acid and 62 min are needed to reach a gastric pH under 2. In comparison, for homemade food, it is 570 mL gastric acid and 47 min, whereas for dry food 468 mL gastric acid and 32 min are needed to reach a gastric pH under 2. It is important that the calculated values cannot be applied one to one to the in vivo conditions in the stomach, since the gastric pH is influenced by many other factors too. However, this information could be important for dogs with gastric hypoacidity or gastritis to choose the right food, where a small amount of gastric acid is needed to reach the right pH levels in the stomach. The current dietary recommendation for dogs with gastritis is to feed restrictive CP content that covers the minimum requirements in dogs’ nutrition, in order to avoid increased gastric juice secretion ([
21], pp. 274–275). For dogs with hypoacidity, it is recommended to feed diets based on easily digestible proteins and fat as energy sources ([
21], pp. 274–275).
Significant differences between the nutrient compositions could be found among the food types. Wet food had the highest CP content, with a mean of 44.1%, and was therefore significantly higher than the homemade (mean 29.1% DM) and dry food (mean 26.2% DM). The difference in CP content in dry and wet dog food could be explained through different demands on the manufacturing process of the food. A high level of starch is needed in dry food to maintain the durability of the kibble [
22]; the production process of wet food does not require starch, so it mostly contains meat and animal byproducts [
23]. The lower CP content of homemade food compared with wet food was due to the decision to feed rations with a lower protein content, enough to cover the dogs’ requirements in CP, but to cover the energy requirements mainly via carbohydrates and fats.
The highest EE content was in the wet food, with a mean of 23.9% DM, followed by homemade food (mean 18.8% DM) and dry food (mean 12.3% DM). Surprisingly, the measured EE content in wet food was on average 13.3% lower and in dry food 7.9% lower than that declared by the manufacturers. Differences in the EE content could be caused by the different fat content of different parts of the carcass that were used for the dog food.
Also, the different NFC content between the food types can be explained by the manufacturing process. The NFC provides information about the amount of cell ingredients, mostly starch and sugar, and pectin in a diet. This explains the high NFC of dry food, with a mean of 39.9% DM and homemade food, with a mean of 36.3% DM.
In our study, wet food had a mean ash content of 10.4% DM, dry food 7.25% DM, and homemade food 6.3% DM. Furthermore, it is interesting to mention that, in our study, the measured ash content of wet food was on average 8.3% higher than that declared by the manufacturers. These results are quite similar to another study that measured the average ash content in dry food at 7.34% DM and in wet food at 10.1% DM [
24]. Specifically, the high ash content in wet food could be a risk factor for gastric dilatation–volvulus syndrome, because it could lead to an insufficient pH drop in the stomach, which promotes the growth of gas-producing bacteria [
25]. A possible explanation for the high ash content of wet food might be higher concentrations of Na and K [
23]. NaCl is often added to wet food to increase the acceptance and palatability, and the addition of Na alginate, K alginate, or K carrageenin as gelling agents and thickeners [
23]. Yet, as observed in this study, ash increases the BC of wet food significantly; therefore, our data suggest that the use of gelling agents in wet food needs additional evaluation.
Regression analyses were used to search for various factors influencing BC/g DM and the use of HCl/g of DM. In our study, the content of CP was the most important factor that influenced the buffering capacity of dog food. In the multiple regression, CP had a very strong and positive significant influence on the BC/g of DM and used HCl/g of DM, both with a
p < 0.001. Unfortunately, we do not have information about the exact protein composition of the tested food. Other studies have already shown that different protein sources, e. g. plant based or animal origin and different parts of the carcass, e. g. chicken skin or meat, have different BC values [
9,
26].
Also, other studies described protein as one of the main factors that affected the BC of food. For example, in Mennah-Govela et al., the BC of thirty commercially available commonly used food products that could be eaten as purchased, for example, milk, canned chicken, and tofu, were measured in her study and the protein content correlated with the total BC (R
2 = 0.67) and the total acid added (R
2 = 0.82) [
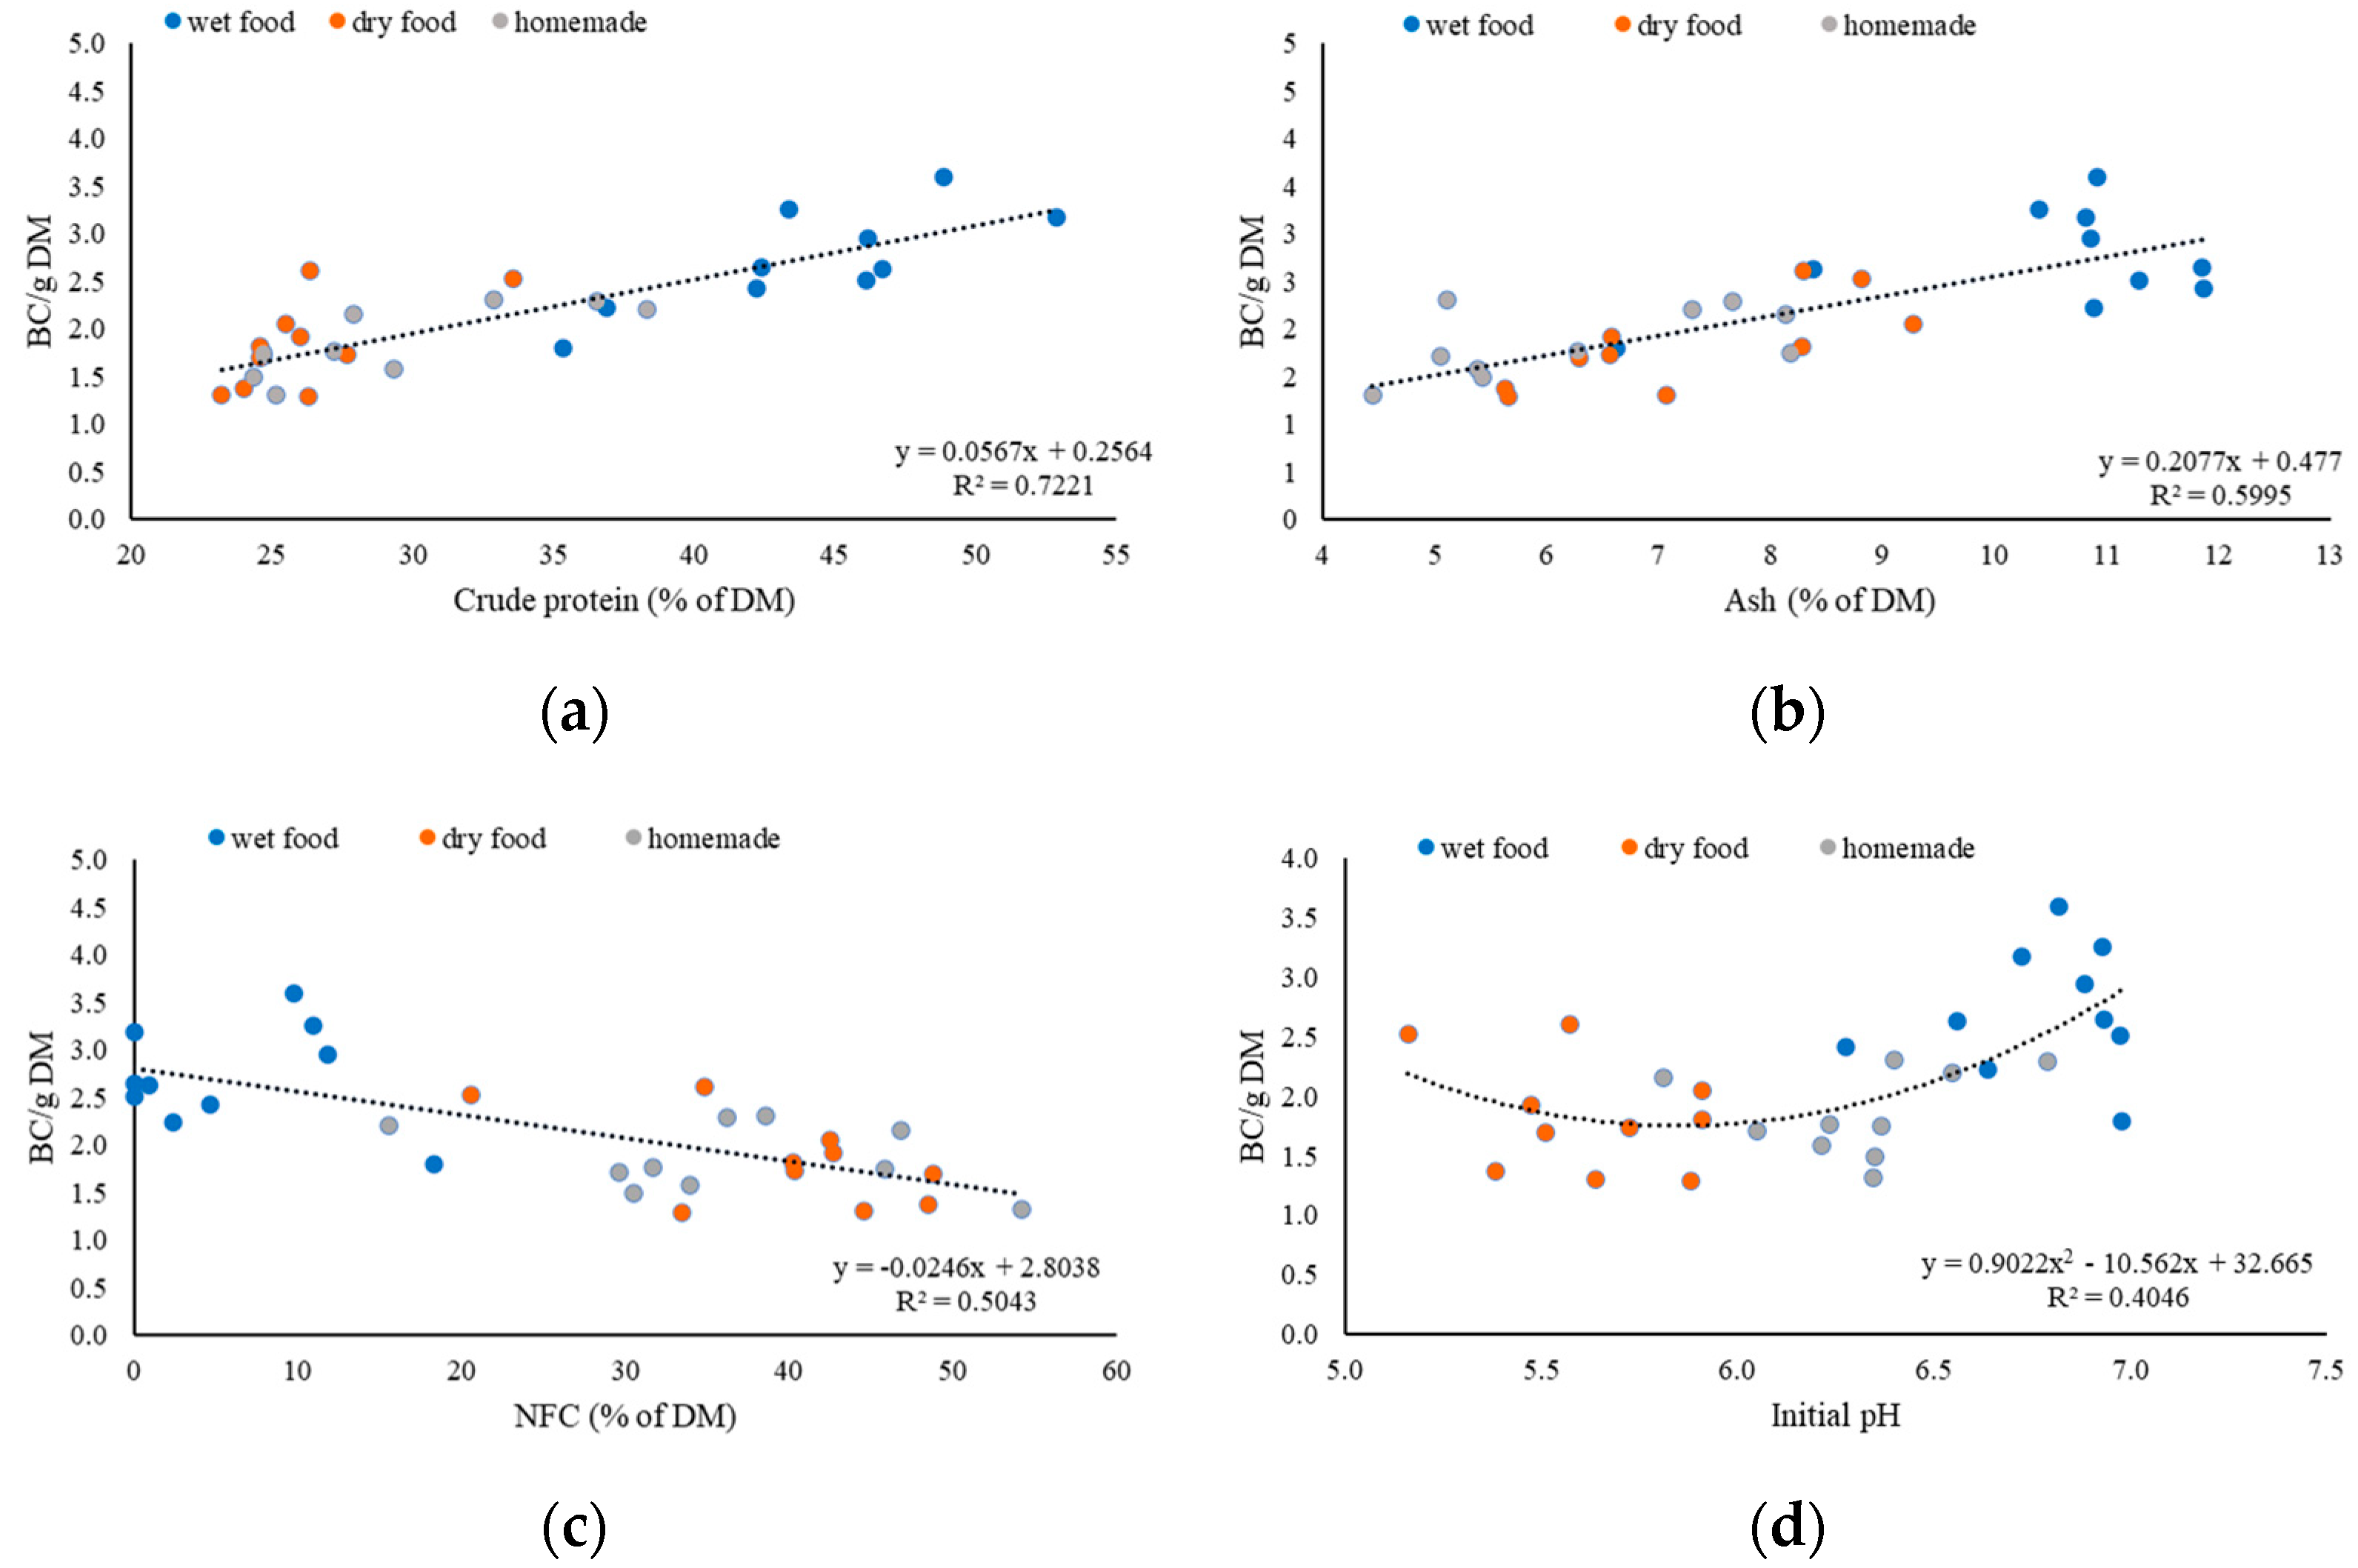
2]. These results are similar to our results where the crude protein content correlated with the BC/g of DM (R
2 = 0.72) and the HCl/g of DM (R
2 = 0.83). Another study which measured the BC of commonly used feedstuff in ruminant diets concluded that the BC was high when the crude protein was high (>15%) and decreased as the protein content decreased [
27]. In our study, wet food had the highest content of crude protein in DM, with 44.1% compared to dry food (26.2%) and homemade food (29.1%), and was therefore significantly higher. The BC/g of DM and the used HCl/g of DM were also significantly higher in wet food than in other food types. Further studies that analysed the BC of commonly used ingredients of pig and poultry feed came also to the conclusion that the protein content was an important factor [
3,
28].
The ash content of the food tended to affect the amount of used HCl/g of DM (
p = 0.0591). A significant effect of ash content on the BC/g of DM was not proved after multiple regression. The linear regression between the BC/g of DM and ash R
2 was 0.60 and between the used HCl/g of DM and R
2 was 0.57. In Jasaitis et al. the BCs of fifty-two feeds, representing common ingredients used in ruminant diets, were analysed, and it was found that there was a significant correlation between BC and ash content (
p < 0.001) [
29]. The difference in the results of both studies could be due to a different cation–anion ratio in the ash content from dog food and ruminant feed. Anions also interact differently with different minerals; different compositions of minerals could also be a reason for the different results [
7].
The initial pH only tended to have a negative influence on the BC/g of DM, with a
p = 0.0850 and on the used HCl/g of DM a positive influence, with a
p = 0.0769. This is in contrast to another study in which the initial pH had a negative significant influence on the BC (
p < 0.05) but no significant influence on the total acid added (
p > 0.05) [
2].
Dry food had a mean DM content of 90.6%, which was a higher DM content than wet food (22.7%) and homemade food (26.4%). Also, the BC of dry food (8.22) was higher than the BC of wet food (3.02) and homemade food (2.40). These values could be explained through the measurement and calculation method of the BC. For the BC analysis, samples of 5 g from each food were used and the DM content of each food was not considered. However, if the BC was corrected for the DM, the DM content was considered, wet food had a mean of 2.72, a significantly higher BC/g of DM than dry food (1.83) and homemade food (1.86). This aspect shows why it is so important to compare the different feeds on a dry-matter basis; otherwise, the results would be misinterpreted. However, the multiple regression proved a negative significant influence (p < 0.05) of the DM content of the tested food on the BC/g of DM. This means that, the more water the food contains per gram of DM, the higher the BC/g of DM.
According to the research by Mennah-Govela et al., the particle size had a significant influence on food, with a protein content higher than 19% [
2], and a CP content that is relevant to dog food. Accordingly, a smaller particle size resulted in a higher buffering capacity [
2]. A possible effect could not be evaluated in our study, because the samples were mixed to obtain a comparable texture for the different dog feed types. However, the particle size could be important for the in vivo BC of the dog food. Dry food had, depending on the brand, a different croquette size. Also, in homemade diets, the particle size could play a role in the BC. For example, it could have an influence on the BC if minced meat is fed or meat sliced in pieces is fed. The possible influence of particle size on the BCs of different dog-feed types needs further research.


 ), dry (
 ), and homemade (
 ) food required to lower the pH < 2; (a) CP in % of DM; (b) ash in % of DM; (c) NFC in % of DM; and (d) initial pH.

