Article

Identification of Candidate Genes for Economically Important Carcass Cutting in Commercial Pigs through GWAS

1
College of Animal Science and National Engineering Research Center for Breeding Swine Industry, South China Agricultural University, Guangzhou 510642, China
2
Guangdong Provincial Key Laboratory of Agro-Animal Genomics and Molecular Breeding, South China Agricultural University, Guangzhou 510642, China
3
Guangdong Zhongxin Breeding Technology Co., Ltd., Guangzhou 510642, China
4
Yunfu Subcenter of Guangdong Laboratory for Lingnan Modern Agriculture, Yunfu 527400, China
*
Authors to whom correspondence should be addressed.
These authors contributed equally to this work.
Animals 2023, 13(20), 3243; https://doi.org/10.3390/ani13203243
Submission received: 12 September 2023 / Revised: 8 October 2023 / Accepted: 16 October 2023 / Published: 18 October 2023
(This article belongs to the Special Issue Molecular Mechanisms Affecting Important Traits of Pigs)

Abstract

:

Simple Summary

Tenderloin and rib weight are important components of the economic value of pig carcasses, and selling them separately after fine segmentation further enhances the economic value of the carcasses. This study represents one of the rare attempts to conduct a genome-wide analysis focused on the economic value of pig carcasses, utilizing post-slaughter carcass phenotype values and genotype data to identify genetic variation regions. Through our investigation, we have identified several promising candidate regions and genes that have the potential to contribute valuable insights for breeding strategies and marker-assisted selection in pig production.

Abstract

During the process of pork production, the carcasses of pigs are divided and sold, which provides better economic benefits and market competitiveness for pork production than selling the carcass as a whole. Due to the significant cost of post-slaughter phenotypic measurement, the genetic architecture of tenderloin weight (TLNW) and rib weight (RIBW)—important components of pig carcass economic value—remain unknown. In this study, we conducted genome-wide association studies (GWAS) for TLNW and RIBW traits in a population of 431 Duroc × Landrace × Yorkshire (DLY) pigs. In our study, the most significant single nucleotide polymorphism (SNP) associated with TLNW was identified as ASGA0085853 (3.28 Mb) on Sus scrofa chromosome 12 (SSC12), while for RIBW, it was Affx-1115046258 (172.45 Mb) on SSC13. Through haplotype block analysis, we discovered a novel quantitative trait locus (QTL) associated with TLNW, spanning a 5 kb region on SSC12, and a novel RIBW-associated QTL spanning 1.42 Mb on SSC13. Furthermore, we hypothesized that three candidate genes, TIMP2 and EML1, and SMN1, are associated with TLNW and RIBW, respectively. Our research not only addresses the knowledge gap regarding TLNW, but also serves as a valuable reference for studying RIBW. The identified SNP loci strongly associated with TLNW and RIBW may prove useful for marker-assisted selection in pig breeding programs.

1. Introduction

Pork is the most widely consumed meat globally and serves as a crucial protein source in human nutrition [1,2]. Due to diverse dietary preferences, pork consumption varies across regions, resulting in substantial price discrepancies for different pork cuts. Carcass segmentation enables the separate sale of distinct parts, thereby enhancing the overall market value of the carcass and providing better economic benefits and market competitiveness for pork production [3,4]. In the Chinese market, tenderloin represents the highest-priced fresh meat [5,6], and customers particularly appreciate tenderloin for its attributes such as juiciness, low fat content, and high protein content [7,8]. Ribs are important components of the pig carcass and provide a maximum reflection of the pig’s economic value. Therefore, tenderloin weight (TLNW) and rib weight (RIBW) as the quantitative traits are the key indicators of pig carcass segmentation.
However, the high costs associated with slaughter testing and the challenges in data collection have posed significant obstacles in unraveling these genetic mechanisms. Limited research has been conducted specifically focusing on post-slaughter carcass traits. Rib number, as an indirect indicator of rib weight, is influenced by a diverse array of genetic factors. Notably, the VRTN gene, associated with vertebral development, has undergone extensive investigation and emerged as a promising candidate gene for regulating rib number. It is localized within the quantitative trait loci (QTL) region of swine chromosome 7 [6,9,10,11,12,13]. Additionally, previous studies have shed light on other factors influencing rib growth, including the LTBP2 gene, which has demonstrated its capability to enhance rib number in knockout mice [5]. In their study on the regulation of muscle development, Van Laere et al. [14] discovered that the IGF2 gene plays a crucial role in muscle development in pigs. Oczkowicz et al. [15] found that the IGF2 gene leads to a significant increase in tenderloin weight (11 ± 0.01 g). Furthermore, Burgos et al. [16] reported the capacity of the IGF2 gene to enhance tenderloin muscle tissue in pigs. Xie et al. [13] identified the CD96 gene as a potential candidate gene for influencing tenderloin. However, there is currently limited genetic structural analysis directly targeting post-slaughter carcass traits, and there are still many uncertainties in the genetic mechanisms underlying these traits.
In recent years, the rapid advancement and application of high-throughput sequencing technology have propelled genome-wide association studies (GWAS) as a robust strategy for identifying genetic variations associated with complex traits. This approach has found extensive use in the fields of husbandry [17,18,19] and human disease research [20,21]. Compared to previous studies employing microsatellite molecular markers [22,23], the combination of GWAS with single nucleotide polymorphism (SNP) molecular marker technology offers greater accuracy in detecting QTL intervals [24]. GWAS has also been extensively employed to investigate the genetic variation and diversity underlying economically important traits in pigs [25,26]. In previous studies [27,28], GWAS, utilizing genotype information from the GeneSeek Porcine 50K SNP Chip, has successfully identified numerous significant QTLs and candidate genes associated with important economic traits.
To further pinpoint the key loci influencing carcass segmentation traits, we performed a GWAS on the post-slaughter traits of TLNW and RIBW in a cohort of 431 Duroc × Landrace × Yorkshire (DLY) pigs. The aim of this study was to unravel the genetic architecture underlying carcass segmentation traits and facilitate the rapid development of molecular breeding in pigs.

2. Materials and Methods

2.1. Ethics Statement

The animals and experimental procedures used in this study were handled following the guidelines set forth by the Animal Care and Use Committee of the South China Agricultural University (SCAU) (Guangzhou, China). The ethics committee of SCAU approved all animal experiments. The experimental animals were not anesthetized or euthanized during this study.

2.2. Samples and Phenotype Data

In the present study, we collected 431 three-way crossbred DLY pigs from Wens Foodstuff Group Co., Ltd. (Yunfu, China). All pigs were subjected to the same growth and feeding conditions. After that, the unified slaughtering was carried out according to the standard slaughtering flow at (110 ± 5) kg body mass. Pigs fasted for 24 h before slaughter, were provided with free drinking water, and were subjected to neither beating nor driving before slaughtering, so as not to affect the meat slaughtering experiment carried out in the slaughterhouse. All pigs were divided into five batches and slaughtered in a commercial abattoir in Chifeng, Inner Mongolia. Electric shock anesthesia and heart bloodletting were used for slaughtering, and fine segmentation of each pork carcass was subsequently carried out. After fine segmentation, the weight of either the tenderloin or the ribs was recorded, as TLNW and RIBW, respectively (431 pigs for TLNW, 408 pigs for RIBW). Further details on the segmentation position are shown in Figure 1.

2.3. SNP Genotyping and Quality Control

The genomic DNA needed in this experiment was isolated and extracted from the ear tissue of 431 pigs using the standard phenol/chloroform method. All 431 DNA samples were subjected to DNA quality control according to light absorption ratio (A260/280 and A260/230), gel electrophoresis, and DNA concentration of 50 ng/μL. The GeneSeek pig 50 K SNP chip was used for genotyping with a total of 50,643 SNPs. The genotype quality control of the 431 DLY pigs was conducted using PLINK v1.9 software [29]. Individuals with a call rate of less than 95% and SNPs with a call rate of less than 90% and a minor allele frequency of less than 0.01 were deleted. SNPs that failed the Hardy–Weinberg equilibrium test (p < 10−6) and were unmapped or located on the sex chromosome were also removed. After QC, 4188 SNPs not located on autosome chromosomes were discarded. Moreover, we removed 211 (TLNW) and 213 (RIBW) SNPs because of missing genotype data; 11,202 SNPs due to failing the Hardy–Weinberg exact test; and 64 SNPs due to their minor allele threshold. All animals passed the QC (431 for TLNW and 408 for RIBW). Finally, 34,978 TLNW SNPs and 34,976 RIBW SNPs were retained for subsequent analysis.

2.4. Population Structure and Single-Locus GWAS Analysis

Population stratification is one of the main reasons for unreliable GWAS results, as it can cause false positive results. Principal component analysis (PCA) and LD analysis were performed using the SNPs that met the QC standards to investigate the population structure. PCA was performed with GCTA software (version 1.93.2 beta) [30]. In addition, the quantile–quantile (Q–Q) plot and inflation factor (λ) were obtained using the qqman package in R software (version 4.1.2).
GEMMA software (version 0.98.5) was used to implement a Mixed Linear Model (MLM) for single-locus GWAS of TLNW and RIBW [31]. GEMMA calculated the genome correlation matrix (GRM) between individuals in each population to illustrate the population structure. The first five principal components calculated by the GCTA tool are embedded into the correlation analysis model as covariables to eliminate the mixed influence of population structure [32]. The model for testing the allelic effects of TLNW and RIBW invoked by each SNP to GEMMA is as follows:
y = W α + X β + u + ε
where y represents a vector of TLNW and RIBW; W is the incidence matrix of covariates, including fixed effects of the top three eigenvectors of sex, live weight, slaughter batch, and the top five principal component from PCA analysis; α represents the vector of corresponding coefficients including the intercept; X is the vector of all marker genotypes; β specifies the corresponding effect size of the marker size; u is the vector of random effects, with u ~ MVN n   0 ,   λ τ 1 K ; ε is the vector of random residuals, with ε ~ MVN n   0 ,   τ 1 I n ; λ signifies the ratio between two variance components;   τ 1 is the variance of the residual errors; K is the GRM; I is an n × n identity matrix; and n refers to the number of pigs. In the study, Bonferroni correction was used to determine the threshold p values of single-locus GWAS. At a stringent genome-wide Bonferroni threshold, p < (0.05/N). At a more lenient threshold, p < (1/N) for chromosome-wide (suggestive) associations, and N means the number of SNPs [25]. Haploview v4.2 software was used to perform haplotype block analysis to estimate the LD pattern of significant SNPs in an LD block [33]. LD among SNPs were estimated as the squared correlation (r2) of alleles with a window size of 1000 kb.
The model in GCTA software, as following, is used to estimate the SNP-based heritability and the phenotypic variance explained by genome-wide SNPs (based on SNP inheritance), the proportion of phenotypic variation explained by significant SNPs:
y = X β + g + ε   with   var ( y ) = A g σ g 2 + I σ ε 2
where y is the vector of tenderloin weight or ribs weight; β is the vector including fixed effects; X is an incidence matrix for β; g is the vector of the aggregate effects of all the qualified 50K SNPs for the pigs within one population; Ι is the identity matrix; Ag is the genomic relatedness matrix estimated by these SNPs; σ g 2 is the additive genetic variance captured by either the genome-wide SNPs or the selected SNPs; and σ ε 2 is the residual variance. The heritability and the phenotypic variance explained by the SNPs can be estimated using the model simply described as h2 = σ g 2 / σ p 2 , where σ p 2 (total phenotypic variance) is the sum of σ g 2 and σ ε 2 .

2.5. Identification of Candidate Genes and Functional Analysis

All SNPs refer to the latest version of the Sus scrofa 11.1 genome (http://ensembl.org/Sus_scrofa/Info/Index, accessed on 3 August 2023). Functional gene annotation (v105) was downloaded in GIFF3 format from the Ensembl website (http://ftp.ensembl.org/pub/release-105/gff3/sus_scrofa/, accessed on 3 August 2023). The R package BioMart (version 2.56.1) [34] efficiently retrieved functional genes. KEGG and GO analyses were conducted using KOBAS 3.0 [35] to investigate the functions of all candidate genes. Enriched terms with a significance threshold of p value < 0.05 were selected to further explore the genes invoked in pathway and biological processes. Subsequently, we employed REVIGO (http://revigo.irb.hr, accessed on 8 August 2023) in conjunction with the Mus musculus database to eliminate GO term redundancy (medium threshold, 0.7) and cluster the remaining terms in a 2D space [36,37]. This space was derived by applying multidimensional scaling to a matrix of GO terms with semantic similarities. The Mouse Genome Informatics website (https://www.informatics.jax.org/, accessed on 10 August 2023), GeneCards (http://www.genecards.org/, accessed on 10 August 2023), and Ensembl (www.ensembl.org/biomart/martview, accessed on 10 August 2023) were used to query gene functions.

3. Results

3.1. Phenotypic Variation and SNP Genotyping

Table 1 presents various phenotypic and genetic parameters for TLNW and RIBW traits, including animal count, mean, standard deviation, maximum, minimum, coefficient of variation (CV), and heritability. On average, TLNW and RIBW were 0.46 ± 0.08 kg and 4.51 ± 0.56 kg, respectively. The CV values for TLNW and RIBW were 17.40% and 12.42%, respectively. The distribution and visualization of the SNP dataset across chromosomes are summarized in Figure S1, Tables S1 and S2. These SNPs were roughly proportionally distributed across all 18 chromosomes of pigs, with the longest chromosome having the highest number of SNPs. Importantly, the SNP-based heritability (including standard errors) for TLNW and RIBW were 0.42 (0.11) and 0.22 (0.09), respectively.

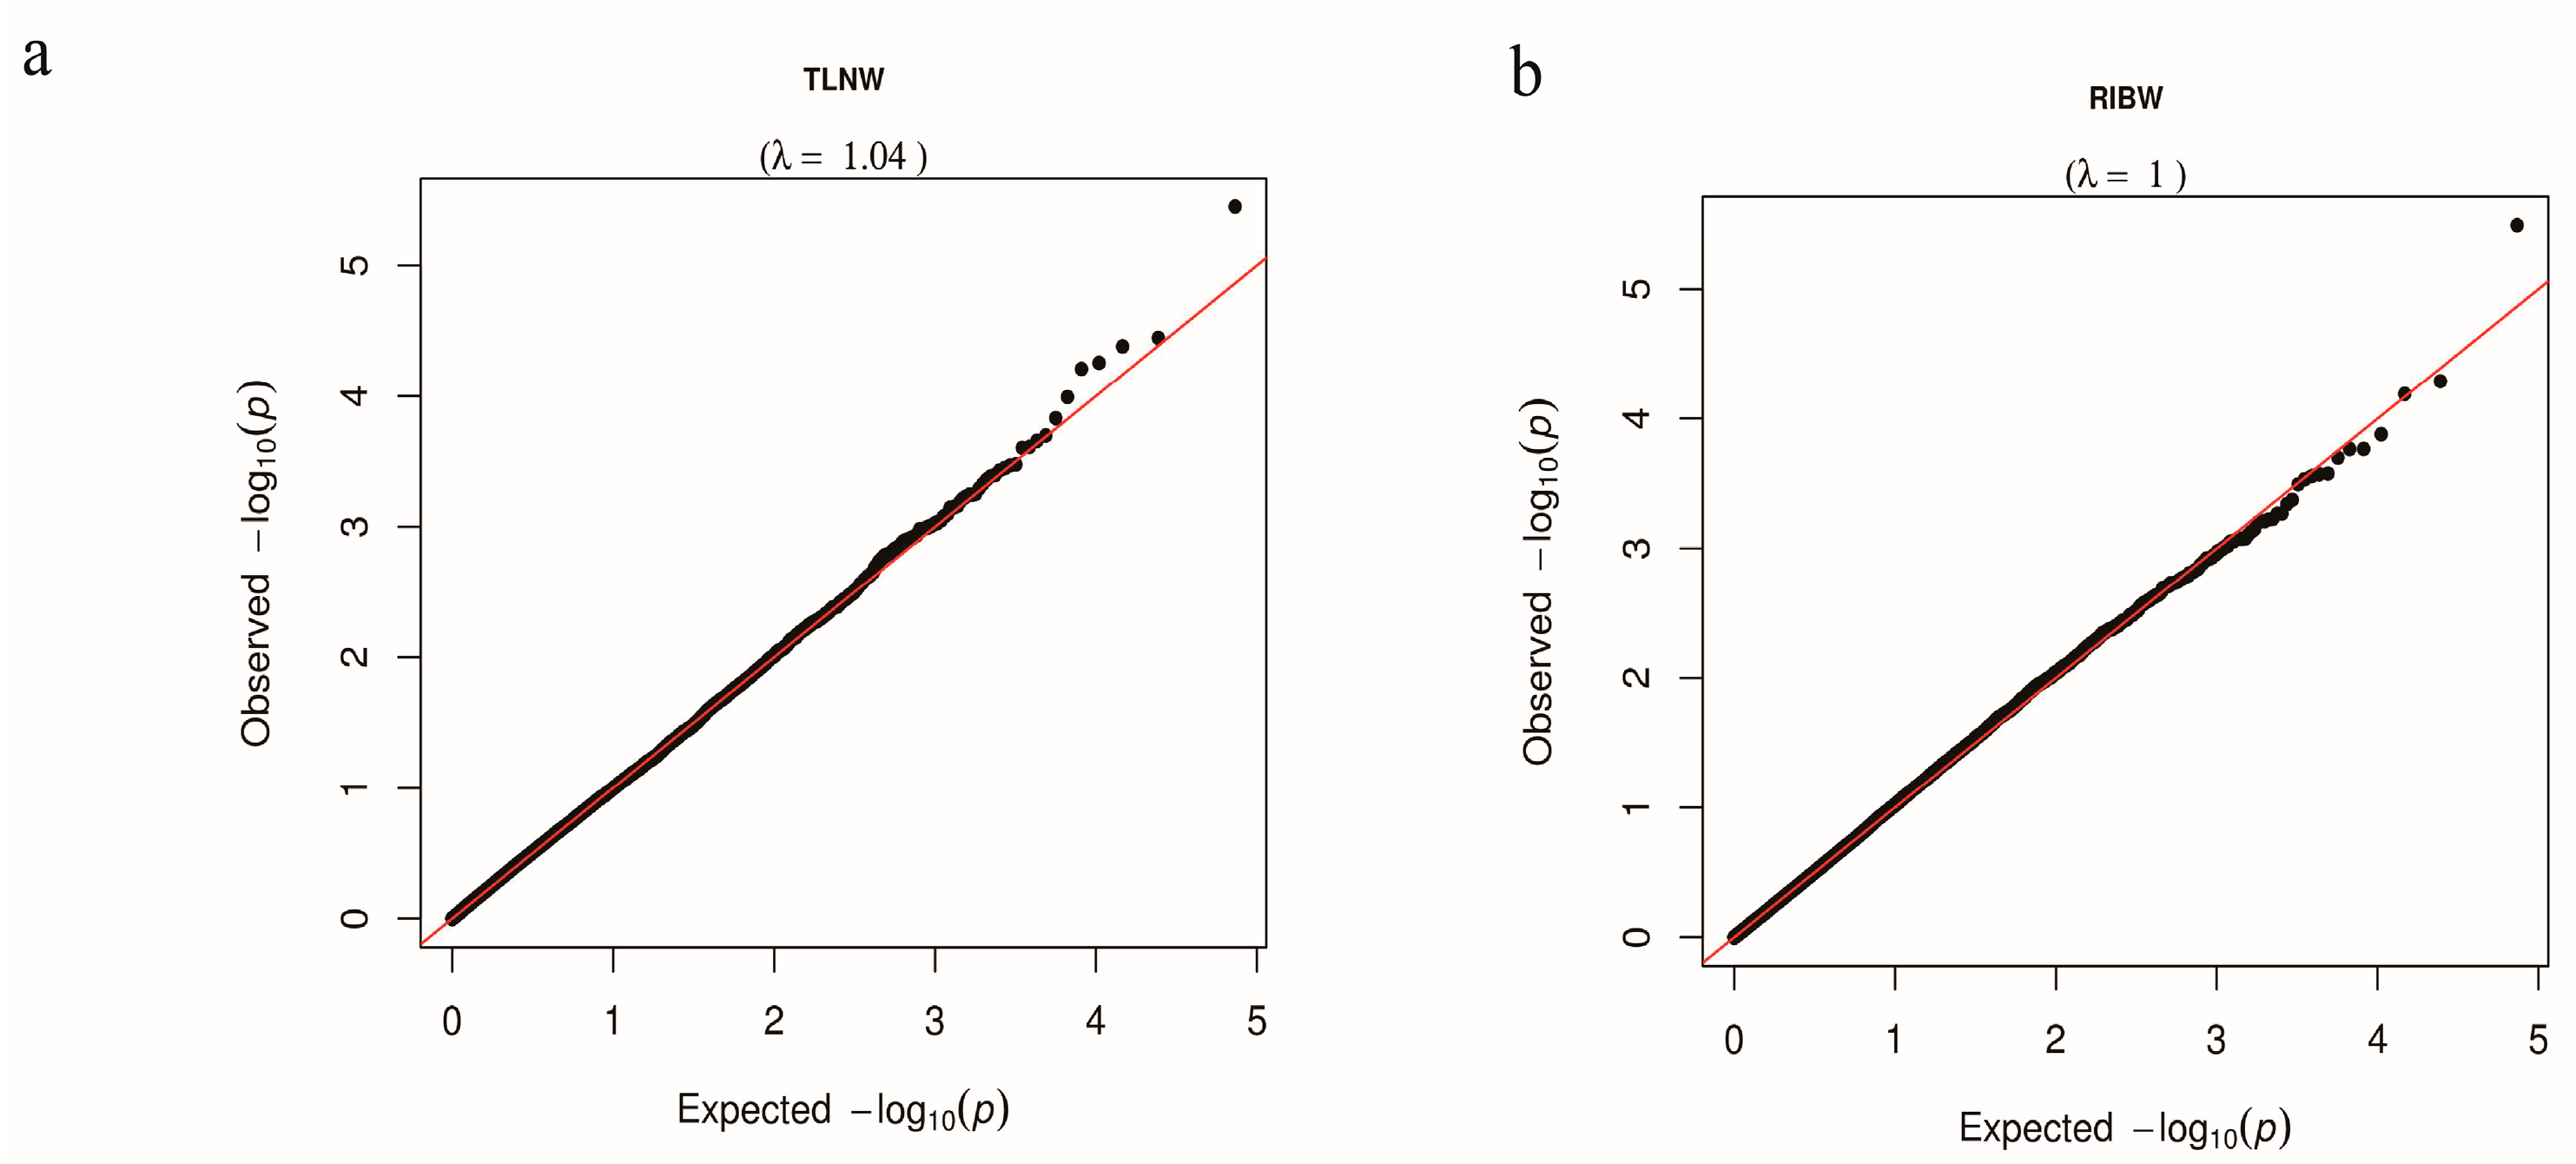
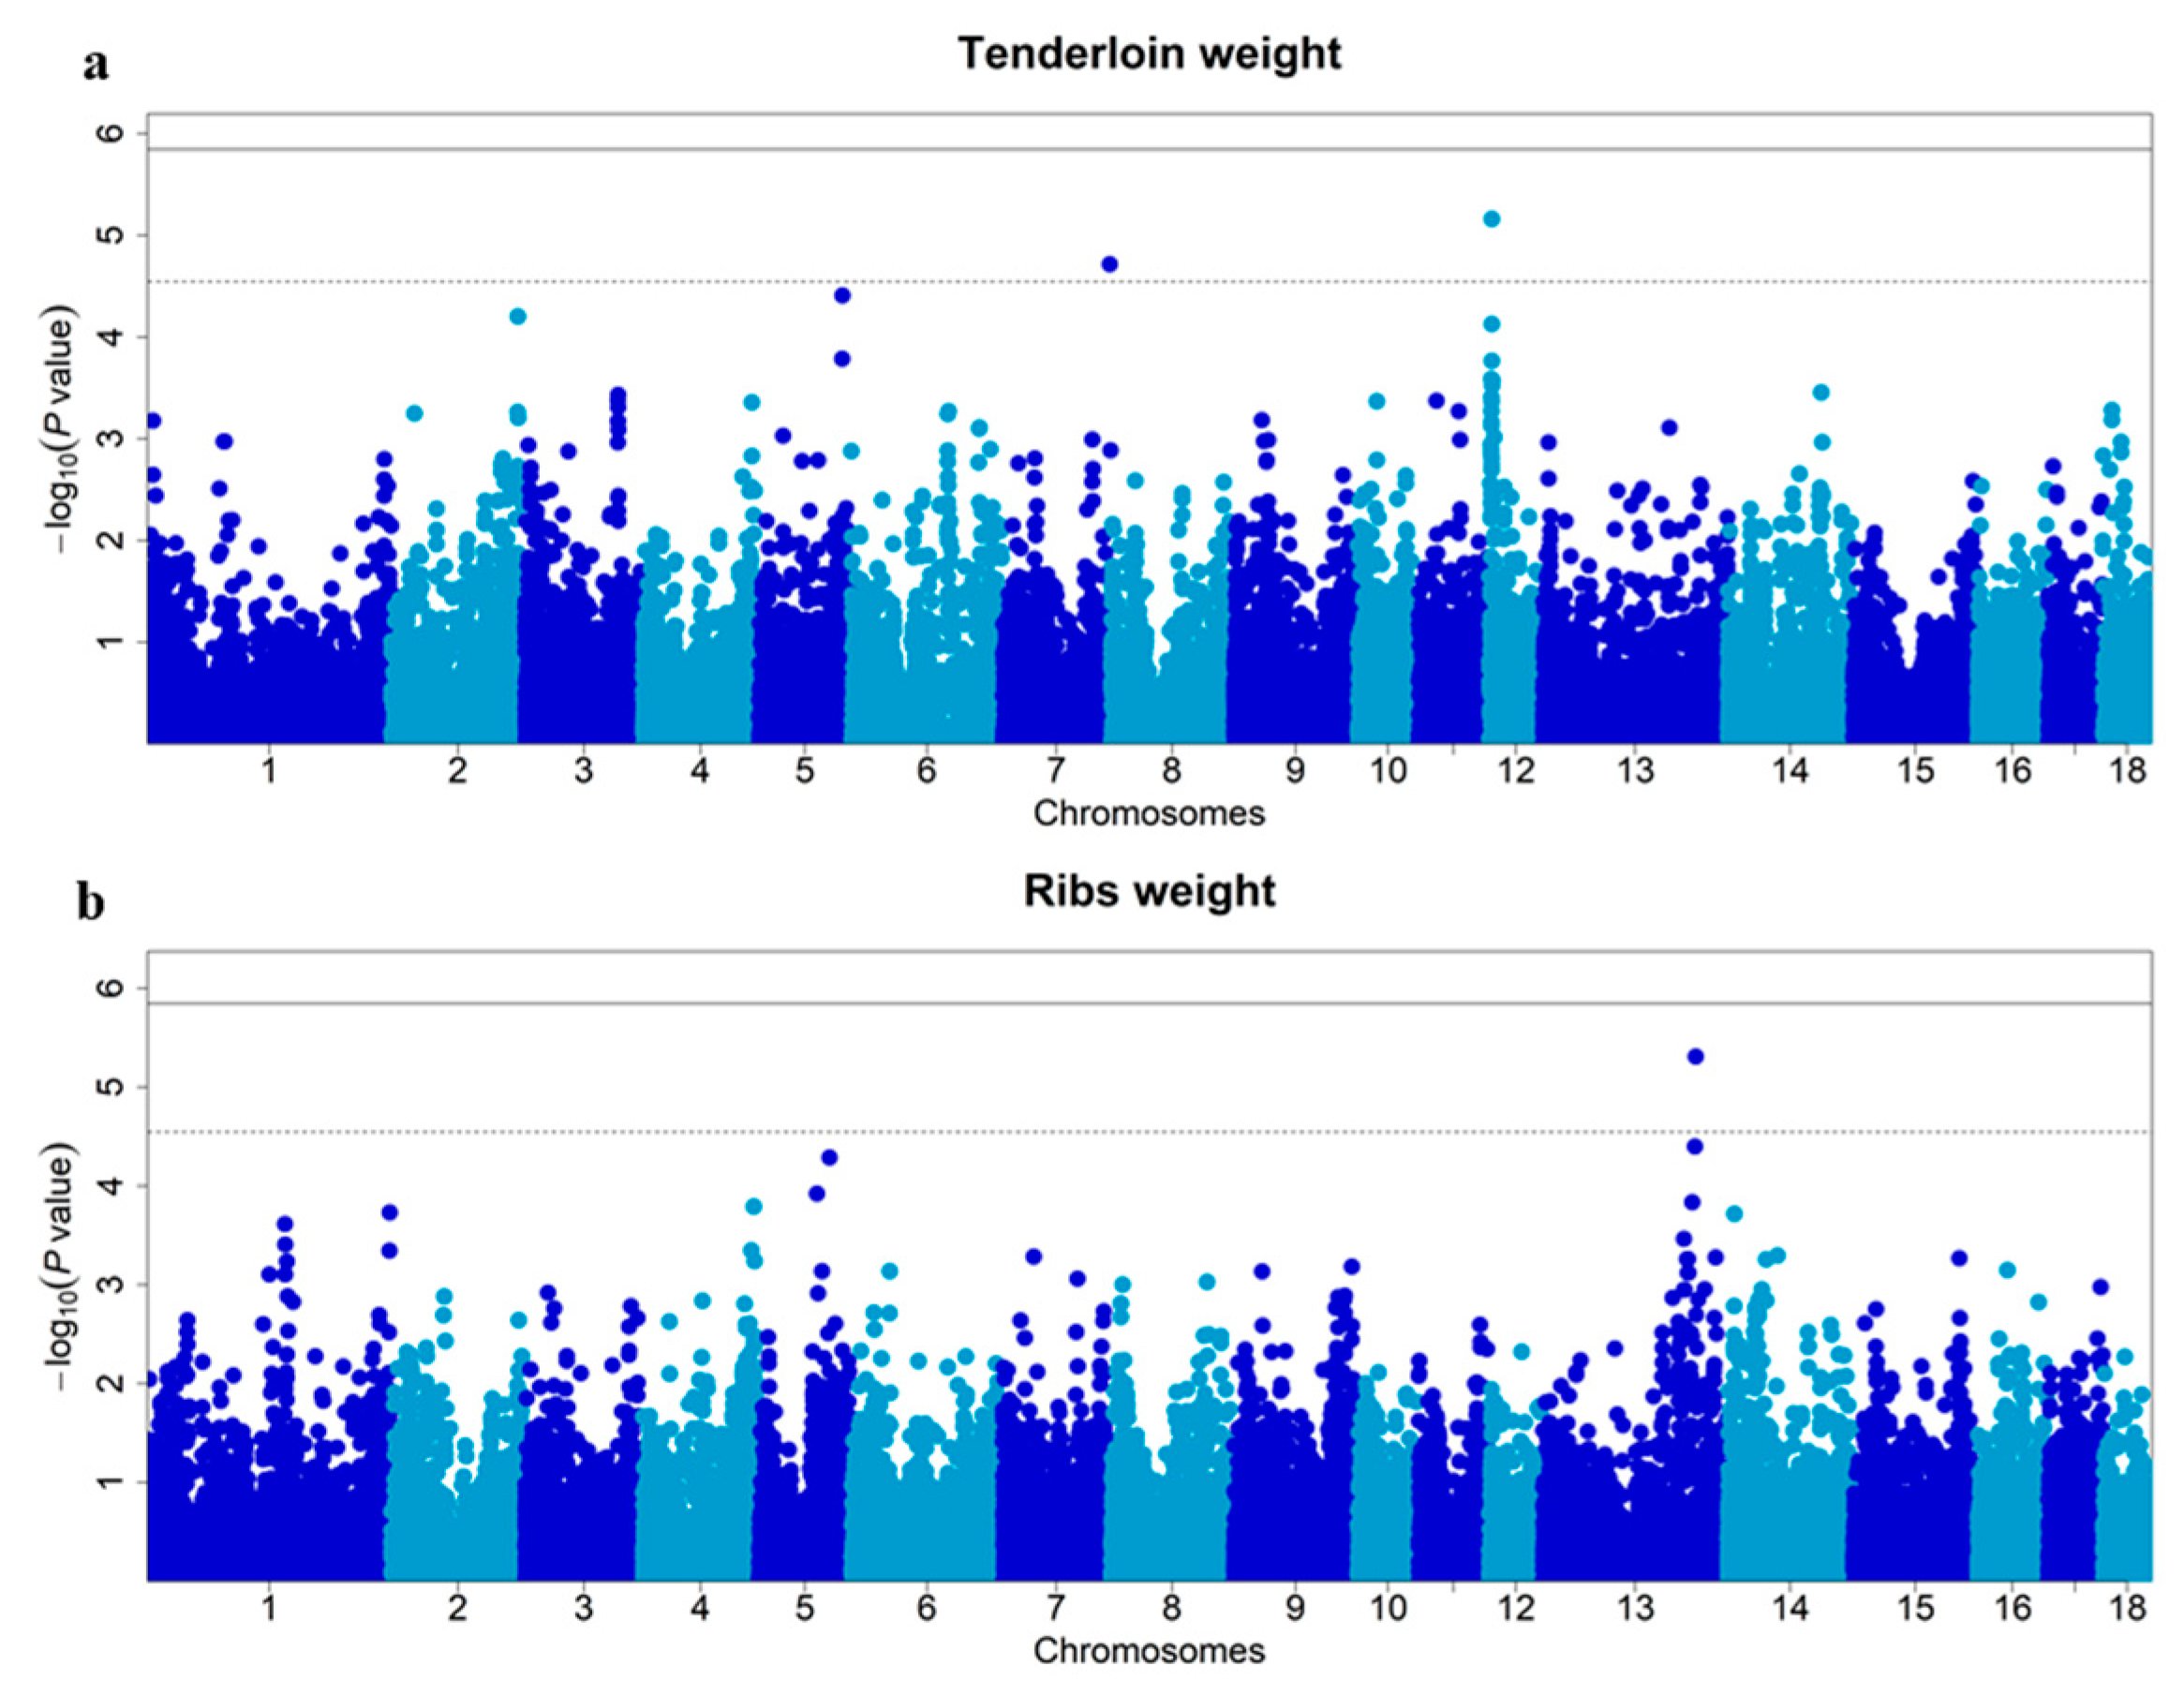
3.2. Single-Locus GWAS for TLNW and RIBW

Population stratification is a significant factor contributing to the unreliability of GWAS data, as it can result in false positive findings. The quantile–quantile (Q–Q) plots serve as a valuable tool for assessing the presence of population stratification [38]. In our study, the genomic inflation factors (λ) for TLNW and RIBW GWAS were determined to be 1.04 and 1.00, respectively (Figure 2). These values suggest that the TLNW and RIBW data obtained from the DLY population in our study are not influenced by population stratification.
The mixed model was used to perform a single marker test, aiming to identify genetic markers associated with the TLNW and RIBW traits. The significant SNPs distinguished by single-locus GWAS for TLNW and RIBW are shown in Figure 3 and Table 2. The chromosome-wide (suggestive) Bonferroni-corrected thresholds of TLNW and RIBW were p < 2.86 × 10⁻⁵ (1/34,978) and p < 2.86 × 10⁻⁵(1/34,976), respectively. Furthermore, two suggestive SNPs (ASGA0085853 and ALGA0112188) were found to be associated with TLNW on Sus scrofa chromosome (SSC) 12 and SSC7, respectively, while one suggestive SNP (Affx-1115046258) was related to RIBW on SSC13. Moreover, Figure 3a shows that the most significant cluster is on SSC12, indicating a strong signal. The most significant SNPs for TLNW and for RIBW were ASGA0085853 and Affx-1115046258, respectively. Additionally, on SSC12, ASGA0085853 is positioned at 3.28 Mb with a minor allele frequency (MAF) of 0.306, yielding a −log10 (p-value) of 5.16. On SSC13, Affx-115046258 is located at 172.45 Mb with a MAF of 0.268 and a −log10 (p-value) of 5.31. The most significant SNPs (ASGA0085853 and Affx-1115046258) for the above characterized haplotype block an explained 4.88% and 5.19% of the phenotypic variance for TLNW and RIBW, respectively. Among these, carriers of the A allele (AA and AG) of ASGA0085853 had significantly greater loin weight than those with the GG genotype, with highly significant phenotypic differences observed among the three genotypes (Figure 4a). However, for Affx-1115046258, there were no significant differences in phenotype among the three genotypes (Figure S2).

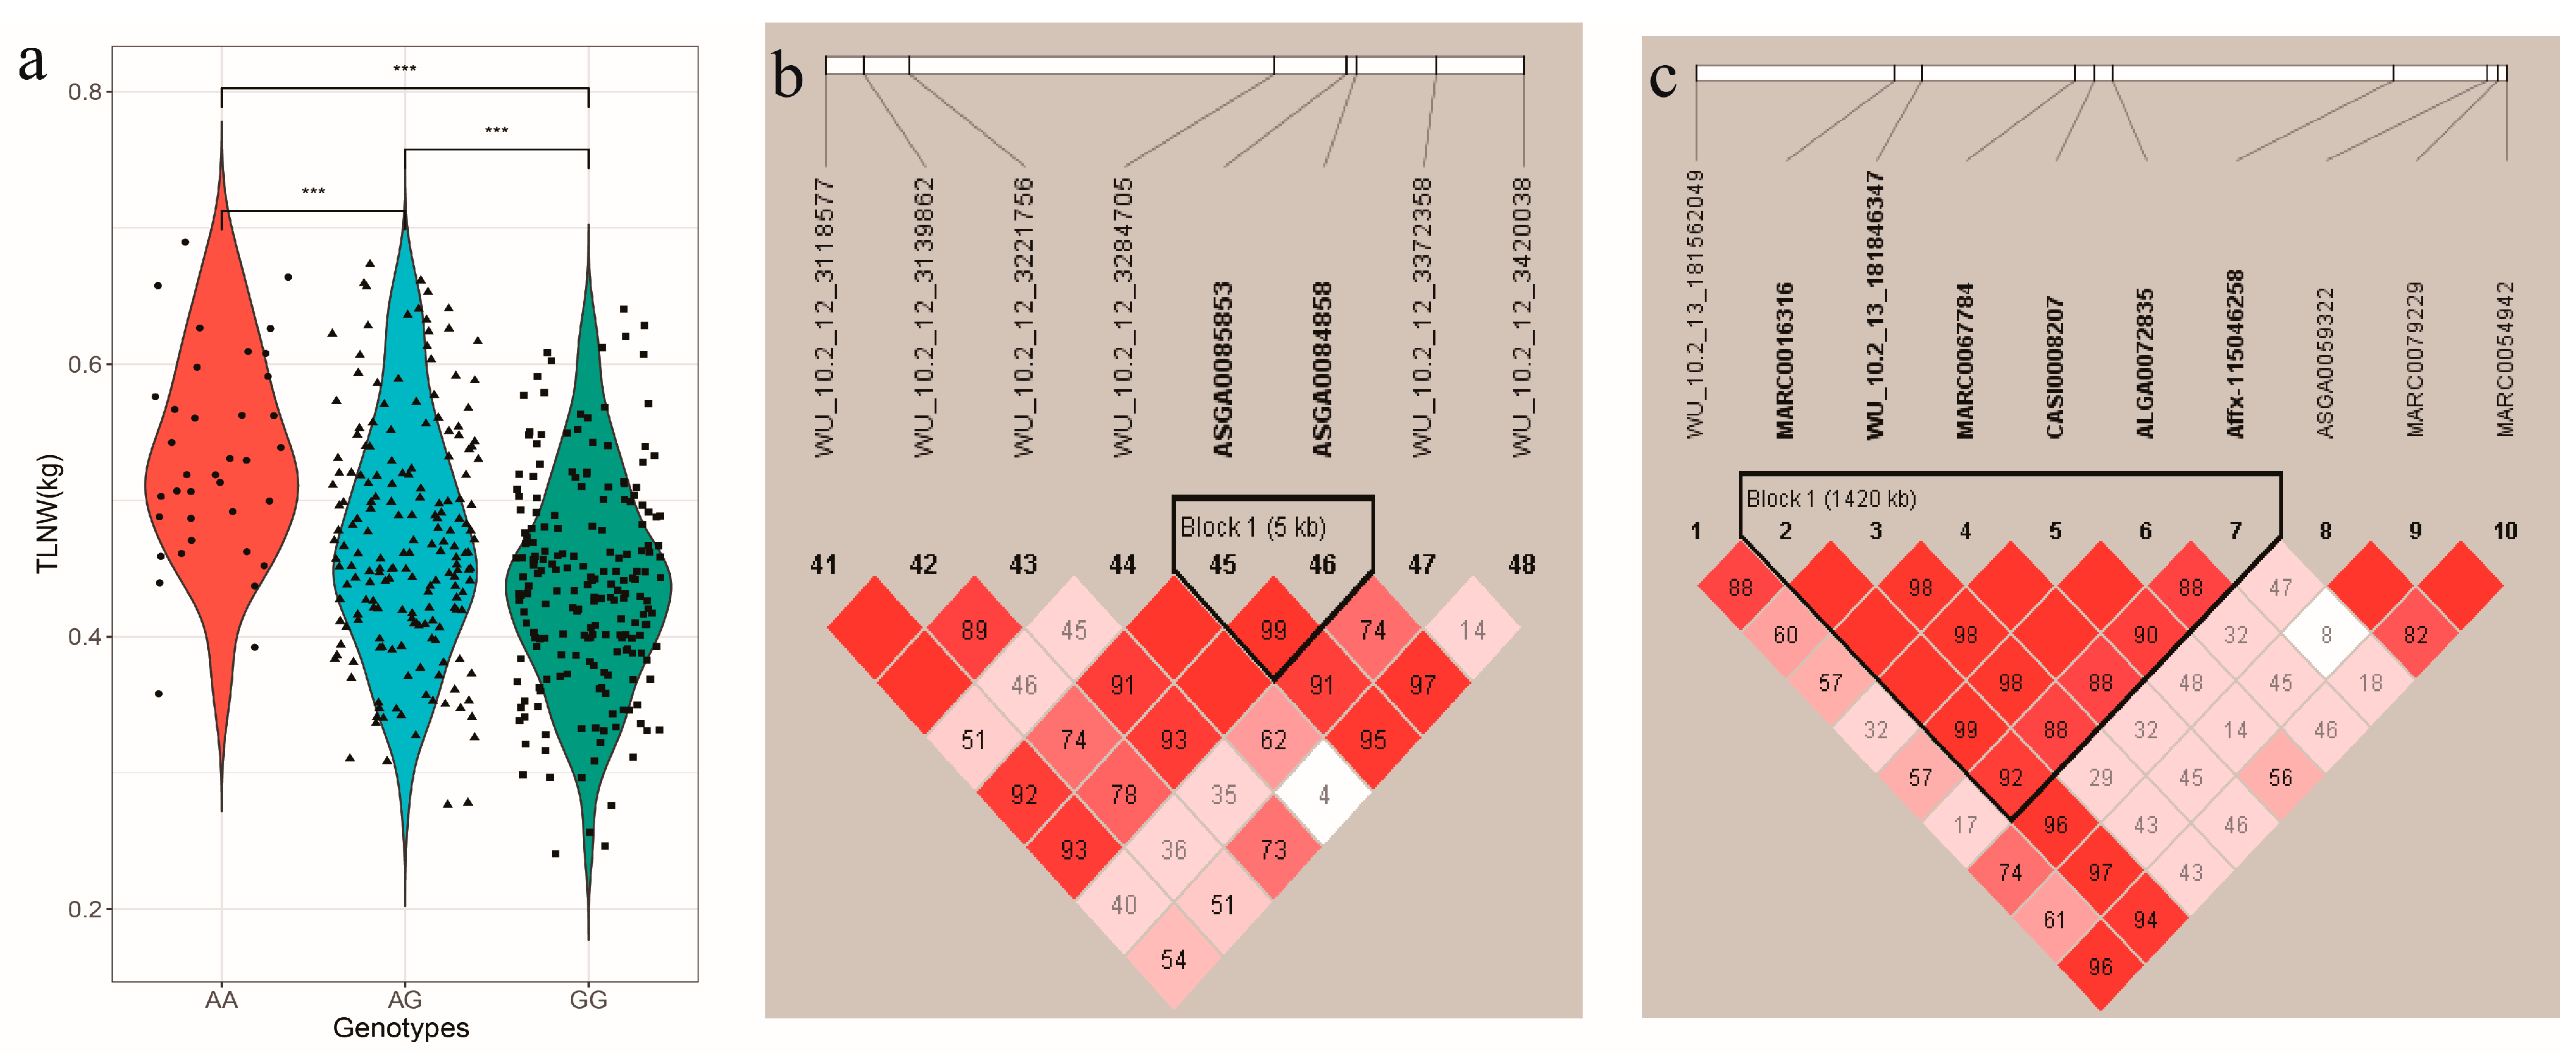
3.3. Effects of the QTL for TLNW and RIBW

Haploview v4.2 [33] can visualize the linkage disequilibrium (LD) and/or linkage between significant SNPs on the same chromosome, forming block and linkage value. The QTL regions recognized by Haploview v4.2 are shown in Figure 4. The leading SNPs (ASGA0085853, Affx-115046258) were mapped to two QTL regions spanning 5 kb and 1.42 Mb, respectively. For TLNW, one QTL region was identified on SSC12, which was composed of only two SNPs located between 3,284,259 and 3,289,920 bp (Figure 4b). In addition, there is very strong linkage between ASGA0085853 (p-value = 6.88 × 10⁻⁶) and ASGA0084858 (p-value = 7.45 × 10⁻⁵). For RIBW, the QTL region on SSC13 was composed of six SNPs; the most significant, Affx-115046258 (172.45 Mb), was linked closely with the other five SNPs (MARC0016316, WU_10.2_13_181846347, MARC0067784, CASI0008207, ALGA0072835) in the QTL region (Figure 4c). As illustrated in Figure 3b and Figure 4c, CASI0008207 is the second most significant SNP in the GWAS results of the RIBW trait.

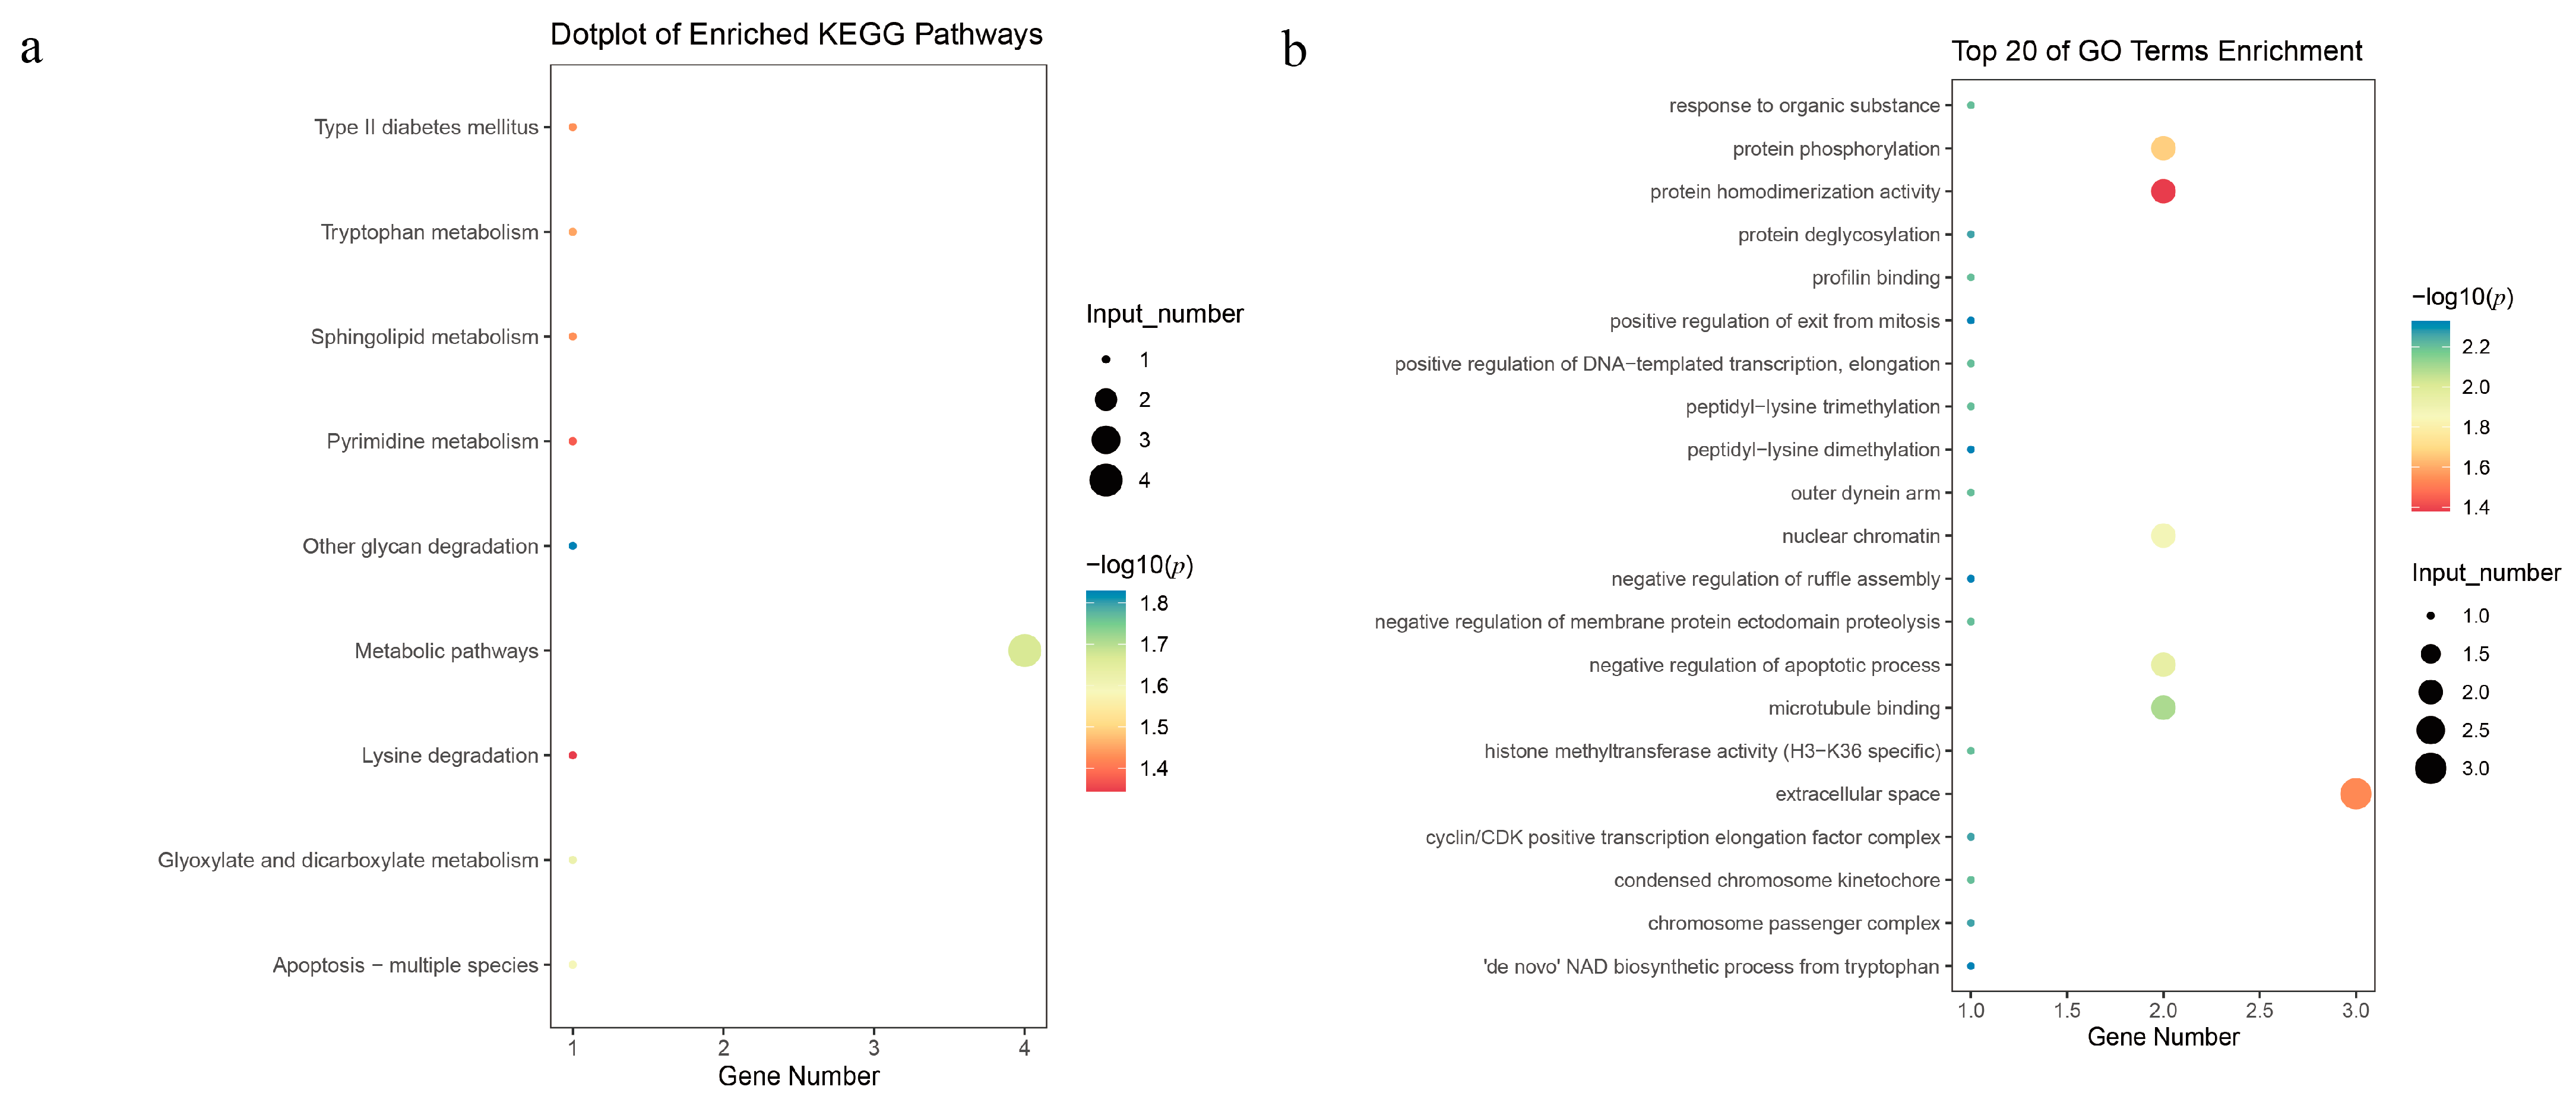
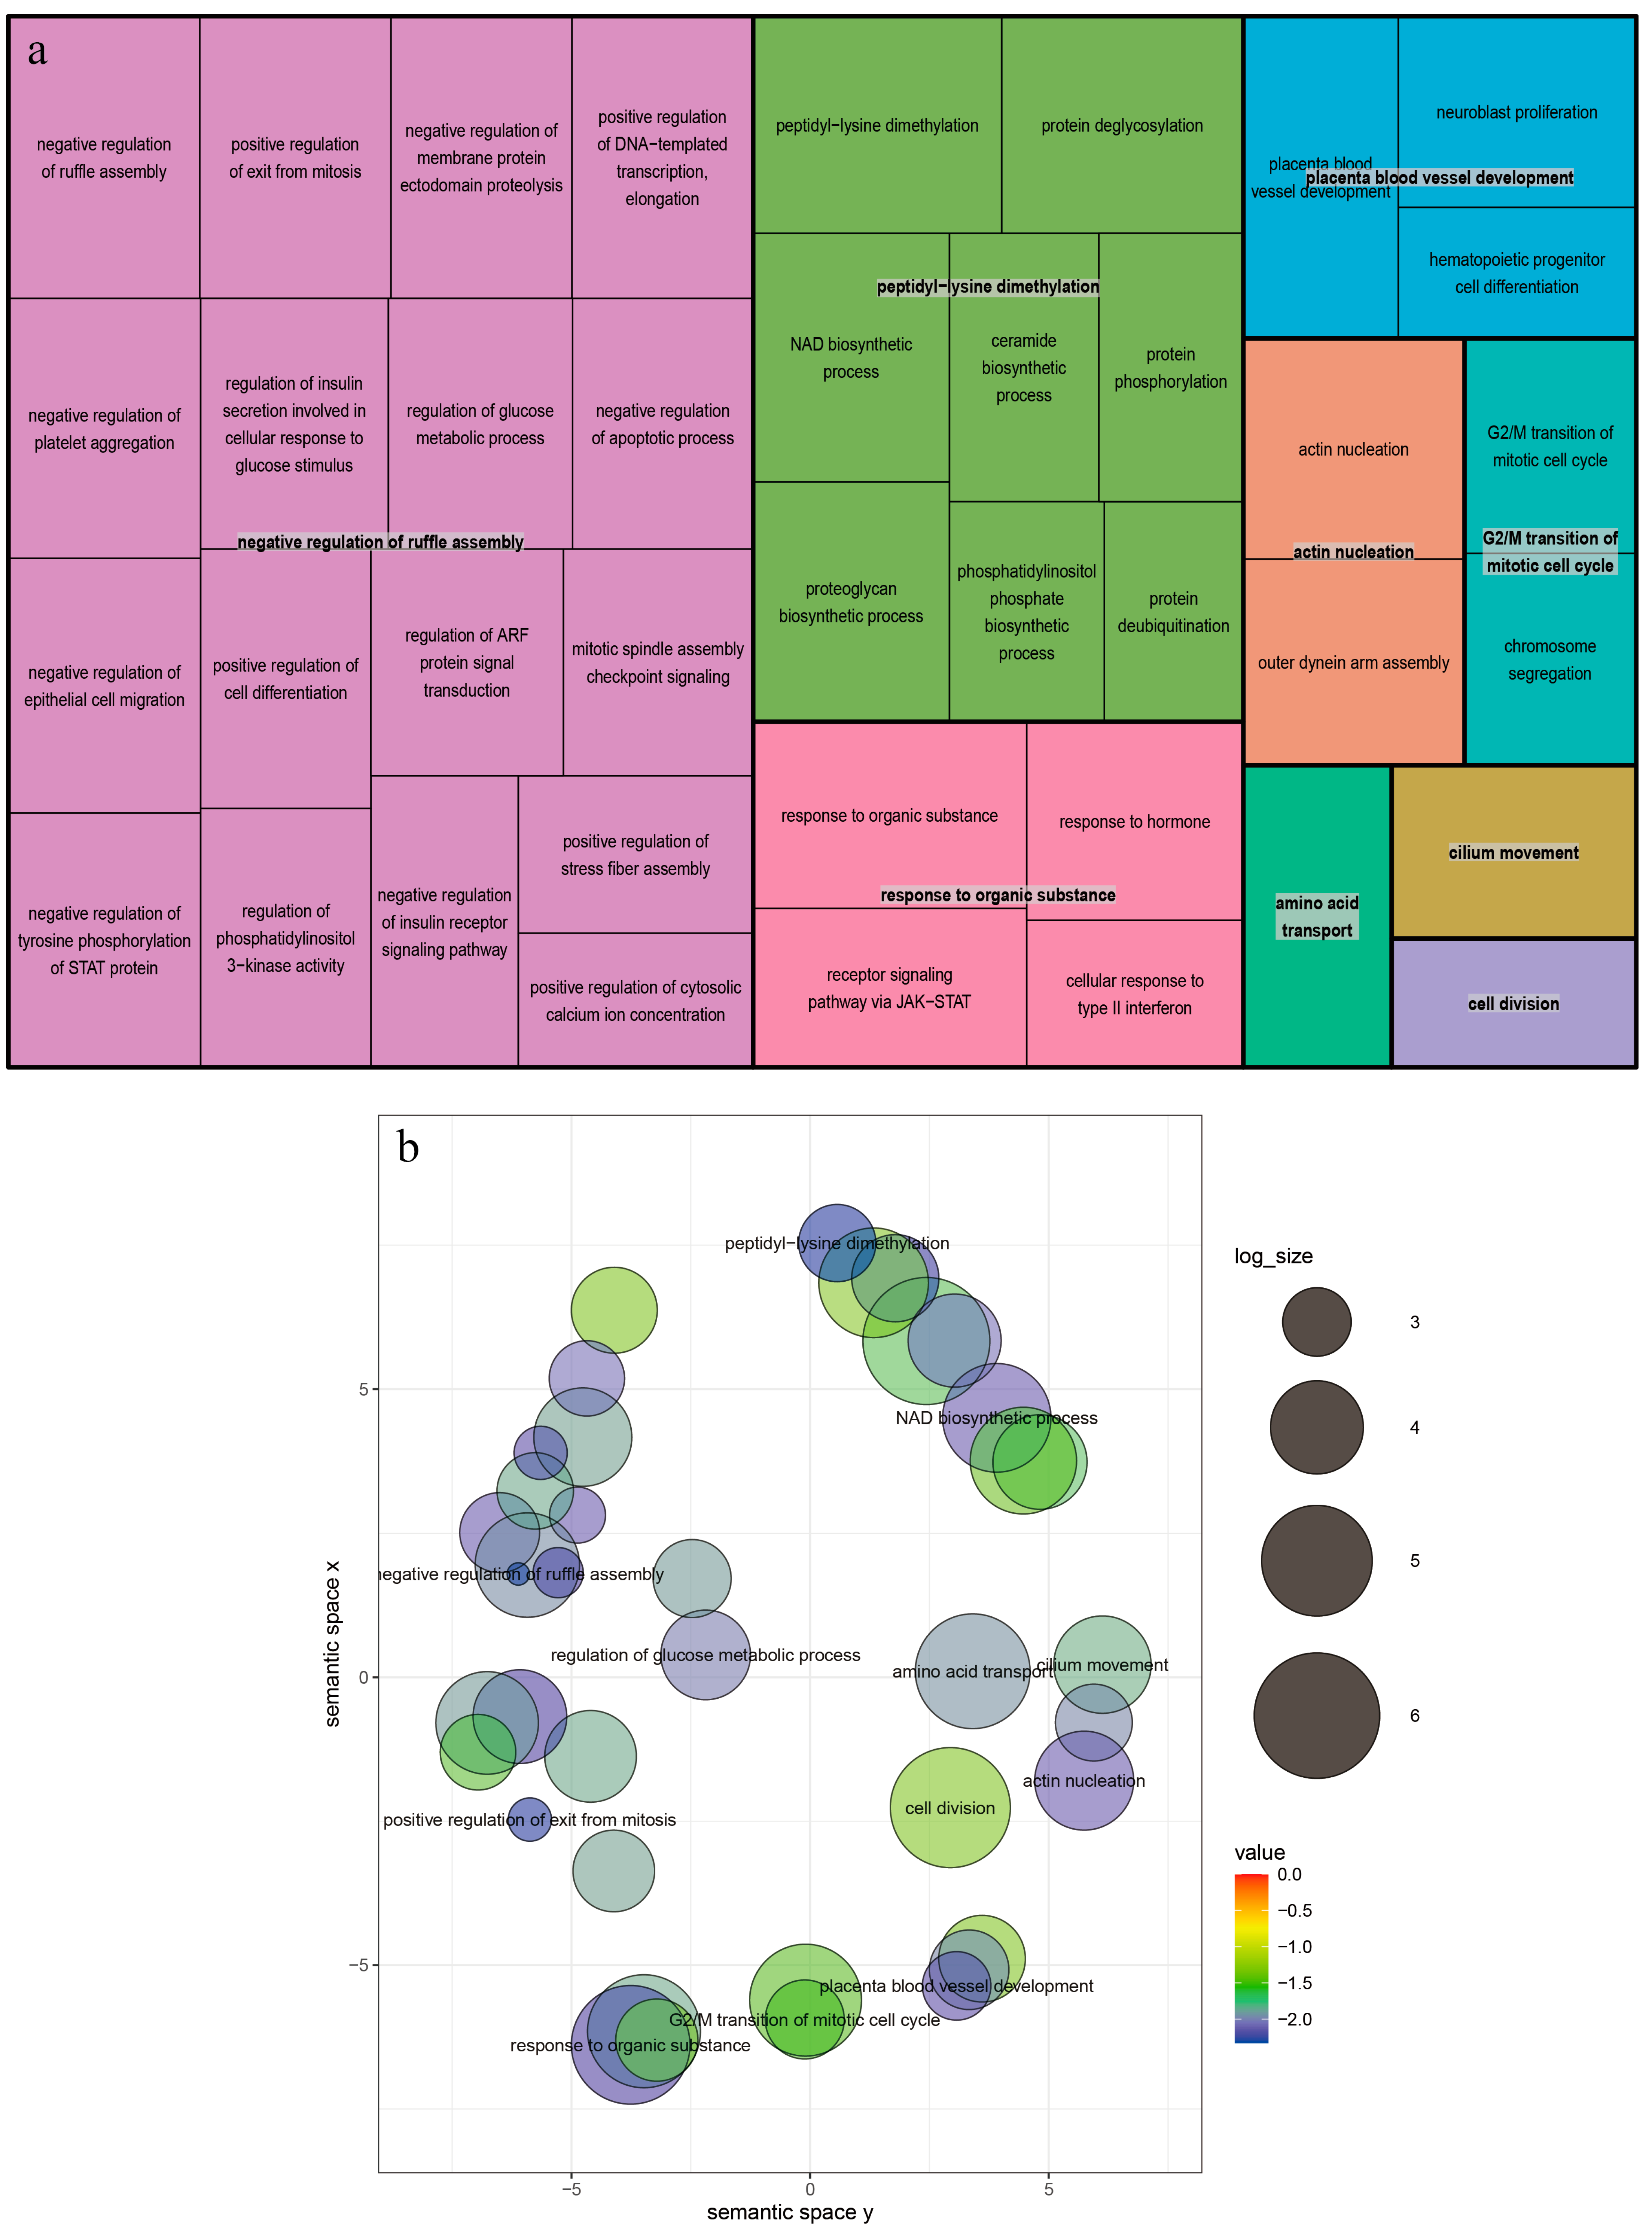
3.4. Candidate Genes Search and Functional Annotation

In the analysis of TLNW, within a range of 500 kb upstream and downstream of the significant SNPs, we annotated 11 and 13 protein-coding genes on SSC7 and SSC12, respectively (Table S3). Notably, both of the significant SNPs were located within the TIMP2 and EML1 genes. Our pathway enrichment analysis revealed several significantly enriched terms from the Kyoto Encyclopedia of Genes and Genomes (KEGG) and the Gene Ontology (GO) knowledgebase that are relevant to TLNW. These enriched terms include cellular division and protein translation (Figure 5a,b, Table S4). After conducting non-redundant GO analysis on all GO terms that exceeded the threshold using the REVIGO website, a total of 39 GO terms were clustered (Figure 6a,b). The most prominent signaling pathway among them is negative regulation of ruffle assembly (GO:1900028). Subsequently, we employed the GeneCards—Mouse Genome Informatics databases—and conducted an extensive literature review to explore the functional roles of the identified genes. As a result, we identified a total of four candidate genes with potential relevance to TLNW. These genes, namely YY1, EML1, CANT1, and TIMP2, exhibit promising associations with TLNW based on their known functions and previous research findings. Furthermore, we identified the SMN1 gene as a strong candidate gene for the RIBW trait. The SMN1 gene is homologous to the ENSSSCG00000029127 gene and is located downstream of the leading SNP by approximately 150.8 kb.

4. Discussion

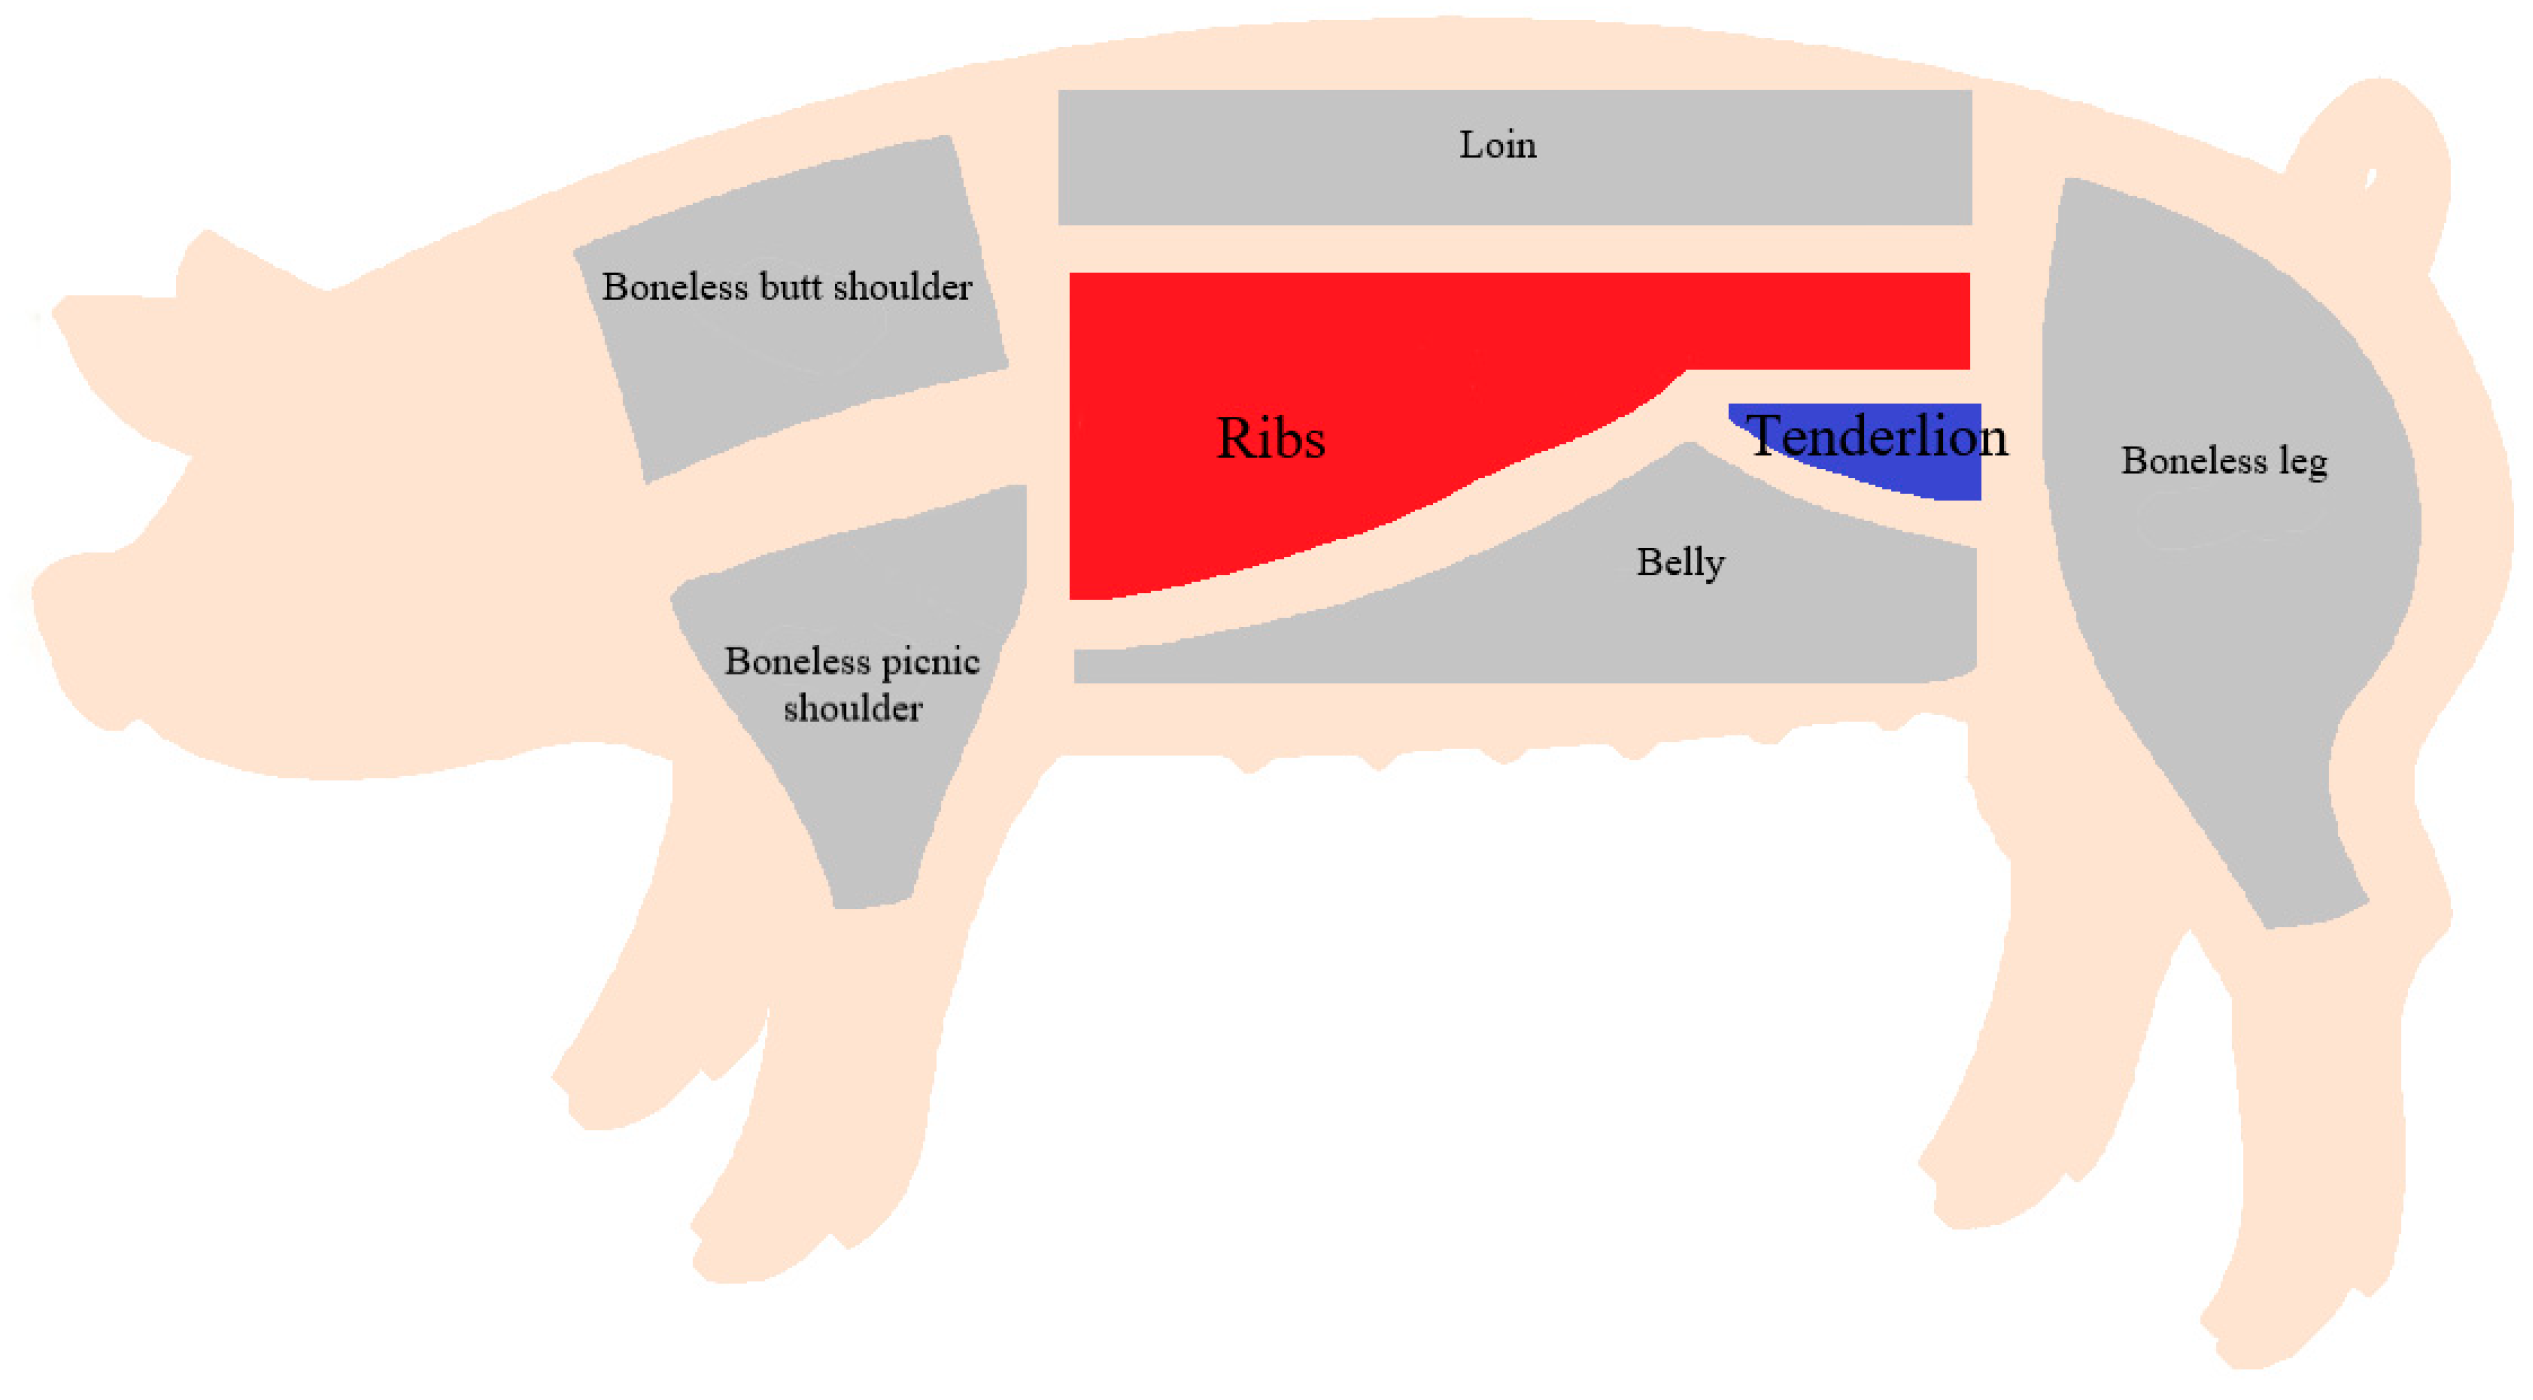
4.1. Fine Segmentation and Sale of Pig Carcasses

According to the 2021 edition of the OECD-FAO Agricultural Outlook, the global meat supply is projected to expand, reaching 374 million tons by 2030 (https://www.oecd-ilibrary.org/agriculture-and-food/oecd-fao-agriculturaloutlook_19991142, accessed on 1 August 2022). While the demand for pork is gradually rising worldwide, many nations have preferences for specific varieties of meat from pig carcasses [39]. For example, Germans consume fresh shoulder pork more frequently than any other portion [40], while Denmark is known for its high frequency consumption of liver [40]. In South Korea, fresh pork belly is an extremely popular meat, accounting for 59% of the per capita consumption of approximately 100 g of meat per day [41]. Additionally, TLN and RIB are highly favored by Chinese people due to their excellent meat quality, despite being relatively expensive compared to other parts [42]. Slaughtering and selling pig carcasses through fine segmentation can satisfy different consumers’ preferences for pork, showcase the true value of hogs, and fully explore the subsequent processes of existing animal husbandry production. Pig producers can enhance pig performance and increase economic value by utilizing genetic structure analysis of the TLNW and RIBW traits.

4.2. Genetic Loci and Candidate Genes for the TLNW Trait

The leading SNP (ASGA0085853) was annotated within the first intron of the Metallopeptidase inhibitor 2 (TIMP2) gene on SSC12 through Sus scrofa 11.1 delivered from the Ensembl database. In mice, deficiency of TIMP2 leads to increased cardiac hypertrophy and subsequent heart enlargement [43]. In cows, mRNA expression of TIMP2 is associated with intramuscular fat content and explains 32% of the variation in intramuscular fat [44]. TIMP2 also affects feed conversion efficiency in cattle by regulating cell growth and proliferation networks [45,46]. Based on these findings, TIMP2 may regulate the size of cardiomyocytes by influencing the molecular pathways of cell growth and proliferation, ultimately affecting the development of the TLNW trait. On SSC12, the candidate gene CANT1 is located 79.8 kb upstream of the leading SNP and is associated with abnormal skeletal morphology and body size in mice [47]. Additionally, EML1—found on SSC7, a candidate gene associated with TLNW—is located within ALGA0112188. EML1 is associated with brain overgrowth syndrome [48] and plays a crucial role in proper retinal lamination during cellular proliferation and development [49] in humans. The potential function of EML1 suggested by this study requires further investigation for functional validation. On SSC7, the candidate gene, YY1, has been shown to be involved in cell proliferation and body size in mice [50]. It is suggested that YY1 might regulate tenderloin growth through processes related to the proliferation and development of muscle cells. These results indicate that the TIMP2 and EML1 genes may play an important role in TLNW and should be considered strong candidate genes for this trait.

4.3. Genetic Loci and Candidate Genes for the RIBW Trait

After conducting haplotype block analysis, we identified ENSSSCG00000049210 and ENSSSCG00000050907 as noncoding genes within the QTL on SSC13. However, we discovered a protein-coding gene, ENSSSCG00000029127, located 150.8 kb downstream of the leading SNP (Affx-115046258). Interestingly, ENSSSCG00000029127 exhibits homology to the protein encoded by the SMN1 gene. Our literature search revealed that the SMN1 gene is the determinant gene for spinal muscular atrophy in humans [51], a rare hereditary neuromuscular disease caused by deletion and/or mutation of SMN1 [52]. The SMN1 gene has been demonstrated to be associated with physiological conditions such as abnormal muscle physiology, decreased body weight and size, and abnormal motor neuron morphology [53,54,55]. Additionally, Lorson et al. [56] reported the first cloning and identification of the porcine SMN1 gene, showing significant sequence homology between porcine and human SMN1 in the entire coding region. Schrank et al. [57] demonstrated that the SMN1 gene may be involved in early embryonic death. It is possible that the SMN1 gene may influence the development of the RIBW trait by affecting proximal muscle atrophy caused by the degeneration of spinal motoneurons in pigs. However, the specific molecular mechanism underlying this relationship requires further investigation.

5. Conclusions

In this study, we performed a GWAS to investigate the TLNW trait and RIBW trait in a population of 431 DLY pigs. We identified two suggestive SNPs (ASGA0085853 and ALGA0112188) associated with TLNW, and one SNP (Affx-1115046258) associated with RIBW. Furthermore, we discovered two novel QTL regions on SSC12 (5 kb) and SSC13 (1.42 Mb) that were significantly related to TLNW and RIBW, respectively. Notably, the QTL region on SSC12 represents the first association with the TLNW trait reported to date. During further analysis, we identified three major candidate genes: TIMP2 and EML1 for TLNW, and SMN1 for RIBW. This research provides valuable insights for segmenting carcass molecular breeding strategies.

Supplementary Materials

The following supporting information can be downloaded at: https://www.mdpi.com/article/10.3390/ani13203243/s1, Figure S1: Distribution of SNPs across Chromosomes after quality control for TLNW (a) and RIBW (b); Figure S2: The genotype effect plot of top SNP (Affx-115046258) related to RIBW in 408 DLY pigs (*** p < 0.01, ns p > 0.05); Table S1: Distributions of SNPs after QC and the average SNPs on each chromosome of Tenderloin weight traits; Table S2: Distributions of SNPs after QC and the average SNPs on each chromosome of Ribs weight traits; Table S3: The distribution of genes within a 1 Mb range around significantly associated SNPs for the TLNW trait; Table S4: This file provides the enrichment of protein-coding genes in KEGG pathway and GO terms.

Author Contributions

Conceptualization, F.Z., J.Q., J.Y., and Z.W.; methodology, D.R. and J.Y.; software, Y.Q.; validation, R.D. and L.L.; formal analysis, C.X. and L.L.; investigation, Y.Y. and C.X.; resources, E.Z. and C.X.; data curation, G.C.; writing—original draft preparation, F.Z., J.Q., D.R., Y.Q., R.D., J.Y., Z.Z. and L.L.; writing—review and editing, J.Y., J.Q., E.Z., Y.Y., Z.Z., D.R., L.L., G.C., Y.Q. and R.D.; visualization, Z.Z., G.C., E.Z. and C.X.; supervision, L.L. and Z.Z.; project administration, Z.W. and G.C.; funding acquisition, Z.W. All authors have read and agreed to the published version of the manuscript.

Funding

This research was supported by the Key Technologies R&D Program of Guangdong Province project (2022B0202090002) and the Project of Swine Innovation Team in the Guangdong Modern Agricultural Research System (2022KJ126).

Institutional Review Board Statement

All animals used in this study were treated in accordance with the guidelines for the use of laboratory animals set forth by the Ministry of Agriculture of China, with the approval of South China Agricultural University (Guangzhou, China), No. 2018F089 (10 August 2018).

Informed Consent Statement

Not applicable.

Data Availability Statement

The SNP genotyping data containing variant information for the DLY pigs are not publicly available because the genotyped animals belong to commercial breeding companies, but they can be obtained from the corresponding author under reasonable requirements.

Conflicts of Interest

The authors declare no conflict of interest. Zhenfang Wu and Gengyuan Cai were employed by the company Guangdong Zhongxin Breeding Technology Co., Ltd. The funders had no role in the design of the study; in the collection, analyses, or interpretation of data; in the writing of the manuscript; or in the decision to publish the results.

References

  1. Font, I.F.M.; Guerrero, L. Consumer preference, behavior and perception about meat and meat products: An overview. Meat Sci. 2014, 98, 361–371. [Google Scholar] [CrossRef] [PubMed]
  2. da Silva, J.P.; de Alencar Nääs, I.; Abe, J.M.; da Silva Cordeiro, A.F. Classification of piglet (Sus Scrofa) stress conditions using vocalization pattern and applying paraconsistent logic Eτ. Comput. Electron. Agric. 2019, 166, 105020. [Google Scholar] [CrossRef]
  3. Lim, M.S.M.; Grohn, Y.T. Comparison of China’s and the European Union’s Approaches to Antimicrobial Stewardship in the Pork Industry. Foodborne Pathog. Dis. 2021, 18, 567–573. [Google Scholar] [CrossRef] [PubMed]
  4. Qiu, Y.; Zhuang, Z.; Meng, F.; Ruan, D.; Xu, C.; Ma, F.; Peng, L.; Ding, R.; Cai, G.; Yang, M.; et al. Identification of candidate genes associated with carcass component weights in commercial crossbred pigs through a combined GWAS approach. J. Anim. Sci. 2023, 101, skad121. [Google Scholar] [CrossRef]
  5. Zhang, L.C.; Yue, J.W.; Pu, L.; Wang, L.G.; Liu, X.; Liang, J.; Yan, H.; Zhao, K.B.; Li, N.; Shi, H.B.; et al. Genome-wide study refines the quantitative trait locus for number of ribs in a Large White × Minzhu intercross pig population and reveals a new candidate gene. Mol. Genet. Genom. 2016, 291, 1885–1890. [Google Scholar] [CrossRef]
  6. Jiang, N.; Liu, C.; Lan, T.; Zhang, Q.; Cao, Y.; Pu, G.; Niu, P.; Zhang, Z.; Li, Q.; Zhou, J.; et al. Polymorphism of VRTN Gene g.20311_20312ins291 Was Associated with the Number of Ribs, Carcass Diagonal Length and Cannon Bone Circumference in Suhuai Pigs. Animals 2020, 10, 484. [Google Scholar] [CrossRef]
  7. Kim, G.W.; Kim, H.Y. Physicochemical Quality Properties of Loin and Tenderloin Ham from Sows. Food Sci. Anim. Resour. 2020, 40, 474–483. [Google Scholar] [CrossRef]
  8. Ortiz, A.; Díaz-Caro, C.; Tejerina, D.; Escribano, M.; Crespo, E.; Gaspar, P. Consumption of fresh Iberian pork: Two-stage cluster for the identification of segments of consumers according to their habits and lifestyles. Meat Sci. 2021, 173, 108373. [Google Scholar] [CrossRef]
  9. Mikawa, S.; Hayashi, T.; Nii, M.; Shimanuki, S.; Morozumi, T.; Awata, T. Two quantitative trait loci on Sus scrofa chromosomes 1 and 7 affecting the number of vertebrae. J. Anim. Sci. 2005, 83, 2247–2254. [Google Scholar] [CrossRef]
  10. Uemoto, Y.; Nagamine, Y.; Kobayashi, E.; Sato, S.; Tayama, T.; Suda, Y.; Shibata, T.; Suzuki, K. Quantitative trait loci analysis on Sus scrofa chromosome 7 for meat production, meat quality, and carcass traits within a Duroc purebred population. J. Anim. Sci. 2008, 86, 2833–2839. [Google Scholar] [CrossRef]
  11. Ren, D.R.; Ren, J.; Ruan, G.F.; Guo, Y.M.; Wu, L.H.; Yang, G.C.; Zhou, L.H.; Li, L.; Zhang, Z.Y.; Huang, L.S. Mapping and fine mapping of quantitative trait loci for the number of vertebrae in a White Duroc × Chinese Erhualian intercross resource population. Anim. Genet. 2012, 43, 545–551. [Google Scholar] [CrossRef] [PubMed]
  12. Mikawa, S.; Sato, S.; Nii, M.; Morozumi, T.; Yoshioka, G.; Imaeda, N.; Yamaguchi, T.; Hayashi, T.; Awata, T. Identification of a second gene associated with variation in vertebral number in domestic pigs. BMC Genet. 2011, 12, 5. [Google Scholar] [CrossRef] [PubMed]
  13. Xie, L.; Qin, J.; Yao, T.; Tang, X.; Cui, D.; Chen, L.; Rao, L.; Xiao, S.; Zhang, Z.; Huang, L. Genetic dissection of 26 meat cut, meat quality and carcass traits in four pig populations. Genet. Sel. Evol. 2023, 55, 43. [Google Scholar] [CrossRef] [PubMed]
  14. Van Laere, A.S.; Nguyen, M.; Braunschweig, M.; Nezer, C.; Collette, C.; Moreau, L.; Archibald, A.L.; Haley, C.S.; Buys, N.; Tally, M.; et al. A regulatory mutation in IGF2 causes a major QTL effect on muscle growth in the pig. Nature 2003, 425, 832–836. [Google Scholar] [CrossRef]
  15. Oczkowicz, M.; Tyra, M.; Walinowicz, K.; Rózycki, M.; Rejduch, B. Known mutation (A3072G) in intron 3 of the IGF2 gene is associated with growth and carcass composition in Polish pig breeds. J. Appl. Genet. 2009, 50, 257–259. [Google Scholar] [CrossRef]
  16. Burgos, C.; Galve, A.; Moreno, C.; Altarriba, J.; Reina, R.; García, C.; López-Buesa, P. The effects of two alleles of IGF2 on fat content in pig carcasses and pork. Meat Sci. 2012, 90, 309–313. [Google Scholar] [CrossRef]
  17. Daetwyler, H.D.; Capitan, A.; Pausch, H.; Stothard, P.; van Binsbergen, R.; Brøndum, R.F.; Liao, X.; Djari, A.; Rodriguez, S.C.; Grohs, C.; et al. Whole-genome sequencing of 234 bulls facilitates mapping of monogenic and complex traits in cattle. Nat. Genet. 2014, 46, 858–865. [Google Scholar] [CrossRef]
  18. Xu, S.S.; Gao, L.; Xie, X.L.; Ren, Y.L.; Shen, Z.Q.; Wang, F.; Shen, M.; Eyϸórsdóttir, E.; Hallsson, J.H.; Kiseleva, T.; et al. Genome-Wide Association Analyses Highlight the Potential for Different Genetic Mechanisms for Litter Size Among Sheep Breeds. Front. Genet. 2018, 9, 118. [Google Scholar] [CrossRef]
  19. Zhang, H.; Shen, L.Y.; Xu, Z.C.; Kramer, L.M.; Yu, J.Q.; Zhang, X.Y.; Na, W.; Yang, L.L.; Cao, Z.P.; Luan, P.; et al. Haplotype-based genome-wide association studies for carcass and growth traits in chicken. Poult. Sci. 2020, 99, 2349–2361. [Google Scholar] [CrossRef]
  20. Fachal, L.; Dunning, A.M. From candidate gene studies to GWAS and post-GWAS analyses in breast cancer. Curr. Opin. Genet. Dev. 2015, 30, 32–41. [Google Scholar] [CrossRef]
  21. Benafif, S.; Kote-Jarai, Z.; Eeles, R.A. A Review of Prostate Cancer Genome-Wide Association Studies (GWAS). Cancer Epidemiol. Biomark. Prev. 2018, 27, 845–857. [Google Scholar] [CrossRef] [PubMed]
  22. Edwards, D.B.; Ernst, C.W.; Raney, N.E.; Doumit, M.E.; Hoge, M.D.; Bates, R.O. Quantitative trait locus mapping in an F2 Duroc x Pietrain resource population: II. Carcass and meat quality traits. J. Anim. Sci. 2008, 86, 254–266. [Google Scholar] [CrossRef] [PubMed]
  23. Ovilo, C.; Fernández, A.; Noguera, J.L.; Barragán, C.; Letón, R.; Rodríguez, C.; Mercadé, A.; Alves, E.; Folch, J.M.; Varona, L.; et al. Fine mapping of porcine chromosome 6 QTL and LEPR effects on body composition in multiple generations of an Iberian by Landrace intercross. Genet. Res. 2005, 85, 57–67. [Google Scholar] [CrossRef] [PubMed]
  24. Grover, A.; Sharma, P.C. Development and use of molecular markers: Past and present. Crit. Rev. Biotechnol. 2016, 36, 290–302. [Google Scholar] [CrossRef] [PubMed]
  25. Ding, R.; Yang, M.; Wang, X.; Quan, J.; Zhuang, Z.; Zhou, S.; Li, S.; Xu, Z.; Zheng, E.; Cai, G.; et al. Genetic Architecture of Feeding Behavior and Feed Efficiency in a Duroc Pig Population. Front. Genet. 2018, 9, 220. [Google Scholar] [CrossRef]
  26. Zhou, S.; Ding, R.; Meng, F.; Wang, X.; Zhuang, Z.; Quan, J.; Geng, Q.; Wu, J.; Zheng, E.; Wu, Z.; et al. A meta-analysis of genome-wide association studies for average daily gain and lean meat percentage in two Duroc pig populations. BMC Genom. 2021, 22, 12. [Google Scholar] [CrossRef]
  27. Zhuang, Z.; Ding, R.; Peng, L.; Wu, J.; Ye, Y.; Zhou, S.; Wang, X.; Quan, J.; Zheng, E.; Cai, G.; et al. Genome-wide association analyses identify known and novel loci for teat number in Duroc pigs using single-locus and multi-locus models. BMC Genom. 2020, 21, 344. [Google Scholar] [CrossRef]
  28. Ruan, D.; Zhuang, Z.; Ding, R.; Qiu, Y.; Zhou, S.; Wu, J.; Xu, C.; Hong, L.; Huang, S.; Zheng, E.; et al. Weighted Single-Step GWAS Identified Candidate Genes Associated with Growth Traits in a Duroc Pig Population. Genes. 2021, 12, 117. [Google Scholar] [CrossRef]
  29. Chang, C.C.; Chow, C.C.; Tellier, L.C.; Vattikuti, S.; Purcell, S.M.; Lee, J.J. Second-generation PLINK: Rising to the challenge of larger and richer datasets. Gigascience 2015, 4, 7. [Google Scholar] [CrossRef]
  30. Yang, J.; Lee, S.H.; Goddard, M.E.; Visscher, P.M. GCTA: A tool for genome-wide complex trait analysis. Am. J. Hum. Genet. 2011, 88, 76–82. [Google Scholar] [CrossRef]
  31. Zhou, X.; Stephens, M. Genome-wide efficient mixed-model analysis for association studies. Nat. Genet. 2012, 44, 821–824. [Google Scholar] [CrossRef] [PubMed]
  32. Price, A.L.; Patterson, N.J.; Plenge, R.M.; Weinblatt, M.E.; Shadick, N.A.; Reich, D. Principal components analysis corrects for stratification in genome-wide association studies. Nat. Genet. 2006, 38, 904–909. [Google Scholar] [CrossRef] [PubMed]
  33. Barrett, J.C.; Fry, B.; Maller, J.; Daly, M.J. Haploview: Analysis and visualization of LD and haplotype maps. Bioinformatics 2005, 21, 263–265. [Google Scholar] [CrossRef]
  34. Smedley, D.; Haider, S.; Ballester, B.; Holland, R.; London, D.; Thorisson, G.; Kasprzyk, A. BioMart—Biological queries made easy. BMC Genom. 2009, 10, 22. [Google Scholar] [CrossRef] [PubMed]
  35. Bu, D.; Luo, H.; Huo, P.; Wang, Z.; Zhang, S.; He, Z.; Wu, Y.; Zhao, L.; Liu, J.; Guo, J.; et al. KOBAS-i: Intelligent prioritization and exploratory visualization of biological functions for gene enrichment analysis. Nucleic Acids Res. 2021, 49, W317–W325. [Google Scholar] [CrossRef]
  36. Supek, F.; Bošnjak, M.; Škunca, N.; Šmuc, T. REVIGO summarizes and visualizes long lists of gene ontology terms. PLoS ONE 2011, 6, e21800. [Google Scholar] [CrossRef]
  37. Zhang, Z.; Kryvokhyzha, D.; Orsucci, M.; Glémin, S.; Milesi, P.; Lascoux, M. How broad is the selfing syndrome? Insights from convergent evolution of gene expression across species and tissues in the Capsella genus. New Phytol. 2022, 236, 2344–2357. [Google Scholar] [CrossRef] [PubMed]
  38. Quan, J.; Ding, R.; Wang, X.; Yang, M.; Yang, Y.; Zheng, E.; Gu, T.; Cai, G.; Wu, Z.; Liu, D.; et al. Genome-wide association study reveals genetic loci and candidate genes for average daily gain in Duroc pigs. Asian-Australas. J. Anim. Sci. 2018, 31, 480–488. [Google Scholar] [CrossRef]
  39. Verbeke, W.; Pérez-Cueto, F.J.; Grunert, K.G. To eat or not to eat pork, how frequently and how varied? Insights from the quantitative Q-PorkChains consumer survey in four European countries. Meat Sci. 2011, 88, 619–626. [Google Scholar] [CrossRef]
  40. Grunert, K.; Wognum, N.; Trienekens, J.; Wever, M.; Olsen, N.V.; Scholderer, J. Consumer demand and quality assurance: Segmentation basis and implications for chain governance in the pork sector. J. Chain. Netw. Sci. 2011, 11, 89–97. [Google Scholar] [CrossRef]
  41. Choe, J.-H.; Yang, H.-S.; Lee, S.-H.; Go, G.-W. Characteristics of pork belly consumption in South Korea and their health implication. J. Anim. Sci. Technol. 2015, 57, 22. [Google Scholar] [CrossRef] [PubMed]
  42. Juárez, M.; Clemente, I.; Polvillo, O.; Molina, A. Meat quality of tenderloin from Iberian pigs as affected by breed strain and crossbreeding. Meat Sci. 2009, 81, 573–579. [Google Scholar] [CrossRef] [PubMed]
  43. Fan, D.; Takawale, A.; Basu, R.; Patel, V.; Lee, J.; Kandalam, V.; Wang, X.; Oudit, G.Y.; Kassiri, Z. Differential role of TIMP2 and TIMP3 in cardiac hypertrophy, fibrosis, and diastolic dysfunction. Cardiovasc. Res. 2014, 103, 268–280. [Google Scholar] [CrossRef] [PubMed]
  44. Fontes, M.; Costa, T.C.; Lopes, M.M.; Souza, R.O.; Carneiro, L.S.; Paulino, P.V.R.; Chizzotti, M.L.; Silva, F.F.; Serão, N.V.L.; Duarte, M.S. Intramuscular collagen characteristics and expression of related genes in skeletal muscle of cull cows receiving a high-energy diet. Meat Sci. 2021, 177, 108495. [Google Scholar] [CrossRef]
  45. Chen, Y.; Gondro, C.; Quinn, K.; Herd, R.M.; Parnell, P.F.; Vanselow, B. Global gene expression profiling reveals genes expressed differentially in cattle with high and low residual feed intake. Anim. Genet. 2011, 42, 475–490. [Google Scholar] [CrossRef]
  46. Taye, M.; Kim, J.; Yoon, S.H.; Lee, W.; Hanotte, O.; Dessie, T.; Kemp, S.; Mwai, O.A.; Caetano-Anolles, K.; Cho, S.; et al. Whole genome scan reveals the genetic signature of African Ankole cattle breed and potential for higher quality beef. BMC Genet. 2017, 18, 11. [Google Scholar] [CrossRef]
  47. Paganini, C.; Monti, L.; Costantini, R.; Besio, R.; Lecci, S.; Biggiogera, M.; Tian, K.; Schwartz, J.M.; Huber, C.; Cormier-Daire, V.; et al. Calcium activated nucleotidase 1 (CANT1) is critical for glycosaminoglycan biosynthesis in cartilage and endochondral ossification. Matrix Biol. 2019, 81, 70–90. [Google Scholar] [CrossRef]
  48. Oegema, R.; McGillivray, G.; Leventer, R.; Le Moing, A.G.; Bahi-Buisson, N.; Barnicoat, A.; Mandelstam, S.; Francis, D.; Francis, F.; Mancini, G.M.S.; et al. EML1-associated brain overgrowth syndrome with ribbon-like heterotopia. Am. J. Med. Genet. C Semin. Med. Genet. 2019, 181, 627–637. [Google Scholar] [CrossRef]
  49. Collin, G.B.; Won, J.; Krebs, M.P.; Hicks, W.J.; Charette, J.R.; Naggert, J.K.; Nishina, P.M. Disruption in murine Eml1 perturbs retinal lamination during early development. Sci. Rep. 2020, 10, 5647. [Google Scholar] [CrossRef]
  50. Affar, E.B.; Gay, F.; Shi, Y.; Liu, H.; Huarte, M.; Wu, S.; Collins, T.; Li, E.; Shi, Y. Essential dosage-dependent functions of the transcription factor yin yang 1 in late embryonic development and cell cycle progression. Mol. Cell. Biol. 2006, 26, 3565–3581. [Google Scholar] [CrossRef]
  51. Wirth, B. An update of the mutation spectrum of the survival motor neuron gene (SMN1) in autosomal recessive spinal muscular atrophy (SMA). Hum. Mutat. 2000, 15, 228–237. [Google Scholar] [CrossRef]
  52. Poirier, A.; Weetall, M.; Heinig, K.; Bucheli, F.; Schoenlein, K.; Alsenz, J.; Bassett, S.; Ullah, M.; Senn, C.; Ratni, H.; et al. Risdiplam distributes and increases SMN protein in both the central nervous system and peripheral organs. Pharmacol. Res. Perspect. 2018, 6, e00447. [Google Scholar] [CrossRef] [PubMed]
  53. Gogliotti, R.G.; Quinlan, K.A.; Barlow, C.B.; Heier, C.R.; Heckman, C.J.; Didonato, C.J. Motor neuron rescue in spinal muscular atrophy mice demonstrates that sensory-motor defects are a consequence, not a cause, of motor neuron dysfunction. J. Neurosci. 2012, 32, 3818–3829. [Google Scholar] [CrossRef]
  54. Bowerman, M.; Anderson, C.L.; Beauvais, A.; Boyl, P.P.; Witke, W.; Kothary, R. SMN, profilin IIa and plastin 3: A link between the deregulation of actin dynamics and SMA pathogenesis. Mol. Cell Neurosci. 2009, 42, 66–74. [Google Scholar] [CrossRef] [PubMed]
  55. Park, G.H.; Maeno-Hikichi, Y.; Awano, T.; Landmesser, L.T.; Monani, U.R. Reduced survival of motor neuron (SMN) protein in motor neuronal progenitors functions cell autonomously to cause spinal muscular atrophy in model mice expressing the human centromeric (SMN2) gene. J. Neurosci. 2010, 30, 12005–12019. [Google Scholar] [CrossRef]
  56. Lorson, M.A.; Spate, L.D.; Prather, R.S.; Lorson, C.L. Identification and characterization of the porcine (Sus scrofa) survival motor neuron (SMN1) gene: An animal model for therapeutic studies. Dev. Dyn. 2008, 237, 2268–2278. [Google Scholar] [CrossRef]
  57. Schrank, B.; Götz, R.; Gunnersen, J.M.; Ure, J.M.; Toyka, K.V.; Smith, A.G.; Sendtner, M. Inactivation of the survival motor neuron gene, a candidate gene for human spinal muscular atrophy, leads to massive cell death in early mouse embryos. Proc. Natl. Acad. Sci. USA 1997, 94, 9920–9925. [Google Scholar] [CrossRef]
Figure 1. Schematic diagram of carcass cutting after pig slaughter.
Animals 13 03243 g001
Figure 2. The Q–Q plots of TLNW (a) and RIBW (b) for DLY population. The Q–Q plot shows the observed versus expected −log10 p value. The red line represents observed values equal to expected values.
Animals 13 03243 g002
Figure 3. Manhattan plots of GWAS for TLNW (a) and RIBW (b) in the DLY population. In the Manhattan plots, the solid and dashed lines represent the 5% genome-wide and chromosome-wide (suggestive) Bonferroni-corrected thresholds, respectively. The x-axis represents the chromosomes, and the y-axis represents the −log10 (p value).
Animals 13 03243 g003
Figure 4. The plot (a) indicates the genotype effect plot of top SNP (ASGA0085853) related to TLNW in 431 DLY pigs (*** p < 0.01). Haplotype block for (b) TLNW and (c) RIBW in DLY pigs, respectively. Haplotype blocks are marked with triangles. Values in boxes are the linkage disequilibrium (r2) between the SNP pairs. The haplotype blocks are colored in accordance with the standard Haploview color scheme: LOD > 2 and D′ = 1, red; LOD < 2 and D′ < 1, white (LOD is the log of the likelihood odds ratio, a measure of confidence in the value of D′).
Animals 13 03243 g004
Figure 5. Significant KEGG pathways and GO terms associated with TLNW (p < 0.05). The plot (a) represents the KEGG pathway of the biological process for protein-coding genes within a 1 Mb region centered on the significant SNPs. The plot (b) shows the top 20 terms of the GO enrichment.
Animals 13 03243 g005
Figure 6. Non-redundancy GO terms of TLNW. The plot (a) shows the “TreeMap” view of REVIGO. Each rectangle represents a representative cluster. These representatives are combined into “superclusters,” representing loosely related terms and visualized using different colors. The size of the rectangles is adjusted to reflect the p value and frequency of the GO term in the Mus musculus GOA database. The plot (b) displays the scatter plot of representative clusters. The log size indicates the frequency of the GO term in the Mus musculus GOA database, with larger sizes indicating more common terms. The numerical value represents the −log10 (p value), with colors ranging from red to blue indicating increasing significance.
Animals 13 03243 g006
Table 1. Summary statistics of tenderloin weight and ribs weight.
TraitN 3Mean (±SD)/kg 4Min/kg 5Max/kg 6C.V./% 7h2 (±SE) 8
TLNW 14310.46 ± 0.080.240.6917.400.42 ± 0.11
RIBW 24084.51 ± 0.562.876.1712.420.22 ± 0.09
1 Tenderloin weight (TLNW). 2 Ribs weight (RIB). 3 Number of animals (N). 4 Standard deviations (SD). 5 Minimum (Min). 6 Maximum (Max). 7 Coefficient of variation (C.V.). 8 Heritability (standard error) value (h2 (±SE)).
Table 2. Significant SNPs for TLNW and RIBW in DLY Pigs.
TraitSNPSSC 1Position (bp)EPV 2MAFp-ValueDistance 3Nearest Gene
TLNWASGA0085853
ALGA0112188
12
7
3,284,259
120,821,692
4.88%
3.90%
0.306
0.325
6.88 × 10⁻⁶
1.92 × 10⁻⁵
within
within
TIMP2
EML1
RIBWAffx-11504625813172,454,1215.19%0.2684.88 × 10−6150.8 kbENSSSCG00000029127
1 Sus scrofa chromosome (SSC). 2 Explained phenotypic variance (EPV). 3 The SNP located upstream/downstream of the nearest gene (Distance).
Disclaimer/Publisher’s Note: The statements, opinions and data contained in all publications are solely those of the individual author(s) and contributor(s) and not of MDPI and/or the editor(s). MDPI and/or the editor(s) disclaim responsibility for any injury to people or property resulting from any ideas, methods, instructions or products referred to in the content.

