Simple Summary
Particulate matter (PM) is the most important hazardous pollutant and seriously affects the respiratory tract health of both animals and humans. Nowadays, the development of intensive animal husbandry not only increases PM pollution in the atmospheric environment but also harms the health of animals and ranch workers. The concentration of PM in poultry houses is higher than that for other animals, such as in pig and cow houses. However, there are few studies on the effect of fine particulate matter on pulmonary microbiota in poultry. This study aims to explore the effect of fine particulate matter on pulmonary microbiota in broilers.
Abstract
(1) Fine particulate matter (PM2.5) seriously affects the respiratory tract health of both animals and humans. Growing evidence indicates that the pulmonary microbiota is involved in the development of respiratory tract health; however, there is still much that is unknown about the specific changes of pulmonary microbiota caused by PM2.5 in broilers. (2) In this experiment, a total of 48 broilers were randomly divided into a control group and PM-exposure group. The experiment lasted for 21 days. Microbiota, inflammation biomarkers, and histological markers in the lungs were determined. (3) On the last day of the experiment, PM significantly disrupted the structure of lung tissue and induced chronic pulmonary inflammation by increasing IL-6, TNFα, and IFNγ expression and decreasing IL-10 expression. PM exposure significantly altered the α and β diversity of pulmonary microbiota. At the phylum level, PM exposure significantly decreased the Firmicutes abundance and increased the abundance of Actinobacteria and Proteobacteria. At the genus level, PM exposure significantly increased the abundance of Rhodococcus, Achromobacter, Pseudomonas, and Ochrobactrum. We also observed positive associations of the above altered genera with lung TNFα and IFNγ expression. (4) The results suggest that PM perturbs the pulmonary microbiota and induces chronic inflammation, and the pulmonary microbiota possibly contributes to the development of lung inflammation.
1. Introduction
Air pollution is well known to be a potential danger to public health throughout the world [1]. Among pollutants, haze poses potential health issues for most cities in China [2]. Fine particulate matter (PM2.5) is the main component of haze [3,4]. Nowadays, the development of intensive animal husbandry not only increases PM2.5 pollution in the atmospheric environment but also harms the health of animals and ranch workers [5]. According to the specific statistics of poultry houses equipped with mechanical ventilation systems, the PM2.5 concentrations ranged from 40 to 2530 µg/m3 in general [6,7,8,9] and were 67~1480 µg/m3 in the spring, 67~1370 µg/m3 in the summer, 1230~1920 µg/m3 in the fall, and 40~2530 µg/m3 in the winter [6,8,10]. Moreover, the concentration of PM in poultry houses is higher than that for other animals, such as in pig and cow houses [5]. Unlike the lungs of mammals, broiler lungs contain multiple bronchi and airbags. The unique structure keeps the lungs of broilers in a semi-open state, making them more susceptible to PM damage [11]. And chronic high PM concentrations exposure can make broilers susceptible to respiratory diseases, including chronic bronchitis, asthma, and dust poisoning syndrome [12,13], which result in a significant annual loss from respiratory disease within the poultry industry [14]. Thus, it is necessary to investigate lung injury under PM exposure in broilers.
Although the mechanism of lung injury caused by PM2.5 has not been fully elucidated, increasing evidence suggests that the imbalance of pulmonary microbiota is closely related to lung injury. The pulmonary microbiota is dynamically balanced in terms of health [15], changed in the condition of disease [16], related to the changes in alveolar immunity [15], and also is a predictive indicator of lung diseases [17,18]. Some studies have revealed characteristic changes in pulmonary microbiota associated with disease phenotype, such as in pulmonary fibrosis [19], COPD [20], asthma [21], pneumonia [22], and other chronic respiratory diseases [23]. Previously published studies have documented that PM2.5 caused pulmonary microbiota alterations in humans [24], mice [25,26], and rats [27]. Thus, considering the unique lung structure of poultry, the specific changes of the pulmonary microbiota induced by PM2.5 are also essential to elucidate in broilers.
To the authors’ knowledge, there are few studies on the effect of fine particulate matter on the pulmonary microbiota in poultry. Therefore, the present study aimed to investigate the effects of PM2.5 on the pulmonary microbiota. Further, we also evaluated the effects of PM2.5 on the pulmonary histological changes and inflammation biomarkers in broilers. This study will investigate the potential relationship between the pulmonary microbiota and pulmonary injury in broilers under PM2.5 exposure. The present study fills the gap in the research concerning the impact of fine particulate matter on the pulmonary microbiota in poultry.
2. Materials and Methods
2.1. PM Preparation
PM (NIST, 1649b) with a particle size distribution ranging from 0.2 µm to 2.5 µm was obtained from the National Institute of Standards and Technology. The standard PM2.5 was composed of 20 polycyclic aromatic hydrocarbons (PAHs), 8 nitro-substituted PAHs (nitro-PAHs), 13 polychlorinated biphenyl (PCB) congeners, 4 chlorinated pesticides, and 3 inorganic constituents. All of the constituents for which certified, reference, and information values are provided in SRM 1649b are naturally present in the particulate material.
2.2. Animal Experiment
In the study, the animal experiment was ratified by the Ethics and Clinical Research Committee of Henan academy of agricultural sciences institute of animal sciences. One-day-old Arbor Acres (AA) broilers obtained from the commercial broiler farm were reared in cages within the animal husbandry laboratory. The housing conditions were set at 23 ± 1 °C for temperature, 60 ± 5% for relative humidity, and 24 h for light per day. A complete diet was given to the broilers from day 1 to day 42, meeting the NRC (1994) standards.
Before the exposure experiment, 14-day-old AA broilers were adapted to the chambers for 1 week. Then, 21-day-old AA broilers with average body weight were randomly divided into 2 groups, including the control group (CON) and PM2.5-exposure group (PM), with 24 birds in each group. The broilers in the control group were exposed to normal saline, while the broilers in the PM2.5 group were exposed to PM2.5 with a concentration of 1000 µg/m3. Broilers were kept in cages in a room during non-exposure time and transferred to two identical independent exposure boxes during exposure time to ensure consistency in other environmental factors such as temperature, humidity, etc., except for PM2.5 concentration. The experiment period lasted 21 d.
2.3. PM Exposure Treatment
In the present study, we used the method of a whole-body exposure to simulate the real exposure status. And the exposure dose calculation formula actually used in this study is as follows: Amount of single inhalation of PM2.5 = PM2.5 mass concentration × working efficiency of physicochemical device × respiratory capacity of broiler × exposure time. Based on the PM2.5 concentration and exposure time set up in this experiment, the final dose of PM2.5 to each chicken is as follows: 600 mL × 1000 µg/m3 × 120 ÷ 106 × 100/6.67 = 1079 µg. In this equation, 600 means the ventilation volume per minute of each chicken, 6.67 means the settling rate of PM2.5 in the lung of broilers, and 120 means 2 h exposure time. Finally, we took the corresponding dose of PM2.5 for the PM group according to the number of broilers.
Before daily exposure, the broilers were transferred into the two same independent exposure boxes, which were 1.2 m in length, 1.0 m in width, and 0.5 m in height. Broilers were exposed to PM or normal saline for a 21-day exposure of 2 h/d from 8:00 to 10:00 using the NSF-6A model liquid aerosol generation system (Shanghai TOW, Shanghai, China), which can continuously and stably generate aerosol aerosols for solutions and maintain the particle size distribution generally at 0 within 2–3 µm. The specific exposure method was as follows: one end of the hose was connected to the exposure box, and the other end of the hose was connected to the liquid aerosol generation system. The liquid aerosol generation system firstly introduced the PM or normal saline through the injection port, and then, the PM or normal saline were sprayed into the exposure box through the hose under the pump power action. The atomizer of NSF-6A controlled the injection speed of PM or normal saline. PM concentrations were also monitored in real time by the IDG100-TSP monitor, which was placed in the exposure box. After exposure every day, the broilers were returned to the cages. The exposure boxes were washed with clean water and also irradiated with an ultraviolet lamp for about 4 h.
2.4. Sample Collection
At day 42 of the experiment, six broilers with average body weight were euthanized by cervical dislocation; lung tissues were taken for further molecular mechanism analysis.
One small part in the middle of left lung tissues was placed in 4% paraformaldehyde. Another small part in the middle of right lung tissues was taken and quickly frozen with liquid nitrogen and then kept at −80 °C for further analysis of the molecular mechanisms by using real-time quantitative (RT-PCR) method. The microbiome in lung tissues was analyzed by using 16 S rRNA sequencing.
2.5. Real-Time RT-PCR
Lung inflammatory injury markers including IL-1β, IL-6, IL-10, IFN-γ, TNF-α, and mRNA expression were measured by the RT-PCR. The designed primer sequences for each gene are shown in Table 1, which refers to our previous study [28]. The specific method was as follows: about 800 mg of the lung tissues were taken to prepare the RNA samples using the tissue RNA rapid extraction kit (Imagene). The concentration of extracted RNA was measured by the Nanodeop lite (Thermo Scientific, Waltham, MA, USA). Then, cDNA was synthesized using All-in-One First-Strand Synthesis Master Mix (Kemix, Bejing, China). RT-qPCR was used 2 × SYBR Green qPCR Premix (Kemix, Bejing, China) with a two-step real-time PCR system on the LightCycler 96 system (Roche, Basel, Switzerland). The relative gene expression was calculated by the 2−ΔΔCT method.

Table 1.
The primers used in the study.
2.6. Analysis of Histological
Hematoxylin and eosin (H&E) was used to analyze the changes of lung structure. The specific procedures were as follows: a small part of the lung tissue was taken and fixed in 4% paraformaldehyde. First, the lung tissue was dehydrated with gradient alcohol, then made transparent and soaked in wax, embedded, sliced, roasted, and dewaxed. Finally, it was stained with hematoxylin eosin staining solution, air-dried, and sealed with neutral gum. Finally, it was examined under microscope.
2.7. S rRNA Sequencing of Pulmonary Microbiota and Bioinformatics Analysis
16 S rRNA sequencing was used to measure the alterations in the pulmonary microbiota, and the specific steps were as follows in Table 2.
Table 2.
The specific steps of the 16 S rRNA sequencing.
2.8. Statistical Analysis
The above data regarding IL-10, IL-1β, IFN-γ, IL-6, and TNFα were analyzed by Student’s t-test using SPASS 26.0 software. Mean ± SE was used to present the data. p < 0.05 was set as “significance”. GraphPad Prism 5.0 was used for plotting the above data.
3. Results
3.1. Pulmonary Injury
Pulmonary injury is mainly evaluated from two aspects: histological changes and markers of inflammatory factors. The histological changes are shown in Figure 1; in the PM group, various sizes of alveoli can be observed, and at the same time, the alveoli disappear significantly, with more alveolar damage (black). There was a large amount of inflammatory infiltration in the parenchymal and epithelial areas, and some vacuoles appeared (red). In addition, PM exposure significantly increased the expression of IL-6, TNFα, and IFNγ (p < 0.05) and significantly decreased the IL-10 expression (p < 0.05) in the lung.
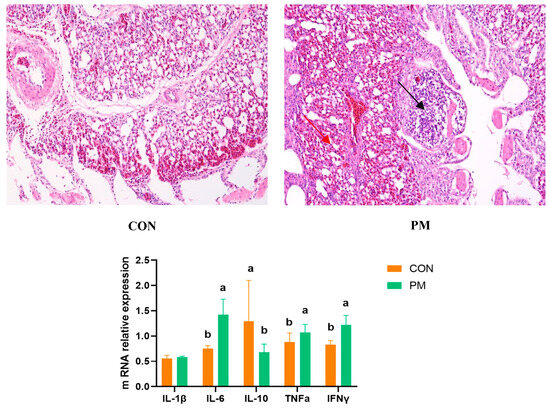
Figure 1.
The effect of PM on the lung histological changes and expression of genes associated with inflammation. a,b: means differ significantly (p < 0.05).
3.2. Rank–Abundance Curve
Rank–abundance is mainly used to evaluate the saturation of a sample. As shown in Figure 2, it can be seen that the curve based on the Shannon index gradually flattens out, which means that the number of sequencing units are large enough, and the number of OTU species does not increase with the increase of sequencing quantity, suggesting that the tested samples already contain the species information of the vast majority of microorganisms.
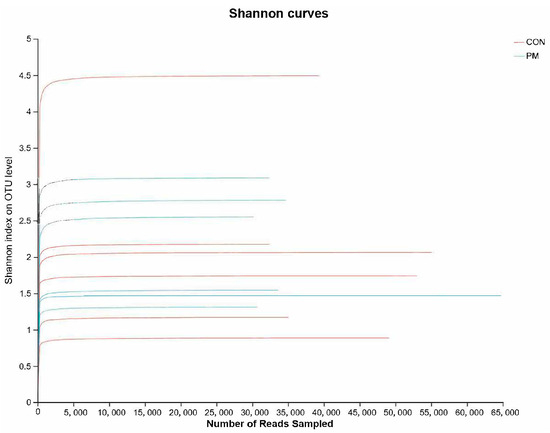
Figure 2.
The effect of PM on the rank–abundance curve based on the Shannon index.
3.3. Alpha Diversity
Alpha diversity can reflect the species richness and diversity of samples, which is usually measured by indicators such as Chao, Ace, Shannon, and Simpson. Among them, the Chao and Ace indexes are used to measure the species richness, that is, the number of species; Shannon and Simpson indexes are used to measure species diversity. As shown in Figure 3, PM exposure significantly increased the Chao index and decreased the Simpson index, indicating that PM induced the increase of species richness and diversity.
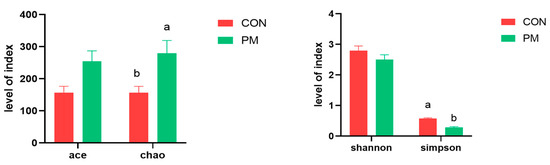
Figure 3.
The effect of PM on the index of alpha diversity. a,b: means differ significantly (p < 0.05).
3.4. Beta Diversity
The beta diversity analysis compares the similarity of each sample in species diversity. In this experiment, samples were analyzed based on principal coordinate analysis (PCoA) and unweighted_unifrac analysis. The PCoA method mainly separates and classifies multiple samples, which can more deeply reflect the differences between species in the samples. The closer the samples are on the coordinate map, the greater the similarity. Based on the PCoA analysis results, it can be seen from the figure that the contribution values of the first and second principal components in principal coordinate analysis are 31.37% and 21.43%, respectively. Further inter-group difference analyses were conducted using the Anosim method for principal coordinate analysis, and the results showed that there is significant difference between CON and PM groups (Figure 4, R = 0.7593, p = 0.023), indicating there is a significant separation of bacterial communities between the control group and the PM group, suggesting that PM treatment has a significant impact on the composition of the pulmonary microbiota.
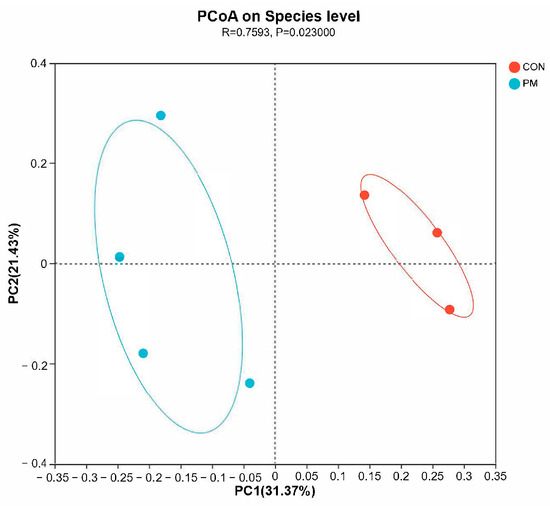
Figure 4.
The effect of PM on the beta diversity.
3.5. Pulmonary Microbiota Composition at the Phylum and Genus Levels
QIIME software (1.9.1) was used to generate the species-richness table and draw a species distribution histogram at both the phylum and genus levels, where the color represents species, and the color block length represents the proportion of species in the relative abundance (Figure 5). At the phylum level, the top phylum are Firmicutes, Actinobacteriota, Proteobacteria, and Bacteroidota. And the relative abundance ratios of phylum level in the CON group are 83.89%, 1.29%, 2.19%, and 8.29%, respectively; and the relative abundance ratios of phylum level in the PM group are 28.04%, 56.23%, 10.12%, and 1.19%, respectively. As shown in Figure 5, Firmicutes abundance in the PM group decreased by 66.57%, while Proteobacteria increased by 78.36% in the PM group.
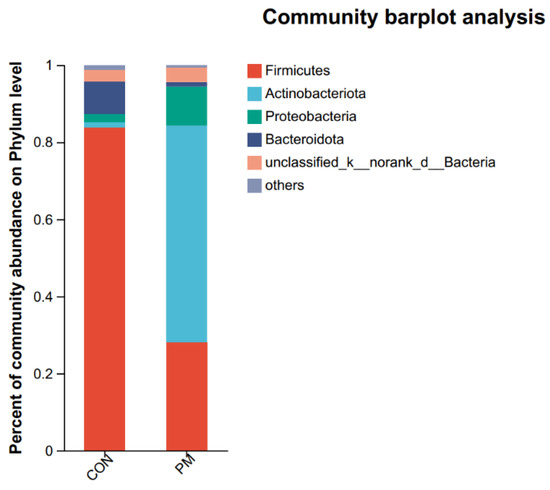
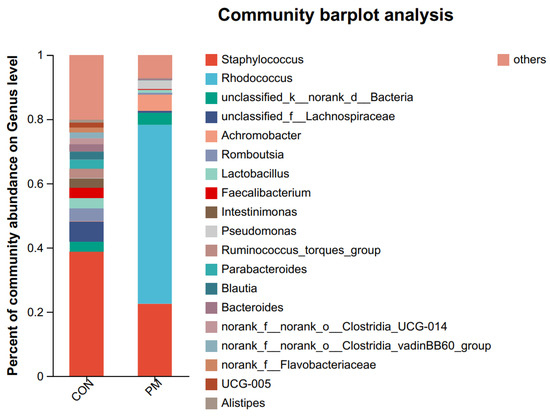
Figure 5.
The effect of PM on the pulmonary composition at the phylum and genus levels.
In the genus level, the top genus are Staphylococcus, Rhodococcus, unclassified_k_norank_d_Bacteria, unclassified_f_Lachnospiraceae, Achromobacter, Romboutsia, Lactobacillus, Faecalibacterium, Intestinimonas, Pseudomonas, Ruminococcus_torques_group, Parabacteroides, Blautia, Bacteroides, norank_f_norank_o_Clostridia_UCG-014, norank_f_norank_o_Clostridia_vadinBB60_group, norank_f_Flavobacteriaceae, UCG-005, and Alistipes.
3.6. Test of Microbiota Composition between the CON and PM Groups at the Phylum and Genus Levels
To further investigate the alterations in microbiota composition between the CON and PM groups, Student’s t-test was used to analyze the difference. As shown in Figure 6, at the phylum level, PM exposure significantly decreased the Firmicutes abundance and significantly increased the abundance of Actinobacteria and Proteobacteria (p < 0.05). In addition, at the genus level, PM exposure significantly increased the abundance of Rhodococcus, Achromobacter, Pseudomonas, and Ochrobactrum (p < 0.05), while PM exposure significantly decreased the Ruminococcus_gauvreauii_group, Sphingomonas, Anaerofilum, Cellulosilyticum, Actinoplanes, norank_f_JG30-KF-CM45, norank_f_Ilumatobacteraceae, Subgroup_10, Nordella, norank_f_Vicinamibacteraceae, and norank_f_Xanthobacteraceae (p < 0.05).
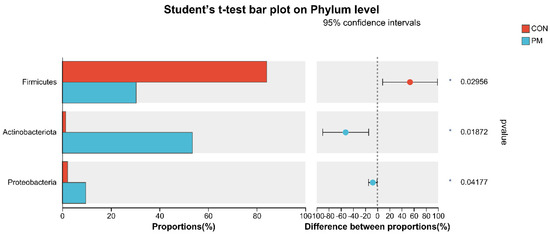
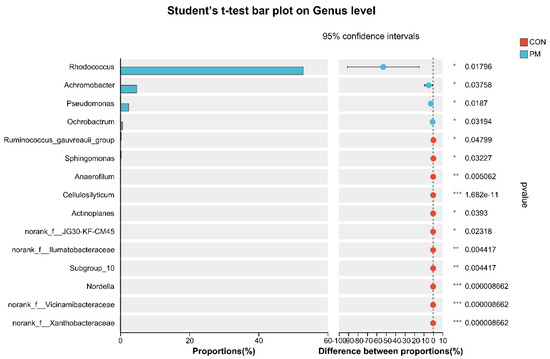
Figure 6.
The test of pulmonary microbiota composition at the phylum and genus levels. * means differ significantly (p < 0.05). ** means differ highly significantly (p < 0.01). *** means differ highly significantly (p < 0.001).
3.7. Correlation between Pulmonary Microbiota and Inflammation under PM Exposure
As shown in Figure 7, correlation analysis was used to analyze the correlations between the top 50 most abundant genera and IL-10, IL-6, TNFα, and IFNγ expressions. The results showed that Ochrobactrum (r = 0.94, p = 0.0048; r = 0.93, p = 0.00767), Rhodococcus (r = 0.94, p = 0.0048; r = 0.93, p = 0.00767), Delftia (r = 0.93, p = 0.00767; r = 0.94, p = 0.00509), Pseudomonas (r = 0.88, p = 0.01885; r = 0.93, p = 0.00767), and Acinetobacter (r = 0.94, p = 0.01885; r = 0.93, p = 0.00767) were significantly correlated with TNFα and IFNγ expression (p < 0.05). Oscillibacter (r = 0.88, p = 0.01982), Shuttleworthia (r = 0.85, p = 0.03411), and Turcibacter (r = 0.81, p = 0.04986) was significantly correlated with IL-10 expression (p < 0.05).
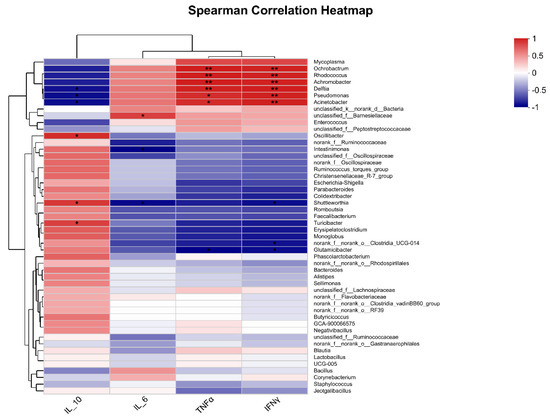
Figure 7.
Correlation analysis between pulmonary microbiota and pulmonary cytokines expression. * means a significantly positive correlation (p < 0.05) in red cells or a significantly negative correlation (p < 0.05) in blue cells. ** means a highly significantly positive correlation (p < 0.01) in red cells or a highly significantly negative correlation (p < 0.01) in blue cells.
4. Discussion
This study mainly investigated the effects of PM on the pulmonary microbiota composition, pulmonary cytokines and histological changes, as well as the potential relationship between the pulmonary microbiota and injury under PM2.5 exposure. Our research showed that PM exposure changed α and β diversity, altered the pulmonary microbiota composition, and also induced pulmonary inflammation. In addition, correlation analysis indicated pulmonary microbiota were positively correlated with pulmonary inflammation under PM exposure.
Increasing evidence indicated that the interactions between the pulmonary microbiota and host have a significant role in maintaining pulmonary health [29,30,31,32,33,34]. Studies have also illustrated the changes in pulmonary microbiota composition, such as that which occurs in COPD [20], asthma [21], and pneumonia [22]. In the present study, we characterized the alterations in the pulmonary microbiota of broilers under PM exposure. First, through four indexes of α diversity (Ace, Chao, Shannon, and Simpson), we elevated the richness and diversity, and the results indicated that PM increased the species richness and diversity. Also, PM exposure changed the structure of the lung microbiota. Importantly, PM significantly altered the lung microbiota composition. At the phylum level, PM exposure significantly decreased the Firmicutes abundance and significantly increased the abundance of Actinobacteria and Proteobacteria. The literature suggests that a decrease in the abundance of Firmicutes-associated microbiota in the respiratory tract is associated with the development of pneumonia [22]. A study using both primary lung tissue samples and a validation cohort from the Cancer Genome Map (TCGA) showed an overall increase in Proteobacteria in the lung cancer microbiome, while the abundance of Acidophilic Bacillus acidovorax (Proteobacteria) increased in squamous cell carcinoma with TP53 mutations in smokers, indicating the interaction between microbiome genes and microbiota exposure [35]. The above results indicated that PM exposure altered the diversity and structure of lung microbiota and also induced pulmonary-disease-associated lung microbiota.
The main biological mechanism of lung injury caused by PM is pulmonary inflammation, which is also the cause of the development and worsening of lung disease caused by PM [36]. The alteration in cytokines concentration was closely related to respiratory disease occurrence. TNFα is an inflammatory factor that mainly induces airway hyperresponsiveness in animals and humans, which is significantly associated with damage to airway epithelial tissue, activation and chemotaxis of eosinophils, and release of basic proteins. Research has found that PM2.5 increased TNFα expression by regulating NF-kB, resulting in airway inflammatory response and tissue damage [37]. It was also reported that IFNγ is a type II that possesses various biological activities, including antivirus effect and antitumor effect. IL-6 is a multifunctional cytokine that can regulate immune response and the activation, growth, and differentiation of T cells related to inflammatory response and can promote T-cell-mediated inflammatory response. In addition, it has been proven that during lung injury caused by viral infection, macrophages and epithelial cells release IL-6, which interacts with TNFα synergistic effects and exerts biological effects [38]. Previous studies have found that PM exposure caused an increase in IL-1β, IL-18, and inflammatory cell counts in the lung tissue of mice [39], and PM also induced pulmonary inflammation in human bronchial epithelial cells [40]. In line with the previous study, our results also revealed that PM increased the expression of IL-6, TNFα, and IFNγ and significantly decreased the IL-10 expression in the lung of broilers, which indicates PM exposure induced chronic pulmonary inflammation in broilers. Our results also showed that PM induced results of injury, namely inflammatory infiltrates and hyperemia, indicating that the lung barrier was damaged after exposure. This injury causes cytokines in the lung to enter the bloodstream or vice versa, thereby causing uncontrollable inflammation through multiple signal transduction pathways.
In recent years, research has shown that the lung microbiota also contributes to pulmonary inflammation [18,25,41,42]. In the present study, Ochrobactrum, Rhodococcus, Delftia, Pseudomonas, and Acinetobacter were significantly correlated with TNFα and IFNγ expression. Moreover, at the genus level, PM exposure significantly increased the abundance of Rhodococcus, Achromobacter, Pseudomonas, and Ochrobactrum. Thus, the alterations in the pulmonary microbiota may also contribute to lung inflammation under PM exposure.
Specifically, the Rhodococcus genus was discovered in 1977 and includes mycobacteria-like organisms, of which R. equi is associated with pulmonary masses/infiltrations/abscesses/cavities [43,44]; these pulmonary abscesses extend to the ipsilateral mediastinum and supraclavicular fossa [45], leading to ipsilateral/unilateral pleural effusions (even with mediastinal (fibrosing pleurisy)) [44,46], bacteremia [47], bilateral maxillary sinusitis, bilateral necrotic pneumonia, bronchogenic fistula [47], and acute respiratory distress/shock/death and other diseases [48]. Inhaling contaminated aerosols seems to be the main form of transmission of Rhodococcus, with most cases involving the lungs [49]. Achromobacter is a ubiquitous environmental organism that can also become pathogenic pathogens in some situations, such as cystic fibrosis, renal failure, and immunodeficiency [50]. Another study also showed that cystic fibrosis patients were the most frequently colonized subjects by Achromobacter spp., which can cause continuous airway infections [51]. Pseudomonas is the culprit of various infections, especially those involving the air passage [52,53,54], which may produce severe pneumonia in immunocompromised individuals [55], cause chronic obstructive pulmonary disease [56], induce bronchiectasis pathogenesis and contribute to airway inflammation and epithelial damage in bronchiectasis [57], and trigger allergic inflammation [58] or lung inflammation [59]. The increase of genus Ochrobactrum is related to underlying disorder or disease that increases individual susceptibility to infection, and Ochrobactrum could act as an opportunistic pathogen in immunocompromised individuals [60]. In addition, Ochrobactrum may also be associated with some co-morbidities such as pneumonia, hypertension, and diabetes mellitus [61]. Growing evidence found that Ochrobactrum could infect immunocompetent hosts with, for example, endocarditis and septicemia [62,63]. Thus, the above results further indicate that PM exposure increases the lung disease and inflammation associated with pulmonary microbiota, which may be due to the host susceptibility induced by PM exposure.
Additionally, PM exposure significantly decreased Ruminococcus_gauvreauii_group, Sphingomonas, Anaerofilum, Cellulosilyticum, Actinoplanes, norank_f_JG30-KF-CM45, norank_f_Ilumatobacteraceae, Subgroup_10, Nordella, norank_f_Vicinamibacteraceae, and norank_f_Xanthobacteraceae. Among them, some strains of Ruminococcus_gauvreauii_group can degrade mucin to produce propionic acid, providing energy to the host and promoting their own colonization [64]. The lower abundance of Sphingomonas was possibly correlated with the formation of mucus plugs in children with Mycoplasma pneumoniae pneumonia [65]. Cellulosilyticum is the cellulose-degrading genus, which may be related to host health and fat deposition [66]. Due to the much lower abundance of the remaining microbiota, we will not elaborate on them here. Thus, the alterations in the above microbiota indicate that PM exposure decreases the mucus- and energy-associated microbiota in the lung.
5. Conclusions
In conclusion, the results indicate that PM exposure increases the pulmonary microbiota associated with respiratory tract disease and inflammation and also disrupts the pulmonary histological structure and induces chronic pulmonary inflammation. Moreover, the alterations in the pulmonary microbiota contribute to the pulmonary inflammation by increasing the levels of TNFα and IFNγ. There findings will help improve our understanding of the possible mechanism by which particulate matter affects the respiratory tract health of broiler chickens. To address a current limitation, we should also set more levels of PM2.5 to investigate the relationship between the pulmonary microbiota and pulmonary injury. The future research will focus on the specific mechanism of the pulmonary microbiota in lung injury induced by PM2.5.
Author Contributions
Conceptualization, Y.Z. and S.L.; methodology, Y.Z.; software, Y.Z.; validation, B.X., L.W., C.Z., and S.L.; formal analysis, Y.Z.; investigation, Y.Z., B.X., L.W., and C.Z.; resources, Y.Z.; data curation, Y.Z. and B.X.; writing—original draft preparation, Y.Z.; writing—review and editing, Y.Z., B.X., L.W., C.Z., and S.L.; visualization, Y.Z.; supervision, S.L.; project administration, B.X.; funding acquisition, S.L. All authors have read and agreed to the published version of the manuscript.
Funding
This research was funded by the China Agriculture Research System of MOF and MARA (CARS-41); Henan Postdoctoral Foundation.
Institutional Review Board Statement
The study was conducted according to the guidelines of the Declaration of Helsinki and approved by the Institutional Ethics Committee of Experiment Animal Welfare and Ethical at the Henan academy of agricultural sciences Institute of Animal Science (NO: IACUC-20220615002, approval date 15 June 2022).
Informed Consent Statement
Not applicable.
Data Availability Statement
Not applicable.
Conflicts of Interest
The authors declare no conflict of interest.
References
- Li, J.; Li, H.; Li, H.; Guo, W.; An, Z.; Zeng, X.; Li, W.; Li, H.; Song, J.; Wu, W. Amelioration of PM2.5-induced lung toxicity in rats by nutritional supplementation with fish oil and Vitamin E. Respir. Res. 2019, 20, 76. [Google Scholar] [CrossRef] [PubMed]
- Wang, J.; Lu, M.; An, Z.; Jiang, J.; Li, J.; Wang, Y.; Du, S.; Zhang, X.; Zhou, H.; Cui, J.; et al. Associations between air pollution and outpatient visits for allergic rhinitis in Xinxiang, China. Environ. Sci. Pollut. Res. Int. 2020, 27, 23565–23574. [Google Scholar] [CrossRef] [PubMed]
- Liang, F.; Xiao, Q.; Gu, D.; Xu, M.; Tian, L.; Guo, Q.; Wu, Z.; Pan, X.; Liu, Y. Satellite-based short- and long-term exposure to PM2.5 and adult mortality in urban Beijing, China. Environ. Pollut. 2018, 242, 492–499. [Google Scholar] [CrossRef]
- Wang, G.; Xu, Y.; Huang, L.; Wang, K.; Shen, H.; Li, Z. Pollution characteristics and toxic effects of PM1.0 and PM2.5 in Harbin, China. Environ. Sci. Pollut. Res. Int. 2021, 28, 13229–13242. [Google Scholar] [CrossRef]
- Cambra-López, M.; Aarnink, A.J.; Zhao, Y.; Calvet, S.; Torres, A.G. Airborne particulate matter from livestock production systems: A review of an air pollution problem. Environ. Pollut. 2010, 158, 1–17. [Google Scholar] [CrossRef] [PubMed]
- Almuhanna, E.A. Characteristics of air contaminants in naturally and mechanically ventilated poultry houses in Al-Ahsa, Saudi Arabia. Trans. ASABE 2011, 54, 1433–1443. [Google Scholar] [CrossRef]
- Ni, J.Q.; Chai, L.; Chen, L.; Bogan, B.W.; Wang, K.; Cortus, E.L.; Diehl, C.A. Characteristics of ammonia, hydrogen sulfide, carbon dioxide, and particulate matter concentrations in high-rise and manure-belt layer hen houses. Atmos. Environ. 2012, 57, 165–174. [Google Scholar] [CrossRef]
- Guo, L.; Zhao, D.; Zhao, B.; Ma, S.; Liu, X.; Li, M.; Liu, X. Seasonal variations and spatial distribution of particulate matter emissions from a ventilated laying hen house in Northeast China. Int. J. Agric. Biol. Eng. 2020, 13, 57–63. [Google Scholar] [CrossRef]
- Hong, E.C.; Kang, H.K.; Jeon, J.J.; You, A.S.; Kim, H.S.; Son, J.S.; Kim, H.J.; Yun, Y.S.; Kang, B.S.; Kim, J.H. Studies on the concentrations of particulate matter and ammonia gas from three laying hen rearing systems during the summer season. J. Environ. Sci. Health B. 2021, 56, 753–760. [Google Scholar] [CrossRef]
- Kim, Y.H.; Suh, H.; Kim, J.; Jung, Y.H.; Moon, K.W. Evaluation of Environmental Circumstance Within Swine and Chicken Houses in South Korea for the Production of Safe and Hygienic Animal Food Products. Korean J. Food Sci. Anim. Resour. 2008, 28, 623–628. [Google Scholar] [CrossRef][Green Version]
- Ali, M.Z. Common respiratory diseases of poultry in Bangladesh: A review. SAARC J. Agric. 2020, 18, 1–11. [Google Scholar] [CrossRef]
- Hamid, A.; Ahmad, A.S.; Khan, N. Respiratory and other health risks among poultry-farm workers and evaluation of management practices in poultry farms. Braz. J. Poult. Sci. 2018, 20, 111–118. [Google Scholar] [CrossRef]
- Stuper-Szablewska, K.; Szablewski, T.; Nowaczewski, S.; Gornowicz, E. Chemical and microbiological hazards related to poultry farming. Med. Sr. 2018, 21, 53–63. [Google Scholar]
- Wang, K.; Shen, D.; Dai, P.; Li, C. Particulate matter in poultry house on poultry respiratory disease: A systematic review. Poult. Sci. 2023, 102, 102556. [Google Scholar] [CrossRef]
- Dickson, R.P.; Erb-Downward, J.R.; Falkowski, N.R.; Hunter, E.M.; Ashley, S.L.; Huffnagle, G.B. The Lung Microbiota of Healthy Mice Are Highly Variable, Cluster by Environment, and Reflect Variation in Baseline Lung Innate Immunity. Am. J. Respir. Crit. Care Med. 2018, 198, 497–508. [Google Scholar] [CrossRef]
- Hilty, M.; Burke, C.; Pedro, H.; Cardenas, P.; Bush, A.; Bossley, C.; Davies, J.; Ervine, A.; Poulter, L.; Pachter, L.; et al. Disordered microbial communities in asthmatic airways. PLoS ONE 2010, 5, e8578. [Google Scholar] [CrossRef]
- Dickson, R.P.; Schultz, M.J.; van der Poll, T.; Schouten, L.R.; Falkowski, N.R.; Luth, J.E.; Sjoding, M.W.; Brown, C.A.; Chanderraj, R.; Huffnagle, G.B.; et al. Biomarker Analysis in Septic ICU Patients (BASIC) Consortium. Lung Microbiota Predict Clinical Outcomes in Critically Ill Patients. Am. J. Respir. Crit. Care Med. 2020, 201, 555–563. [Google Scholar] [CrossRef] [PubMed]
- O’Dwyer, D.N.; Ashley, S.L.; Gurczynski, S.J.; Xia, M.; Wilke, C.; Falkowski, N.R.; Norman, K.C.; Arnold, K.B.; Huffnagle, G.B.; Salisbury, M.L.; et al. Lung Microbiota Contribute to Pulmonary Inflammation and Disease Progression in Pulmonary Fibrosis. Am. J. Respir. Crit. Care Med. 2019, 199, 1127–1138. [Google Scholar] [CrossRef]
- D’Alessandro-Gabazza, C.N.; Yasuma, T.; Kobayashi, T.; Toda, M.; Abdel-Hamid, A.M.; Fujimoto, H.; Hataji, O.; Nakahara, H.; Takeshita, A.; Nishihama, K.; et al. Inhibition of lung microbiota-derived proapoptotic peptides ameliorates acute exacerbation of pulmonary fibrosis. Nat. Commun. 2022, 13, 1558. [Google Scholar] [CrossRef]
- Russo, C.; Colaianni, V.; Ielo, G.; Valle, M.S.; Spicuzza, L.; Malaguarnera, L. Impact of Lung Microbiota on COPD. Biomedicines 2022, 10, 1337. [Google Scholar] [CrossRef]
- Hufnagl, K.; Pali-Schöll, I.; Roth-Walter, F.; Jensen-Jarolim, E. Dysbiosis of the gut and lung microbiome has a role in asthma. In Seminars in Immunopathology; Springer: Berlin/Heidelberg, Germany, 2020; Volume 42, pp. 75–93. [Google Scholar]
- Thibeault, C.; Suttorp, N.; Opitz, B. The microbiota in pneumonia: From protection to predisposition. Sci. Transl. Med. 2021, 13, eaba0501. [Google Scholar] [CrossRef]
- Budden, K.F.; Shukla, S.D.; Rehman, S.F.; Bowerman, K.L.; Keely, S.; Hugenholtz, P.; Armstrong-James, D.P.H.; Adcock, I.M.; Chotirmall, S.H.; Chung, K.F.; et al. Functional effects of the microbiota in chronic respiratory disease. Lancet Respir. Med. 2019, 7, 907–920. [Google Scholar] [CrossRef] [PubMed]
- Wang, L.; Cheng, H.; Wang, D.; Zhao, B.; Zhang, J.; Cheng, L.; Yao, P.; Di Narzo, A.; Shen, Y.; Yu, J.; et al. Airway microbiome is associated with respiratory functions and responses to ambient particulate matter exposure. Ecotoxicol. Environ. Saf. 2019, 167, 269–277. [Google Scholar] [CrossRef]
- Wang, S.; Zhou, Q.; Tian, Y.; Hu, X. The Lung Microbiota Affects Pulmonary Inflammation and Oxidative Stress Induced by PM2.5 Exposure. Environ. Sci. Technol. 2022, 56, 12368–12379. [Google Scholar] [CrossRef] [PubMed]
- Wang, J.; Yan, Y.; Si, H.; Li, J.; Zhao, Y.; Gao, T.; Pi, J.; Zhang, R.; Chen, R.; Chen, W.; et al. The effect of real-ambient PM2.5 exposure on the lung and gut microbiomes and the regulation of Nrf2. Ecotoxicol. Environ. Saf. 2023, 254, 114702. [Google Scholar] [CrossRef] [PubMed]
- Li, N.; He, F.; Liao, B.; Zhou, Y.; Li, B.; Ran, P. Exposure to ambient particulate matter alters the microbial composition and induces immune changes in rat lung. Respir. Res. 2017, 18, 143. [Google Scholar] [CrossRef]
- Zhou, Y.; Zhao, X.; Zhang, M.; Feng, J. Gut microbiota dysbiosis exaggerates ammonia-induced tracheal injury Via TLR4 signaling pathway. Ecotoxicol. Environ. Saf. 2022, 246, 114206. [Google Scholar] [CrossRef]
- Dumas, A.; Bernard, L.; Poquet, Y.; Lugo-Villarino, G.; Neyrolles, O. The role of the lung microbiota and the gut-lung axis in respiratory infectious diseases. Cell Microbiol. 2018, 20, e12966. [Google Scholar] [CrossRef]
- Jin, C.; Lagoudas, G.K.; Zhao, C.; Bullman, S.; Bhutkar, A.; Hu, B.; Ameh, S.; Sandel, D.; Liang, X.S.; Mazzilli, S.; et al. Commensal Microbiota Promote Lung Cancer Development via γδ T Cells. Cell 2019, 176, 998–1013. [Google Scholar] [CrossRef]
- Whiteside, S.A.; McGinniss, J.E.; Collman, R.G. The lung microbiome: Progress and promise. J. Clin. Investig. 2021, 131, e150473. [Google Scholar] [CrossRef]
- Yagi, K.; Huffnagle, G.B.; Lukacs, N.W.; Asai, N. The Lung Microbiome during Health and Disease. Int. J. Mol. Sci. 2021, 22, 10872. [Google Scholar] [CrossRef] [PubMed]
- Zhou, X.; Ji, L.; Ma, Y.; Tian, G.; Lv, K.; Yang, J. Intratumoral Microbiota-Host Interactions Shape the Variability of Lung Adenocarcinoma and Lung Squamous Cell Carcinoma in Recurrence and Metastasis. Microbiol. Spectr. 2023, 11, e0373822. [Google Scholar] [CrossRef] [PubMed]
- Natalini, J.G.; Singh, S.; Segal, L.N. The dynamic lung microbiome in health and disease. Nat. Rev. Microbiol. 2023, 21, 222–235. [Google Scholar] [CrossRef] [PubMed]
- Greathouse, K.L.; White, J.R.; Vargas, A.J.; Bliskovsky, V.V.; Beck, J.A.; von Muhlinen, N.; Polley, E.C.; Bowman, E.D.; Khan, M.A.; Robles, A.I.; et al. Interaction between the microbiome and TP53 in human lung cancer. Genome Biol. 2018, 19, 123. [Google Scholar] [CrossRef] [PubMed]
- Zeng, Y.; Zhu, G.; Zhu, M.; Song, J.; Cai, H.; Song, Y.; Wang, J.; Jin, M. Edaravone Attenuated Particulate Matter-Induced Lung Inflammation by Inhibiting ROS-NF-κB Signaling Pathway. Oxid. Med. Cell Longev. 2022, 2022, 6908884. [Google Scholar] [CrossRef] [PubMed]
- Zhang, Y.; Wang, S.; Zhu, J.; Li, C.; Zhang, T.; Liu, H.; Xu, Q.; Ye, X.; Zhou, L.; Ye, L. Effect of Atmospheric PM2.5 on Expression Levels of NF-κB Genes and Inflammatory Cytokines Regulated by NF-κB in Human Macrophage. Inflammation 2018, 41, 784–794. [Google Scholar] [CrossRef]
- Hayden, F.G.; Fritz, R.; Lobo, M.C.; Alvord, W.; Strober, W.; Straus, S.E. Local and systemic cytokine responses during experimental human influenza A virus infection. Relation to symptom formation and host defense. J. Clin. Investig. 1998, 101, 643–649. [Google Scholar] [CrossRef]
- Li, J.; An, Z.; Song, J.; Du, J.; Zhang, L.; Jiang, J.; Ma, Y.; Wang, C.; Zhang, J.; Wu, W. Fine particulate matter-induced lung inflammation is mediated by pyroptosis in mice. Ecotoxicol. Environ. Saf. 2021, 219, 112351. [Google Scholar] [CrossRef]
- Jia, H.; Liu, Y.; Guo, D.; He, W.; Zhao, L.; Xia, S. PM2.5-induced pulmonary inflammation via activating of the NLRP3/caspase-1 signaling pathway. Environ. Toxicol. 2021, 36, 298–307. [Google Scholar] [CrossRef]
- Yang, D.; Xing, Y.; Song, X.; Qian, Y. The impact of lung microbiota dysbiosis on inflammation. Immunology 2020, 159, 156–166. [Google Scholar] [CrossRef]
- Ramírez-Labrada, A.G.; Isla, D.; Artal, A.; Arias, M.; Rezusta, A.; Pardo, J.; Gálvez, E.M. The Influence of Lung Microbiota on Lung Carcinogenesis, Immunity, and Immunotherapy. Trends Cancer. 2020, 6, 86–97. [Google Scholar] [CrossRef] [PubMed]
- Claassen, S.L.; Reese, J.M.; Mysliwiec, V.; Mahlen, S.D. Achromobacter xylosoxidans infection presenting as a pulmonary nodule mimicking cancer. J. Clin. Microbiol. 2011, 49, 2751–2754. [Google Scholar] [CrossRef]
- Gómez-Cerezo, J.; Suárez, I.; Ríos, J.J.; Peña, P.; García de Miguel, M.J.; de José, M.; Monteagudo, O.; Linares, P.; Barbado-Cano, A.; Vázquez, J.J. Achromobacter xylosoxidans bacteremia: A 10-year analysis of 54 cases. Eur. J. Clin. Microbiol. Infect. Dis. 2003, 22, 360–363. [Google Scholar] [CrossRef]
- Iyobe, S.; Kusadokoro, H.; Takahashi, A.; Yomoda, S.; Okubo, T.; Nakamura, A.; O’Hara, K. Detection of a variant metallo-beta-lactamase, IMP-10, from two unrelated strains of Pseudomonas aeruginosa and an alcaligenes xylosoxidans strain. Antimicrob. Agents Chemother. 2002, 46, 2014–2016. [Google Scholar] [CrossRef]
- Kostadinova, S.; Ivanov, A.; Kamberov, E. Purification and some properties of phospholipase C from Achromobacter xylosoxidans. J. Chromatogr. 1991, 568, 315–324. [Google Scholar] [CrossRef]
- Traglia, G.M.; Almuzara, M.; Merkier, A.K.; Adams, C.; Galanternik, L.; Vay, C.; Centrón, D.; Ramírez, M.S. Achromobacter xylosoxidans: An emerging pathogen carrying different elements involved in horizontal genetic transfer. Curr. Microbiol. 2012, 65, 673–678. [Google Scholar] [CrossRef] [PubMed]
- Green, S.J.; Scheller, L.F.; Marletta, M.A.; Seguin, M.C.; Klotz, F.W.; Slayter, M.; Nelson, B.J.; Nacy, C.A. Nitric oxide: Cytokine-regulation of nitric oxide in host resistance to intracellular pathogens. Immunol. Lett. 1994, 43, 87–94. [Google Scholar] [CrossRef]
- Weinstock, D.M.; Brown, A.E. Rhodococcus equi: An emerging pathogen. Clin. Infect. Dis. 2002, 34, 1379–1385. [Google Scholar] [CrossRef] [PubMed]
- Swenson, C.E.; Sadikot, R.T. Achromobacter respiratory infections. Ann. Am. Thorac. Soc. 2015, 12, 252–258. [Google Scholar] [CrossRef]
- Veschetti, L.; Boaretti, M.; Saitta, G.M.; Passarelli Mantovani, R.; Lleò, M.M.; Sandri, A.; Malerba, G. Achromobacter spp. prevalence and adaptation in cystic fibrosis lung infection. Microbiol. Res. 2022, 263, 127140. [Google Scholar] [CrossRef]
- Sethi, S.; Murphy, T.F. Infection in the pathogenesis and course of chronic obstructive pulmonary disease. N. Engl. J. Med. 2008, 359, 2355–2365. [Google Scholar] [CrossRef]
- Hauser, A.R. Pseudomonas aeruginosa virulence and antimicrobial resistance: Two sides of the same coin? Crit. Care. Med. 2014, 42, 201–202. [Google Scholar] [CrossRef] [PubMed]
- Walter, J.; Haller, S.; Quinten, C.; Kärki, T.; Zacher, B.; Eckmanns, T.; Abu Sin, M.; Plachouras, D.; Kinross, P.; Suetens, C. ECDC PPS study group. Healthcare-associated pneumonia in acute care hospitals in European Union/European Economic Area countries: An analysis of data from a point prevalence survey, 2011 to 2012. Euro Surveill. 2018, 23, 1700843. [Google Scholar] [CrossRef] [PubMed]
- Berube, B.J.; Rangel, S.M.; Hauser, A.R. Pseudomonas aeruginosa: Breaking down barriers. Curr. Genet. 2016, 62, 109–113. [Google Scholar] [CrossRef] [PubMed]
- Parameswaran, G.I.; Sethi, S. Pseudomonas infection in chronic obstructive pulmonary disease. Future Microbiol. 2012, 7, 1129–1132. [Google Scholar] [CrossRef]
- Vidaillac, C.; Chotirmall, S.H. Pseudomonas aeruginosa in bronchiectasis: Infection, inflammation, and therapies. Expert Rev. Respir. Med. 2021, 15, 649–662. [Google Scholar] [CrossRef]
- Agaronyan, K.; Sharma, L.; Vaidyanathan, B.; Glenn, K.; Yu, S.; Annicelli, C.; Wiggen, T.D.; Penningroth, M.R.; Hunter, R.C.; Dela Cruz, C.S.; et al. Tissue remodeling by an opportunistic pathogen triggers allergic inflammation. Immunity 2022, 55, 895–911. [Google Scholar] [CrossRef]
- Lyons, J.D.; Mandal, P.; Otani, S.; Chihade, D.B.; Easley, K.F.; Swift, D.A.; Burd, E.M.; Liang, Z.; Koval, M.; Mocarski, E.S.; et al. The RIPK3 Scaffold Regulates Lung Inflammation During Pseudomonas Aeruginosa Pneumonia. Am. J. Respir. Cell Mol. Biol. 2023, 68, 150–160. [Google Scholar] [CrossRef]
- Ryan, M.P.; Pembroke, J.T. The Genus Ochrobactrum as Major Opportunistic Pathogens. Microorganisms 2020, 8, 1797. [Google Scholar] [CrossRef]
- Ko, H.M.; Jo, J.H.; Baek, H.G. Effective Identification of Ochrobactrum anthropi Isolated from Clinical Specimens. Korean J. Clin. Lab. Sci. 2020, 52, 221–228. [Google Scholar] [CrossRef]
- Kettaneh, A.; Weill, F.X.; Poilane, I.; Fain, O.; Thomas, M.; Herrmann, J.L.; Hocqueloux, L. Septic shock caused by Ochrobactrum anthropi in an otherwise healthy host. J. Clin. Microbiol. 2003, 41, 1339–1341. [Google Scholar] [CrossRef] [PubMed]
- Ozdemir, D.; Soypacaci, Z.; Sahin, I.; Bicik, Z.; Sencan, I. Ochrobactrum anthropi endocarditis and septic shock in a patient with no prosthetic valve or rheumatic heart disease: Case report and review of the literature. Jpn. J. Infect Dis. 2006, 59, 264–265. [Google Scholar]
- Crost, E.H.; Tailford, L.E.; Le Gall, G.; Fons, M.; Henrissat, B.; Juge, N. Utilisation of mucin glycans by the human gut symbiont Ruminococcus gnavus is strain-dependent. PLoS ONE 2013, 8, e76341. [Google Scholar] [CrossRef] [PubMed]
- Xu, X.; Wu, L.; Sheng, Y.; Liu, J.; Xu, Z.; Kong, W.; Tang, L.; Chen, Z. Airway microbiota in children with bronchial mucus plugs caused by Mycoplasma pneumoniae pneumonia. Respir. Med. 2020, 170, 105902. [Google Scholar] [CrossRef] [PubMed]
- McCormack, U.M.; Curião, T.; Buzoianu, S.G.; Prieto, M.L.; Ryan, T.; Varley, P.; Crispie, F.; Magowan, E.; Metzler-Zebeli, B.U.; Berry, D.; et al. Exploring a Possible Link between the Intestinal Microbiota and Feed Efficiency in Pigs. Appl. Environ. Microbiol. 2017, 83, e00380-17. [Google Scholar] [CrossRef]
Disclaimer/Publisher’s Note: The statements, opinions and data contained in all publications are solely those of the individual author(s) and contributor(s) and not of MDPI and/or the editor(s). MDPI and/or the editor(s) disclaim responsibility for any injury to people or property resulting from any ideas, methods, instructions or products referred to in the content. |
© 2023 by the authors. Licensee MDPI, Basel, Switzerland. This article is an open access article distributed under the terms and conditions of the Creative Commons Attribution (CC BY) license (https://creativecommons.org/licenses/by/4.0/).