Article

Thermal Response of Laboratory Rats (Rattus norvegicus) during the Application of Six Methods of Euthanasia Assessed by Infrared Thermography

by
Adriana Domínguez-Oliva
1,2,
Ismael Hernández-Ávalos
3,
Adriana Olmos-Hernández
4,
Juan Villegas-Juache
5,
Antonio Verduzco-Mendoza
4 and
Daniel Mota-Rojas
2,*
1
Master in Science Program “Maestría en Ciencias Agropecuarias”, Xochimilco Campus, Universidad Autónoma Metropolitana, Mexico City 04960, Mexico
2
Neurophysiology of Pain, Behavior and Assessment of Welfare in Domestic Animals, DPAA, Xochimilco Campus, Universidad Autónoma Metropolitana (UAM), Mexico City 04960, Mexico
3
Clinical Pharmacology and Veterinary Anesthesia, Biological Sciences Department, Facultad de Estudios Superiores Cuautitlán, Universidad Nacional Autónoma de México, Cuautitlán Izcalli 54714, Mexico
4
Division of Biotechnology—Bioterio and Experimental Surgery, Instituto Nacional de Rehabilitación-Luis Guillermo Ibarra Ibarra (INR-LGII), Mexico City 14389, Mexico
5
Bioterio and Experimental Surgery, Instituto Nacional de Cardiología Ignacio Chávez, Mexico City 14080, Mexico
*
Author to whom correspondence should be addressed.
Animals 2023, 13(18), 2820; https://doi.org/10.3390/ani13182820
Submission received: 26 July 2023 / Revised: 28 August 2023 / Accepted: 1 September 2023 / Published: 5 September 2023

Abstract

:

Simple Summary

The present study aimed to assess the infrared thermal response of laboratory rats (Rattus norvegicus) during the application of six euthanasia methods (injectable, inhalational, and physical) to determine the method that prevents or diminishes the stress response. The surface temperature was assessed in four thermal windows: ocular (T°ocu), auricular (T°ear), interscapular (T°dor), and caudal (T°tai). The results showed that inhalant methods (CO2 and isoflurane) had temperature alterations that could be suggestive of a marked stress response, in contrast to other methods such as pentobarbital, decapitation, and xylazine + ketamine. In conclusion, according to the thermal response of the rats, it is suggested that CO2 and isoflurane might cause distress and this needs to be considered when selecting these techniques as the method of euthanasia for laboratory rats.

Abstract

Refinement is one of the principles aiming to promote welfare in research animals. The techniques used during an experimental protocol, including euthanasia selection, must prevent and minimize suffering. Although the current euthanasia methods applied to laboratory rodents are accepted, the controversial findings regarding the potential stress/distress they can cause is a field of research. The objective was to assess the thermal response of Wistar rats during various euthanasia methods using infrared thermography (IRT) to determine the method that prevents or diminishes the stress response and prolonged suffering. Pentobarbital (G1), CO2 (G2), decapitation (G3), isoflurane (G4), ketamine + xylazine (G5), and ketamine + CO2 (G6) were evaluated at five evaluation times with IRT to identify changes in the surface temperature of four anatomical regions: ocular (T°ocu), auricular (T°ear), interscapular (T°dor), and caudal (T°tai). Significant differences (p < 0.05) were found in G2 and G4, registering temperature increases from the administration of the drug to the cessation of respiratory rate and heart rate. Particularly, isoflurane showed a marked thermal response in T°ocu, T°ear, T°dor, and T°tai, suggesting that, in general, inhalant euthanasia methods induce stress in rats and that isoflurane might potentially cause distress, an effect that must be considered when deciding humane euthanasia methods in laboratory rodents.

1. Introduction

The use of animals is a key element for improvements in biomedical science [1,2], where rats and mice represent 87–98% of the total of species used in the scientific community [3,4]. The potential pain and stress that laboratory animals might experience is highly controversial [5]. Ethical animal research necessitates the selection of suitable euthanasia methods to minimize pain and distress, as proposed by the National Centre for the Replacement, Refinement, and Reduction of Animals in Research [6], not only to provide welfare but also to ensure the quality of results. These initiatives need be applied not only during the life of research animals, but also during the application of euthanasia methods with the aim of providing humane endpoints [7].
Currently, there is a debate around the euthanasia methods that are approved by the American Veterinary Medicine Association (AVMA). Injectable drugs (e.g., barbiturates and general anesthetics), inhalant agents (e.g., CO2 and isoflurane), and physical methods (e.g., decapitation and cervical dislocation) are recognized as acceptable techniques to induce a humane death without suffering [8]. However, some methods are under discussion since studies have shown potential adverse effects during their application. For example, inhalation of CO2 is aversive for rats [9] and induces bradycardia and potential anxiety due to hypoxia before loss of consciousness [10,11]. Moreover, CO2 forms carbonic acid and induces the activation of pain receptors [12]. Nonetheless, systematic reviews have contrasting results regarding the suitability of CO2 and its potential distress [13]. Isoflurane is considered an alternative to CO2 euthanasia. However, it is known as an aversive agent to rats for its mild pungency [14,15].
On the other hand, the administration of injectable pentobarbital has been associated with pain-related behaviors (e.g., writhing and back arching) due to intraperitoneal (IP) irritation [16,17,18], while the combination of xylazine and ketamine, although a common anesthetic protocol, demonstrates limited action as a euthanasic agent. However, high Mouse Grimace Scale scores and anxiety-related behaviors were found after repeated doses of the combination [19]. Moreover, Wellington et al. [20] found that IP administration of ketamine + xylazine to rats caused acute muscle and tissue necrosis, poor tolerance, and pain/discomfort behavioral reactions. In the case of decapitation, this procedure leads to the question of whether brain activity is present immediately after the procedure or not, as well as whether changes in the electroencephalogram (EEG) are associated with nociception during the first 15 s (s) following decapitation [21], as determined in rats by Derr [22] who reported that EEGs during the first 2.7 s after decapitation might indicate conscious awareness of pain and distress.
The refinement of procedures performed in research animals includes the implementation of non-invasive tools to assess their welfare without causing additional stress. Infrared thermography (IRT) is a technique that detects surface temperature changes as a neuroendocrine response of the Sympathetic Nervous System (SNS) after stressful/distressful and painful events [23,24]. Stress—known as the reaction of the organism when its homeostasis or psychological well-being is perturbated—and distress—a negative and aversive state when the organism cannot adapt or return to homeostasis [25]—activates two main systems: the hypothalamic–pituitary–adrenal (HPA) and the locus coeruleus sympathetic adrenomedullary (SAM) axes [26]. Both axes lead to the release of glucocorticoids and catecholamines, as well as the physiological changes required to adjust homeostasis [27], including alterations in body temperature and microcirculation. Therefore, temperature variations have been used as a stress-related marker in animals, as stress may cause central hyperthermia and peripheral reduction of the temperature due to vasoconstriction [28].
IRT detects these vasomotor changes as a difference in the amount of dissipated heat in different anatomical regions, where heat exchange is facilitated through the arteriovenous anastomosis and peripheral blood vessels, also called thermal windows [29]. In laboratory rodents, thermal windows such as the ocular, auricular, dorsal or interscapular, and tail region have been used to assess stress [28,30] or pain [31]. For example, Lecorps et al. [32] found that eye temperature increased in mice undergoing an elevated plus maze test, while tail temperature diminished as a physiological response to stress (a result that was associated with anxiety-related behaviors). The ocular surface has great vascular sensitivity because the two main arteries responsible for its irrigation (the arteria supraorbitalis and angularis occuli), as well as the innervation through the facial nerve, rapidly respond to autonomous tone changes and endogenous catecholamines [29]. Likewise, Zevgolis et al. [33] reported that ocular IRT increased during the experimental handling of wild mice due to stress-induced hyperthermia (SIH). A similar response is observed in the auricular window, as shown by Wokke [34] in mice. In this study, restraining methods to administer IP drugs increased ear temperature and corticosterone levels. These temperature variations are mediated by sympathetic activity and vasodilation in the main blood vessels supplying irrigation (external jugular vein, external carotid artery, and its branches into marginal ear arteries) [29,35]. Hutu et al. [36] determined that IRT measured in the ear is positively correlated with rectal temperature in rabbits. Therefore, considering that SIH also causes changes in the amount of dissipated heat in thermal windows, ear temperature could be a way to assess acute stress.
For laboratory rodents, a thermal window that is closely related to sympathetic activation and norepinephrine (NE) release after the activation of the SAM axis is the interscapular region. In this zone, small mammals have large deposits of brown adipose tissue (BAT), a thermogenic structure whose activity depends on NE binding to β3-adrenoreceptors located in BAT [37]. The increased thermogenic activity of this tissue has been associated with corticosterone secretion and with the administration of β3-adrenoreceptor agonists and NE [38,39]. Furthermore, SIH is also related to BAT thermogenesis in rats and humans after excessive stress [40].
Lastly, the tail of rats is considered an important thermal window because it contributes to up to 25% of heat dissipation (by vasoconstriction) due to arteriovenous anastomosis (from the coccygeal artery) [29,41]. Vasoconstriction of peripheral regions such as the tail and paws is mediated by the sympathetic redistribution of blood flow to key organs (e.g., the heart and brain). In mice exposed to acute stressors, the superficial tail temperature decreased during different handling procedures, while the surface temperature of the body (assessed in the dorsal region of the mice) increased as a response to SIH [42]. Gjendal et al. [30] also reported a decrease in tail temperature (up to 3.5 °C) in mice exposed to three stressors (a maze test, IP injection, and isoflurane anesthesia) as a result of vasoconstriction of tail blood vessels.
The current literature suggests IRT as a non-invasive complementary tool to assess well-being in animals, including stress-related responses [24,43]. Although there are some studies regarding IRT and the pre-slaughter or antemortem period in domestic species such as pigs [44,45], there is no study up to now where IRT has been used to evaluate the effect of euthanasia methods on laboratory species. Therefore, the present study aimed to assess the infrared thermal response of laboratory rats (Rattus norvegicus) during the application of six euthanasia methods to determine the method that prevents or diminishes the stress response and prolonged suffering. Injectable drugs (pentobarbital, ketamine + xylazine), inhalant agents (CO2, isoflurane), physical methods (decapitation), and the combination of inhaled and injectable anesthetics (CO2 + ketamine) were evaluated with IRT to identify changes in the surface temperature of four anatomical regions (ocular, auricular, interscapular, and caudal). Also, differences by sex according to the thermal window and the euthanasia method will be studied. The hypotheses of the study were as follows: (i) the use of IRT during different euthanasia methods will help to recognize changes in the surface temperature of laboratory rats (R. norvegicus) in response to stress perception related to the method and (ii) the combination of an injectable anesthetic overdose (ketamine) with CO2 exposure as the euthanasia method will reduce thermal alterations associated with stress.

2. Materials and Methods

2.1. Location and Ethical Statement

The present study was conducted at the Animal Facility and Experimental Surgery Facility from the Biotechnological Research Sub-Department of the Instituto Nacional de Rehabilitación Luis Guillermo Ibarra Ibarra, Mexico City, Mexico. All procedures were approved by the Committee for the Care and Use of Laboratory Animals (INRLGII/CICUAL/014/2021) at the National Institute of Rehabilitation Luis Guillermo Ibarra-Ibarra.
The handling and care of the laboratory animals was in accordance with the Mexican norm for laboratory animals NOM-062-ZOO-1999, published by the Department of Agriculture, Rural Development, Fisheries and Alimentation [46]. All dead animals were disposed of by incineration following NOM-062-ZOO-1999.

2.2. Animals and Housing Conditions

A total of 60 adult Wistar rats (R. norvegicus), 30 male and 30 female, were purchased from the Center for Research and Advanced Studies at the National Polytechnic Institute (CINVESTAV-IPN). The animals had an average weight of 311 ± 62 g at 8–10 weeks old (in puberty) and were obtained with an animal health certificate to ensure they were free of infectious pathogens (bacteria, viruses, and parasites). The sample size was calculated using G*Power 3.1.9.7 (Heinrich-Heine-Universität Düsseldorf, Düsseldorf, Germany). The total sample size was 48 animals, considering an α error probability of 0.05, confidence level of 95%, power (1-β error probability) of 0.90, and correction among repeated measures of 0.5 for six experimental groups with five measurements.
According to the principles of the 3Rs [47], reduction was applied to the total number of animals used by reusing animals from finished protocols related to behavioral tests (e.g., balance beam or maze tests). Rats that were part of the control groups were selected to avoid the inclusion of animals undergoing invasive procedures or those with residual drug levels. Through a general physical examination, the animals were classified as healthy without signs of disease, stress, or pain-related behaviors. The physical exam considered body weight, posture, level of consciousness, secretions, the color of the mucosa, sneezing, and a species-specific behavioral repertoire. Rats showing signs of disease, injury, or pain were eliminated. Pregnant females were excluded.
Rats were housed in separate rooms according to sex. They were placed in groups of five animals per cage in standard polycarbonate cages for rats (47 × 36 × 21 cm) with wood shavings as bedding (Aspen, Nepco, Riverside, RI, USA) and without enrichment. The rats were maintained under a 12 h day–night cycle with lights on between 0500 h and 1700 h. The controlled temperature inside the housing room and the testing room was set at an average of 23.2 ± 0.5 °C and 22.9 ± 0.5 °C, respectively, with respective humidity levels of 48% and 52%. The rats had ad libitum access to food (LabDiet 5010, LabDiet, St. Louis, MI, USA) and purified water (in 500 mL drinking water bottles), and the cages were cleaned once a week. Visual health inspection was performed twice daily.

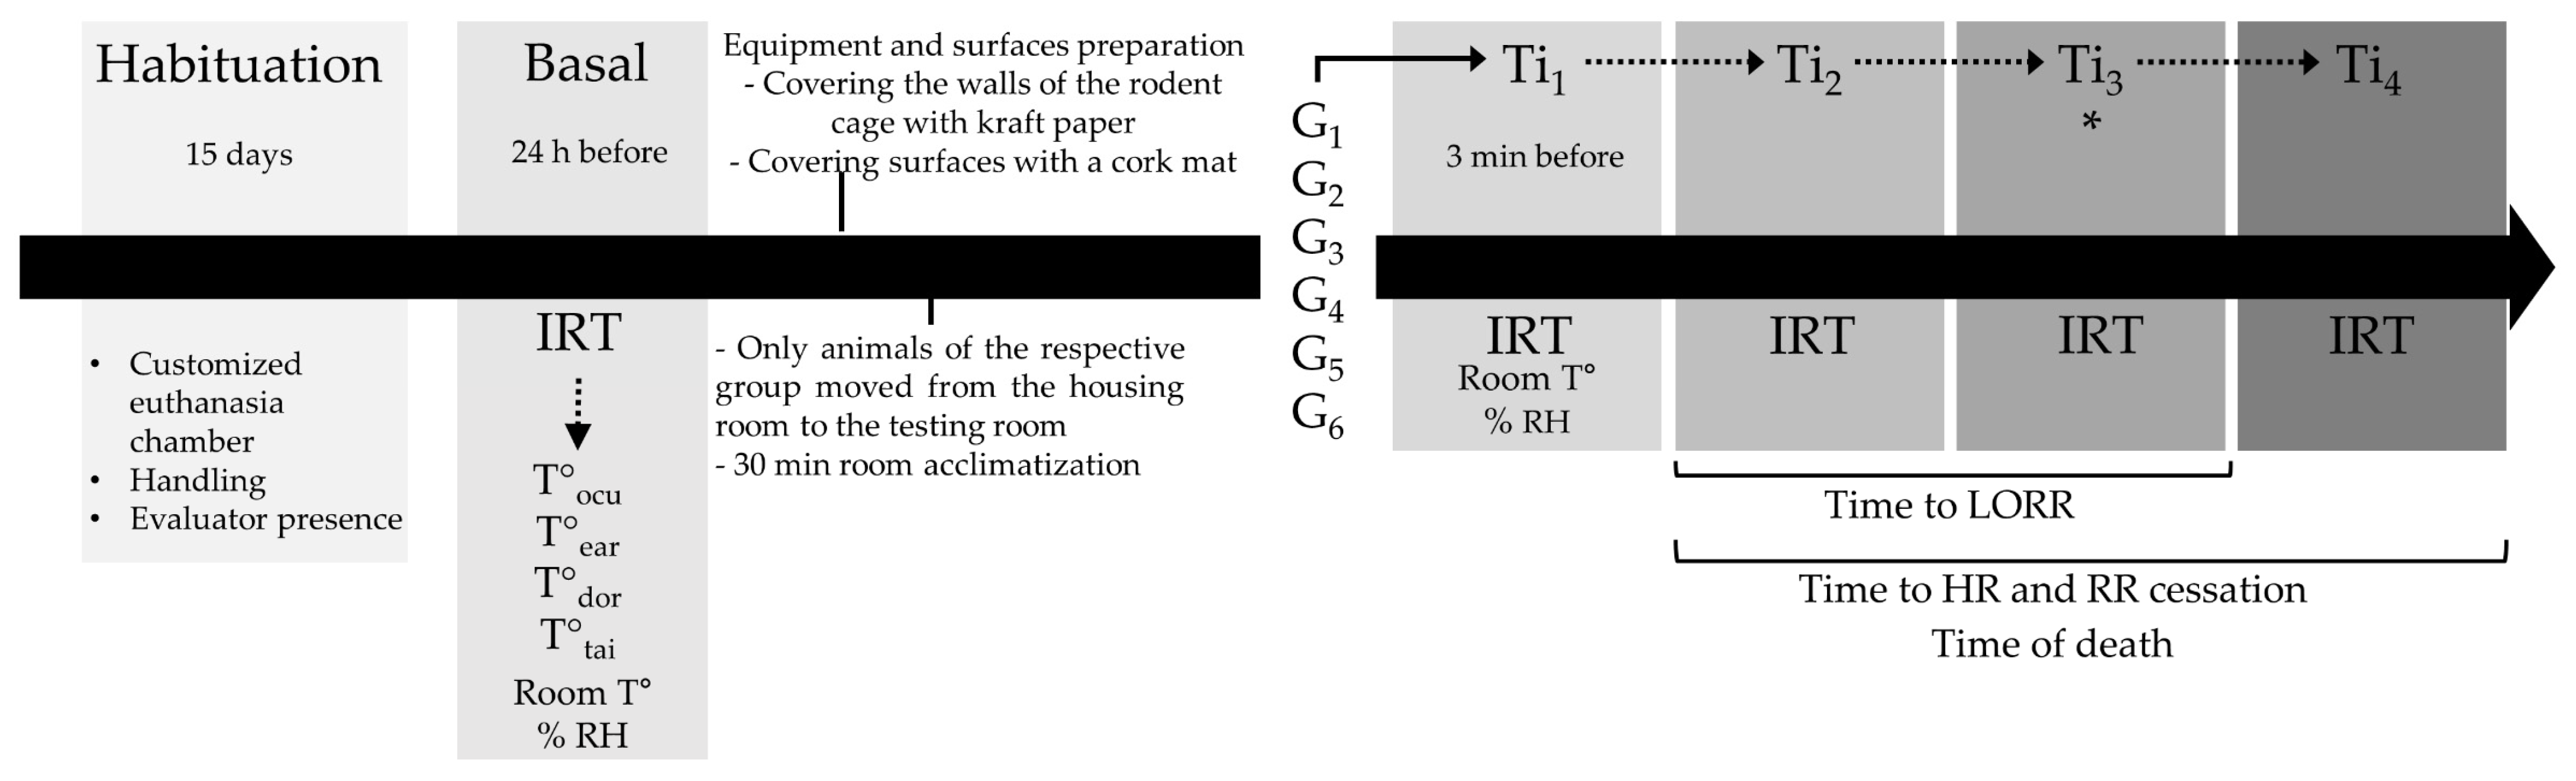
2.3. Experimental Design

This was an experimental prospective–comparative study. All measurements were performed by a single trained and unblinded evaluator. Once the rats were selected for the study, they underwent habituation for 15 days to the customized euthanasia chamber, handling, and the evaluator’s presence. The animals were randomly divided into six groups by number generation (Microsoft Excel; Microsoft 365). A total of 10 rats were assigned in each group (5 males and 5 females) as follows:
G1: Pentobarbital (Pentobarbital, Aranda®, Mexico City, Mexico) overdose at 400 mg/kg performed via IP injection with a 3 mL sterile syringe (Ambiderm®, Baja California, Mexico) following Lofgren et al. [48]’s procedure. The dose was calculated through a pilot study (no published data) using the minimal and maximal doses that appear in Reimer et al. [17]’s study. The selected dose resulted in rapid loss of consciousness, cardiorespiratory depression without excitation, loss of reflexes, and clinical death. G2: CO2 overdose administered inside a customized acrylic euthanasia chamber (Acrifactory, Mexico City, Mexico) (32.5 × 42 × 21 cm). The chamber had five gates with hermetically sealed doors that used neodymium magnets to avoid gas leaks. Each door was fitted to the size of the thermal camera lens to allow for thermal imaging (Figure 1). According to the AVMA [8], the flow rate was set at 30% of the chamber volume/min. G3: Decapitation using a rodent guillotine (51330, Senna, Mexico) [48]. G4: Inhalation of isoflurane (Fluriso, VET ONE®, Delhi, India) using the open-drop exposure method (two cotton swabs soaked with 2 mL of isoflurane each). The dose was calculated using the studies of Risling et al. [49] and de Brito [50] as a basis. The cotton swabs were placed where animals could not have direct contact with the inhalant anesthetic drug. G5: Ketamine (Ketamin-Pet, Aranda®, Mexico) + xylazine (Procin, Pisa Agropecuaria®, Nuevo México, Mexico) overdose administered at doses of 450 mg/kg IP and 45 mg/kg IP, respectively [8]. G6: Combination of ketamine (100 mg/kg IP) + CO2 (after 5–10 min of ketamine administration) [51].
Rats from all groups were assessed at five evaluation times. The basal time point represents assessment that was performed 24 h before the euthanasia method inside the housing room, and Ti1 represents three minutes before the application of the euthanasia in the test room. On the trial day, the rats were moved from the housing room to the test room, allowing for 30 min of rest and room acclimatization before starting the trial at Ti2, the time during the application of the method (e.g., while the animal received the IP dose of pentobarbital, ketamine + xylazine, or while it was inside the induction chamber or placed in the guillotine). Ti3 represents the time immediately after the application of the euthanasia method until loss of the righting reflex (LORR) as a sign of unconsciousness, and Ti4 represents the time until the cessation of breathing and heartbeat by visual assessment and assessment using a stethoscope (3M™ Littmann® Classic III™, 3M, Saint Paul, MN, USA). The absence of palpebral, interdigital, and righting reflex was also used to confirm the euthanasia method. It is noteworthy to mention that all groups, except G3 (decapitation), had the same five evaluation times. In G3, the separation of the head from the body and unconsciousness was considered the same event; therefore, only four evaluation times were considered for this group (basal, Ti1, Ti2, and Ti3).

2.4. Assessed Parameters

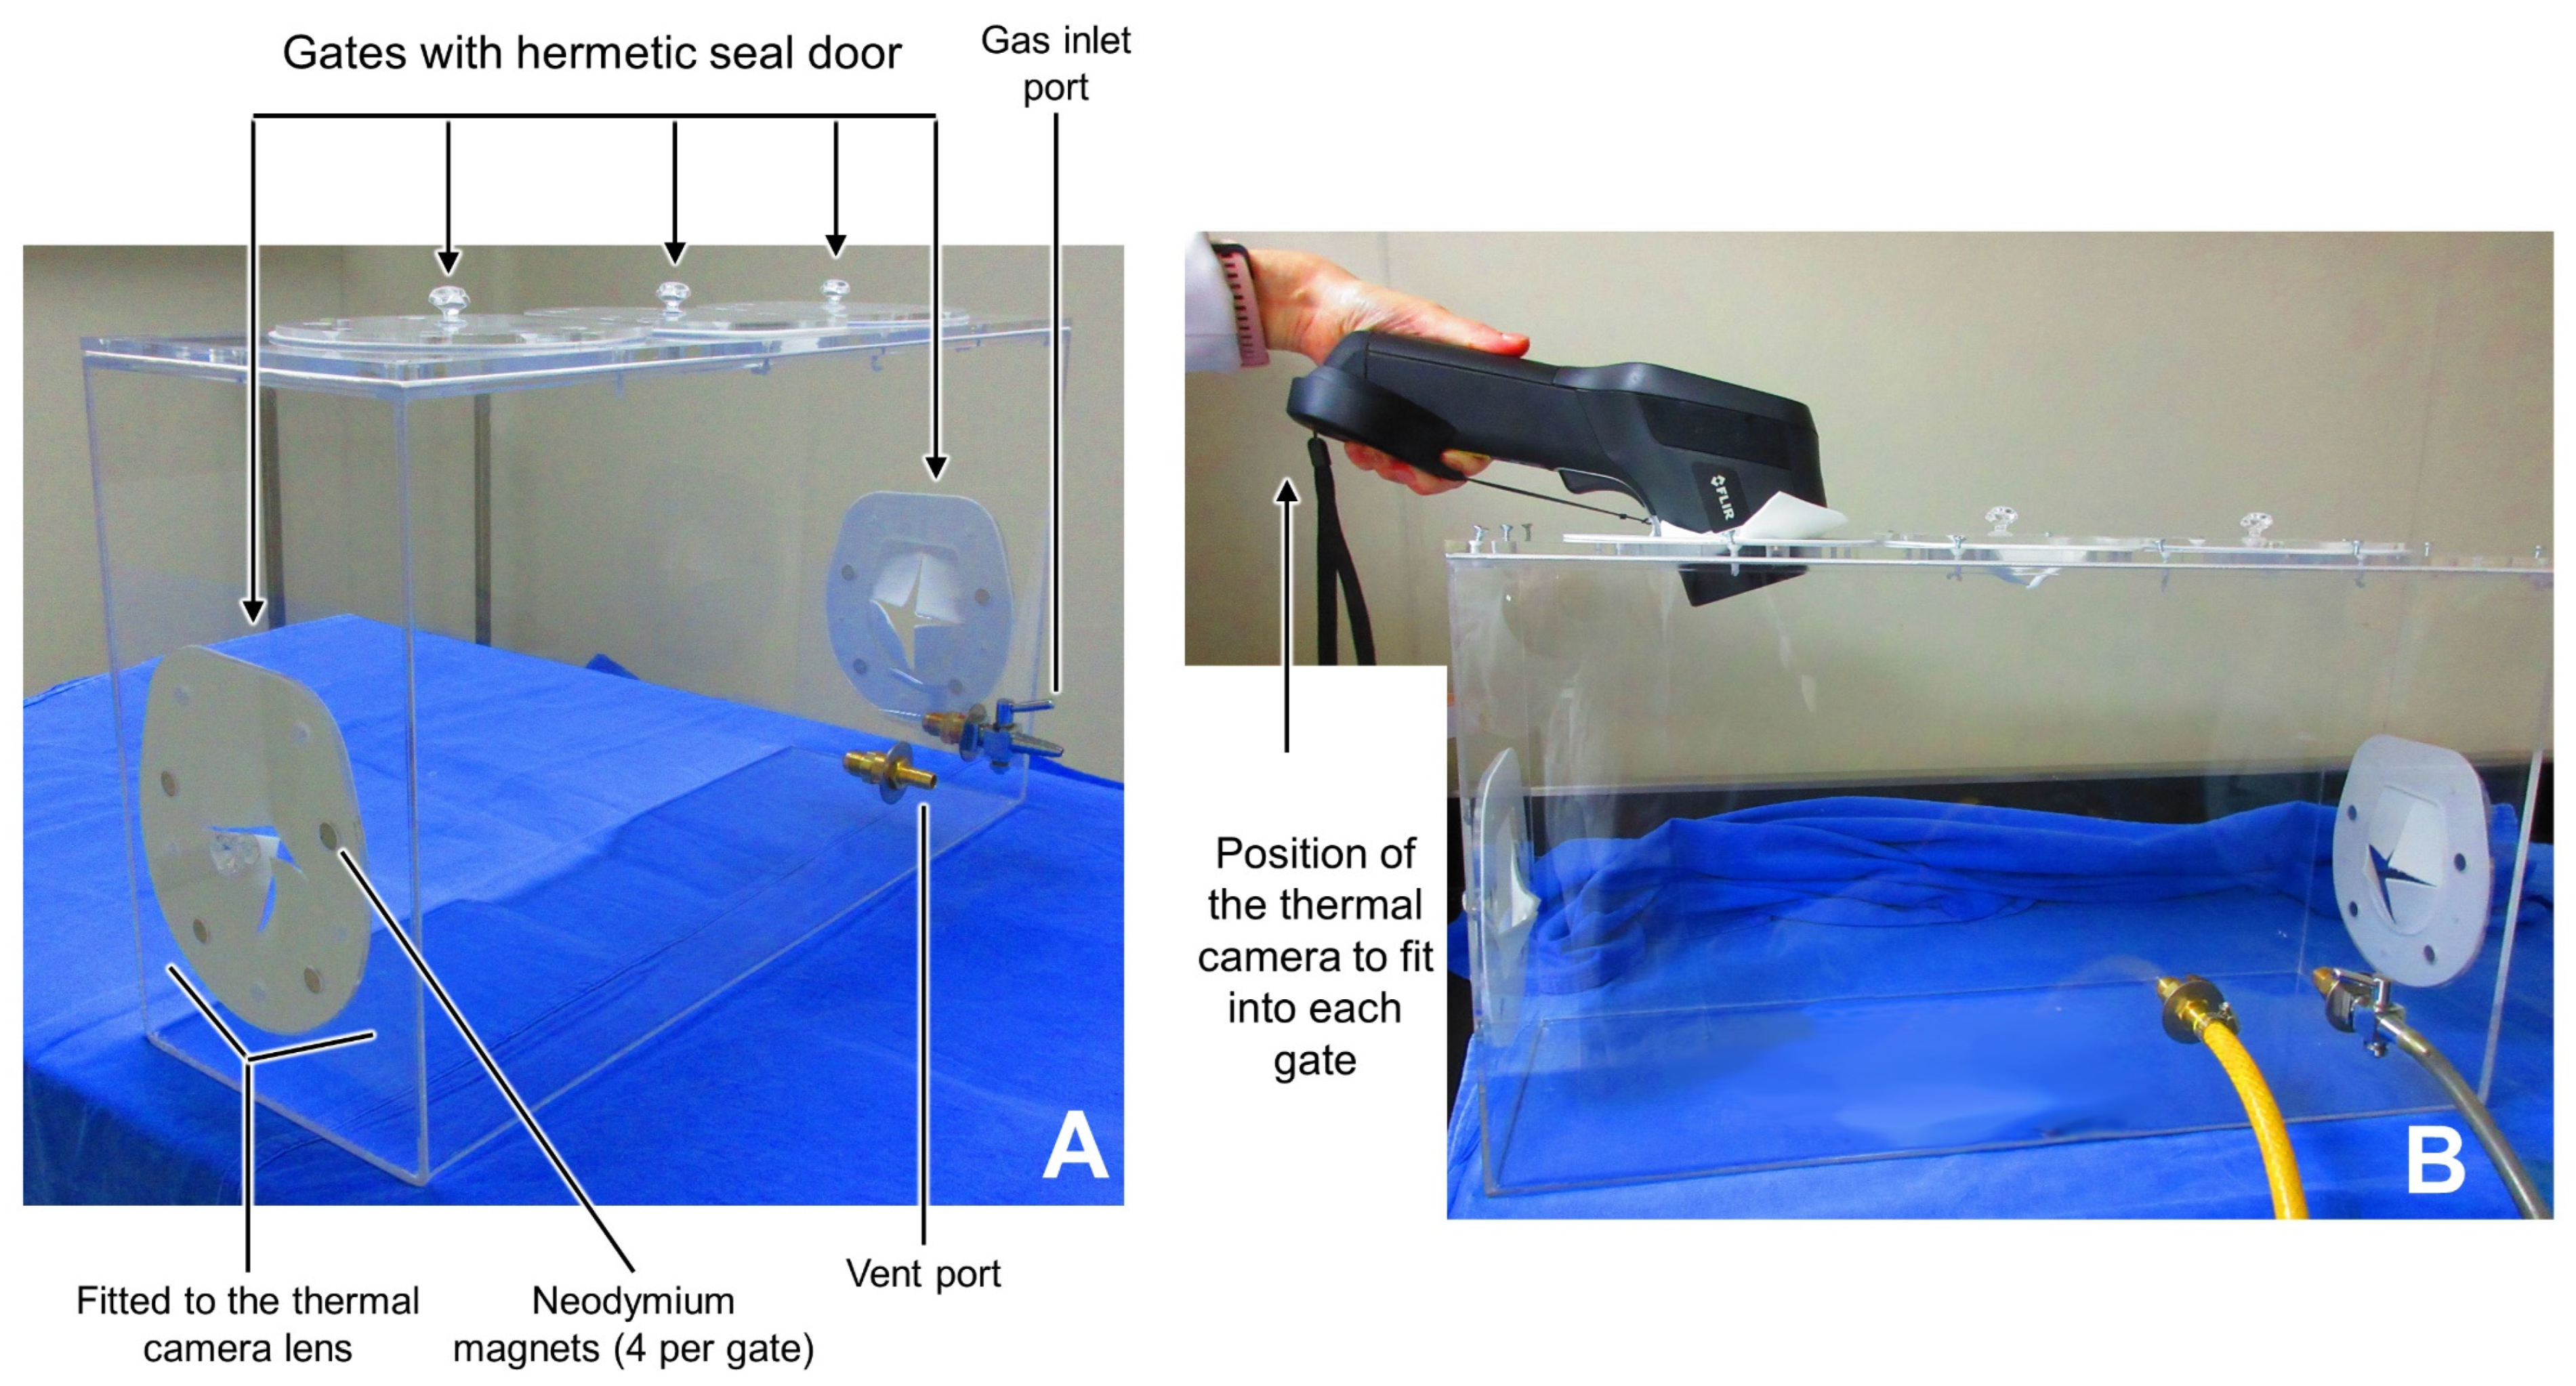
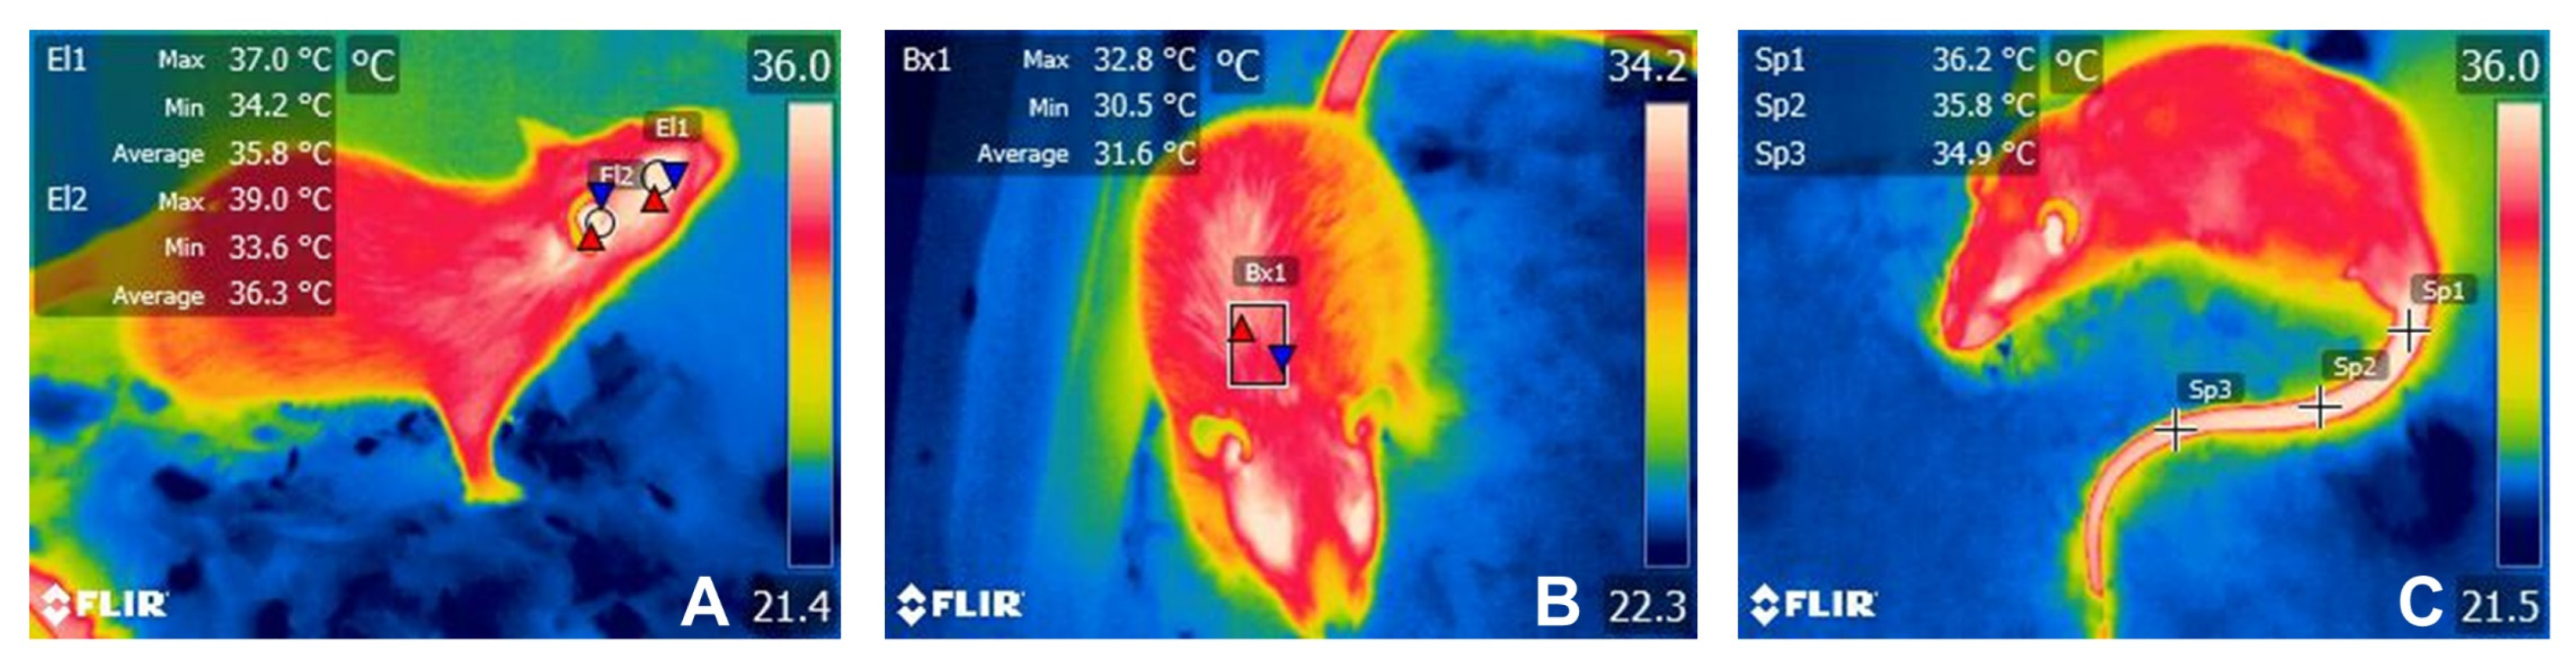
2.4.1. Infrared Thermography (IRT)

Thermal imaging was performed using an FLIR™ E60 camera (FLIR Systems, Orlando, FL, USA) positioned 1 m from the rats while maintaining a perpendicular angle to the subject (90°). Radiometric images were taken with an emissivity of 0.95, an IR resolution of 320 × 240 pixels, thermal sensitivity of <0.05 °C, and accuracy of ±2%. To prevent reflective heat affecting the acrylic cages placed in the housing room and the test room, the walls were covered with kraft paper. The handler used latex gloves when restraining the rats for IP injection and decapitation. Moreover, thermal imaging was performed at the same time of the day in all experimental groups (between 0800 h and 1500 h).
During basal, Ti1, Ti2, Ti3, and Ti4, the four evaluated body regions (or thermal windows) were the ocular (T°ocu), auricular (T°ear), interscapular (T°dor), and tail (T°tai) regions. Thermal imaging for T°ocu and T°ear was taken from the right side of the animals. The delimitation of these regions of interest (ROIs) is shown in Figure 2. The thermal images were processed with FLIR Tools software (FLIR Systems, USA) to obtain the maximum, minimum, and average temperatures for T°ocu, T°ear, and T°dor. For T°tai, only the average temperature in the proximal, medial, and distal parts of the tail was recorded. This is due to the delimitation of the ROI with a spot, which only provides the average value.

2.4.2. Time to Death

To record the duration of each euthanasia method, after Ti2, the evaluator started a timer to register the time of death, the time to LORR, and the time to the cessation of breathing (visual assessment) and heartbeat (thoracic auscultation). The results were expressed as seconds, and the average value ± standard deviation (SD) of the 10 animals per group was recorded on an evaluation sheet.

2.5. Procedures

After the 15-day habituation period and the random assignment of the rats into the six experimental groups, the procedures were performed as shown in Figure 3.
During the basal time point, IRT, as well as room temperature and relative humidity (% RH), was recorded inside the housing room of the selected experimental group with a wireless indoor and outdoor weather station with a hygrometer (Taylor®, Oak Brook, IL, USA). The equipment and surfaces were conditioned to IRT readings 24 h after by covering the walls of the polycarbonate cages with kraft paper and the use of wood shavings as bedding. The surfaces to place the guillotine, cages, and induction chamber were also covered by either sterile drapes or cork pads to avoid reflective heat. The rats from the corresponding group were moved from the housing room to the testing room so that euthanasia was not performed where the rest of the animals were housed. A period of 30 min was given to the rats to acclimatize them to the controlled temperature in the testing room and avoid stress related to transportation. Following this 30 min, the euthanasia method started. Room temperature, % RH, IRT, and time of death were recorded for each individual in all experimental groups.

2.6. Statistical Analyses

All analyses were performed using the GraphPad Prism 10.0.0 (San Jose, Ca, USA) statistical package. The Shapiro–Wilk test was performed to establish data normality in the data set collected from T°ocu, T°ear, T°dor, and T°tai. Descriptive statistics were obtained and results were expressed as mean ± standard deviation (SD). A linear mixed model for repeated measures was used to evaluate the effect of the six euthanasia methods (treatments G1, G2, G3, G4, G5, and G6) at the five time points (basal, Ti1, Ti2, Ti3, and Ti4) for each of the four thermal windows. Multiple comparison of means was performed with the post-hoc Tukey test. In every case, the significance level was set at p < 0.05. The following statistical model was used:
Yijk = µ + τi + τj+ τiτj + βk + eij
where the symbols indicate the following:
  • Y = variable response (IRT);
  • τi = fixed effect (G1, G2, G3, G4, G5, G6);
  • τj = evaluation times (basal, Ti1, Ti2, Ti3, and Ti4);
  • β = aleatory effect (rat);
  • µ = general mean;
  • e = error.
To determine if there were differences between males and females from each experimental group, repeated measure ANOVA was performed with a Greenhouse–Geisser correction and a post-hoc Tukey test for multiple comparisons. Time of death, time to LORR, and time to the cessation of breathing (visual assessment) and heartbeat (thoracic auscultation) were expressed as mean ± SD. To establish the correlation between the thermal windows, Pearson correlation coefficients were calculated. All values with p < 0.05 were considered significant.

3. Results

Differences in the thermal response of the rats grouped in different experimental groups were obtained according to the thermal window, assessing their maximum (T°max), minimum (T°min), and mean temperature (T°mean). In general, G2 and G4 registered significant differences between evaluation times and between groups in three of the four thermal windows. Additionally, G4 individuals showed a progressive increase in temperature in all thermal windows, in contrast to the other experimental groups.

3.1. Ocular Surface Temperature (T°Ocu)

Table 1 shows the mean and standard deviation (SD) values for the temperature of T°ocu. For T°max, T°min, and T°mean, differences among evaluation times were recorded in G2 (p = 0.0097) and G4 (p = 0.0001). For G2, a decrease in T°mean of up to 2.15 °C at Ti4 was observed when compared to basal values. Similarly, T°mean in G4 decreased by up to 5.82 °C at Ti2. Regarding differences between groups, a progressive temperature decline was registered in all euthanasia methods. However, differences between the groups were observed during Ti2 (p = 0.0007), Ti3 (p = 0.0002), and Ti4 (p = 0.0019), with the lowest T°mean values in G2 (33.79 ± 0.92 °C) and G4 (29.30 ± 1.23 °C) registered at Ti2.

3.2. Auricular Surface Temperature (T°ear)

Differences in T°mean between evaluation times were observed in G4 (p = 0.0011) (Table 2). When comparing Basal with Ti2, Ti3, and Ti4, a decrease in T°ear by 5.82 °C, 5.04 °C and 4.77 °C, respectively, was reported. Between groups, G2 and G4 individuals had the lowest T°mean (30.80 ± 2.83 °C and 29.0 ± 1.76 °C, respectively) and differed from the other groups at Ti2 (0.0005), Ti3 (p = 0.001), and Ti4 (p = 0.04).

3.3. Interscapular Surface Temperature T°Dor

Regarding T°mean of the interscapular region, differences between evaluation times were present in G1 (p = 0.007), G2 (p = 0.009), G4 (p = 0.001) and G6 (p = 0.004) (Table 3). G1 showed a difference of 1.4 °C when comparing Basal (32.46 ± 0.75 °C) vs. Ti1 (31.06 ± 0.82 °C), while a higher difference of 2.15 °C was obtained for G6 in Basal (32.21 ± 0.66 °C) vs. Ti4 (30.06 ± 0.67 °C). The inhalational agents recorded the lowest temperatures during Ti2 for G2 (29.08 ± 1.05 °C) and G4 (28.59 ± 1.28 °C), with temperature drops of 2.75 °C and 3.56 °C, respectively. Regarding differences by group, G2 and G4 significantly differed from the other four experimental groups at Ti2 (p = 0.0001), Ti3 (p = 0.001), and Ti4 (p = 0.0009). Particularly, G4 registered lower T°mean T°dor than G2 in the mentioned evaluation times (28.59 ± 1.28, 28.78 ± 0.91 and 29.10 ± 0.72 °C, respectively).

3.4. Tail Surface Temperature (T°Tai)

Table 4 shows the T°tai at the proximal (T°prox), medial (T°medial) and distal segment (T°distal). In general, all groups showed a progressive decrease in the temperature, starting at Ti2. In the T°prox, G1 Ti3 and Ti4 significantly differed (p = 0.005) from Ti1 and Ti2, having a minimum temperature of 27.99 ± 1.23 °C at Ti4. Ti2 and Ti3 of G3 showed significant differences (p = 0.004) from Ti1, while G4 significantly differed (p = 0.002) at Ti2, Ti3 and Ti4. In the T°medial of G1, all events differed from Basal values (p = 0.001), while Ti2 and Ti3 of G3 were statistical different from Basal and Ti1 (p = 0.002). Similarly to the T°prox, T°medial (p = 0.02), and T°distal (p = 0.02) of G4 differed at Ti2, Ti3 and Ti4, recording the lowest values at Ti2 for both tail segments (25.70 ± 0.51 °C and 25.27 ± 0.50 °C, respectively).
Between groups, significant differences were reported in Basal values of the three segments (p = 0.002, 0.001 and 0.005). Particularly, during Ti2 of the T°prox segment, differences were observed in G2 and G4 (p = 0.05), with the lowest T°tai of 26.14 ± 2.02 °C and 26.42 ± 0.51 °C, respectively.
Correlations between the four thermal windows and the experimental groups were obtained and are shown according to the experimental group in Supplementary Tables S1–S6. In all groups, significant (p < 0.001) and strong correlations (r > 0.96) were found between thermal windows.
Table 5 summarizes descriptive analysis of the recorded times (in seconds) for each group. Considering the total time of death, the longest duration was observed in G6, followed by G4 (294.2 ± 74.3) and G2 (390.2 ± 171.4). Similarly, cessation of RR and HR was longer in G6 and G4. The groups that reached LORR faster were G5 and G2 (67 ± 10.3 and 78 ± 29.0 s, respectively).

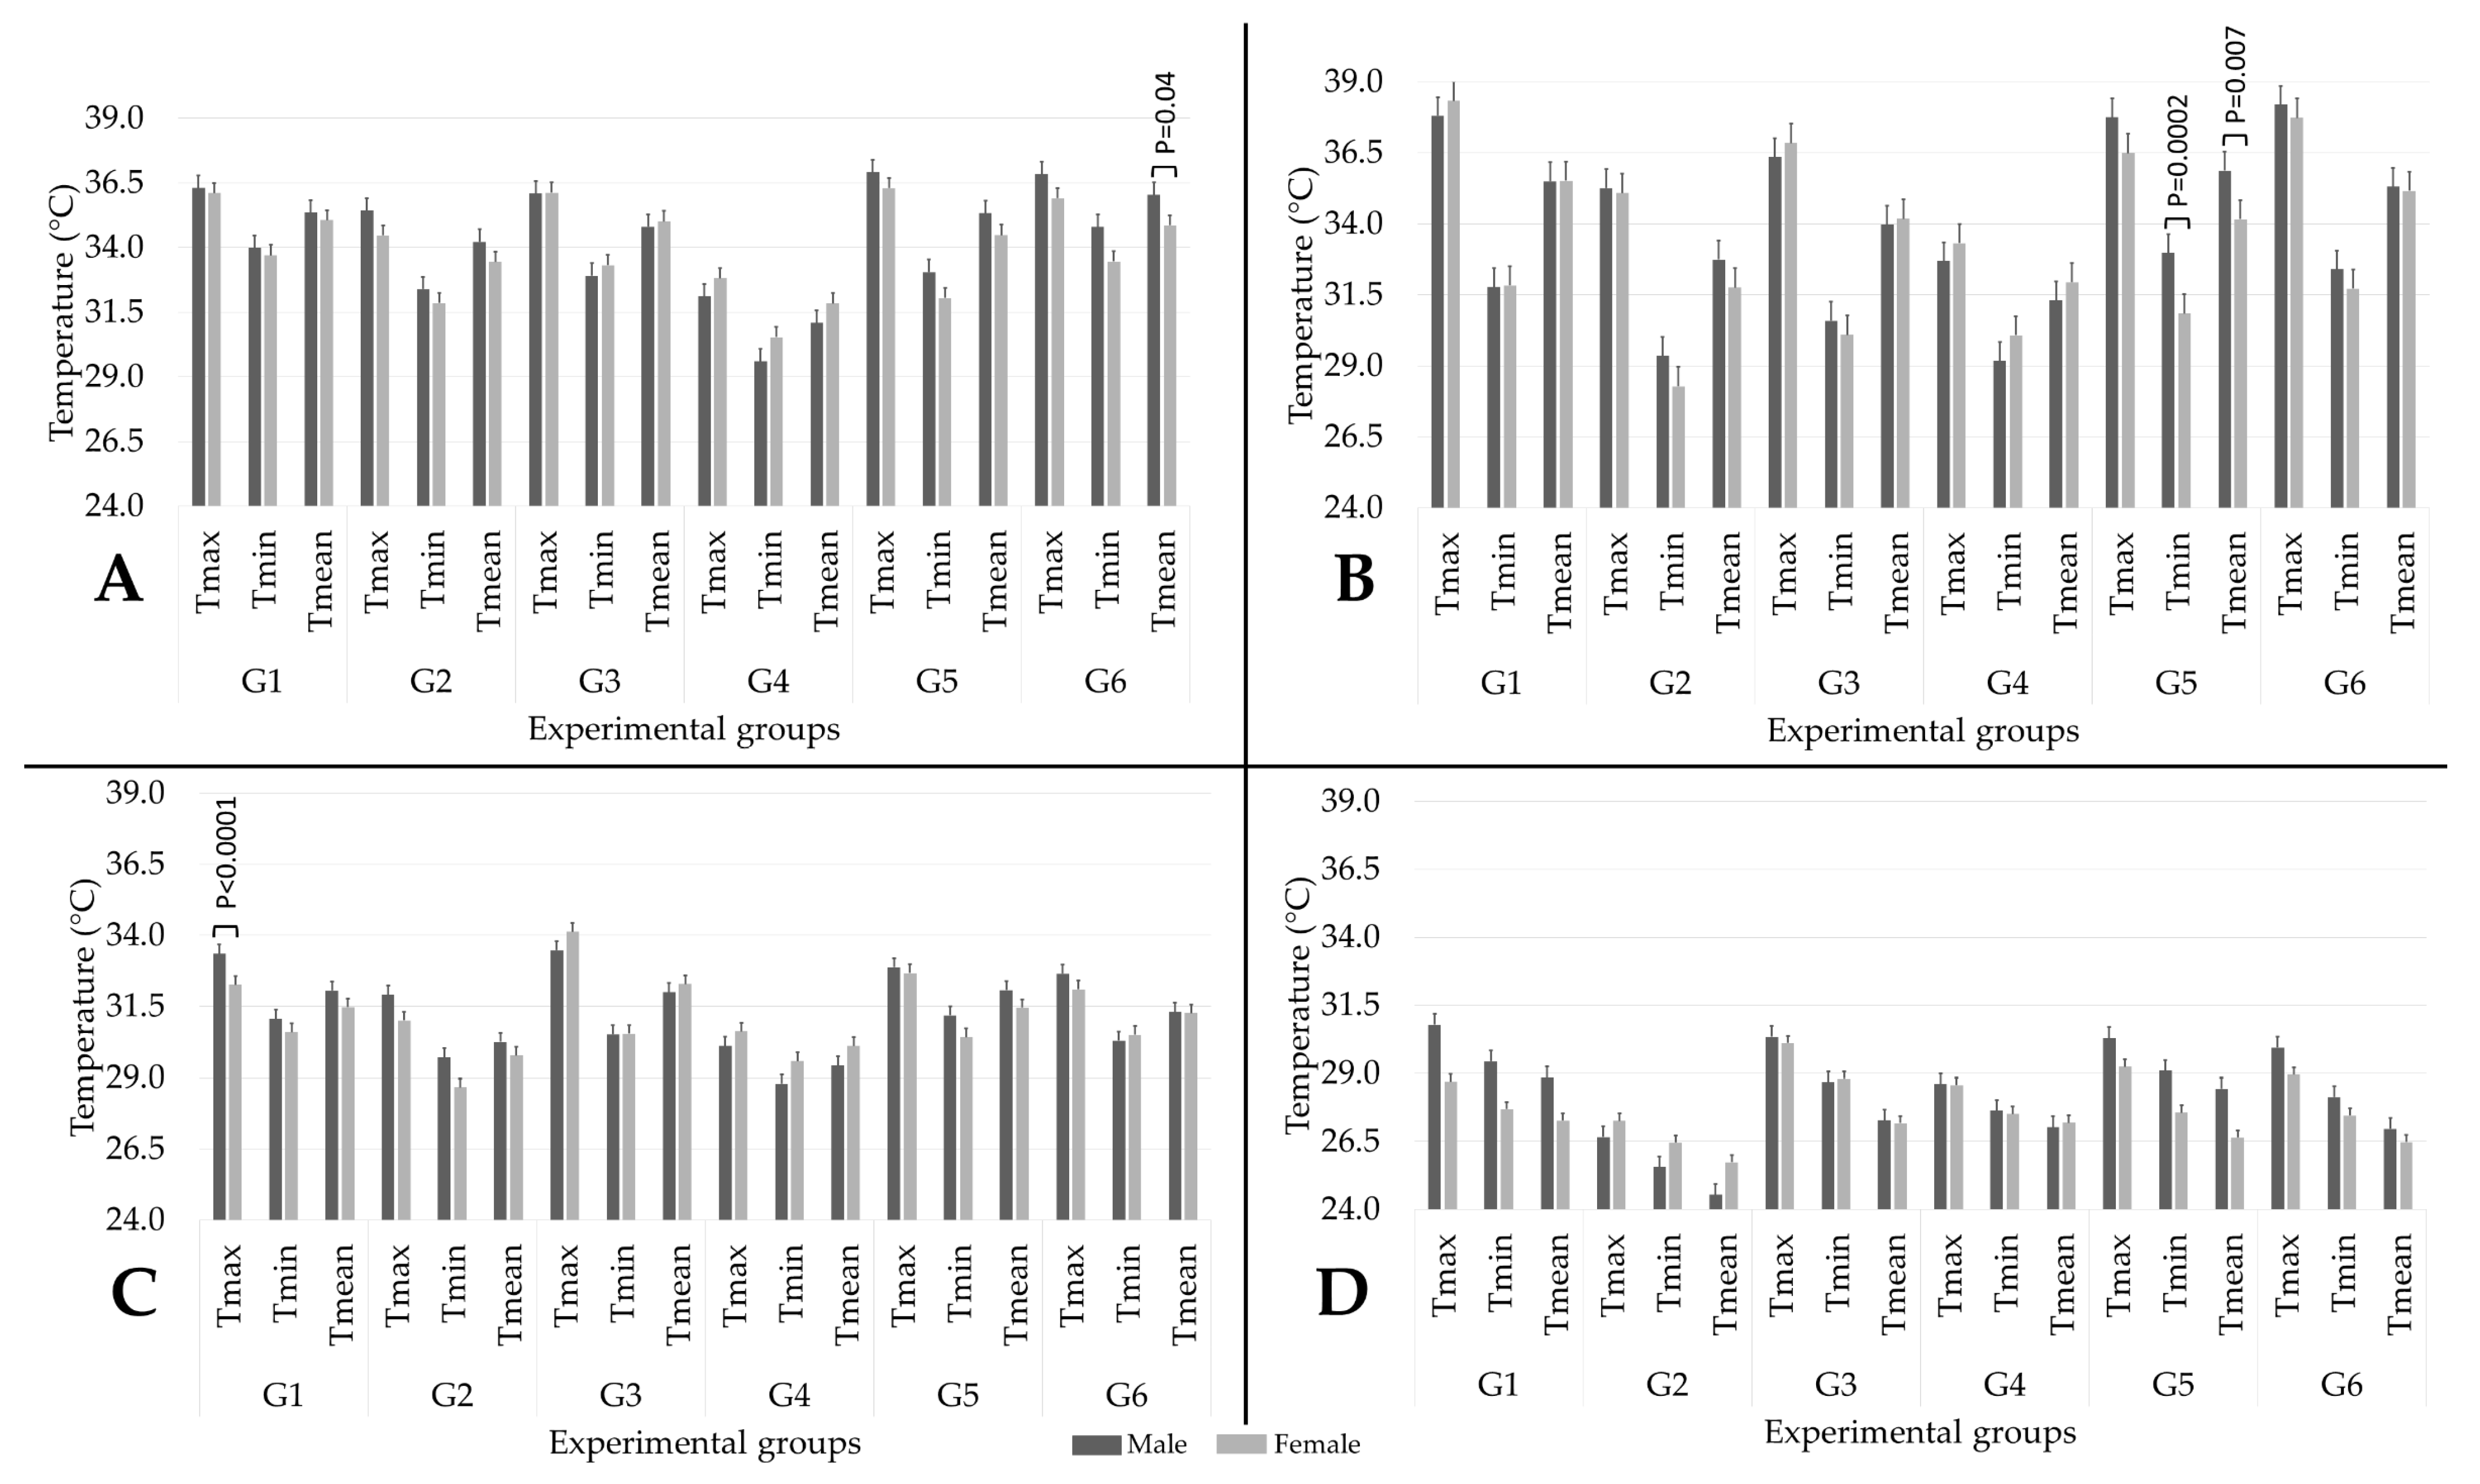
3.5. Effect of Sex on the Thermal Response of the Rats

Figure 4 illustrates the impact of sex on the temperatures of each thermal window according to the euthanasia methods. In general, no marked effect by sex was found in the present study. Only four statistically significant differences were registered for T°ocu, T°ear, and T°dor, while no effect was found on T°tai. For T°ocu (Figure 4A). A significant difference (p = 0.04) was found in the Tmean of G6, where males had the highest temperatures (36.0 °C) in comparison to females (34.9 °C). However, a tendency to show a difference was observed in Tmax (p = 0.08) and Tmin (0.07). For T°ear (Figure 4B), temperatures between males and females significantly differed in terms of Tmin and Tmean for G5 (p = 0.002 and p = 0.007, respectively), finding the highest temperatures in males rather than females (33.0 and 35.9 °C vs. 30.8 and 34.2 °C, respectively). Figure 4C shows a statistical significance between sexes in terms of Tmax for G1 (p < 0.0001) for T°dor. G1 males registered a Tmax T°dor of 33.3 °C, while females recorded 32.2 °C.

4. Discussion

Based on the findings of this study, in contrast to injectable, physical, and combined euthanasia methods, inhalant agents (CO2 and isoflurane) resulted in substantial alterations in the T°ocu, T°ear, T°dor, and T°tai of Wistar rats. To date, there are no studies where IRT was used to evaluate different euthanasia methods or their effect on the thermal response of rats. However, studies addressing the mechanism of action of CO2 and isoflurane, as well as its overdose to induce euthanasia, have shown that both drugs trigger physiological stress and cardiovascular alterations in laboratory rodents [26]. Although both are considered safe, inexpensive, and effective methods to induce unconsciousness, the results obtained agree with previous findings suggesting that gases with anesthetic properties cause high levels of aversion and stress in mice and rats [15,52].
Before discussing the IRT results according to the thermal windows, the current literature regarding endocrine and behavioral changes after CO2 and isoflurane euthanasia in rats and mice suggests that the thermal response due to stress/distress could be associated with both methods. CO2 inhalation used in G2 rats induces hypercapnia, acidosis, and suppression of the synaptic potentials [52,53,54] and activates the stress-mediated sympathetic HPA and SAM axes [55]. This was corroborated by Borovsky et al. [56], who reported that exposure of rats to CO2 increased their blood pressure (50–60 mmHg) and NE concentration up to ten times in response to hypoxia. CO2 euthanasia at 10% is also related to distress due to a high exhibition of anxiety behavior in rats [11]. Moreover, aversion to high concentrations of CO2 (more than 40% of the induction chamber volume) is potentially associated with carbonic acid formation in the mucous membranes, causing irritation and discomfort behaviors such as spinning and pawing in rodents [57]. Acute exposure of mice to CO2, increased NE and adrenocorticotropic hormone (ACTH) levels [55], and studies in outbred mice and rats have shown that CO2 inhalation increases total serum protein levels, a biomarker associated with stress [58]. In contrast, Hackbarth et al. [59] found no behavioral signs of distress or endocrine alterations (ACTH and corticosterone) in rats undergoing CO2 euthanasia.
Studies comparing the effect of both CO2 and isoflurane euthanasia have also shown different results. Isoflurane administered in G4 rats is a volatile anesthetic that causes depression in the cardiorespiratory centers, leading to hypoxemia and death [26,60]. Although isoflurane has been considered as a method of CO2 euthanasia refinement [14,15], in comparison with CO2 and other volatile anesthetics, isoflurane has mild pungency [61], causing more aversion responses in laboratory rodents that is possibly due to airway irritation [52,62], air hunger, and dyspnea [52].
Powell et al. [57] found that the use of isoflurane during euthanasia increased anxiety-related behaviors, agitation scores, and corticosterone concentrations in mice compared to the low CO2 flow rate (30%), the same one used in the present research. Boivin et al. [63] compared isoflurane anesthesia followed by CO2, CO2, and barbiturates administration as euthanasia methods in mice. The authors found that, according to ACTH concentrations, barbiturates were less stressful than the other two methods. Nonetheless, cardiovascular alterations and pain/stress-related responses did not differ in the three methods, suggesting that isoflurane does not provide benefits above CO2 euthanasia. In this sense, Valentine et al. [64] reported that a combination of isoflurane and CO2 caused more signs of distress in mice and that CO2 alone has less evidence of stress in the animals.
In contrast to what was mentioned, Makowska and Weary’s [15] study reported that CO2 and inhalant agents are aversive to rodents, though the aversion is lower for isoflurane. Likewise, exposure to high concentrations of CO2 increased adrenaline and noradrenaline concentrations compared to isoflurane euthanasia. This could be indicative of a stress response, but since no stress-related behaviors (grooming, audible vocalizations) were reported in the CO2 group, CO2 could not be considered as more stressful than isoflurane [6]. In rats, Zardooz et al. [65] found that plasma corticosterone and insulin levels increased in rats exposed to CO2, while isoflurane caused a contrary reaction. In Hickman et al. [55]’s research, ACTH, corticosterone, and noradrenaline levels were detected in rats anesthetized with isoflurane; however, the increase was not as significant as with CO2.
The present study did not assess behavioral or endocrine parameters to associate the thermal response of rats to the different euthanasia methods. However, the literature shows that both methods trigger stress-related responses that have physiological consequences for the organism, which can be associated with temperature variations according to the thermal window.

4.1. T°ocu

A significant increase in the T°mean of T°ocu from Ti2 to Ti3 and from Ti2 to Ti4 in G2 and G4, respectively, was observed in the rats. The stress-mediated thermoregulatory impairment that CO2 and isoflurane cause on thermosensitive neurons due to the acidosis and hypoxic effect [66,67] could explain the increase in T°ocu.
Several studies have shown that epinephrine, NE, ACTH, and corticosterone levels increase after CO2 and isoflurane exposure due to the potential stress that both drugs cause [6,68,69,70]. Although the present study did not consider these biomarkers for evaluation, their release modifies the vasomotor reaction of the microvasculature, inducing vasodilation in key organs (e.g., the eye) and an increased amount of dissipated heat, registered as higher IRT temperatures [29,71] like the ones observed in T°ocu for G2 and G4 rats.
Ocular surface temperature in animals has been used as a thermal window to assess acute stress and pain, indicated by a recorded increase in both cases [72,73]. To the authors’ knowledge, there are only two studies combining IRT and the effect of isoflurane as an anesthetic [30,74], though these studies did not compare CO2 and isoflurane as a euthanasic. Gjendal et al. [30] determined that, from three different types of stimulus, isoflurane anesthesia in mice had a marked stress response due to the alterations in ocular temperature. Similarly, Vogel et al. [74] used isoflurane anesthesia and found that ocular temperature changed according to the isoflurane concentration and that this temperature also reflects rectal temperature in rodents. Nonetheless, no association was made with stress.
Conversely, while there is no published evidence on euthanasia and ocular IRT, an increase in ocular temperature was reported in wild rodents (Apodemus mystacinus) as a reflection of SIH during the manipulation of individuals [33] during a fear-conditioned test in rats (increasing the eye temperature by up to 1.5 °C) [75], while in mice SIH and active behaviors were positively correlated [76]. Furthermore, in guinea pigs, the ocular temperature increased in relation to negative human interaction (petting) [77]. Similarly, Wongsaengchan et al. [78] used eye temperature to assess acute exposure to a stressor (small cage, handling, and restraint cone). The authors found significant increases in the left ocular temperature of females during restraint, together with corticosterone increases.
The data suggest that the peripheral vasomotor changes might respond to the flight–fight response when exposed to a stressor. Increases in T°ocu from Ti2 in all experimental groups suggest that rats perceived stress regardless of the euthanasia method. Nonetheless, knowing that CO2 and isoflurane inhalation might trigger stress-mediated pathways, this could explain the significant changes observed only in G2 and G4 from the application of the drug to LORR, probably due to an increased stress response. Finally, although both groups showed significant increases in T°ocu, G2 and G4 maintained overall lower temperatures than the rest of the groups, possibly due to heat loss facilitation due to the vasodilator properties of both drugs [53]. A similar result was obtained in Gjendal et al. [30]’s study, where isoflurane anesthesia in mice led to a reduction in T°max due to the hypothermia caused by general anesthetics.

4.2. T°ear

Comparable to T°ocu, significant increases in the T°mean of T°ear from Ti2 were observed in both inhalant groups (G2 and G4). This pattern was expected because ear temperature assessed at the external ear canal is associated with the carotid artery and hypothalamic temperature, the main structure involved in central and peripheral thermoregulatory adaptations [79], particularly when exposed to stressors. Studies conclude that CO2 and isoflurane exert acute stress in rodents [52,55,58].
In animals, auricular temperature was associated with stress due to the administration of intraperitoneal drugs and restraining techniques in Wokke [34]’s study, as well as in rabbits during handling [80]. In rats, increases ranging between 0.8 and 1.5 °C were observed during conditioned fear reactions [75]. In the present study, in all experimental groups, an increase in the T°mean of T°ear was observed. However, only CO2 and isoflurane caused significant increases. This response and its association with previously reported behavioral and endocrine responses with CO2 and isoflurane euthanasia/anesthesia might cause SIH. Since authors such as Hutu et al. [36] have concluded that superficial ear temperature is correlated to core temperature (around 37.1 ± 0.2 °C), the increase in T°ear could be the reflection of SIH in G2 and G4.
In contrast to the reported findings, some studies have not found significant changes or decreases in the ear temperature of mice and rats. This might be because of the lack of arteriovenous anastomosis present in other species, such as rabbits [81]. Additionally, conflicting results can be derived from the thermal window delimitation used by other authors (e.g., external ear canal or auricular pavilion).

4.3. T°dor

An expected increase in T°mean values recorded for T°dor after the administration of the euthanasia method was found in all experimental groups. Particularly, significant differences were reported in G2 and G4, maybe due to the induced acute stress that CO2 and halogenated anesthetics induce in rats. In the anatomical region where T°dor was evaluated, large amounts of BAT can be found [37]. This thermogenic tissue responds to NE release. Borovsky et al. [56] and Hickman [55] reported NE increases after exposure of rats and mice to CO2 and isoflurane as potential stressors.
Due to these elements the interscapular region was used in the present research to determine the effect of the different euthanasia methods, finding that G2 and G4 had significant increases in BAT activity. Similarly, a study by Blenkuš [42] reported the highest dorsal superficial temperatures in mice exposed to stressors (daily handling) and behavioral tests (voluntary interaction and elevated plus maze). Miyazono et al. [82] found that body surface temperature (assessed in the dorsal region of mice) increased after acute stress (e.g., reaction to a predator odor), while SIH is also related to BAT thermogenesis in rats and humans after excessive stress [40]. Pain perception in spinal lesion murine models has also shown increases in interscapular temperature, an effect that can be lessened with the administration of analgesic drugs [43].
Therefore, the data suggest that the significant local hyperthermia detected in T°dor of G2 and G4 subjects could be perceived as a negative stimulus, particularly in both experimental groups.

4.4. T°tai

A progressive reduction in T°tai was observed for T°prox, T°medial, and T°distal, regardless of the experimental group. This is due to the vasoconstrictor effect of catecholamines on the microcirculation of peripheral regions such as the tail and paws, as well as the subsequent reduction in radiated heat detected by IRT [29,41].
In different studies, the superficial temperature of the tail has been used to assess stress and the emotional responses of laboratory rodents, where the effect is a reduction from basal values after the exposure of the stressor, as found in the present research. Exposure to stressors such as handling and restraint have been shown to reduce the tail temperature of rats [83]. Fear-conditioned rats registered a gradual decrease in tail surface temperature of up to 5.3 °C [75], while the temperature in the tail also decreased in mice during an elevated plus maze test as a result of stress and anxiety [32]. Likewise, Blenkuš et al. [42] reported decreases in tail temperature after 30–60 s of exposure to a stressor (daily handling, voluntary interaction test, and elevated plus maze test). Furthermore, Weitkamp [83] has mentioned that T°tai can not only serve to identify acute stressors, but also provides insight into their intensity. This is relevant and consistent with the present results because, even though all euthanasia methods resulted in thermal changes associated with stress, only the inhalant agents caused significant effects in T°tai and all thermal windows.
Although a reduction in T°tai was reported in all euthanasia methods (confirming that euthanasia elicits stress-related changes regardless of the method), significant decreases were observed in G2 and G4, and the lowest T°tai values were recorded in both groups. This could be due to the potent vasodilation properties of CO2 and isoflurane [53,84], triggering a circulatory shift to restrict peripheral circulation (T°tai) and redirect the blood flow to central sites (T°ocu, T°ear, and T°dor).

4.5. Effect of Sex on the Thermal Response of Animals during Euthanasia Methods

The results obtained when evaluating the effect that sex has on the thermal response showed, in general, no marked differences between males and females. In total, four statistical differences were found in G6 for T°ocu, G5 for T°ear, and G1 for T°dor, showing an inconsistency in the results. This agrees with what was reported by Zevgolis et al. [33] regarding the eye temperature of mice, where no differences by sex were found.
In contrast, Faraji and Metz [28] reported differences between male and female mice. Females exposed to rearing deprivation as a stressor exhibited increased superficial temperature in the head and the back and a decrease in tail temperature, while males did not have differences. Another study from the same authors concluded that rats also show temperature differences when evaluated through IRT and that the stress responses of males and females differ depending on the sex of the experimenters [85]. Likewise, apart from the differences reported between females and males, the temperature of a specific thermal window can also differ depending on the sex, as shown in a study where, according to IRT, females were prone to show an exacerbated stress response to restraint [78].
A possible explanation for the lack of significant differences between males and females in the present study could be due to the short period of evaluation used for each euthanasia method. Euthanasia times are (and must be) short so as to avoid high levels of stress. Although, as shown in Table 5, G4 (294.2 ± 74.3 s) and G2 (390.2 ± 171.4) were two of the three euthanasia methods with longer time of death, this time might not have permitted the finding of differences according to sex. Powell et al. [57] mention that rodents require at least two minutes of stressor exposure to increase corticosterone values in response to stress. Nonetheless, since IRT has not been previously evaluated during euthanasia methods considering both sexes, future research needs to consider these factors.

4.6. Time of Death and Additional Findings

Regarding the time of death, time of LORR, and cessation of RR and HR, the times obtained in the six experimental groups are in accordance with previous studies evaluating time of death with pentobarbital [18], CO2 [86], decapitation [87], isoflurane [6], and ketamine + xylazine [8].
Lastly, a distinct pattern and pronounced difference between G4 and the rest of the experimental groups should be noted. T°ocu, T°ear, T°dor, and T°tai for G4 rats showed a progressive increase in the surface temperature from Ti2 to the death of the animals, apart from recording the lowest temperatures from Ti2 to Ti4 when compared to the other five groups. In contrast, animals from the other groups, including G2, presented a temperature increase from Ti2 to Ti3 and a subsequent decrease in all thermal windows. This suggests that the anesthetic stress and physiological response triggered by isoflurane is more marked than that induced by other inhalant, injectable, and physical methods of euthanasia. The present results are in agreement with what other authors have stated regarding isoflurane as a refinement method for CO2 [52,62] and affirm that precautions should be taken when deciding to use isoflurane as a sole method for the humane killing of research animals.

4.7. Limitations and Future Recommendations

The main limitation of the current study, and a field for complementary research using IRT aimed to evaluate euthanasia methods, is the lack of monitoring using physiological markers such as NE, ACTH, corticosterone, glucose, and other parameters (e.g., rectal temperature) that have been reported to increase their concentration during the application of different types of euthanasia [26,55]. Moreover, histological analyses could also help to identify the possible tissular changes associated with an inflammatory response to different drugs, providing additional information according to the euthanasia method. Additionally, analyzing the time of death, IRT response, and other biomarkers could help to understand the influence of the application speed and the thermal response of rodents. In the present study, the novel conception of an anesthesia induction chamber designed to allow for IRT readings during inhalant euthanasia is a valuable tool that might serve to further assess how euthanasia drugs, in combination with other physiological, endocrinal, and behavioral parameters, can contribute to the refinement of animal research.
In this sense, an important finding of the present study that can be considered for future research as a refinement in euthanasia procedures in Wistar rats is the combination of injectable agents and CO2. As the results showed, contrary to the use of CO2 alone, the combination administered in G6 diminished the thermal alterations observed in G2. This could be due to the sedative properties of ketamine before CO2 exposure, antagonizing NMDA receptors, modulating neuronal activity, and reducing the discomfort sensation with CO2 [88,89]. This could prevent physiological responses due to induced hypoxia, acidosis, and stress-related changes [12].
Regarding the non-significant effect of sex in the thermal response of the subjects, the contrasting information between the present results and the published literature shows the complexity of using IRT as a tool to evaluate stress. For example, this variable and the other factors mentioned by Wongsaengchan et al. [78] (e.g., period of evaluation, sex, left/right side for the taking of thermal image) are important elements that need to be considered in further studies where IRT is intended to be used as a tool to improve the welfare of laboratory rodents. Similarly, the weight of rodents should also be considered when using IRT because the thermal response of animals might differ according to their energy reserves and metabolic activity (e.g., obesity in mammals is associated with increased depots of adipose tissue) [90]. Moreover, studies have shown that external traits such as coat color or type of fur can affect the amount of radiated heat [91]. In the present study we only used Wistar rats (white coat); however, when using IRT in other strains or species, these traits need to be addressed to objectively interpret thermal imaging.
Considering that IRT serves as a non-invasive method to assess the thermal response that can be associated with vasomotor changes due to sympathetic activation, IRT could be implemented as a complementary tool to evaluate stress under other conditions (e.g., heat stress). Likewise, pain assessment and even disease detection can be other fields where thermal imaging could be applied together with biomarkers and other technologies with the aim of improving laboratory animal welfare [24,29,30,31,73].

5. Conclusions

Based on the results obtained, it can be concluded that CO2 and isoflurane elicit stress-mediated thermal responses during rat euthanasia. In particular, isoflurane exposure might be a euthanasia method that causes potential distress, and this must be considered when deciding to use this drug as part of a euthanasic protocol. Refinement techniques such as the combination of ketamine + CO2 were shown to minimize the alterations observed with the sole use of CO2, but further research is required to perform a comprehensive evaluation of this alternative. Furthermore, the present study shows the usefulness of IRT as a non-invasive tool for the evaluation of euthanasia techniques and the thermal response of laboratory rodents. In this way, thermal imaging could be recommended together with other physiological, endocrinal, and behavioral parameters to assess and improve the welfare of research animals.

Supplementary Materials

The following supporting information can be downloaded at: https://www.mdpi.com/article/10.3390/ani13182820/s1, Table S1: Correlations “Pentobarbital” (G1); Table S2: Correlations “CO2 overdose” (G2); Table S3: Correlation “Decapitation” (G3); Table S4: Correlations “Inhalation of isoflurane” (G4); Table S5: Correlation “Ketamine” (G5); Table S6: Correlations “Combination of ketamine + CO2” (G6).

Author Contributions

A.D.-O., I.H.-Á., A.O.-H., J.V.-J., A.V.-M. and D.M.-R. contributed to conceptualization, writing, and proofreading. All authors have read and agreed to the published version of the manuscript.

Funding

This research received no external funding.

Institutional Review Board Statement

All procedures were approved by the Committee for the Care and Use of Laboratory Animals (INRLGII/CICUAL/014/2021) at the National Institute of Rehabilitation Luis Guillermo Ibarra Ibarra. The handling and care of the laboratory animals that were used to obtain the thermograms of this article were conducted in accordance with the recommendations of Mexican norm NOM-062-ZOO-1999 for laboratory animals, published by the Department of Agriculture, Rural Development, Fisheries and Alimentation. All dead animals were disposed of by incineration, following NOM-062-ZOO-1999.

Informed Consent Statement

Not applicable.

Data Availability Statement

The data presented in this study are contained within the article.

Acknowledgments

Adriana Domínguez-Oliva extends her gratitude to the National Council for Science and Technology (CONACYT) in Mexico for the Scholarship No. 1143774 awarded to her to pursue her master’s studies in Agricultural Sciences at Universidad Autónoma Metropolitana.

Conflicts of Interest

The authors declare that they have no conflict of interest.

References

  1. Hobson-West, P.; Davies, A. Societal Sentience: Constructions of the public in animal research policy and practice. Sci. Technol. Hum. Values 2018, 43, 671–693. [Google Scholar] [CrossRef] [PubMed]
  2. Domínguez-Oliva, A.; Hernández-Ávalos, I.; Martínez-Burnes, J.; Olmos-Hernández, A.; Verduzco-Mendoza, A.; Mota-Rojas, D. The Importance of Animal Models in Biomedical Research: Current Insights and Applications. Animals 2023, 13, 1223. [Google Scholar] [CrossRef] [PubMed]
  3. Matsuda, Y. Recent Trends in the Number of Laboratory Animals Used in Japan. Altern. Lab. Anim. 2004, 32, 299–301. [Google Scholar] [CrossRef] [PubMed]
  4. National Association for Biomedical Research. The Importance of Animal Testing in Biomedical Research. Available online: https://www.nabr.org/biomedical-research/importance-biomedical-research (accessed on 17 August 2021).
  5. Franco, N.H. Animal Experiments in Biomedical Research: A Historical Perspective. Animals 2013, 3, 238. [Google Scholar] [CrossRef]
  6. Marquardt, N.; Feja, M.; Hünigen, H.; Plendl, J.; Menken, L.; Fink, H.; Bert, B. Euthanasia of laboratory mice: Are isoflurane and sevoflurane real alternatives to carbon dioxide? PLoS ONE 2018, 13, e0203793. [Google Scholar] [CrossRef]
  7. Baumans, V. Use of animals in experimental research: An ethical dilemma? Gene Ther. 2004, 11, S64–S66. [Google Scholar] [CrossRef]
  8. American Veterinary Medical Association (AVMA). AVMA Guidelines for the Euthanasia of Animals; AVMA: Schaumburg, IL, USA, 2020. [Google Scholar]
  9. Makowska, I.J.; Weary, D.M. Using Rat Behavior to Assess Aversion to Euthanasia Agents. ALTEX 2012, 1, 465–467. [Google Scholar]
  10. Chisholm, J.M.; Pang, D.S.J. Assessment of Carbon Dioxide, Carbon Dioxide/Oxygen, Isoflurane and Pentobarbital Killing Methods in Adult Female Sprague-Dawley Rats. PLoS ONE 2016, 11, e0162639. [Google Scholar] [CrossRef]
  11. Hickman, D.; Fitz, S.; Bernabe, C.; Caliman, I.; Haulcomb, M.; Federici, L.; Shekhar, A.; Johnson, P. Evaluation of Low versus High Volume per Minute Displacement CO2 Methods of Euthanasia in the Induction and Duration of Panic-Associated Behavior and Physiology. Animals 2016, 6, 45. [Google Scholar] [CrossRef]
  12. Boivin, G.P.; Hickman, D.L.; Creamer-Hente, M.A.; Pritchett-Corning, K.R.; Bratcher, N.A. Review of CO₂ as a Euthanasia Agent for Laboratory Rats and Mice. J. Am. Assoc. Lab. Anim. Sci. 2017, 56, 491–499. [Google Scholar]
  13. Turner, P.V.; Hickman, D.L.; van Luijk, J.; Ritskes-Hoitinga, M.; Sargeant, J.M.; Kurosawa, T.M.; Agui, T.; Baumans, V.; Choi, W.S.; Choi, Y.-K.; et al. Welfare Impact of Carbon Dioxide Euthanasia on Laboratory Mice and Rats: A Systematic Review. Front. Vet. Sci. 2020, 7, 411. [Google Scholar] [CrossRef] [PubMed]
  14. De la Torre, C.; Jiménez, P.; Ramos, M.M.; De la Torre, G. Anestesia para colonoscopia: Anestesia inhalatoria con sevoflurano frente a anestesia intravenosa con propofol. Sanid. Mil. 2012, 68, 27–32. [Google Scholar] [CrossRef]
  15. Makowska, I.J.; Weary, D.M. Rat aversion to induction with inhalant anaesthetics. Appl. Anim. Behav. Sci. 2009, 119, 229–235. [Google Scholar] [CrossRef]
  16. Flecknell, P. Laboratory Animal Anaesthesia, 4th ed.; Elsevier: Kidlington, UK, 2016; p. 350. [Google Scholar]
  17. Reimer, J.N.; Schuster, C.J.; Knight, C.G.; Pang, D.S.J.; Leung, V.S.Y. Intraperitoneal injection of sodium pentobarbital has the potential to elicit pain in adult rats (Rattus norvegicus). PLoS ONE 2020, 15, e0238123. [Google Scholar] [CrossRef]
  18. Zatroch, K.K.; Knight, C.G.; Reimer, J.N.; Pang, D.S.J. Refinement of intraperitoneal injection of sodium pentobarbital for euthanasia in laboratory rats (Rattus norvegicus). BMC Vet. Res. 2016, 13, 60. [Google Scholar] [CrossRef]
  19. Hohlbaum, K.; Bert, B.; Dietze, S.; Palme, R.; Fink, H.; Thöne-Reineke, C. Impact of repeated anesthesia with ketamine and xylazine on the well-being of C57BL/6JRj mice. PLoS ONE 2018, 13, e0203559. [Google Scholar] [CrossRef]
  20. Wellington, D.; Mikaelian, I.; Singer, L. Comparison of ketamine-xylazine and ketamine-dexmedetomidine anesthesia and intraperitoneal tolerance in rats. J. Am. Assoc. Lab. Anim. Sci. 2013, 52, 481–487. [Google Scholar]
  21. Kongara, K.; McIlhone, A.; Kells, N.; Johnson, C. Electroencephalographic evaluation of decapitation of the anaesthetized rat. Lab. Anim. 2014, 48, 15–19. [Google Scholar] [CrossRef]
  22. Derr, R. Pain perception in decapitated rat brain. Life Sci. 1991, 49, 1399–1402. [Google Scholar] [CrossRef]
  23. Huggins, J.; Rakobowchuk, M. Utility of lacrimal caruncle infrared thermography when monitoring alterations in autonomic activity in healthy humans. Eur. J. Appl. Physiol. 2019, 119, 531–538. [Google Scholar] [CrossRef]
  24. Mota-Rojas, D.; Olmos-Hernández, A.; Verduzco-Mendoza, A.; Lecona-Butrón, H.; Martínez-Burnes, J.; Mora-Medina, P.; Gómez-Prado, J.; Orihuela, A. Infrared thermal imaging associated with pain in laboratory animals. Exp. Anim. 2021, 70, 1–12. [Google Scholar] [CrossRef] [PubMed]
  25. National Research Council. National Association for Biomedical Research Recognition and Alleviation of Pain in Laboratory Animals. Available online: https://www.ncbi.nlm.nih.gov/books/NBK32654/ (accessed on 1 September 2022).
  26. Nichols, K.E.; Holliday-White, K.L.; Bogie, H.M.; Swearingen, K.M.; Fine, M.S.; Doyle, J.; Tiesma, S.R. Cardiovascular and Metabolic Responses to Carbon Dioxide Euthanasia in Conscious and Anesthetized Rats. J. Am. Assoc. Lab. Anim. Sci. 2020, 59, 742–749. [Google Scholar] [CrossRef] [PubMed]
  27. López-Moraga, A.; Beckers, T.; Luyten, L. The effects of stress on avoidance in rodents: An unresolved matter. Front. Behav. Neurosci. 2022, 16, 983026. [Google Scholar] [CrossRef] [PubMed]
  28. Faraji, J.; Metz, G.A.S. Infrared Thermography Reveals Sex-Specific Responses to Stress in Mice. Front. Behav. Neurosci. 2020, 14, 79. [Google Scholar] [CrossRef]
  29. Verduzco-Mendoza, A.; Bueno-Nava, A.; Wang, D.; Martínez-Burnes, J.; Olmos-Hernández, A.; Casas, A.; Domínguez, A.; Mota-Rojas, D. Experimental Applications and Factors Involved in Validating Thermal Windows Using Infrared Thermography to Assess the Health and Thermostability of Laboratory Animals. Animals 2021, 11, 3448. [Google Scholar] [CrossRef]
  30. Gjendal, K.; Franco, N.H.; Ottesen, J.L.; Sørensen, D.B.; Olsson, I.A.S. Eye, body or tail? Thermography as a measure of stress in mice. Physiol. Behav. 2018, 196, 135–143. [Google Scholar] [CrossRef]
  31. Whittaker, A.L.; Muns, R.; Wang, D.; Martínez-Burnes, J.; Hernández-Ávalos, I.; Casas-Alvarado, A.; Domínguez-Oliva, A.; Mota-Rojas, D. Assessment of Pain and Inflammation in Domestic Animals Using Infrared Thermography: A Narrative Review. Animals 2023, 13, 2065. [Google Scholar] [CrossRef]
  32. Lecorps, B.; Rödel, H.G.; Féron, C. Assessment of anxiety in open field and elevated plus maze using infrared thermography. Physiol. Behav. 2016, 157, 209–216. [Google Scholar] [CrossRef]
  33. Zevgolis, Y.G.; Zannetos, S.P.; Akriotis, T. Physiological response of a wild rodent to experimental manipulations in its natural environment using infrared thermography. Hystrix It. J. Mamm. 2022, 33, 80–91. [Google Scholar] [CrossRef]
  34. Wokke, E.S. Refinement: Evaluating Stress and Accuracy of Different Intraperitoneal Techniques in Mice. Master’s Thesis, University of Utrecht, Utrecht, The Netherlands, February 2017. [Google Scholar]
  35. International Committee on Veterinary Gross Anatomical Nomenclature. Nomina Anatomica Veterinaria; World Association of Veterinary Anatomist: Hanover, Germany, 2017; pp. 1–178. [Google Scholar]
  36. Hutu, I.; Paras, I.; Gherghel, D.; Lungu, B.; Mircu, C. Application of Infrared Thermography in Rabbit Orthopaedic Models; Universitatea de Științe Agricole și Medicină Veterinară: Iași, Romania, 2018. [Google Scholar]
  37. Lezama-García, K.; Mota-Rojas, D.; Martínez-Burnes, J.; Villanueva-García, D.; Domínguez-Oliva, A.; Gómez-Prado, J.; Mora-Medina, P.; Casas-Alvarado, A.; Olmos-Hernández, A.; Soto, P.; et al. Strategies for Hypothermia Compensation in Altricial and Precocial Newborn Mammals and Their Monitoring by Infrared Thermography. Vet. Sci. 2022, 9, 246. [Google Scholar] [CrossRef]
  38. Mousovich-Neto, F.; Matos, M.S.; Costa, A.C.R.; Melo Reis, R.A.; Atella, G.C.; Miranda-Alves, L.; Carvalho, D.P.; Ketzer, L.A.; Corrêa da Costa, V.M. Brown adipose tissue remodelling induced by corticosterone in male Wistar rats. Exp. Physiol. 2019, 104, 514–528. [Google Scholar] [CrossRef]
  39. Jackson, D.; Hambly, C.; Trayhurn, P.; Speakman, J. Can non-shivering thermogenesis in brown adipose tissue following NA injection be quantified by changes in overlying surface temperatures using infrared thermography? J. Therm. Biol. 2001, 26, 85–93. [Google Scholar] [CrossRef] [PubMed]
  40. Kataoka, N.; Shima, Y.; Nakajima, K.; Nakamura, K. A central master driver of psychosocial stress responses in the rat. Science 2020, 367, 1105–1112. [Google Scholar] [CrossRef] [PubMed]
  41. Owens, N.C.; Ootsuka, Y.; Kanosue, K.; McAllen, R.M. Thermoregulatory Control of Sympathetic Fibres Supplying the Rat’s Tail. J. Physiol. 2002, 543, 849–858. [Google Scholar] [CrossRef] [PubMed]
  42. Blenkuš, U.; Gerós, A.F.; Carpinteiro, C.; de Aguiar, P.C.; Olsson, I.A.S.; Franco, N.H. Non-Invasive Assessment of Mild Stress-Induced Hyperthermia by Infrared Thermography in Laboratory Mice. Animals 2022, 12, 177. [Google Scholar] [CrossRef] [PubMed]
  43. Redaelli, V.; Papa, S.; Marsella, G.; Grignaschi, G.; Bosi, A.; Ludwig, N.; Luzi, F.; Vismara, I.; Rimondo, S.; Veglianese, P.; et al. A refinement approach in a mouse model of rehabilitation research. Analgesia strategy, reduction approach and infrared thermography in spinal cord injury. PLoS ONE 2019, 14, e0224337. [Google Scholar] [CrossRef]
  44. Gariepy, C.; Amiot, J.; Nadai, S. Ante-mortem detection of PSE and DFD by infrared thermography of pigs before stunning. Meat Sci. 1989, 25, 37–41. [Google Scholar] [CrossRef]
  45. Flores-Peinado, S.; Mota-Rojas, D.; Guerrero-Legarreta, I.; Mora-Medina, P.; Cruz-Monterrosa, R.; Gómez-Prado, J.; Guadalupe Hernández, M.; Cruz-Playas, J.; Martínez-Burnes, J. Physiological responses of pigs to preslaughter handling: Infrared and thermal imaging applications. Int. J. Vet. Sci. Med. 2020, 8, 71–84. [Google Scholar] [CrossRef]
  46. Diario Oficial de la Federación Normal Oficial Mexicana (NOM-062-ZOO-1999). Especificaciones Técnicas para la Producción, Cuidado y Uso de los Animales de Laboratorio. Available online: https://www.gob.mx/cms/uploads/attachment/file/203498/NOM-062-ZOO-1999_220801.pdf (accessed on 20 June 2023).
  47. Kovalcsik, R.; Devlin, T.; Loux, S.; Martinek, M.; May, J.; Pickering, T.; Tapp, R.; Wilson, S.; Serota, D. Animal reuse: Balancing scientific integrity and animal welfare. Lab. Anim. 2006, 35, 49–53. [Google Scholar] [CrossRef]
  48. Lofgren, J.L.; Foley, P.L.; Golledge, H.D.R. Anesthesia, analgesia, and euthanasia. In The Laboratory Rat; Suckow, M.A., Hankenson, R., Wilson, R., Foley, P.L., Eds.; Academic Press: London, UK, 2020; pp. 699–745. [Google Scholar]
  49. Risling, T.E.; Caulkett, N.A.; Florence, D. Open-drop anesthesia for small laboratory animals. Can. Vet. J. Rev. Vet. Can. 2012, 53, 299–302. [Google Scholar]
  50. de Brito, C.F.; Evangelista, A.A.; Felippe, R.M.; Cascabulho, C.; Fragoso, V.M.; de Oliveira, G.M. Laboratory Mice Euthanasia: Speed Death and Animal Welfare. Am. J. Biomed. Sci. Res. 2020, 8, 341–355. [Google Scholar] [CrossRef]
  51. Ko, M.J.; Mulia, G.E.; van Rijn, R.M. Commonly Used Anesthesia/Euthanasia Methods for Brain Collection Differentially Impact MAPK Activity in Male and Female C57BL/6 Mice. Front. Cell. Neurosci. 2019, 13, 96. [Google Scholar] [CrossRef] [PubMed]
  52. Kulkarni, S.; Hickman, D. Isoflurane and Carbon Dioxide Elicit Similar Behavioral Responses in Rats. Animals 2020, 10, 1431. [Google Scholar] [CrossRef] [PubMed]
  53. Xu, F.; Uh, J.; Brier, M.R.; Hart, J.; Yezhuvath, U.S.; Gu, H.; Yang, Y.; Lu, H. The Influence of Carbon Dioxide on Brain Activity and Metabolism in Conscious Humans. J. Cereb. Blood Flow Metab. 2011, 31, 58–67. [Google Scholar] [CrossRef]
  54. Leach, M.C.; Bowell, V.A.; Allan, T.F.; Morton, D.B. Degrees of aversion shown by rats and mice to different concentrations of inhalational anaesthetics. Vet. Rec. 2002, 150, 808–815. [Google Scholar] [CrossRef] [PubMed]
  55. Hickman, D.L. Interpreting Neuroendocrine Hormones, Corticosterone, and Blood Glucose to Assess the Wellbeing of Anesthetized Rats during Euthanasia. J. Am. Assoc. Lab. Anim. Sci. 2018, 57, 725–728. [Google Scholar] [CrossRef]
  56. Borovsky, V.; Herman, M.; Dunphy, G.; Caplea, A.; Ely, D. CO2 asphyxia increases plasma norepinephrine in rats via sympathetic nerves. Am. J. Physiol. Integr. Comp. Physiol. 1998, 274, R19–R22. [Google Scholar] [CrossRef]
  57. Powell, K.; Ethun, K.; Taylor, D.K. The effect of light level, CO2 flow rate, and anesthesia on the stress response of mice during CO2 euthanasia. Lab. Anim. 2016, 45, 386–395. [Google Scholar] [CrossRef]
  58. Khokhlova, O.N.; Borozdina, N.A.; Sadovnikova, E.S.; Pakhomova, I.A.; Rudenko, P.A.; Korolkova, Y.V.; Kozlov, S.A.; Dyachenko, I.A. Comparative Study of the Aftereffect of CO2 Inhalation or Tiletamine–Zolazepam–Xylazine Anesthesia on Laboratory Outbred Rats and Mice. Biomedicines 2022, 10, 512. [Google Scholar] [CrossRef]
  59. Hackbarth, H.; Küppers, N.; Bohnet, W. Euthanasia of rats with carbon dioxide-animal welfare aspects. Lab. Anim. 2000, 34, 91–96. [Google Scholar] [CrossRef]
  60. Hampton, A. Euthanizing agents. In Veterinary Pharmacology & Therapeutics; Riviere, J., Papich, M., Eds.; Wiley-Blackwell: Hoboken, NJ, USA, 2018; pp. 387–394. [Google Scholar]
  61. Sio, L.C.O.; Varbanova, M.; Bautista, A. Isoflurane: Mechanisms and applications. In Treatments, Mechanisms, and Adverse Reactions of Anesthetics and Analgesics; Rajendram, R., Patel, V.B., Preedy, V.R., Martin, C.R., Eds.; Elsevier: London, UK, 2022; pp. 101–108. [Google Scholar]
  62. Frost, K.; Shah, M.; Leung, V.S.Y.; Pang, D.S.J. Aversion to Desflurane and Isoflurane in Sprague-Dawley Rats (Rattus norvegicus). Animals 2020, 10, 950. [Google Scholar] [CrossRef] [PubMed]
  63. Boivin, G.P.; Bottomley, M.A.; Schiml, P.A.; Goss, L.; Grobe, N. Physiologic, behavioral, and histologic responses to various euthanasia methods in C57BL76NTac male mice. J. Am. Assoc. Lab. Anim. Sci. 2017, 56, 69–78. [Google Scholar] [PubMed]
  64. Valentine, H.; Williams, W.O.; Maurer, K.J. Sedation or inhalant anesthesia before euthanasia with CO2 does not reduce behavioral or physiologic signs of pain and stress in mice. J. Am. Assoc. Lab. Anim. Sci. 2012, 51, 50–57. [Google Scholar] [PubMed]
  65. Zardooz, H.; Rostamkhani, F.; Zaringhalam, J.; Faraji, S. Plasma corticosterone, insulin and glucose changes induced by brief exposure to isoflurane, diethyl ether and CO2 in male rats. Physiol. Res. 2010, 59, 973–978. [Google Scholar] [CrossRef]
  66. Angilletta, M.J.; Youngblood, J.P.; Neel, L.K.; VandenBrooks, J.M. The neuroscience of adaptive thermoregulation. Neurosci. Lett. 2019, 692, 127–136. [Google Scholar] [CrossRef]
  67. Wright, C.L.; Boulant, J.A. Carbon dioxide and pH effects on temperature-sensitive and -insensitive hypothalamic neurons. J. Appl. Physiol. 2007, 102, 1357–1366. [Google Scholar] [CrossRef]
  68. Creamer-Hente, M.A.; Lao, F.K.; Dragos, Z.P.; Waterman, L.L. Sex- and Strain-related Differences in the Stress Response of Mice to CO2 Euthanasia. J. Am. Assoc. Lab. Anim. Sci. 2018, 57, 513–519. [Google Scholar] [CrossRef]
  69. Moffitt, A.D.; Brignolo, L.L.; Ardeshir, A.; Creamer-Hente, M.A. The Role of Emotional Contagion in the Distress Exhibited by Grouped Mice Exposed to CO2. J. Am. Assoc. Lab. Anim. Sci. 2019, 58, 430–437. [Google Scholar] [CrossRef]
  70. Altholtz, L.Y.; Fowler, K.A.; Badura, L.L.; Kovacs, M.S. Comparison of the stress response in rats to repeated isoflurane or CO2:O2 anesthesia used for restraint during serial blood collection via the jugular vein. J. Am. Assoc. Lab. Anim. Sci. 2006, 45, 17–22. [Google Scholar]
  71. Nazari, S.; Kourosh-Arami, M.; Komaki, A.; Hajizadeh, S. Relative contribution of central and peripheral factors in superficial blood flow regulation following cold exposure. Physiol. Pharmacol. 2020, 24, 89–100. [Google Scholar] [CrossRef]
  72. Sutherland, M.A.; Worth, G.M.; Dowling, S.K.; Lowe, G.L.; Cave, V.M.; Stewart, M. Evaluation of infrared thermography as a non-invasive method of measuring the autonomic nervous response in sheep. PLoS ONE 2020, 15, e0233558. [Google Scholar] [CrossRef] [PubMed]
  73. Casas-Alvarado, A.; Mota-Rojas, D.; Hernández-Avalos, I.; Martínez-Burnes, J.; Rosas, M.; Miranda-Cortés, A.E.; Domínguez-Oliva, A.; Mora-Medina, P. Assessment of thermal response, cardiorespiratory parameters and postoperative analgesia in dogs undergoing ovariohysterectomy with different combinations of epidural anesthesia and isoflurane. J. Anim. Behav. Biometeorol. 2023, 11, e2023009. [Google Scholar] [CrossRef]
  74. Vogel, B.; Wagner, H.; Gmoser, J.; Wörner, A.; Löschberger, A.; Peters, L.; Frey, A.; Hofmann, U.; Frantz, S. Touch-free measurement of body temperature using close-up thermography of the ocular surface. MethodsX 2016, 3, 407–416. [Google Scholar] [CrossRef] [PubMed]
  75. Vianna, D.M.L.; Carrive, P. Changes in cutaneous and body temperature during and after conditioned fear to context in the rat. Eur. J. Neurosci. 2005, 21, 2505–2512. [Google Scholar] [CrossRef]
  76. Nijland, N. The Influence of Different Types of Behaviour on the Eye Temperature of Mice using Infrared Thermograohy. Master’s Thesis, Utrecht University, Utrecht, The Netherlands, 2021. [Google Scholar]
  77. Wirth, S.; Gebhardt-Henrich, S.; Riemer, S.; Hattendorf, J.; Zinsstag, J.; Hediger, K. The influence of human interaction on guinea pigs: Behavioral and thermographic changes during animal-assisted therapy. Physiol. Behav. 2020, 225, 113076. [Google Scholar] [CrossRef]
  78. Wongsaengchan, C.; McCafferty, D.J.; Evans, N.P.; McKeegan, D.E.F.; Nager, R.G. Body surface temperature of rats reveals both magnitude and sex differences in the acute stress response. Physiol. Behav. 2023, 264, 114138. [Google Scholar] [CrossRef]
  79. Insler, S.R.; Sessler, D.I. Perioperative Thermoregulation and Temperature Monitoring. Anesthesiol. Clin. N. Am. 2006, 24, 823–837. [Google Scholar] [CrossRef]
  80. Jaén-Téllez, J.A.; Sánchez-Guerrero, M.J.; López-Campos, J.I.; Valera, M.; González-Redondo, P. Acute stress assessment using infrared thermography in fattening rabbits reacting to handling under winter and summer conditions. Span. J. Agric. Res. 2020, 18, e0502. [Google Scholar] [CrossRef]
  81. Xu, Z.; Agbigbe, O.; Nigro, N.; Yakobi, G.; Shapiro, J.; Ginosar, Y. Use of high-resolution thermography as a validation measure to confirm epidural anesthesia in mice: A cross-over study. Int. J. Obstet. Anesth. 2021, 46, 102981. [Google Scholar] [CrossRef]
  82. Miyazono, S.; Hasegawa, K.; Miyazaki, S.; Sakakima, H.; Konno, S.; Meguro, S.; Sasajima, H.; Noguchi, T.; Osada, K.; Kashiwayanagi, M. Etizolam attenuates the reduction in cutaneous temperature induced in mice by exposure to synthetic predator odor. Eur. J. Pharmacol. 2018, 824, 157–162. [Google Scholar] [CrossRef]
  83. Weitkamp, J. Effect of Tickling and Gentling on Eye and Tail Temperature of Laboratory Rats during Manual Restraint, using Infrared Thermography. Master’s Thesis, Utrecht University, Utrecht, The Netherlands, 2020. [Google Scholar]
  84. Munting, L.P.; Derieppe, M.P.P.; Suidgeest, E.; Denis de Senneville, B.; Wells, J.A.; Weerd, L. Influence of different isoflurane anesthesia protocols on murine cerebral hemodynamics measured with pseudo-continuous arterial spin labeling. NMR Biomed. 2019, 32, e4105. [Google Scholar] [CrossRef] [PubMed]
  85. Faraji, J.; Ambeskovic, M.; Sauter, N.; Toly, J.; Whitten, K.; Lopes, N.A.; Olson, D.M.; Metz, G.A.S. Sex-specific stress and biobehavioral responses to human experimenters in rats. Front. Neurosci. 2022, 16, 965500. [Google Scholar] [CrossRef] [PubMed]
  86. Hickman, D.L. Minimal Exposure Times for Irreversible Euthanasia with Carbon Dioxide in Mice and Rats. J. Am. Assoc. Lab. Anim. Sci. 2022, 61, 283–286. [Google Scholar] [CrossRef]
  87. Van Rijn, C.M.; Krijnen, H.; Menting-Hermeling, S.; Coenen, A.M.L. Decapitation in Rats: Latency to Unconsciousness and the ‘Wave of Death’. PLoS ONE 2011, 6, e16514. [Google Scholar] [CrossRef] [PubMed]
  88. Hudetz, J.A.; Pagel, P.S. Neuroprotection by Ketamine: A Review of the Experimental and Clinical Evidence. J. Cardiothorac. Vasc. Anesth. 2010, 24, 131–142. [Google Scholar] [CrossRef]
  89. Miranda-Cortés, A.E.; Ruiz-García, A.G.; Olivera-Ayub, A.E.; Garza-Malacara, G.; Ruiz-Cervantes, J.G.; Toscano-Zapien, J.A.; Hernández-Avalos, I. Cardiorespiratory effects of epidurally administered ketamine or lidocaine in dogs undergoing ovariohysterectomy surgery: A comparative study. Iran. J. Vet. Res. 2020, 21, 92–96. [Google Scholar] [PubMed]
  90. Gómez-Hernández, A.; Beneit, N.; Díaz-Castroverde, S.; Escribano, Ó. Differential Role of Adipose Tissues in Obesity and Related Metabolic and Vascular Complications. Int. J. Endocrinol. 2016, 2016, 1216783. [Google Scholar] [CrossRef] [PubMed]
  91. Mota-Rojas, D.; Titto, C.G.; de Mira Geraldo, A.; Martínez-Burnes, J.; Gómez, J.; Hernández-Ávalos, I.; Casas, A.; Domínguez, A.; José, N.; Bertoni, A.; et al. Efficacy and Function of Feathers, Hair, and Glabrous Skin in the Thermoregulation Strategies of Domestic Animals. Animals 2021, 11, 3472. [Google Scholar] [CrossRef]
Figure 1. Customized acrylic euthanasia chamber for thermal imaging. (A) shows the components of the chamber, with the five hermetic seal doors and the respective gas inlet and vent port. (B) shows the position of the thermal camera that ensured the lens fit into each gate during the evaluation of inhalant euthanasia.
Animals 13 02820 g001
Figure 2. Representation of the four evaluated thermal windows. (A). T°ocu was delimited by a circle (El1) covering the entire ocular region or ocular globe, without including the upper or lower eyelid. T°ear was evaluated using a circle (El2) in the external ear canal to assess the irradiated temperature of the tympanic membrane and inner ear. (B). For T°dor, a rectangle (Bx1) was placed in the dorsal area over the interscapular space. (C) For T°tai, three spots (Sp1, Sp2, y Sp3) were placed at the proximal (T°prox), medial (T°medial), and distal (T°distal) segments of the tail.
Animals 13 02820 g002
Figure 3. Experimental timeline for the euthanasia methods applied in rats. HR: heart rate; RR: respiratory frequency. * for G3, Ti3 includes LORR and HR/RR cessation.
Animals 13 02820 g003
Figure 4. Effect of sex (5 males and 5 females in each group) on the maximum (max), minimum (min), and mean temperature of each thermal window in the six experimental groups: (A) T°ocu; (B) T°ear; (C) T°dor; (D) T°tai. G1: pentobarbital; G2: CO2; G3: decapitation; G4: isoflurane; G5: ketamine + xylazine; G6: ketamine + CO2.
Animals 13 02820 g004
Table 1. Effect of the six euthanasia methods, assessed at five evaluation times, on the maximum, minimum, and mean surface temperature (mean ± standard deviation, SD) of T°ocu (°C) in Wistar rats.
GroupsBasalTi1Ti2Ti3Ti4p-Value
T°maxG1 (n = 10)36.62 ± 0.56 a,135.85 ± 0.84 a,135.88 ± 0.83 a,136.44 ± 0.36 a,2,336.25 ± 0.38 a,3p = 0.97
G2 (n = 10)36.03 ± 0.76 b,135.93 ± 0.65 b,134.10 ± 1.65 a,b,234.90 ± 0.91 a,b,233.78 ± 1.18 a,2p = 0.007
G3 (n = 10)36.62 ± 0.39 a,136.26 ± 0.56 a,135.60 ± 1.25 a,135.97 ± 0.52 a,2,3NDp = 0.98
G4 (n = 10)36.46 ± 0.39 b,135.82 ± 0.48 b,129.76 ± 1.61 a,229.9 ± 1.34 a,130.41 ± 0.96 a,1p = 0.0001
G5 (n = 10)36.52 ± 0.39 a,136.66 ± 1.08 a,136.50 ± 1.16 a,136.83 ± 0.81 a,336.54 ± 0.52 a,3p = 0.99
G6 (n = 10)36.88 ± 0.69 a,136.18 ± 1.07 a,136.19 ± 1.03 a,136.80 ± 0.10 a,335.85 ± 0.90 a,3p = 0.11
p-valuep = 0.89p = 0.88p = 0.0005p = 0.0006p = 0.0001
T°minG1 (n = 10)34.04 ± 0.90 a,233.28 ± 0.88 a,133.42 ± 0.56 a,334.26 ± 0.59 a,334.23 ± 0.47 a,3p = 0.49
G2 (n = 10)32.91 ± 0.77 a,1,233.33 ± 0.47 c,130.78 ± 1.22 a,1,232.34 ± 0.97 b,c,231.24 ± 1.24 a,b,2p = 0.0042
G3 (n = 10)33.94 ± 0.55 a,1,233.55 ± 0.68 a,132.05 ± 1.06 a,2,332.88 ± 1.01 a,2,3NDp = 0.12
G4 (n = 10)32.73 ± 0.94 b,1,231.93 ± 0.93 b,128.35 ± 1.30 a,128.50 ± 1.10 a,128.87 ± 0.83 a,1p = 0.0001
G5 (n = 10)32.49 ± 0.93 a,132.45 ± 0.77 a,132.66 ± 1.21 a,2,332.70 ± 1.07 a,2,332.47 ± 0.89 a,2p = 0.99
G6 (n = 10)34.48 ± 0.97 a,1,233.64 ± 1.35 a,134.09 ± 1.18 a,334.69 ± 1.00 a,333.78 ± 1.59 a,2p = 0.99
p-valuep = 0.0023p = 0.99p = 0.0002p = 0.0007p = 0.0010
T°meanG1 (n = 10)35.58 ± 0.61 a,134.75 ± 0.96 a,134.88 ± 0.73 a,2,335.48 ± 0.31 a,3,435.36 ±0.38 a,3p = 0.99
G2 (n = 10)34.88 ± 0.71 a,b,134.90 ± 0.47 b,132.89 ± 1.44 a,b,1,233.79 ± 0.92 a,b,232.73 ±1.21 a,2p = 0.0097
G3 (n = 10)35.51 ± 0.40 a,135.10 ± 0.49 a,134.15 ± 1.40 a,2,334.88 ± 0.49 a,2,3NDp = 0.98
G4 (n = 10)34.96 ± 0.62 a,134.21 ± 0.54 a,129.14 ± 1.46 b,129.30 ± 1.23 b,129.77 ± 0.88 b,1p = 0.0001
G5 (n = 10)34.84 ± 0.46 a,134.79 ± 0.94 a,134.94 ± 1.20 a,2,335.10 ± 0.86 a,3,434.89 ± 0.66 a,2,3p = 0.99
G6 (n = 10)35.90 ± 0.77 a,135.05 ± 1.25 a,135.38 ± 1.18 a,335.96 ± 0.47 a,434.98 ± 1.23 a,3p = 0.67
p-valuep = 0.20p = 0.24p = 0.0007p = 0.0002p = 0.0019
a,b,c different literals indicate significant differences (p < 0.05) between events (basal, Ti1, Ti2, Ti3, Ti4). 1,2,3,4 different numerals indicate significant differences (p < 0.05) between treatments (G1, G2, G3, G4, G5, G6). Bold p-values represent statistically significant differences between events and treatments. ND = not determined due to the experimental group. Treatments (G1: pentobarbital; G2: CO2; G3: decapitation; G4: isoflurane; G5: ketamine + xylazine; G6: ketamine + CO2). Evaluation times (basal: 24 h before the procedure; Ti1: three minutes before the procedure; Ti2: during the application of the euthanasia method; Ti3: immediately after the application until loss of righting reflex (LORR); Ti4: from LORR to cessation of heartbeat and breathing).
Table 2. Mean ± standard deviation (SD) of T°ear (°C) values of the six euthanasia methods, assessed in five evaluation times, registering the maximum, minimum and mean surface temperatures.
GroupsBasalTi1Ti2Ti3Ti4p-Value
T°maxG1 (n = 10)38.42 ± 0.57 a,137.70 ± 0.37 a,137.41 ± 0.96 a,238.47 ± 0.37 a,338.35 ± 0.81 a,2p = 0.09
G2 (n = 10)36.06 ± 0.89 a,2,436.63 ± 0.70 a,133.80 ± 3.95 a,1,234.72 ± 1.80 a,232.64 ± 4.40 a,1,2p = 0.68
G3 (n = 10)36.68 ± 0.64 a,2,337.26 ± 0.66 a,136.03 ± 2.16 a,236.44 ± 1.64 a,2,3NDp = 0.95
G4 (n = 10)36.99 ± 1.16 b,1,3,436.87 ± 0.97 b,129.76 ± 2.10 a,130.54 ± 2.08 a,130.90 ± 1.21 a,1p = 0.0003
G5 (n = 10)37.47 ± 0.70 a,1,337.13 ± 1.37 a,135.37 ± 2.37 a,1,237.73 ± 1.41 a,2,338.04 ± 0.89 a,2p = 0.20
G6 (n = 10)38.15 ± 0.71 a,137.70 ± 0.58 a,137.89 ± 0.87 a,238.67 ± 0.48 a,337.44 ± 1.38 a,2p = 0.13
p-value p = 0.0119p = 0.1226p = 0.0003p = 0.0001p = 0.0003
T°minG1 (n = 10)32.25 ± 1.27 a,131.36 ± 0.91 a,131.97 ± 1.57 a,232.53 ± 0.88 a,331.92 ± 1.04 a,3p = 0.92
G2 (n = 10)30.24 ± 0.94 b,229.78 ± 1.15 a,b,128.89 ± 3.58 a,b,1,227.67 ± 1.43 a,b,127.53 ± 1.30 a,1p = 0.03
G3 (n = 10)30.19 ± 0.94 a,230.22 ± 1.09 a,129.77 ± 1.71 a,1,231.17 ± 1.2 a,2,3NDp = 0.87
G4 (n = 10)31.95 ± 0.99 b,131.22 ± 0.75 b,127.81 ± 1.15 a,128.31 ± 1.50 a,1,228.88 ± 1.06 a,1,2p = 0.0023
G5 (n = 10)32.06 ± 0.83 a,131.57 ± 1.73 a,131.90 ± 1.97 a,1,231.44 ± 1.81 a,2,332.61 ± 1.57 a,3p = 0.82
G6 (n = 10)32.56 ± 1.22 a,131.61 ± 0.97 a,132.80 ± 1.34 a,232.35 ± 0.74 a,330.99 ± 1.98 a,2,3p = 0.59
p-value p = 0.0004p = 0.4742p = 0.0005p = 0.0010p = 0.0018
T°meanG1 (n = 10)35.85 ± 0.84 a,135.0 ± 0.65 a,1,234.70 ± 1.09 a,236.24 ± 0.63 a,235.77 ± 0.80 a,3p = 0.08
G2 (n = 10)33.60 ± 0.92 a,133.78 ± 0.69 a,130.80 ± 2.83 a,1,231.60 ± 1.61 a,131.49 ± 2.42 a,1,2p = 0.25
G3 (n = 10)34.08 ± 0.94 a,134.32 ± 0.82 a,1,233.55 ± 1.15 a,234.40 ± 1.64 a,2NDp = 0.91
G4 (n = 10)34.82 ± 0.54 a,134.47 ± 0.92 a,1,229.0 ± 1.76 b,129.78 ± 1.90 b,130.05 ± 1.20 b,1p = 0.0011
G5 (n = 10)35.27 ± 0.75 a,134.85 ± 1.45 a,1,233.78 ± 2.23 a,235.21 ± 1.67 a,236.02 ± 1.22 a,1,2p = 0.43
G6 (n = 10)35.88 ± 0.99 a,135.11 ± 0.62 a,235.06 ± 2.26 a,235.58 ± 2.04 a,234.57 ± 1.85 a,2,3p = 0.98
p-value p = 0.06p = 0.02p = 0.0005p = 0.001p = 0.04
a,b,c different literals indicate significant differences (p < 0.05) between events (Basal, Ti1, Ti2, Ti3, Ti4). 1,2,3,4 different numerals indicate significant differences (p < 0.05) between treatments (G1, G2, G3, G4, G5, G6). Bold p-values represent statistically significant differences between events and treatments. ND= not determined due to the experimental group. Treatments (G1: pentobarbital; G2: CO2; G3: decapitation; G4: isoflurane; G5: ketamine + xylazine; G6: ketamine + CO2). Evaluation times (basal: 24 h before the procedure; Ti1: three minutes before the procedure; Ti2: during the application of the euthanasia method; Ti3: immediately after the application until loss of righting reflex (LORR); Ti4: from LORR to cessation of heartbeat and breathing).
Table 3. Mean ± standard deviation (SD) of T°dor (°C) maximum, minimum and mean values of the six euthanasia methods, assessed in five evaluation times.
GroupsBasalTi1Ti2Ti3Ti4p-Value
T°maxG1 (n = 10)33.28 ± 0.78 a,132.04 ± 1.14 a,133.07 ± 0.94 a,232.57 ± 0.67 a,233.07 ± 0.87 a,2p = 0.89
G2 (n = 10)32.88 ± 1.10 b,131.47 ± 0.91 a,130.41 ± 0.98 a,131.37 ± 1.39 a,231.20 ± 0.75 a,1p = 0.01
G3 (n = 10)33.58 ± 0.84 a,b,132.09 ± 1.57 a,134.78 ± 0.82 b,234.76 ± 1.14 b,3NDp = 0.001
G4 (n = 10)32.97 ± 0.94 b,130.91 ± 0.78 a,129.04 ± 1.21 a,129.32 ± 1.01 a,129.62 ± 0.66 a,1p = 0.0004
G5 (n = 10)32.55 ± 0.62 a,131.79 ± 1.22 a,133.44 ± 0.76 a,233.04 ± 1.05 a,2,333.08 ± 0.51 a,2p = 0.09
G6 (n = 10)32.91 ± 0.72 b,131.77 ± 0.55 a,133.01 ± 1.30 a,232.73 ± 1.02 a,b,2,331.51 ± 1.06 a,1,2p = 0.06
p-value p = 0.16p = 0.47p = 0.005p = 0.002p = 0.008
T°minG1 (n = 10)31.51 ± 0.59 a,130.32 ± 0.81 a,130.35 ± 0.53 a,230.75 ± 0.48 a,331.23 ± 0.73 a,3p = 0.15
G2 (n = 10)30.98 ± 0.96 b,129.54 ± 0.62 a,128.89 ± 3.37 b,128.13 ± 0.88 b,128.39 ± 1.51 b,1p = 0.01
G3 (n = 10)31.80 ± 0.56 a,130.20 ± 0.65 a,130.15 ± 1.97 a,229.97 ± 2.43 a,2NDp = 0.07
G4 (n = 10)31.27 ± 1.22 b,129.55 ± 0.90 a,128.17 ± 1.34 a,128.30 ± 0.88 a,1,228.64 ± 0.78 a,1p = 0.008
G5 (n = 10)31.18 ± 0.49 a,129.89 ± 1.51 a,131.38 ± 1.36 a,330.88 ± 1.16 a,330.72 ± 0.50 a,2p = 0.50
G6 (n = 10)31.54 ± 0.61 c,130.20 ± 0.74 b,130.88 ± 0.70 b,2,330.63 ± 1.37 b,2,328.77 ± 0.73 a,1p = 0.007
p-value p = 0.73p = 0.33p = 0.01p = 0.02p = 0.003
T°meanG1 (n = 10)32.46 ± 0.75 c,131.06 ± 0.82 a,131.58 ± 0.73 a,b,231.62 ± 0.41 a,b,c,332.12 ± 0.75 b,c,2p = 0.007
G2 (n = 10)31.83 ± 1.01 b,130.58 ± 0.73 a,129.08 ± 1.05 a,129.35 ± 0.91 a,1,229.24 ± 0.68 a,1p = 0.009
G3 (n = 10)32.58 ± 0.62 a,131.25 ± 1.03 a,132.48 ± 0.93 a,232.27 ± 1.05 a,3NDp = 0.22
G4 (n = 10)32.15 ± 1.01 b,130.21 ± 0.83 a,b,128.59 ± 1.28 a,128.78 ± 0.91 a,129.10 ± 0.72 a,1p = 0.001
G5 (n = 10)31.84 ± 0.53 a,130.95 ± 1.27 a,132.43 ± 1.05 a,231.85 ± 0.97 a,331.78 ± 0.41 a,2p = 0.07
G6 (n = 10)32.21 ± 0.66 c,131.0 ± 0.61 a,b,131.97 ± 0.64 b,c,231.24 ± 1.06 a,b,c,2,330.06 ± 0.67 a,1p = 0.004
p-value p = 0.57p = 0.99p = 0.0001p = 0.001p = 0.0009
a,b,c different literals indicate significant differences (p < 0.05) between events (Basal, Ti1, Ti2, Ti3, Ti4). 1,2,3, different numerals indicate significant differences (p < 0.05) between treatments (G1, G2, G3, G4, G5, G6). Bold p-values represent statistically significant differences between events and treatments. ND= not determined due to the experimental group. Treatments (G1: pentobarbital; G2: CO2; G3: decapitation; G4: isoflurane; G5: ketamine + xylazine; G6: ketamine + CO2). Evaluation times (basal: 24 h before the procedure; Ti1: three minutes before the procedure; Ti2: during the application of the euthanasia method; Ti3: immediately after the application until loss of righting reflex (LORR); Ti4: from LORR to cessation of heartbeat and breathing).
Table 4. Mean ± standard deviation of T°tai (°C) values at the proximal (T°prox), medial (T°medial), and distal (T°distal) segments of the tail, assessed on the six euthanasia methods at five evaluation times.
GroupsBasalTi1Ti2Ti3Ti4p-Value
T°proxG1 (n = 10)33.42 ± 1.76 b,128.81 ± 3.2 a,1,229.69 ± 2.52 a,1,228.80 ± 1.97 b,127.99 ± 1.23 b,1p = 0.005
G2 (n = 10)28.09 ± 2.31 a,b,228.59 ± 1.92 a,226.14 ± 2.02 a,226.35 ± 1.88 a,125.71 ± 1.62 a,1p = 0.07
G3 (n = 10)31.30 ± 1.60 a,b,231.61 ± 0.75 b,129.18 ± 0.85 a,1,228.82 ± 0.98 a,1NDp = 0.004
G4 (n = 10)31.70 ± 1.64 b,230.74 ± 1.50 b,1,226.42 ± 0.51 a,226.75 ± 0.94 a,127.36 ± 0.84 a,1p = 0.002
G5 (n = 10)29.99 ± 0.65 a,229.62 ± 1.28 a,1,230.22 ± 2.01 a,129.75 ± 1.62 a,129.23 ± 1.50 a,1p = 0.53
G6 (n = 10)30.31 ± 1.28 a,229.97 ± 2.11 a,1,230.01 ± 2.25 a,1,229.17 ± 2.31 a,127.82 ± 3.28 a,1p = 0.79
p-value p = 0.002p = 0.03p = 0.05p = 0.15p = 0.06
T°medialG1 (n = 10)33.49 ± 1.79 a,327.09 ± 3.84 b,128.82 ± 2.63 b127.19 ± 2.04 b,126.21 ± 1.48 b,1p = 0.001
G2 (n = 10)26.75 ± 2.78 a,127.88 ± 2.29 a,125.80 ± 2.81 a,125.11 ± 2.02 a,124.56 ± 2.15 a,1p = 0.98
G3 (n = 10)30.48 ± 2.07 b,230.65 ± 1.36 b,127.03 ± 1.37 a,126.83 ± 1.28 a,1NDp = 0.002
G4 (n = 10)30.65 ± 2.07 b,229.54 ± 1.89 b,125.70 ± 0.51 a,125.92 ± 1.10 a,126.06 ± 0.82 a,1p = 0.02
G5 (n = 10)28.77 ± 0.91 a,228.18 ± 1.75 a,128.95 ± 3.15 a,128.18 ± 2.56 a,127.59 ± 2.30 a,1p = 0.78
G6 (n = 10)29.24 ± 1.95 a,228.37 ± 2.38 a,128.54 ± 2.47 a,127.64 ± 1.48 a,125.20 ± 2.05 a,1p = 0.09
p-value p = 0.001p = 0.23p = 0.37p = 0.34p = 0.41
T°distalG1 (n = 10)33.34 ± 2.08 c,126.50 ± 3.77 b,128.13 ± 2.68 b,126.54 ± 2.10 b,125.83 ± 1.61 b,1p = 0.003
G2 (n = 10)26.29 ± 2.55 a,b,327.08 ± 2.77 a,124.41 ± 2.34 a,124.30 ± 2.23 a,123.67 ± 1.90 a,1p = 0.20
G3 (n = 10)29.23 ± 2.63 b,1,229.32 ± 1.73 b,125.28 ± 1.56 a,125.14 ± 1.48 a,1NDp = 0.002
G4 (n = 10)30.23 ± 2.14 c,1,228.65 ± 1.90 b,125.27 ± 0.50 a,125.67 ± 1.26 a,125.77 ± 0.78 a,1p = 0.02
G5 (n = 10)28.26 ± 1.13 a,b,227.35 ± 1.79 a,128.04 ± 3.08 a,127.22 ± 2.62 a,126.86 ± 2.43 a,1p = 0.47
G6 (n = 10)28.32 ± 2.32 a,b,227.48 ± 2.28 a,127.61 ± 2.60 a,126.37 ± 1.84 a,123.89 ± 1.80 a,1p = 0.10
p-value p = 0.005p = 0.74p = 0.33p = 0.65p = 0.19
a,b,c different literals indicate significant differences (p < 0.05) between events (basal, Ti1, Ti2, Ti3, Ti4). 1,2,3, different numerals indicate significant differences (p < 0.05) between treatments (G1, G2, G3, G4, G5, G6). Bold p-values represent statistically significant differences between events and treatments. ND = not determined due to the experimental group. Treatments—G1: pentobarbital; G2: CO2; G3: decapitation; G4: isoflurane; G5: ketamine + xylazine; G6: ketamine + CO2. Evaluation times—basal: 24 h before the procedure; Ti1: three minutes before the procedure; Ti2: during the application of the euthanasia method; Ti3: immediately after the application until loss of righting reflex (LORR); Ti4: from LORR to cessation of heartbeat and breathing.
Table 5. Comparison between recorded times (in seconds) according to the experimental group (mean ± SD).
GroupTime of Death (s)Time of LORR (s)Time of RR Cessation (s)Time of HR Cessation (s)
G1230.1 ± 42.494.2 ± 19.8193.8 ± 28.8230.1 ± 42.2
G2294.2 ± 74.378 ± 29.0211.8 ± 64.1305.5 ± 76.3
G36.2 ± 4.0NDNDND
G4390.2 ± 171.497.8 ± 49.5288 ± 15.7390.2 ± 17.1
G5257.9 ± 30.167 ± 10.3172.3 ± 25.6257.9 ± 30.1
G6420.3 ± 47.3122.7 ± 21.8291.8 ± 31.7420.3 ± 47.3
G1: pentobarbital; G2: CO2; G3: decapitation; G4: isoflurane; G5: ketamine + xylazine; G6: ketamine + CO2; HR: heart rate; LORR: loss of righting reflex; ND: not determined; RR: respiratory rate; s: seconds; SD: standard deviation.
Disclaimer/Publisher’s Note: The statements, opinions and data contained in all publications are solely those of the individual author(s) and contributor(s) and not of MDPI and/or the editor(s). MDPI and/or the editor(s) disclaim responsibility for any injury to people or property resulting from any ideas, methods, instructions or products referred to in the content.

