Simple Summary
Negative energy balance experienced by dairy cows postpartum can cause problems to the animal and financial loss to the farmer. Therefore, a wide array of invasive and non-invasive methods for assessing the energy status of dairy cows have been developed. The present study compares the predictive ability of milk fatty acids and traditional indirect markers and suggests that milk fatty acid composition may be the potential sole predictor of the energy status in dairy cows.
Abstract
Postpartum negative energy balance (NEB) is detrimental to cows and decreases profitability in dairy farming. The two origins of milk fatty acids (FA), de novo synthesized in the mammary gland and plasma lipids initially originating from feed, rumen microbes and the animal’s adipose tissue, make milk FA candidates as possible NEB biomarkers. The aim of this study was to assess the possibility to predict EB in cows in the first 150 days of lactation with BCS, milk traits and selected individual milk FA and the ratios of blood-derived and de novo synthesized FA. The daily EB of Estonian Holstein cows (N = 30) was calculated based on body weights and BCS values. Milk FA were analyzed with gas chromatography. The variance partitioning analysis revealed that milk production traits, BCS at calving, FA ratios and days in milk accounted for 67.1% of the EB variance. Random forest analysis indicated the highest impact of the ratios C18:1cis9/C12:0+C14:0, C18:1cis9+C18:0/C12:0+C14:0, C18:1cis9/C14:0, C18:1cis9+C18:0/C14:0, C18:1cis9/sum C5:0 to C14:0, C18:1cis9+C18:0/sum C5:0 to C14:0 or C18:1cis9/C15:0. FA and their ratios alone explained 63.6% of the EB variance, indicating the possibility to use milk FA and their ratios as sole predictors for the energy status in dairy cows.
1. Introduction
Postpartum negative energy balance (NEB) in dairy cows is characterized by elevated blood nonesterified fatty acids (NEFA) due to adipose tissue mobilization. Excessive synthesis of ketone bodies in the liver in the course of incomplete oxidation of NEFA could lead to ketosis and a wide array of problems for the animal (different health issues, reduced fertility, etc.) but also decrease the profitability of the dairy farm; hence, the issue has been widely researched (reviewed by [1]). As the length and depth of NEB are important indicators that problems depend on, EB data would be helpful for identifying potential problems and making management decisions [2]. As the direct assessment of cows’ EB on a commercial farm is not feasible, a lot of attention has been given to finding indirect measures of energy balance (EB) in individual animals. Body condition scoring [3], milk fat to protein ratio [4,5], blood NEFA and ketone bodies [6,7] have been identified and used as biomarkers of NEB.
Milk fatty acids (FA) originate from two sources: de novo synthesis in the mammary gland and plasma lipids initially originating from feed, rumen microbes and the animal’s adipose tissue [8]. The main FA in adipocytes are C18:1cis9 [9], C16:0 and C18:0 [10], which are released by lipolysis during NEB. The two origins, one related to body fat reserves reflecting the metabolic status of the animal, make milk FA potential candidates as NEB biomarkers.
Changes in the balance of C18:0, C18:1cis9 and de novo synthesized milk FA have been discussed as biomarker candidates for NEB in research papers [11,12]. Jorjong et al. [13,14] proposed that milk fat C18:1cis9 concentration measured in the second week of lactation could be used as an early warning for elevated blood plasma NEFA concentration, and the C18:1cis9 to C15:0 ratio may be a biomarker for hyperketonemia, both related to NEB. No previous long-term studies targeted the prediction of concurrent EB of dairy cows with different body condition scores (BCS) by different non-invasive markers, focusing on FA ratios based on their origin.
The hypothesis of this study was that the daily EB of dairy cows can be predicted by non-invasive markers, including milk FA concentrations and their ratios at the beginning of lactation during NEB and mid-lactation during positive EB. The aim was to assess the prediction strength of milk FA compared to other non-invasive indicators to estimate the daily EB of dairy cows and to find the individual FA and the ratios of blood-derived to de novo synthesized FA in the milk fat that can predict EB for every day in milk (DIM) in dairy cows.
2. Materials and Methods
2.1. Experimental Design
This experiment was conducted on the Eerika Experimental Farm of the Estonian University of Life Sciences (Märja, Estonia) with a herd size of 120 dairy cows, indoor freestall housing, TMR feeding and annual average milk production of 9200 kg.
This study was conducted on 30 Estonian Holstein cows (parity 2–6, BCS at calving 2.25–4.00) from one to three weeks before expected calving until approximately the 150th day of lactation.
The cows were fed grass silage, hay, maize meal, barley meal, heat-treated rapeseed cake and mineral feeds as TMR two times per day ad libitum at approximately 05:30 and 14:30 h. Depending on the physiological stage and requirements, the cows were fed 5 rations differing in chemical composition and nutritive value. The experimental diets were calculated according to the Estonian feeding recommendations: metabolizable energy (ME) according to Oll [15] and metabolizable protein (MP) based on the equations used in Finland [16] and fitted to suit Estonian conditions according to Kärt et al. [17]. Before calving and up to day 14 pre-partum, the far-off dry cow diet containing 8.7 MJ ME and 73 g MP/kg of DM was fed. From day 14 pre-partum until calving, the close-up dry cow diet containing 10.1 MJ ME and 87 g MP/kg of DM was offered. After calving until 6 days in milk (DIM), lactation diet one was provided, which was similar to the close-up diet differing only in its mineral composition. From 7 to 14 DIM, lactation diet two with an ME content of 10.9 MJ and MP content of 98 g per kg of DM was offered. Lactation ration three was fed from 15 DIM onwards containing 11.3 MJ ME and 104 g MP per kg of DM.
To calculate ration compositions, silage samples were taken twice weekly. Other feeds were sampled on a batch basis. All samples were analyzed for dry matter (DM), while chemical composition was analyzed using methods approved by the AOAC [18], and nutritive value (ME, MP) was calculated once weekly for the silage samples or on a batch basis for the other feeds. If necessary, during the experiment, the proportions of the rations’ ingredients were corrected to meet the required composition and nutritive values.
The body condition score (BCS) was registered [19] by two trained persons starting from four weeks before expected calving and during the whole period of the study with two-week intervals. The average number of BCS observations per cow was 7.3. The automatic daily weighting of the cows started on the 5.6th day after calving (min = 2, max = 22) on average and ended on the 152.6th day after calving (min = 104, max = 169) on average. Due to unforeseen problems, all daily weights were not available—the average number of daily weights per cow was 120.0 (min = 44, max = 164).
2.2. Sample Collection
The cows were milked in a DeLaval milking parlor twice a day at 05:00 and 15:00. Milk yields were recorded at each milking with DeLaval’s Alpro software version 6.5 for Windows (DeLaval International AB, Tumba, Sweden). Milk samples were collected by in-line milk meters (MM27BC, DeLaval International AB, Tumba, Sweden) twice weekly on Sundays and on Thursdays until confirmed pregnancy followed by once-a-week sampling on Sundays. Depending on calving and sampling day, the first sample was taken from 4 to 7 DIM. The last sampling day was aimed to be 150 DIM, but it was actually between 144 and 155 DIM. The average number of samples per cow was 41 (min 34, max 44). In total, 1231 milk samples were collected and analyzed. The samples from two consecutive milkings were pooled. A milk subsample (40 mL) of each pooled milk sample was preserved with bronopol (Broad Spectrum Microtabs, D&F Control Systems Inc., Dublin, CA, USA) and analyzed for fat, protein, lactose content and somatic cell count with an automatic infrared milk analyzer (System FT+, Foss Electric, Hillerod, Denmark) in the Milk Analysis Laboratory of Estonian Livestock Performance Recording Ltd. (Tartu, Estonia) The second subsample (1.5 mL) was stored at −20 °C until milk FA analyses. Milk fat was extracted according to Ariko et al. [20]. The fatty acid methyl esters (FAME) were analyzed using a gas chromatograph (Agilent 6890A, Agilent Technologies Inc., Santa Clara, CA, USA) equipped with a flame ionization detector and capillary column CP-Sil 88 (100 m × 0.25 mm i.d.) with a film thickness of 0.20 μm. Component FAME Mix (Supelco, Bellefonte, PA, USA), GLC 603 and GLC 408 (Nu-Chek Prep. Inc., Elysian, MN, USA), BAME Mix (Supelco, Bellefonte, PA, USA), Linoleic Acid Methyl Ester Isomer Mix (Supelco, Bellefonte, PA, USA) and individual fatty acid methyl ester standards were used to identify common FA. To identify the overlapping of trans and cis isomers, Ag+-SPE cartridges (750 mg/6 mL) (Supelco, Bellefonte, PA, USA) were used.
A total of 81 milk FA were identified; the studied FA and their ratios were selected according to their potential relationship with EB based on their origin and relation to body fat mobilization (Table 1).

Table 1.
Fatty acids, fatty acid groups and ratios used in this study.
2.3. Calculation of the Energy Balance of the Dairy Cows
To predict the daily body weight (BW) of the cows, the general linear mixed model considered the cubic spline function of DIM with nonequidistant knots at 21, 70 and 112 DIM, parity and BCS group and their interactions with the cubic spline of DIM and the random cubic spline of DIM for each cow. The nonequidistant knots at DIM were selected by comparing the fits of different models: the Akaike information criterion (AIC) value of the final model was lower compared to the models with equidistant knots; models with knots at 12, 20, 60, 115 and 150 DIM (used by [21]); and models with less than three knots. The AIC of the model with four nonequidistant knots at 14, 21, 70 and 112 DIM was the lowest, but it was dropped as a visual inspection of the fitted curves showed that unrealistic weights in the first weeks for some cows with a lot of missing values were predicted. The parity by cubic spline and BCS group by the cubic spline interactions was included to fit different curves to potentially different groups of cows. The random cubic spline of DIM for each cow was considered to achieve cow-specific curves but avoid simultaneous perturbation by extreme outliers. The root mean square error of the fitted model was 19.1 kg (the modelling results are presented in Appendix A Figure A1).
For the daily BCS prediction, the last pre-calving BCS was considered as the BCS at day 0. To predict the daily BCS, a similar model as for BW was used; however, the spline of degree 2 with one knot at 70 DIM was used. The root mean square error of the fitted model was 0.15 BCS units (the modelling results are presented in Appendix A Figure A2).
Both BW and BCS modelling were performed with an HPMIXED procedure in SAS 9.4 (SAS Institute Inc., Cary, NC, USA).
The daily EB of the cows in effective energy was estimated based on frequent BW measurements and BCS according to the approach of Thorup et al. [21]. In the following statistical analyses, only the EB values corresponding to DIM milk samples were used (the first days of lactation were omitted).
2.4. Statistical Analyses
Statistical analyses were performed and figures were constructed with statistical package R 3.3.3. The overall importance of FA and their ratios, milk production traits (milk yield, fat and protein percentage, lactose and fat-to-protein ratio, BCS at calving and DIM to predict the EB were studied, applying variance partitioning analysis (VPA; [22]) with function varpart in package vegan. To visualize the results of the VPA, the proportional Euler diagram was fitted using the function eulerr from the package eulerr.
Second, random forest was used to study more precisely the overall prediction ability of FA and their ratios and to find those with the strongest connection with the EB. Random forest was used because it allows for the consideration of possible nonlinear and interaction effects of different FA and their ratios. For prediction accuracy estimation, the leave-one-cow-out cross-validation approach was used. This means that the random forest was trained on a dataset without the data from one cow and then tested on the data of this cow to calculate the prediction errors and root mean square error (RMSE), and this approach was repeated for all cows. The importance of single FA and their ratios in random forest was calculated as the decrease in the residual sum of squares from splitting on the variable averaged over all trees. The random forests were applied with the function randomForest of the package with the same name.
Finally, to study the relationships of FA and their ratios with EB one by one, general linear mixed models were fitted. The models considered the natural cubic spline effect with one knot of FA or FA ratio and the random effect of the cow. In hypothesis testing, the Kenward–Roger approximation for the denominator degrees of freedom was used. The model accuracy was expressed as RMSE using the leave-one-cow-out cross-validation approach as described earlier. The packages lme4, lmerTest and splines were used, and the models were fitted with the function lmer.
As most of the FA and their ratios had right-skewed distributions, they were logarithm-transformed before analyses. This did not affect the results of the random forest analysis and had only a marginal effect on the VPA but made the general linear models in the cross-validation approach more stable.
3. Results
The trends in the estimated EB curves of the cows followed the typical pattern of increasing in the first weeks of lactation in most of the cows with some exceptions. The depth and time of the nadir of NEB varied between the cows (Appendix A Figure A3).
The results of the variance partitioning analysis showed that milk production traits, BCS at calving, FA and their ratios and DIM accounted for 67.1% of the EB variance. Moreover, FA and their ratios alone explained 63.6% of the EB variance, milk production traits alone explained 39.5% of the EB variance, DIM alone explained 29.0% of the EB variance, and BCS at calving alone explained 5.4% of the EB variance. The FA and their ratios’ effect covered almost totally the effects of DIM, milk production traits and BCS at calving and added an extra 15.3% of EB variance (Figure 1). The inclusion of the effect of the cow as a dummy variable increased the proportion of the EB variance that was accounted for by the factors above by only 3.7%.
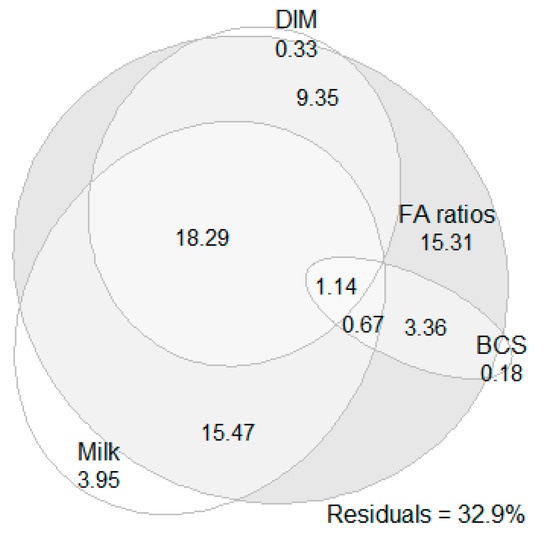
Figure 1.
Results of variance partitioning analysis fitted with Euler diagram. The numerical values present the percentages of energy balance variance accounted for by milk production traits (milk yield, fat and protein percentage, lactose and fat-to-protein ratio), body condition score (BCS) at calving, milk fatty acids (FA) and their ratios (FA ratios; 26 ratios in total—see Table 1) and days in milk (DIM) and their intersections.
The random forest analysis indicated that the greatest decrease in prediction errors in the regression trees was achieved when splitting on the ratios C18:1c9/C12+C14, C18/C12+C14, C18:1c9/C14, C18/C14, C18:1c9/de novo C5–C14, C18/de novo C5–C14 or C18:1c9/C15 (Figure 2). The prediction errors were the greatest in the first weeks of lactation and in the last third of the study period (Figure 3A). The average cross-validated RMSE per cow was 27.6 MJ (min = 11.5 MJ, max = 46.3 MJ; Figure 3B).
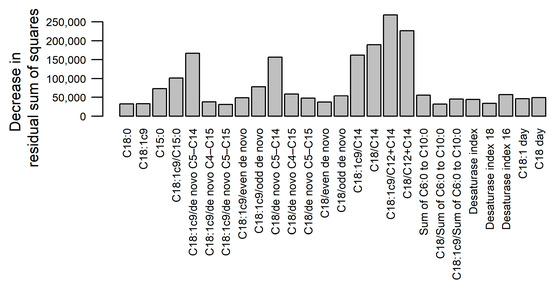
Figure 2.
Results of random forest analysis: variables’ importance according to the mean decrease in residual sum of squares from splitting on the variable (higher bar indicates higher importance).
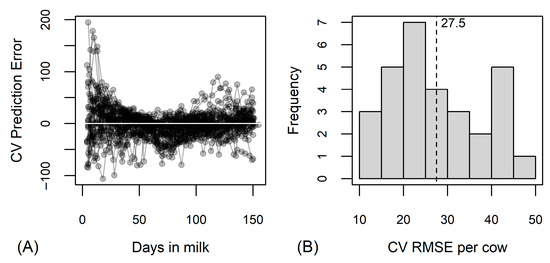
Figure 3.
Results of random forest analysis predicting energy balance in MJ of effective energy based on 26 fatty acid traits. (A) Cross-validated (CV) prediction error by cows (one line corresponds to observations of one cow) and days in milk; (B) distribution of cross-validated root mean square errors (CV RMSE) per cow, vertical dotted line with numerical value denotes the average CV RMSE.
The additional random forest analysis, including DIM, BCS at calving and milk traits, supported the results of the variance partitioning analysis—the average cross-validated RMSE per cow improved by only 3.1 MJ (Figure 4), verifying the results of the variance partitioning analysis. The inclusion of the somatic cell score as an independent variable did not change the prediction accuracy of the random forest.
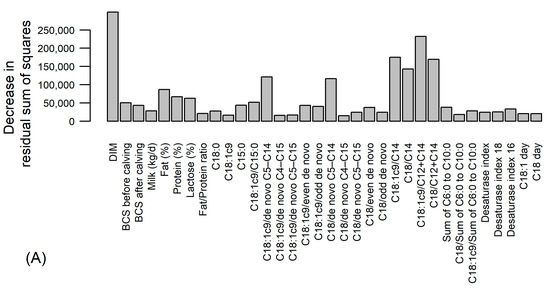
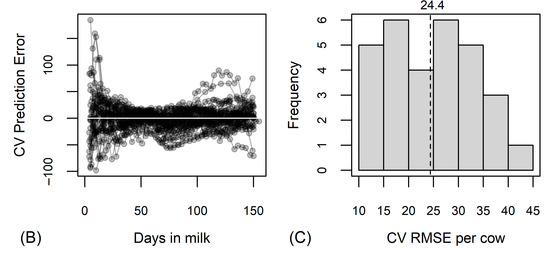
Figure 4.
Results of random forest analysis predicting energy balance in MJ of effective energy based on 26 fatty acids and ratios, days in milk (DIM), body condition score (BCS) at calving and milk traits. (A) Variables’ importance according to the mean decrease in residual sum of squares from splitting on the variable; (B) cross-validated (CV) prediction error by cows (one line corresponds to observations of one cow) and days in milk; (C) distribution of cross-validated root mean square errors (CV RMSE) per cow, vertical dotted line with numerical value denotes the average CV RMSE.
Using the general linear mixed model with the 26 FA studied, the mean cross-validated EB RMSE per cow varied within the interval 27.4–40.2 MJ (Appendix A Figure A4).
4. Discussion
This experiment was set up with dairy cows that had a range of BCS at calving with the aim to include animals with variations in the depth and time of the nadir of postpartum NEB. The trends in the estimated EB curves were as expected [23,24,25].
The variance partitioning analysis showed that FA and their ratios alone explained 63.6% of the variance, and other data obtained during this study increased the proportion of EB variance by only 3.5%, indicating the possibility to use milk FA and their ratios as sole predictors for EB variance. Similar to our results, Mäntysaari et al. [26] found that milk FA alone were better predictors of cow EB than milk and body traits. Also, adding the cow as a dummy variable did not significantly improve the proportion of EB variance covered, which indicates that the already treated factors, especially FA and their ratios, accounted for most of the cows’ individuality.
FA are grouped differently across studies, and discussion about the exact origin of some of them is ongoing. For example, C4:0 can be derived from condensation of acetyl units or directly from β-hydroxybutyrate obtained from blood [27]. Similarly, C15:0 and C17:0 can originate from rumen microbes and derive to milk fat from the blood or are synthesized de novo in the mammary gland from propionate as a primer; postruminal elongation of some BCFA have also been established [28]. In addition, the ratio of long-chain FA in milk, originating partly from body fat (C18:0 and C18:1cis9), can be affected by genetic parameters [29] and lactation stage [30]. It has raised the question if using the sum of substrate and resulting FA in milk FA models adds accuracy to the predictions. Since FAs could be assigned to various groups by origin, different combinations of FA, their groups and ratios were targeted in the present study (Table 1).
Elevated levels of C18:1cis9 concentration in milk fat has been previously considered a possible marker for NEB [11,12], increased blood plasma NEFA [13] and subclinical ketosis [31], but neither concentration nor daily production of the aforementioned single FA were found to be as good contributors in the present study. The decrease in the ratio C18:1c9/C14 during lactation was noted by Craninx et al. [32]. C18:1cis9/C15:0 was suggested as a possible hyperketonemia marker by Jorjong et al. [14] and for prediction of NEFA levels by Dórea et al. [33]. Khiaosa-Ard et al. [34] associated the ratios of 15:0/18:1cis9 and 14:0/18:1cis9 and the sum of de novo FA to 18:1cis9 with serum NEFA and BHB concentrations. In our previous study, we showed that the ratio of C18:1c9/C12:0+C14:0 was associated with increased blood plasma NEFA and BHB concentrations [35]. In the present study, C18:1c9/C12:0+C14:0 and C18:1c9+C18:0/C12:0+C14:0 showed the greatest reduction in the prediction errors in the regression trees, suggesting the sum of C12:0 and C14:0, though C14:0 contributes more to the sum, being more suitable to be used in models. Heck et al. [36] suggested that C12:0 is not completely synthesized de novo but can also originate from feed and be obtained from milk fat from blood plasma. No palm-based or coconut oil-based feeds rich in C12:0 were used in the dairy cow diets in the present study, but it should be taken into consideration in the future when predictions are made based on milk FA profiles.
The greater prediction errors in the first weeks of lactation and in the last third of the study may have been caused by the incorrect EB values calculated based on BW and BCS—the over-estimated EB values in these periods corresponded to the cows with the lowest calculated EB values. The assumption that residual gut fill is constant, used in the model [21], could have been one issue increasing the noise in the EB data [37] and led to bigger prediction errors in the last third of the study period.
The general linear mixed model analysis revealed that all studied 26 FA and their ratios predicted the EB with quite similar accuracy (Appendix A Figure A4). The similar prediction accuracy is logical because all studied FA and their groups were selected according to their potential relationship with EB, and they are all strongly related. However, the smallest CV RMSE in predicting the EB was achieved using C18/C14, C18:1c9/C12+C14, C18/C12+C14, C18:1c9/C14, C18/de novo C5–C14, C18:1c9/de novo C5–C14, C18:1c9/C15 and C18/even de novo. Most of the milk FA ratios best predicting EB were the same, which indicated the biggest decrease in prediction errors in the regression trees in the random forest analysis.
5. Conclusions
The results suggest that, of the studied predictors, milk FA composition may be a potential sole predictor of energy status in dairy cows. Random forest analysis highlighted the possibility to develop EB prediction models for dairy cows based on the ratios of selected blood-derived and de novo synthesized fatty acids. The best predictive potential has the ratios C18/C14, C18:1c9/C12+C14, C18/C12+C14, C18:1c9/C14, C18/de novo C5–C14, C18:1c9/de novo C5–C14, C18:1c9/C15 and C18/even de novo.
Author Contributions
Conceptualization, H.J., K.L., M.H. and T.K; methodology H.J., K.L., M.H. and T.K; formal analysis, T.K. and T.A.; investigation, H.J. and T.A.; resources, M.O.; data curation, T.A. and K.L.; writing—original draft preparation, T.A.; writing—review and editing, T.A., M.H., K.L., T.K., H.J. and M.O.; visualization, T.K. and T.A.; supervision, M.O. and M.H.; project administration, H.J.; funding acquisition, M.O., K.L., M.H. and H.J. All authors have read and agreed to the published version of the manuscript.
Funding
The Estonian Ministry of Education and Research (institutional research grant IUT 8-1, R&D project PRG554) and basic funding of the Estonian University of Life Sciences (project P180277-1) supported the study.
Institutional Review Board Statement
This study was conducted in accordance with the Declaration of Helsinki. Animal use and care was in accordance with the Estonian Animal Protection Act and the European Council Directive regarding the protection of animals. The animal study protocol was approved by the national Committee for Conducting Animal Experiments (protocol code N 7.2-11/3240-1, 13 May 2008).
Data Availability Statement
The data presented in this study are available on request from the corresponding author.
Acknowledgments
The authors would like to thank chemist Sirje Kuusik, the staff of Eerika Experimental Farm for their contribution to this study and David Arney for linguistic correction of the manuscript.
Conflicts of Interest
The authors declare no conflict of interest. The funders had no role in the design of the study; in the collection, analyses or interpretation of data; in the writing of the manuscript or in the decision to publish the results.
Appendix A

Figure A1.
Actual weights (dots joined with grey line) and predicted daily weights (red lines) of the cows.

Figure A2.
Body condition score values (dots joined with grey line) and predicted daily body condition score values (red lines) of the cows.

Figure A3.
Predicted daily energy balances of the cows in effective energy (grey lines) and overall mean (bold black line).

Figure A4.
Relationship between energy balance (on vertical axis) and milk fatty acid groups and ratios (on horizontal axis) modelled with a natural cubic spline. The black narrow line denotes the overall linear relationship, and the red line denotes the fitted curve. The average cross-validated root mean square error (CV RMSE) with its standard deviation is presented numerically.
References
- Wankhade, P.R.; Manimaran, A.; Kumaresan, A.; Jeyakumar, S.; Ramesha, K.P.; Sejian, V.; Rajendran, D.; Varghese, M.R. Metabolic and immunological changes in transition dairy cows: A review. Vet. World 2017, 10, 1367–1377. [Google Scholar] [CrossRef] [PubMed]
- De Vries, M.J.; Veerkamp, R.F. Energy balance of dairy cattle in relation to milk production variables and fertility. J. Dairy Sci. 2000, 83, 62–69. [Google Scholar] [CrossRef] [PubMed]
- Coffey, M.P.; Emmans, G.C.; Brotherstone, S. Genetic evaluation of dairy bulls for energy balance traits using random regression. Anim. Sci. 2001, 73, 29–40. [Google Scholar] [CrossRef]
- Heuer, C.; Schukken, Y.H.; Dobbelaar, P. Postpartum body condition score and results from the first test day milk as predictors of disease, fertility, yield, and culling in commercial dairy herds. J. Dairy Sci. 1999, 82, 295–304. [Google Scholar] [CrossRef]
- Toni, F.; Vincenti, L.; Grigoletto, L.; Ricci, A.; Schukken, Y.H. Early lactation ratio of fat and protein percentage in milk is associated with health, milk production, and survival. J. Dairy Sci. 2011, 94, 1772–1783. [Google Scholar] [CrossRef]
- Herdt, T.H. Ruminant adaptation to negative energy balance: Influences on the etiology of ketosis and fatty liver. Vet. Clin. N. Am. Food Anim. Pract. 2000, 16, 215–230. [Google Scholar] [CrossRef] [PubMed]
- Samarütel, J.; Waldmann, A.; Ling, K.; Jaakson, H.; Kaart, T.; Leesmäe, A.; Kärt, O. Relationships between luteal activity, fertility, blood metabolites and body condition score in multiparous Estonian Holstein dairy cows under different management. J. Dairy Res. 2008, 75, 485–490. [Google Scholar] [CrossRef]
- Chilliard, Y.; Ferlay, A.; Mansbridge, R.M.; Doreau, M. Ruminant milk fat plasticity: Nutritional control of saturated, polyunsaturated, trans and conjugated fatty acids. Ann. Zootech. 2000, 49, 181–205. [Google Scholar] [CrossRef]
- Rukkwamsuk, T.; Geelen, M.J.H.; Kruip, T.A.M.; Wensing, T. Interrelation of fatty acid composition in adipose tissue, serum, and liver of dairy cows during the development of fatty liver postpartum. J. Dairy Sci. 2000, 83, 52–59. [Google Scholar] [CrossRef]
- Clarke, S.D. Regulation of fatty acid synthase gene expression: An approach for reducing fat accumulation. J. Anim. Sci. 1993, 71, 1957–1965. [Google Scholar] [CrossRef]
- Gross, J.; van Dorland, H.A.R.; Bruckmaier, M.; Schwarz, F.J. Milk fatty acid profile related to energy balance in dairy cows. J. Dairy Res. 2011, 78, 479–488. [Google Scholar] [CrossRef]
- Churakov, M.; Karlsson, J.; Edvardsson Rasmussen, A.; Holtenius, K. Milk fatty acids as indicators of negative energy balance of dairy cows in early lactation. Animal 2021, 15, 100253. [Google Scholar] [CrossRef]
- Jorjong, S.; van Knegsel, A.T.M.; Verwaeren, J.; Val Lahoz, M.; Bruckmaier, R.M.; De Baets, B.; Kemp, B.; Fievez, V. Milk fatty acids as possible biomarkers to early diagnose elevated concentrations of blood plasma nonesterified fatty acids in dairy cows. J. Dairy Sci. 2014, 97, 7054–7064. [Google Scholar] [CrossRef]
- Jorjong, S.; van Knegsel, A.T.M.; Verwaeren, J.; Bruckmaier, R.M.; De Baets, B.; Kemp, B.; Fievez, V. Milk fatty acids as possible biomarkers to diagnose hyperketonemia in early lactation. J. Dairy Sci. 2015, 98, 5211–5221. [Google Scholar] [CrossRef]
- Oll, Ü.; Tölp, S. Feeding Requirements for Livestock with Feed Tables; Vabariiklik Söötmisalase Uurimistöökoordineerimise Komisjon: Tartu, Estonia, 1995; 186p. [Google Scholar]
- Tuori, M.; Kaustell, K.; Valaja, J.; Aimonen, E.; Saarisalo, E.; Huhtanen, P. Rehutaulukot ja Ruokintasuositukset; University of Helsinki, Department of Animal Science; Plant Production Inspection Center, Department of Agricultural Chemistry; Agricultural Research Center, Institute of Livestock Production Research: Helsinki, Finland, 1996. (In Finnish) [Google Scholar]
- Kärt, O.; Karis, V.; Ots, M. Mäletsejaliste Proteiintoitumine ja Metaboliseeruval Proteiinil Põhinev Söötade Hindamise Süsteem; Eesti Põllumajandusülikooli Loomakasvatusinstituut: Tartu, Estonia, 2002. [Google Scholar]
- AOAC. Official Methods of Analysis of AOAC International, 18th ed.; Horwitz, W., Latimer, G.W., Eds.; AOAC International: Gaithersburg, MD, USA, 2005. [Google Scholar]
- Edmonson, A.; Lean, I.; Weaver, L.; Farver, T.; Webster, G. A body condition scoring chart for Holstein dairy cows. J. Dairy Sci. 1989, 72, 68–78. [Google Scholar] [CrossRef]
- Ariko, T.; Kass, M.; Henno, M.; Fievez, V.; Kärt, O.; Kaart, T.; Ots, M. The effect of replacing barley with glycerol in the diet of dairy cows on rumen parameters and milk fatty acid profile. Anim. Feed Sci. Technol. 2015, 209, 69–78. [Google Scholar] [CrossRef]
- Thorup, V.M.; Edwards, D.; Friggens, N.C. On-farm estimation of energy balance in dairy cows using only frequent body weight measurements and body condition score. J. Dairy Sci. 2012, 95, 1784–1793. [Google Scholar] [CrossRef] [PubMed]
- Borcard, D.; Legendre, P.; Drapeau, P. Partialling out the spatial component of ecological variation. Ecology 1992, 73, 1045–1055. [Google Scholar] [CrossRef]
- Samarütel, J.; Ling, K.; Jaakosn, H.; Kaart, T.; Kärt, O. Effect of body condition score at parturition on the production performance, fertility and culling in primiparous Estonian Holstein cows. Vet. Zootech. 2006, 36, 68–74. Available online: https://vetzoo.lsmuni.lt/2006-36-en (accessed on 13 June 2023).
- Ling, K.; Waldmann, A.; Samarütel, J.; Jaakson, H.; Kaart, T.; Leesmäe, A. Field trial on the relationship of blood metabolites and body condition score with the recurrence of luteal activity in Estonian Holstein cows. J. Vet. Med. A Physiol. Pathol. Clin. Med. 2007, 54, 337–341. [Google Scholar] [CrossRef]
- Pires, J.A.A.; Delavaud, C.; Faulconnier, Y.; Pomiès, D.; Chilliard, Y. Effects of body condition score at calving on indicators of fat and protein mobilization of periparturient Holstein-Friesian cows. J. Dairy Sci. 2013, 96, 6423–6439. [Google Scholar] [CrossRef]
- Mäntysaari, P.; Mäntysaari, E.A.; Kokkonen, T.; Mehtiö, T.; Kajava, S.; Grelet, C.; Lidauer, P.; Lidauer, M.H. Body and milk traits as indicators of dairy cow energy status in early lactation. J. Dairy Sci. 2019, 102, 7904–7916. [Google Scholar] [CrossRef] [PubMed]
- Palmquist, D.L.; Beaulieu, A.D.; Barbano, D.M. Feed and animal factors influencing milk fat composition. J. Dairy Sci. 1993, 76, 1753–1771. [Google Scholar] [CrossRef] [PubMed]
- Vlaeminck, B.; Gervais, R.; Rahman, M.M.; Gadeyne, F.; Gorniak, M.; Doreau, M.; Fievez, V. Postruminal synthesis modifies the odd- and branched- chain fatty acid profile from the duodenum to milk. J. Dairy Sci. 2015, 98, 4829–4840. [Google Scholar] [CrossRef] [PubMed]
- Schennink, A.; Heck, J.M.L.; Bovenhuis, H.; Visker, M.H.P.W.; van Valenberg, H.J.F.; van Arendonk, J.A.M. Milk fatty acid unsaturation: Genetic parameters and effects of stearoyl-CoA desaturase (SCD1) and acyl CoA: Diacylglycerol acyltransferase 1 (DGAT1). J. Dairy Sci. 2008, 91, 2135–2143. [Google Scholar] [CrossRef] [PubMed]
- Kay, J.K.; Weber, W.J.; Moore, C.E.; Bauman, D.E.; Hansen, L.B.; Chester- Jones, H.; Crooker, B.A.; Baumgard, L.H. Effects of week of lactation and genetic selection for milk yield on milk fatty acid composition in Holstein cows. J. Dairy Sci. 2005, 88, 3886–3893. [Google Scholar] [CrossRef]
- Van Haelst, Y.N.T.; Beeckman, A.; Van Knegsel, A.T.M.; Fievez, V. Short communication: Elevated concentrations of oleic acid and long-chain fatty acids in milk fat of multiparous subclinical ketotic cows. J. Dairy Sci. 2008, 91, 4683–4686. [Google Scholar] [CrossRef]
- Craninx, M.; Steen, A.; Van Laar, H.; Van Nespen, T.; Martin-Tereso, J.; De Baets, B.; Fievez, V. Effect of lactation stage on the odd- and branched-chain milk fatty acids of dairy cattle under grazing and indoor conditions. J. Dairy Sci. 2008, 91, 2662–2677. [Google Scholar] [CrossRef]
- Dórea, J.R.R.; French, E.A.; Armentano, L.E. Use of milk fatty acids to estimate plasma nonesterified fatty acid concentrations as an indicator of animal energy balance. J. Dairy Sci. 2017, 100, 6164–6176. [Google Scholar] [CrossRef]
- Khiaosa-ard, R.; Kleefisch, M.T.; Zebeli, Q.; Klevenhusen, F. Milk fatty acid composition reflects metabolic adaptation of early lactation cows fed hay rich in water-soluble carbohydrates with or without concentrates. Anim. Feed Sci. Technol. 2020, 264, 114470. [Google Scholar] [CrossRef]
- Henno, M.; Ling, K.; Kaart, T.; Ariko, T.; Karis, P.; Jaakson, H.; Kuusik, S.; Ots, M. Effect of monensin on milk fatty asid profile in dairy cows and on the use of fatty acids for early diagnosis of elevated blood plasma concentrations of nonesterified fatty acids and hyperketonemia. J. Dairy Sci. 2021, 104, 10355–10362. [Google Scholar] [CrossRef] [PubMed]
- Heck, J.M.; van Valenberg, H.J.; Bovenhuis, H.; Dijkstra, J.; van Hooijdonk, T.C. Characterization of milk fatty acids based on genetic and herd parameters. J. Dairy Res. 2011, 79, 39–46. [Google Scholar] [CrossRef] [PubMed]
- Thorup, V.M.; Chagunda, M.G.G.; Fischer, A.; Weisbjerg, M.R.; Friggens, N.C. Robustness and sensitivity of a blueprint for on-farm estimation of dairy cow energy balance. J. Dairy Sci. 2018, 101, 6002–6018. [Google Scholar] [CrossRef] [PubMed]
Disclaimer/Publisher’s Note: The statements, opinions and data contained in all publications are solely those of the individual author(s) and contributor(s) and not of MDPI and/or the editor(s). MDPI and/or the editor(s) disclaim responsibility for any injury to people or property resulting from any ideas, methods, instructions or products referred to in the content. |
© 2023 by the authors. Licensee MDPI, Basel, Switzerland. This article is an open access article distributed under the terms and conditions of the Creative Commons Attribution (CC BY) license (https://creativecommons.org/licenses/by/4.0/).