Simple Summary
The mobilization of lipids from adipose tissue increases fatty acids and ketone bodies levels. The β-hydroxybutyrate is the main ketone body used to diagnose ketosis, a metabolic disorder of the transition period, in ruminants. Nevertheless, a specific cut-off for the ketosis of β-hydroxybutyrate in buffaloes and the plasma lipid fractions related to ketone bodies have not been established. The relative concentrations of not only total plasma lipids but also lipid fractions such as phospholipids, free fatty acids, triglycerides, and cholesterol esters are influenced by the mobilization of lipids. Each of these fractions has a different role in animal metabolism, influencing energy redistribution and cell metabolism and function. The present study reveals the relationship between lipid fractions and changes in metabolism and inflammation that is related to variations in lipid classes according to different levels of energy deficits in the early lactation of Mediterranean buffaloes. Furthermore, buffaloes defined as at risk of ketosis showed similarities, with ketotic cows suggesting the necessity of further investigations in these ruminants.
Abstract
Cell function and energy redistribution are influenced by lipid classes (phospholipids (PLs), free fatty acids (FFAs), triglycerides (TGs), and cholesterol esters (CEs)). The aim of this study was to investigate metabolic alterations that are related to changes in lipid classes according to different levels of energy deficits in early lactating Mediterranean buffaloes (MBs). Sixty-three MBs were enrolled at the beginning of lactation using an observational study with a cross-sectional experimental design. Serum β-hydroxybutyrate (BHB) levels were used to group the animals into a healthy group (Group H; n = 38; BHB < 0.70 mmol/L) and hyperketonemia risk group (Group K; n = 25; BHB ≥ 0.70 mmol/L). Statistical analysis was performed using a linear model that included the effect of the group and body condition score to assess differences in fatty acid (FA) concentrations. A total of 40 plasma FAs were assessed in each lipid class. Among the FAs, eight PLs, seven FFAs, four TGs, and four CEs increased according to BHB levels, while three FFAs, three TGs, and one CE decreased. The changes among lipid class profiles suggested the influence of inflammatory response, liver metabolism, and the state of body lipid reserves. In addition, the possible similarities of buffaloes at risk of hyperketonemia with ketotic cows suggest the necessity of further investigations in these ruminants.
1. Introduction
Increased interest in buffalo-derived products led to a gradual intensification of breeding conditions, resulting in a stressful environment that is thus far unknown to this species [1]. Generally, buffaloes are more similar to beef cattle than dairy cows from a morphological and metabolic point of view [1]. Anyway, the raised intensive management systems that maximize milk and meat, genetic selection, and higher nutritional requirements led to a higher incidence of several pathologies associated with metabolic imbalance [2]. A potentially critical period is the transition period characterized by major physiological, nutritional, metabolic, and immunological changes [3,4].
Amino acids, glycerol, and fatty acids (FA) are mobilized from skeletal muscle and adipose tissue during this period [5]. Consequently, non-esterified fatty acids (NEFAs) are released into the bloodstream and are used as an energy source by peripheral tissues and organs [2]. Altered liver functions or excessive lipomobilization promotes ketone body production, especially in β-hydroxybutyrate (BHB). Serum or plasma NEFA and BHB are accepted biomarkers of excessive negative energy balance in dairy cows and ewes [6,7]. Nevertheless, a specific BHB threshold for identifying metabolic disorders such as ketosis in buffaloes has not been established [4]. Both NEFA and BHB can negatively influence inflammatory response and immune system functions, promoting an increase in other metabolic and reproductive disorders [2,4]. The mobilization of lipids from adipose tissue induces not only the relative concentrations of total plasma lipids but also lipid fractions such as phospholipids (PLs), free fatty acids (FFAs), triglycerides (TGs), and cholesterol esters (CEs) [8,9]. Each of these fractions has a different function in animal metabolism [10].
To the best of the authors’ knowledge, the blood plasmatic lipid fractions related to ketone bodies have not been investigated in buffaloes. The aim of this study was to investigate metabolic alterations that are related to changes in plasma lipid classes according to different levels of energy deficits in early lactating Mediterranean buffaloes (MBs) using gas chromatography associated with thin-layer chromatography (TLC-GC).
2. Materials and Methods
2.1. Animals and Farm
For the study’s purposes, n° 63 MBs (Bubalus bubalis) were selected from a single dairy farm located in Caserta (Campania Region, Italy) and characterized by an artificially induced seasonal calving herd (late winter–springtime). The sample’s size was calculated according to Friedman (1982) [11]: Assuming an effect size of 0.40, a correlation analysis was carried out with a 0.90 power level and a two-tailed significant level of 0.05. All animals within 50 days in milk (DIM) were randomly selected from January to April 2019, within the entire group of fresh buffaloes. All buffaloes were milked twice a day.
The selected farm was casually extracted from a group of 10 farms that regularly require consultancy services at the Veterinary Teaching Hospital—Didactic Mobile Clinic Service of the Department of Veterinary Medicine and Animal Production of Naples (Italy). The inclusion criteria for selecting the farm were as follows: (i) a similar herd size (~400 buffaloes, consistent along the year); (ii) a total mixed ration (TMR)-based feeding system, given two times/day; (iii) the absence of a regular monitoring program for metabolic diseases; (iv) housing and overall management system respecting the minimum welfare standard for buffaloes [12].
The selected barn was characterized by solid grooved concrete floors in the walking and feeding alleys. The lying area comprised elevated cubicles covered with rubber mattresses (for milking MBs) or a roofed deep straw yard area (for dry MB). The TMR included the following ingredients: dry hay, ryegrass silage (plastic-wrapped baled) and corn silage, buffalo cake (Stick-Florido®, Fusco Industry, Caserta District, IT—characterized by 23% of crude proteins—originating mainly from legumes and cereals; crude fat at 5.5%; crude fiber at 7.5%; ash at 6.9%; and sodium at 0.32%), and sodium bicarbonate (0.8% of the diet dry matter). The composition of TMR was determined using a portable analyzer based on near-infrared reflectance spectroscopy (AgriNIRTM Analyzer, Dinamica Generale® s.p.a., Mantova, Italy).
2.2. Clinical Procedures and Experimental Design
The MBs selected were individually confined to a trimming chute and submitted to a complete clinical examination to exclude coexisting diseases (e.g., metritis, gastrointestinal disease, foot disorders, etc.), as performed in a previous study [13]. The four areas, including ribs, spine, hips, and tail base, where animals usually store adipose tissue were used to estimate the body condition score using a 9-point scoring system [14].
At the end of the clinical examination, blood samples were collected by carrying out jugular venipuncture with a 10 mL syringe (Becton Dickinson Hypodermic Syringes, Franklin Lakes, US—equipped with a 21-gauge needle). Some drops of blood (obtained directly by the syringe) were immediately used for a BHB test in the field (FreeStyle®, Abbott, Maidenhead, Berkshire, UK), while the remaining amount of blood was placed in one tube containing EDTA (Vacutainer®, Becton and Dickinson, Franklin Lakes, NJ, USA) and one tube containing a clot activator (Vacutainer®, Becton and Dickinson, Franklin Lakes, NJ, USA). Samples were then centrifuged (908× g × 15 min, centrifuge model DMO412, GIORGIO-BORMAC s.r.l., Carpi, IT) to obtain plasma and serum in the field. Therefore, a cross-sectional experimental design was used.
The plasma and serum samples were immediately placed in a cool box (4 °C) and brought at the same temperature to the reference laboratory of the University of Naples within 1 h of collection for further investigations. For each plasma sample, 250 µL of plasma was immediately transferred to Eppendorf tubes (maximum capacity 1 mL/tube) containing 5 mg of pyrogallol to reduce FA oxidation [15]. The samples were stirred until the pyrogallol was completely dissolved. Also, serum samples were transferred to Eppendorf tubes (1 mL of serum/tube) without pyrogallol. Immediately after, the two aliquots (plasma and serum) were sent on dry ice to the Department of Animal Medicine, Production, and Health (MAPS) at the University of Padua (Italy), arriving within 24 h and stored at −20 °C until biochemical and TLC-GC analyses.
2.3. Biochemical Analysis and Group Division
A multi-parametric analyzer was used to perform biochemical analysis (BT3500 Biotecnica Instruments S.p.a., Rome, Italy). The quantification of BHB (RANBUT RX Monza test; Randox, Crumlin, UK), NEFA (NEFA RX Monza test; Randox, Crumlin, UK), and Glucose (Glucose Monoreagent, LR; Gesan S.r.l, Campobello di Mazara, Italy) was added to the normal biochemical profile of the analyzer.
Considering that there is no specific BHB cut-off for buffaloes to identify animals as healthy and hyperketonemic, we selected a subjective cut-off, as described in the study of Fiore et al. [4]. Specifically, we used the BHB concentration reported in a previous study on healthy buffaloes at the same lactation period [16] using the mean BHB value of 0.4 mmol/L plus three standard deviations of 0.1 each to establish a subjective BHB cut-off of 0.7 mmol/L. According to the serum BHB concentrations obtained in the laboratory, MBs were then divided into the following groups: a healthy group (Group H) comprising 38 MBs with a level of BHB < 0.70 mmol/L and a group at risk of hyperketonemia (Group K) consisting of 25 MBs with BHB ≥ 0.70 mmol/L.
2.4. Thin Layer Chromatography Associated with Gas Chromatography (TLC-GC)
The procedure for plasma TLC-GC was similar to Fiore et al. (2020) [8] with respect to the plasma of dairy cows. Briefly, an internal standard for each lipid class (C15 for PL and C17 for FFA, TG, and CE) was added to each sample. Next, lipid extraction was performed via biphasic separation using chloroform and methanol (2:1, v/v). This solution allowed the distinction between a supernatant containing methanol and water and a subnatant containing chloroform and lipids divided by a thin protein state. To intensify the separation of the two portions, NaCl was added. Afterward, lipids were isolated using a heating block at 37 °C under a nitrogen flow to reduce fatty acid oxidation. Regarding TLC, the samples were dissolved in chloroform (100 µL) with BHT added (50 mg/L; antioxidant). The solutions were laid out on the deposition line of the TLC, which allowed lipid class separation via a different degree of affinity. The four lipid classes (PL, FFA, TG, and CE) were obtained by scraping the silica gel containing each lipid class for each sample. The lipid classes were then methylated using 3N methanolic hydrochloric acid and placed in an oven for one hour at 100 °C. Immediately after, samples were neutralized using a solution containing 10% of potassium carbonate (K2CO3), and the extracted lipids were dissolved in hexane with 50 mg/dl of BHT added. For each lipid class and sample, a total of 40 FA were identified and quantified in the splitless mode by GC using a TRACE GC/MS (Thermo Quest, Milan, Italy) equipped with a flame ionization detector (FID) and a polar fused-silica capillary column (Capillary Column Omegawax, 30 m × 0.25 mm × 0.2 µm film). Helium was used as the carrier gas at a flow rate of 1 mL/min. Data for plasma FA were calculated in mg/dL.
2.5. Statistical Analysis
Statistical analysis with one-way ANOVA was first used to compare the animal data and biochemical analyses between groups after evaluating the normal distribution using the Shapiro–Wilk test. The software used was R ver. 4.2.1 (R core team, Vienna, Austria).
Animal data (BCS, parity, DIM, and daily production) and biochemical data (NEFA, cholesterol (CHO), triglycerides (TGRs), glucose (GLU), γ-glutamyl-transferase (GGT), aspartate transaminase (AST), and alanine transaminase (ALT)) were included individually or associated as covariates in statistical models to assess differences in the FA profiles. These models were evaluated using the Akaike information criterion (AIC) and the Bayesian information criterion (BIC) to assess model performance. The linear model that included the fixed effect of the group and BCS as the covariate showed a lower AIC and BIC and was selected to assess the difference in FA concentrations between groups in each lipid class. A post hoc pairwise comparison among LSMEANS was performed using Bonferroni correction.
A p-value ≤ 0.05 was used to consider statistically significant differences, while a p-value between 0.05 and 0.1 was used to highlight differences with trend to significance.
The Boruta algorithm is a random forest classification algorithm that provides a numerical estimate of feature importance. During this analysis, multiple unbiased weak classifiers (decision trees) are used to perform a classification independently between decision tree parts. The importance measure of classifiers is obtained as the loss of accuracy of classification. Then, the average and standard deviation of the accuracy loss are computed [17]. This decision algorithm (R2 software ver. 4.2.3, Santa Monica, CA, USA) was used to select the FA within each lipid class that may provide a better classification for the group with BHB ≥ 0.70 mmo/L (Group K—at risk of hyperketonemia).
The consequently selected FA in each lipid class was used to obtain receiver operating characteristic (ROC) (MedCalc Sofware Ltd., Ostend, Belgium) curves to evaluate their diagnostic power and to establish the threshold value in order to identify animals at risk of hyperketonemia. The diagnostic power was assessed via the area under the curve (AUC), which identifies FA as an excellent marker when the AUC is 0.9 to 1.0; good if AUC is 0.8 to 0.9; moderate if AUC is 0.7 to 0.8; poor if AUC is 0.6 to 0.7; and fail if AUC is 0.5 to 0.6 [18]. The AUC is associated with the 95% confidence interval (CI) and the sensitivity (Se) and specificity (Sp) of the test.
3. Results
The animals’ data included BCS, parity, DIM, and daily production, which did not show differences between groups, except for BCS which was slightly greater in Group K compared to Group H (5.08 in Group K vs. 4.58 in Group H; p-value = 0.058). Regarding the biochemical analysis, BHB and AST were the only two parameters with greater concentrations in Group K (0.74 mmol/L and 164.0 u/L in Group K vs. 0.47 mmol/L and 140.0 u/L in Group H, respectively; p-values < 0.001 and 0.017) (Table 1).

Table 1.
Animal data and biochemical parameters of MBs divided into Group H (healthy group; BHB < 0.70 mmol/L) and Group K (at risk of hyperketonemia; BHB ≥ 0.70 mmol/L).
The differences in the FA profile of PL are shown in Table 2. All significant FAs of this lipid class (C8:0; C16:2 ω 4; C18:1 ω 9; C18:1 ω 7; C20:1 ω 11; C20:1 ω 9; C22:6 ω 3; and C24:1 ω 9) showed an increase in Group K compared to Group H. The FFA profile showed an increase of 7 FAs (C16:4 ω 1; C20:3 ω 3; C20:5 ω 3; C22:2 ω 6; C22:4 ω 6; C22:5 ω 3; and C24:1 ω 9) in Group K compared to Group H, while 3 FAs (C18:3 ω 6; C20:1 ω 9; and C22:1 ω 9) showed a decrease in the same group (Table 3). Four FAs of TG (C16:3 ω 4; C18:1 ω 7; C18:2 ω 6; and C24:1 ω 9) increased in Group K whereas 3 FAs (C10:0; C12:0; and C20:3 ω 3) decreased in the same group (Table 4). The differences in CE profiles are shown in Table 5. Among them, 4 FAs (C16:4 ω 1; C20:3 ω 3; C22:5 ω 3; C22:6 ω 3) increased in Group K, while FA C16:1 ω 7 decreased in the same group.
Table 2.
Least square means and standard error of the mean (SEM) of plasma phospholipid (PL) profiles associated with Group H (healthy group; BHB < 0.70 mmol/L) and Group K (at risk of hyperketonemia; BHB ≥ 0.70 mmol/L).
Table 3.
Least square means and standard error of the mean (SEM) of plasma free fatty acid (FFA) profiles associated with Group H (healthy group; BHB < 0.70 mmol/L) and Group K (at risk of hyperketonemia; BHB ≥ 0.70 mmol/L).
Table 4.
Least square means and standard error of the mean (SEM) of plasma triglyceride (TG) profiles associated with Group H (healthy group; BHB < 0.70 mmol/L) and Group K (at risk of hyperketonemia; BHB ≥ 0.70 mmol/L).
Table 5.
Least square means and standard error of the mean (SEM) of plasma cholesterol ester (CE) profiles associated with Group H (healthy group; BHB < 0.70 mmol/L) and Group K (at risk of hyperketonemia; BHB ≥ 0.70 mmol/L).
According to the Boruta test (Figure 1), 9 FAs were used to perform the ROC analysis among, and 3 FAs belonged to PL (C16:2 ω 4; C22:6 ω 3; and C24:1 ω 9), 1 belonged to FFA (C24:1 ω 9), 3 belonged to TG (C12:0; C16:2 ω 4; and C20:3 ω 3), and 2 belonged to CE (C16:1 ω 4; and C22:6 ω 3). The ROC curves identified the following (Figure 2):
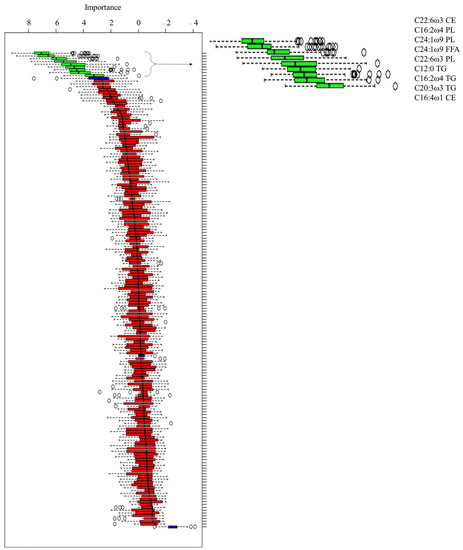
Figure 1.
Box plot of the Boruta decisional algorithm. The green box plot represents the predictive fatty acids selected by the Boruta analysis. The blue box plot represents fatty acids with a doubtful predictive function, while the red box plot represents fatty acids with a null predictive function.
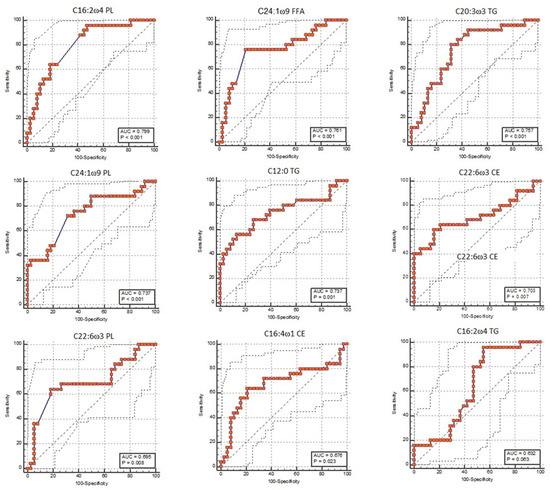
Figure 2.
Receiver operating characteristic (ROC) curve of predictive fatty acids listed with a decreasing predictive function (area under the curve (AUC)) and obtained using the Boruta decisional algorithm.
- Only 1 FA was not significant (C16:2 ω 4 TG; p-value = 0.063);
- One FA was a good marker: the C16:2 ω 4 PL (AUC: 0.80, CI: 0.68 to 0.89, cut-off > 0.526, Se: 96%, Sp: 52.6%; p-value < 0.001);
- Six FAs were moderate markers: C24:1 ω 9 FFA (AUC: 0.76, CI: 0.64 to 0.86, cut-off > 0.021, Se: 76%, Sp:79%; p-value < 0.001), C20:3 ω 3 TG (AUC: 0.76, CI: 0.63 to 0.86, cut-off ≤ 0.102, Se: 80%, Sp: 68.4%; p-value < 0.001), C24:1 ω 9 PL (AUC: 0.74, CI: 0.61 to 0.84, cut-off ≥ 0.374, Se: 72%, Sp: 68.4%; p-value < 0.001), C12:0 TG (AUC: 0.74, CI: 0.61 to 0.84, cut-off ≤ 0.522, Se: 56%, Sp: 86.8%; p-value < 0.001), C22:6 ω 3 CE (AUC: 0.70, CI: 0.58 to 0.81, cut-off > 0.159, Se: 60%, Sp: 84.2%; p-value = 0.007), and C22:6 ω 3 PL (AUC: 0.70, CI: 0.57 to 0.81, cut-off > 0.106, Se: 64%, Sp: 81.6%; p-value = 0.008);
- One FA was a poor marker: C16:4 ω 1 CE (AUC: 0.68, CI: 0.55 to 0.79, cut-off > 0.095, Se: 64%, Sp: 7 9%; p-value = 0.023).
4. Discussion
The onset of lactation induces greater metabolic demands during the transition period with consequent lipomobilization. The mobilization of lipids from adipose tissue involves the release of FA into the bloodstream. However, this condition not only affects the relative concentrations of total plasma lipids but also shifts the FA composition of the corresponding fractions (PL, FFA, TG, and CE). This change is partially due to the differences in FA distributions among lipid classes. These changes in blood lipids influence energy redistribution and cell metabolism and function [9,19].
The aim of the current study was to assess the lipid fractions in early lactation to investigate the metabolic changes associated with different levels of energy deficit.
The biochemical analysis identified a difference in AST concentrations. This enzyme tends to increase in the presence of liver injuries or muscle damage. Values of about 122 U/L have been associated with hepatic lipidosis in ketotic buffaloes [20,21]. In this study, both groups had slightly higher levels that might suggest the presence of hepatic damage.
Each lipid class has different metabolic functions. The PLs are the main components of biological membranes [9]. Furthermore, the FA composition of plasma PL is well correlated with the cell membrane FA composition of leukocytes in cows [22]. The main FAs of this lipid class are linoleic (C18:2 ω 6), stearic (C18:0), palmitic (C16:0), and oleic (C18:1 ω 9) acids in dairy cows [23]. This was also confirmed in the present study of buffalo plasma lipid classes, in which these four FAs accounted around 83% of the PLFA in both groups. Although there was no difference between groups in PL or PLFA concentrations, there was a difference in their profile. The identified changes involve increased concentrations of caprylic (C8:0), hexadecadienoic (C16:2 ω 4), oleic, vaccenic (C18:1 ω 7), gadoleic (C20:1 ω 11), gondoic (C20:1 ω 9), docosahexaenoic (DHA; C22:6 ω 3), and nervonic (C24:1 ω 9) acids in Group K. Even if only one saturated FA is increased, it can negatively affect membrane fluidity and, consequently, cellular function [24]. In addition, changes in the ω-3 profile of the membrane, such as DHA, may influence immune responses by leukocytes. Specifically, a decreased concentration of ω-3 associated with an increased concentration of palmitic acid may enhance leukocyte activation [19]. Nevertheless, palmitic acid was not found to be modified, and DHA increased, suggesting the absence of leukocyte activation. Anyway, this study used a cross-sectional experimental design; therefore, knowing the exact previous state of the animals is not possible. Moreover, five of eight increased FAs among PLFA were mono-unsaturated fatty acids (MUFAs). The MUFA content in PL is highly dependent on the gene expression of lipid-metabolizing enzymes such as stearoyl-desaturase 1 (SCD1) [25]. The expression of this gene with others was found to be increased in the liver of ketotic cows compared to subclinical or control animals and relevant for hepatic lipidosis [26]. Considering the increment of MUFA in the PL class and that Group K was only at risk of ketosis, these results suggest that more investigations of metabolic conditions in buffalo is needed because the manifestation of ketosis in this species may differ from cows.
The FFA is mainly transported in the bloodstream linked to albumin, and only a small amount is unbound. These FA are usually used for readily complete oxidation by a variety of tissues [9]. Ten FFAs were different between groups: γ-linolenic (GLA; C18:3 ω 6), gondoic (C20:1 ω 9), and erucic (C22:1 ω 9) acids decreased in Group K, whereas hexadecatetraenoic (C16:4 ω 1), eicosatrienoic (ETE; C20:3 ω 3), eicosapentanoic (EPA; C20:5 ω 3), docosadienoic (C22:2 ω 6), adrenic acid (ADA; C22:4 ω 6), docosapentaenoic (DPA; C22:5 ω 3), and nervonic (C24:1 ω 9) acids increased in the same group. Three increased FAs (ETE, EPA, and DPA) were metabolically related to each other and a component of ω-3 FA, which may be mobilized during inflammation due to their derived anti-inflammatory or pro-resolving mediators [15,27]. Also related to the inflammatory response, there were ω-6 FAs, such as docosadienoic acid, ADA, and GLA. ω-6 FAs can be used for the production of both pro- and anti-inflammatory mediators [19]. In particular, docosadienoic acid showed a positive relationship with inflammatory and oxidative stress states in horses [28]. In contrast, GLA and ADA can be used to synthesize arachidonic acid using elongase and desaturase or β-oxidation, respectively [29,30]. Increased docosadienoic acid levels could suggest an inflammatory state and reduced GLA levels that are potentially linked to the synthesis or maintenance of arachidonic acids with concentrations that do not show significant differences between the groups. However, ADA levels showed an increase in Group K. The cross-sectional design did not allow for assessing the FA profile over time but allowed for assessing the development or resolution of the inflammatory state. Furthermore, changes in MUFA concentrations, such as nervonic, gondoic, and erucic acids, may also be related to changes in SCD1 expression and the PL class. These results suggest an influence of the FFA profile that is available for immediate oxidation and potentially related to inflammatory states, but further studies over time are needed to further investigate these aspects in buffaloes.
TG represents the main storage site of long-chain FA in adipose or mammary tissues or the blood, such as very low-density lipoproteins (VLDLs), which represent their main carrier in the bloodstream [8,10]. The TG concentrations in the VLDL and liver are related to each other in dairy cows [31]. In fact, deposits in adipose tissue are mobilized with the onset of lactation to support increased energy demands. The influx of FA to the liver induces the increased synthesis of TG, which is normally exported from the liver as part of VLDL. However, if TG synthesis exceeds hepatic export capacity, it will accumulate in the vesicles in hepatocytes, leading to a fatty liver [10,32,33]. This lipid fraction usually shows an increase in palmitic, oleic, and linoleic acids during lipomobilization, while PUFA shows a depletion [34,35]. In our study, changes in palmitic or oleic acids were not evidenced. Instead, an increased concentration of linoleic acid (C18:2 ω 6) was evidenced in Group K. Regarding the PUFA level, a difference was present for hexadecatrienoic acid (C16:3 ω 4) and ETE (C20:3 ω 3), for which their concentrations increased and reduced in Group K, respectively. The decreased ETE level may be due to its mobilization as an FFA and its use for modulating inflammatory responses as previously mentioned. The study by Peter et al. [31] on humans reported that the TG fraction of VLDL is related to SCD1 expression in the liver. In our study, increased levels of vaccenic (C18:1 ω 7) and nervonic (C24:1 ω 9) acids were present in Group K. Anyway, further studies that focused on ruminants, especially buffaloes, should be performed to better assess this relationship.
The activity of lecithin-cholesterol acyltransferase (LCAT) enzymes and CE concentrations commonly exhibit low levels during the onset of lactation with the presence of a negative energy balance. However, these levels tend to increase progressively toward mid-lactation due to the metabolic adaptation of animals [36,37]. In our study, no difference in CE levels was identified between groups. Anyway, a different profile was present and particularly related to the increased level of ω-3 FA. CEs are generally found in membranes and lipoproteins. In the latter case, their function together with TGs is lipid transport between tissues [10]. In this lipid class, the concentration of ω-3 FA is expected to decrease in the first week of lactation due to the inflammatory response [19]. Considering that the animals in our study are in early lactation, the increased levels of ω-3 FA in Group K could indicate a progressive restoration of body lipid reserves, or their use has not yet occurred considering that they were still readily available as FFA. In addition, the increased levels of ω-3 FA in circulating FFAs may have also affected the profile of CE synthesized in the liver.
Among the significant FA in each lipid class, some FAs were selected using the Boruta test for their predictive function, and they were confirmed in eight out of nine FAs via ROC analysis. Among these FA, there were one saturated FA, two MUFAs, and five PUFAs from which three were ω-3 FAs. These FAs probably showed a greater biological significance in discriminations according to BHB levels and, therefore, should be evaluated more with respect to their specific physio-pathological functions. In particular, hexadecadienoic acid (C16:2 ω 4 PL) seems to show a clear promising role in MBs. Its biological function has been in-depth studied in human medicine, which awarded it with anti-inflammatory properties [38]. Indeed, it has been demonstrated that hexadecanoic acid can act as an anti-inflammatory agent by competing with phospholipase A2 and consequently inhibiting its activity [38]. This enzyme can release FA as arachidonic acid from cell membrane PLs via the hydrolysis of the ester bond at the sn-2 position. This enzymatic reaction is an important step in the formation of inflammatory mediators [38].
Our results showed higher concentrations of hexadecadienoic acid in buffaloes at risk of ketosis (Group K), enabling the authors to hypothesize an active role in the anti-inflammatory response and the potential development of distress and diseases related to a state of energy deficit. Looking at this interesting finding, its role in buffaloes should receive further attention from studies aiming to assess its reliability as a predictive marker of impaired metabolic statuses and related diseases.
5. Conclusions
Changes in the plasma FA profiles of major lipid classes may help further investigate metabolic alterations and adaptations in buffaloes during early lactation. Increased BHB levels above 0.70 mmol/L are associated with altered lipid class profiles. These highlighted changes among the FA profiles of lipid classes suggest the influence of inflammatory responses, liver metabolism, and body lipid reserve statuses. However, the cross-sectional experimental design limited the possibility of exactly assessing inflammation and body lipid reserve statuses. In addition, a suspected alteration of liver gene expression was hypothesized, and downregulation was evidenced in ketotic cows. Accordingly, the possible similarities in buffaloes at risk of hyperketonemia and ketotic cows suggest further investigations of this metabolic disease to evaluate a specific threshold of BHB and the manifestation of ketosis in this species.
Author Contributions
Conceptualization, A.L., M.C.A., J.G. and E.F.; methodology, M.C.A., P.C. and J.G.; software, A.L. and T.B.; validation, A.L., T.B. and E.F.; formal analysis, A.L.; investigation, M.C.A., P.C. and M.G.; resources, J.G. and E.F.; data curation, A.L., M.C.A., E.M., J.G. and E.F.; writing—original draft preparation, A.L., M.C.A., J.G. and E.F.; writing—review and editing, E.M., P.C., T.B. and M.G.; visualization, A.L.; supervision, E.F.; project administration, J.G. and E.F.; funding acquisition, E.F. All authors have read and agreed to the published version of the manuscript.
Funding
This study was funded and supported by the University of Padua from the “Bovine OMICS Project” (SID Fiore-protocol B.I.RD.-195883/19).
Institutional Review Board Statement
The current investigation received institutional approval from the Ethical Animal Care and Use Committee of the University of Naples Federico II (n .PG/2017/0099607). Moreover, the farmer was previously informed and agreed with the purposes and used methods. Finally, the protocol of this study was carried out according to the standards recommended by the Guide for the Care and Use of Laboratory Animals and Directive 2010/63/EU approved on 22 September 2010.
Informed Consent Statement
The study was performed with the consent of the animal’s owner during all procedures.
Data Availability Statement
The data will be available upon request by sending an email to the corresponding author.
Acknowledgments
All authors would like to thank the support of student Maria Tomiello for data extraction during laboratory work.
Conflicts of Interest
The authors declare no conflict of interest.
References
- De Rosa, G.; Napolitano, F.; Grasso, F.; Pacelli, C.; Bordi, A. On the Development of a Monitoring Scheme of Buffalo Welfare at Farm Level. Ital. J. Anim. Sci. 2005, 4, 115–125. [Google Scholar] [CrossRef]
- Alarcon, P.; Manosalva, C.; Carretta, M.D.; Hidalgo, A.I.; Figueroa, C.D.; Taubert, A.; Hermosilla, C.; Hidalgo, M.A.; Burgos, R.A. Fatty and Hydroxycarboxylic Acid Receptors: The Missing Link of Immune Response and Metabolism in Cattle. Vet. Immunol. Immunopathol. 2018, 201, 77–87. [Google Scholar] [CrossRef]
- Gianesella, M.; Fiore, E.; Arfuso, F.; Vecchio, D.; Curone, G.; Morgante, M.; Mazzotta, E.; Badon, T.; Rossi, P.; Bedin, S.; et al. Serum Haptoglobin and Protein Electrophoretic Fraction Modifications in Buffaloes (Bubalus bubalis) around Calving and during Early Lactation. J. Dairy Res. 2019, 86, 291–295. [Google Scholar] [CrossRef]
- Fiore, E.; Lisuzzo, A.; Laghi, L.; Harvatine, K.J.; Mazzotta, E.; Alterisio, M.C.; Ciaramella, P.; Zhu, C.; Contiero, B.; Faillace, V.; et al. Serum Metabolomics Assessment of Etiological Processes Predisposing Ketosis in Water Buffalo during Early Lactation. J. Dairy Sci. 2023, 106, 3465–3476. [Google Scholar] [CrossRef]
- Horst, E.A.; Kvidera, S.K.; Baumgard, L.H. Invited Review: The Influence of Immune Activation on Transition Cow Health and Performance—A Critical Evaluation of Traditional Dogmas. J. Dairy Sci. 2021, 104, 8380–8410. [Google Scholar] [CrossRef]
- Lisuzzo, A.; Laghi, L.; Fiore, F.; Harvatine, K.; Mazzotta, E.; Faillace, V.; Spissu, N.; Zhu, C.; Moscati, L.; Fiore, E. Evaluation of the Metabolomic Profile through 1H-NMR Spectroscopy in Ewes Affected by Postpartum Hyperketonemia. Sci. Rep. 2022, 12, 16463. [Google Scholar] [CrossRef]
- Fiore, E.; Arfuso, F.; Gianesella, M.; Vecchio, D.; Morgante, M.; Mazzotta, E.; Badon, T.; Rossi, P.; Bedin, S.; Piccione, G. Metabolic and Hormonal Adaptation in Bubalus Bubalis around Calving and Early Lactation. PLoS ONE 2018, 13, e0193803. [Google Scholar] [CrossRef]
- Fiore, E.; Tessari, R.; Morgante, M.; Gianesella, M.; Badon, T.; Bedin, S.; Mazzotta, E.; Berlanda, M. Identification of Plasma Fatty Acids in Four Lipid Classes to Understand Energy Metabolism at Different Levels of Ketonemia in Dairy Cows Using Thin Layer Chromatography and Gas Chromatographic Techniques (TLC-GC). Animals 2020, 10, 571. [Google Scholar] [CrossRef] [PubMed]
- Contreras, G.A.; O’Boyle, N.J.; Herdt, T.H.; Sordillo, L.M. Lipomobilization in Periparturient Dairy Cows Influences the Composition of Plasma Nonesterified Fatty Acids and Leukocyte Phospholipid Fatty Acids. J. Dairy Sci. 2010, 93, 2508–2516. [Google Scholar] [CrossRef]
- Kaneko, J.J.; Hervey, J.W.; Bruss, M.L. Clinical Biochemistry of Domestic Animals; Academic Press: San Diego, CA, USA, 2008; ISBN 9781626239777. [Google Scholar]
- Friedman, H. Simplified Determinations of Statistical Power, Magnitude of Effect and Research Sample Sizes. Educ. Psychol. Meas. 1982, 42, 521–526. [Google Scholar] [CrossRef]
- De Rosa, G.; Grasso, F.; Winckler, C.; Bilancione, A.; Pacelli, C.; Masucci, F.; Napolitano, F. Application of the Welfare Quality Protocol to Dairy Buffalo Farms: Prevalence and Reliability of Selected Measures. J. Dairy Sci. 2015, 98, 6886–6896. [Google Scholar] [CrossRef] [PubMed]
- Fadul, M.; D’Andrea, L.; Alsaaod, M.; Borriello, G.; Di Lori, A.; Stucki, D.; Ciaramella, P.; Steiner, A.; Guccione, J. Assessment of Feeding, Ruminating and Locomotion Behaviors in Dairy Cows around Calving—A Retrospective Clinical Study to Early Detect Spontaneous Disease Appearance. PLoS ONE 2022, 17, e0264834. [Google Scholar] [CrossRef] [PubMed]
- Guccione, J.; Carcasole, C.; Alsaaod, M.; D’Andrea, L.; Di Loria, A.; De Rosa, A.; Ciaramella, P.; Steiner, A. Assessment of Foot Health and Animal Welfare: Clinical Findings in 229 Dairy Mediterranean Buffaloes (Bubalus bubalis) Affected by Foot Disorders. BMC Vet. Res. 2016, 12, 107. [Google Scholar] [CrossRef]
- Lisuzzo, A.; Fiore, F.; Harvatine, K.; Mazzotta, E.; Berlanda, M.; Spissu, N.; Badon, T.; Contiero, B.; Moscati, L.; Fiore, E. Changes in Plasma Fatty Acids Profile in Hyperketonemic Ewes during Early Lactation: A Preliminary Study. Sci. Rep. 2022, 12, 17017. [Google Scholar] [CrossRef] [PubMed]
- Fiore, E.; Giambelluca, S.; Morgante, M.; Contiero, B.; Mazzotta, E.; Vecchio, D.; Vazzana, I.; Rossi, P.; Arfuso, F.; Piccione, G.; et al. Changes in Some Blood Parameters, Milk Composition and Yield of Buffaloes (Bubalus bubalis) during the Transition Period. Anim. Sci. J. 2017, 88, 2025–2032. [Google Scholar] [CrossRef]
- Kursa, M.B.; Rudnicki, W.R. Feature Selection with the Boruta Package. J. Stat. Softw. 2010, 36, 1–13. [Google Scholar] [CrossRef]
- Xia, J.; Broadhurst, D.I.; Wilson, M.; Wishart, D.S. Translational Biomarker Discovery in Clinical Metabolomics: An Introductory Tutorial. Metabolomics 2013, 9, 280–299. [Google Scholar] [CrossRef]
- Contreras, G.A.; Sordillo, L.M. Lipid Mobilization and Inflammatory Responses during the Transition Period of Dairy Cows. Comp. Immunol. Microbiol. Infect. Dis. 2011, 34, 281–289. [Google Scholar] [CrossRef]
- Russell, K.E.; Roussel, A.J. Evaluation of the Ruminant Serum Chemistry Profile. Vet. Clin. N. Am. Food Anim. Pract. 2007, 23, 403–426. [Google Scholar] [CrossRef]
- Youssef, M.A.; El-Khodery, S.A.; El-deeb, W.M.; El-Amaiem, W.E.E.A. Ketosis in Buffalo (Bubalus Bubalis): Clinical Findings and the Associated Oxidative Stress Level. Trop. Anim. Health Prod. 2010, 42, 1771–1777. [Google Scholar] [CrossRef]
- Watts, J.S.; Rezamand, P.; Sevier, D.L.; Price, W.; McGuire, M.A. Short-Term Effects of Dietary Trans Fatty Acids Compared with Saturated Fatty Acids on Selected Measures of Inflammation, Fatty Acid Profiles, and Production in Early Lactating Holstein Dairy Cows. J. Dairy Sci. 2013, 96, 6932–6943. [Google Scholar] [CrossRef] [PubMed]
- Tyburczy, C.; Lock, A.L.; Dwyer, D.A.; Destaillats, F.; Mouloungui, Z.; Candy, L.; Bauman, D.E. Uptake and Utilization of Trans Octadecenoic Acids in Lactating Dairy Cows. J. Dairy Sci. 2008, 91, 3850–3861. [Google Scholar] [CrossRef] [PubMed]
- Lacetera, N.; Franci, O.; Scalia, D.; Bernabucci, U.; Ronchi, B.; Nardone, A. Effects on Functions of Ovine Blood Mononuclear Cells for Each of Several Fatty Acids at Concentrations Found in Plasma on Healthy and Ketotic Ewes. Am. J. Vet. Res. 2002, 63, 958–962. [Google Scholar] [CrossRef] [PubMed]
- Weiss-Hersh, K.; Garcia, A.L.; Marosvölgyi, T.; Szklenár, M.; Decsi, T.; Rühl, R. Saturated and Monounsaturated Fatty Acids in Membranes Are Determined by the Gene Expression of Their Metabolizing Enzymes SCD1 and ELOVL6 Regulated by the Intake of Dietary Fat. Eur. J. Nutr. 2020, 59, 2759–2769. [Google Scholar] [CrossRef] [PubMed]
- Zhu, Y.; Liu, G.; Du, X.; Shi, Z.; Jin, M.; Sha, X.; Li, X.; Wang, Z.; Li, X. Expression Patterns of Hepatic Genes Involved in Lipid Metabolism in Cows with Subclinical or Clinical Ketosis. J. Dairy Sci. 2019, 102, 1725–1735. [Google Scholar] [CrossRef]
- Bernal-Santos, G.; O’Donnell, A.M.; Vicini, J.L.; Hartnell, G.F.; Bauman, D.E. Hot Topic: Enhancing Omega-3 Fatty Acids in Milk Fat of Dairy Cows by Using Stearidonic Acid-Enriched Soybean Oil from Genetically Modified Soybeans. J. Dairy Sci. 2010, 93, 32–37. [Google Scholar] [CrossRef]
- Siard-Altman, M.H.; Harris, P.A.; Moffett-Krotky, A.D.; Ireland, J.L.; Betancourt, A.; Barker, V.D.; McMurry, K.E.; Reedy, S.E.; Adams, A.A. Relationships of Inflamm-Aging with Circulating Nutrient Levels, Body Composition, Age, and Pituitary Pars Intermedia Dysfunction in a Senior Horse Population. Vet. Immunol. Immunopathol. 2020, 221, 110013. [Google Scholar] [CrossRef]
- Singh, N.; Barnych, B.; Wagner, K.M.; Wan, D.; Morisseau, C.; Hammock, B.D. Adrenic Acid-Derived Epoxy Fatty Acids Are Naturally Occurring Lipids and Their Methyl Ester Prodrug Reduces Endoplasmic Reticulum Stress and Inflammatory Pain. ACS Omega 2021, 6, 7165–7174. [Google Scholar] [CrossRef]
- Wang, X.; Lin, H.; Gu, Y. Multiple Roles of Dihomo-γ-Linolenic Acid against Proliferation Diseases. Lipids Health Dis. 2012, 11, 25. [Google Scholar] [CrossRef]
- Peter, A.; Cegan, A.; Wagner, S.; Lehmann, R.; Stefan, N.; Königsrainer, A.; Königsrainer, I.; Häring, H.U.; Schleicher, E. Hepatic Lipid Composition and Stearoyl-Coenzyme A Desaturase 1 MRNA Expression Can Be Estimated from Plasma VLDL Fatty Acid Ratios. Clin. Chem. 2009, 55, 2113–2120. [Google Scholar] [CrossRef]
- Zhang, G.; Ametaj, B.N. Ketosis an Old Story Under a New Approach. Dairy 2020, 1, 42–60. [Google Scholar] [CrossRef]
- Oikawa, S.; Mizunuma, Y.; Iwasaki, Y.; Tharwat, M. Changes of Very Low-Density Lipoprotein Concentration in Hepatic Blood from Cows with Fasting-Induced Hepatic Lipidosis. Can. J. Vet. Res. 2010, 74, 317–320. [Google Scholar]
- McFadden, J.W. Review: Lipid Biology in the Periparturient Dairy Cow: Contemporary Perspectives. Animal 2020, 14, S165–S175. [Google Scholar] [CrossRef] [PubMed]
- Douglas, G.N.; Rehage, J.; Beaulieu, A.D.; Bahaa, A.O.; Drackley, J.K. Prepartum Nutrition Alters Fatty Acid Composition in Plasma, Adipose Tissue, and Liver Lipids of Periparturient Dairy Cows. J. Dairy Sci. 2007, 90, 2941–2959. [Google Scholar] [CrossRef] [PubMed]
- Tessari, R.; Berlanda, M.; Morgante, M.; Badon, T.; Gianesella, M.; Mazzotta, E.; Contiero, B.; Fiore, E. Changes of Plasma Fatty Acids in Four Lipid Classes to Understand Energy Metabolism at Different Levels of Non-Esterified Fatty Acid (Nefa) in Dairy Cows. Animals 2020, 10, 1410. [Google Scholar] [CrossRef]
- Gross, J.J.; Kessler, E.C.; Albrecht, C.; Bruckmaier, R.M. Response of the Cholesterol Metabolism to a Negative Energy Balance in Dairy Cows Depends on the Lactational Stage. PLoS ONE 2015, 10, e0121956. [Google Scholar] [CrossRef]
- Aparna, V.; Dileep, K.V.; Mandal, P.K.; Karthe, P.; Sadasivan, C.; Haridas, M. Anti-Inflammatory Property of n-Hexadecanoic Acid: Structural Evidence and Kinetic Assessment. Chem. Biol. Drug Des. 2012, 80, 434–439. [Google Scholar] [CrossRef]


Disclaimer/Publisher’s Note: The statements, opinions and data contained in all publications are solely those of the individual author(s) and contributor(s) and not of MDPI and/or the editor(s). MDPI and/or the editor(s) disclaim responsibility for any injury to people or property resulting from any ideas, methods, instructions or products referred to in the content. |
© 2023 by the authors. Licensee MDPI, Basel, Switzerland. This article is an open access article distributed under the terms and conditions of the Creative Commons Attribution (CC BY) license (https://creativecommons.org/licenses/by/4.0/).