Article

Functional Additives in a Selected European Sea Bass (Dicentrarchus labrax) Genotype: Effects on the Stress Response and Gill Antioxidant Response to Hydrogen Peroxide (H2O2) Treatment

1
Grupo de Investigación en Acuicultura (GIA), IU-ECOAQUA, Universidad de las Palmas de Gran Canaria, Crta. Taliarte s/n, 35214 Telde, Las Palmas, Spain
2
Department of Biotechnology and Life Sciences, University of Insubria, Via J.H. Dunant, 3, 21100 Varese, Italy
3
Global Solution Aquaculture Unit, Delacon Biotechnik Gmbh, 4209 Engerwitzdorf, Austria
4
Ecloserie Marine de Graveline Ichtus, Route des Enrochements, 59820 Gravelines, France
5
SYSAAF, French Association of Poultry and Aquaculture Breeders, Campus de Beaulieu, 35042 Rennes, France
6
MARBEC, University of Montpellier, CNRS, Ifremer, IRD, 34250 Palavas-les-Flots, France
*
Author to whom correspondence should be addressed.
Animals 2023, 13(14), 2265; https://doi.org/10.3390/ani13142265
Submission received: 26 April 2023 / Revised: 6 July 2023 / Accepted: 9 July 2023 / Published: 11 July 2023

Abstract

:

Simple Summary

Husbandry practices in aquaculture production may lead to stress processes and oxidative stress damages on fish tissues. Functional ingredients have profiled as suitable candidates for reinforcing the fish antioxidant response and stress tolerance. In addition, selective breeding strategies have also demonstrated a correlation between fish growth and stress reactiveness, which may be a key component in species domestication. The present study evaluates the potential of three different functional additives for gill endogenous antioxidant capacity and stress relief in a growth selected genotype of European sea bass (Dicentrarchus labrax) juveniles fed low-FM/FO diets. For this purpose, after 72 days of a feeding trial, all fish were subjected to an oxidative stress challenge consisting of a 1 h bath exposure to hydrogen peroxide (H2O2) at a total concentration of 50 ppm. The functional additives induced a better recovery from the stress process, with a higher reduction in fish circulating plasma cortisol 24 h after oxidative stress. In addition, the functional additives induced higher catalase gill gene expression in response to the oxidative stress insult.

Abstract

Functional ingredients have profiled as suitable candidates for reinforcing the fish antioxidant response and stress tolerance. In addition, selective breeding strategies have also demonstrated a correlation between fish growth performance and susceptibility to stressful culture conditions as a key component in species domestication processes. The aim of the present study is to evaluate the ability of a selected high-growth genotype of 300 days post-hatch European sea bass (Dicentrarchus labrax) juveniles to use different functional additives as endogenous antioxidant capacity and stress resistance boosters when supplemented in low fish meal (FM) and fish oil (FO) diets. Three isoenergetic and isonitrogenous diets (10% FM/6% FO) were supplemented with 200 ppm of a blend of garlic and Labiatae plant oils (PHYTO0.02), 1000 ppm of a mixture of citrus flavonoids and Asteraceae and Labiatae plant essential oils (PHYTO0.1) or 5000 ppm of galactomannan-oligosaccharides (GMOS0.5). A reference diet was void of supplementation. The fish were fed the experimental diets for 72 days and subjected to a H2O2 exposure oxidative stress challenge. The fish stress response was evaluated through measuring the circulating plasma cortisol levels and the fish gill antioxidant response by the relative gene expression analysis of nfΚβ2, il-1b, hif-1a, nd5, cyb, cox, sod, cat, gpx, tnf-1α and caspase 9. After the oxidative stress challenge, the genotype origin determined the capacity of the recovery of basal cortisol levels after an acute stress response, presenting GS fish with a better pattern of recovery. All functional diets induced a significant upregulation of cat gill gene expression levels compared to fish fed the control diet, regardless of the fish genotype. Altogether, suggesting an increased capacity of the growth selected European sea bass genotype to cope with the potential negative side-effects associated to an H2O2 bath exposure.

1. Introduction

The use of biocide compounds is an extended practice in aquaculture production in order to eliminate microorganisms and other pathogenic agents in aquaculture facilities [1,2]. Among them, hydrogen peroxide (H2O2) is a powerful oxidizer compound used against fish external parasites and bacteria [3,4,5] with proven effectiveness in treating diseases in European sea bass (Dicentrarchus labrax) [6,7]. However, this compound is an important source of reactive oxygen species (ROS), which may induce severe tissue damages, especially on those directly exposed to the surrounding environment [8,9].
Fish gills act as a physical and biochemical semipermeable barrier with an important role in fish respiratory processes, hydromineral balance and immune responses [10,11]. In response to a stress process, such as those derived from biocides or other pollutants exposure, cortisol will target gill tissue, triggering mitochondrial rich cells (MRCs) oxidative phosphorylation (OXPHOS) in order to supply ATP to the Na+/K+ ATPase pumps involved in fish hydromineral and osmotic balance reestablishment [12,13]. During OXPHOS, some electrons may leak the electronic transport chain (ETC) prior to being reduced by the cytochrome c oxidase, reacting in the mitochondrial intermembrane with oxygen (O2) to form superoxide anions (O2−) [14,15]. Then, superoxide- will be transformed by the superoxide dismutase enzyme (SOD) into H2O2, which will be finally detoxified by catalase (CAT) and glutathione peroxidase (GPX) into water and O2 [16]. Nevertheless, in a high-stress-susceptible fish species such as the European sea bass [17,18], the cumulative effects of both internal and external ROS increased concentrations may overwhelm fish antioxidant defense, leading to oxidative stress processes including cellular membrane lipid peroxidation and protein and DNA destruction [14,19].
Supplementing fish diets with phytogenic feed additives (PFAs) has shown potential in reinforcing the fish antioxidant status [20,21]. PFAs are plant-derived bioactive compounds with elevated contents of flavonoids, tannins and mucilages with high antioxidant properties [22,23,24]. Additionally, supplementing fish diets with PFAS has been reported to be capable of attenuating different fish species’ stress responses [25,26,27,28,29]. Plant-derived prebiotic compounds are another variety of functional additives with a potential reinforcing fish antioxidant defense [22,29]. Prebiotics have the ability to benefit the host health by selectively modulating the fish microbiome composition [30]. In previous studies, the galactomannan-oligosaccharides (GMOS) protected European sea bass juveniles’ gills against the damages derived from oxidative stress [26,31,32]. Even though a wide variety of studies report the benefits of functional additives supplementation, the mechanisms by which these compounds may favor the fish health status and welfare are still not clearly defined. Several factors can define the functional additives’ effects on fish performance, such as the different bioactive compounds’ properties, dietary inclusion levels, dietary production methodologies and the fish’s capacity to harness these products [29,31,33,34,35].
In this scenario, selective breeding has been recognized as a permanent and cumulative solution for improving fish feed efficiency and feed utilization [36,37,38], resulting in increased growth performance and better health and welfare [39]. Fish genotype selection may also contribute to increased growth performance, even coping with the nutritional variations associated with low fish meal (FM)- and fish oil (FO)-based diets [40]. Furthermore, one of the main effects of selective breeding is the fish species domestication processes by which the captive species becomes adapted to the rearing conditions [36], reducing the negative side effects associated with cultured conditions’ stress processes [41].
Accordingly, the aim of the present study was to determine the gill antioxidant capacity and stress tolerance against an H2O2 exposure oxidative stress challenge in a growth selected European sea bass genotype fed low FM/FO-based diets supplemented with three different plant-derived functional additives, PHYTO0.02, PHYTO0.01 or GMOS0.5.

2. Materials and Methods

2.1. Experimental Diets

Four low FM/FO (10%/6%) diets with isoenergetic and isonitrogenous formulations were produced by Biomar (Brande, Denmark), meeting the nutritional requirements for European sea bass juveniles [42,43]. A reference diet void of supplementation (Control), a diet supplemented with 200 ppm of a blend of garlic and Labiatae plant oils (87.5 mg terpenes/kg diet; PHYTO0.02), a diet supplemented with 1000 ppm of a mixture of citrus flavonoids and Asteraceae and Labiatae plant essential oils (57 mg terpenes/kg diet; PHYTO0.1) and a diet supplemented with 5000 ppm of galactomannan-oligosaccharides (GMOS0.5). The functional ingredients were supplemented according to the producer’s recommendations (Delacon, Engerwitzdorf, Austria). The PHYTO0.1 and GMOS0.05 additives were included in the mix during the pre-extrusion process in order to ensure product stability. The PHYTO0.02 additive was homogenized with the dietary oils and included by vacuum coating during the post-extrusion process (Table 1).

2.2. Population Design and Fish Production

The experimental design contemplated two European sea bass genotypes, a high growth selected genotype (GS) and a wild type genotype (WT), with the same scheme of selection and details previously described in [40,44].
Briefly, both genotypes were produced in the facilities of Palavas-les-flot (France) by mating 7 dams selected for growth from the MARBEC-IFREMER broodstock with 33 sires (genetically selected, GS) derived from the breeding nucleus of the EMG Ecloserie Marine de Gravelines (Gravelines, France) breeding company or 32 wild sires captured in the gulf of Lion (Wild type genotype, WT). Dams’ eggs were collected by stripping and pooled in equal representation between dams, and they were transferred into 65 tubes (one per sire). The two resulting genotypes were incubated separately at 14 °C until hatching. One-day-old hatched larvae were pooled by the equi-representation of each dam and shipped to the University of Las Palmas de Gran Canaria (ULPGC, Las Palmas de Gran Canaria, Spain) by airplane into oxygen-saturated water transport bags that were kept in insulated boxes. The larvae were grown in separated tanks following the standardized methodology of the Research Group in Aquaculture [45,46] at the ULPGC facilities. Progenies from both genotypes were kept at similar conditions during the preweaning, weaning and early juvenile growing phases.

2.3. Experimental Conditions

At 300 days post-hatching (dph), the fish genotype induced significant differences in fish growth. A total of 180 GS fish with a mean weight of 104.9 ± 3.1 g were randomly pooled and distributed in four 500 L tanks (30 fish/tank, 1 tank per dietary treatment). On the other hand, 360 WT fish with a mean weight of 58 ± 1.6 g were randomly pooled and distributed in twelve 500 L tanks (45 fish/tank, 3 tanks per dietary treatment). The experimental tanks presented similar initial culture densities. The tanks were supplied with filtered sea water (18.8–20 °C and 6.1–6.6 ppm dissolved oxygen) in a flow-through system under a natural photoperiod (12L:12D). The experimental diets were fed 3 times a day, 6 days a week until apparent satiation from 12 March to 29 May 2020 (72 days). The feed intake was monitored daily, and the growth performance and feed utilization were calculated at the end of the feeding experience.
At the end of the feeding experience, six fish per dietary treatment and genotype level (two fish/WT tank and six fish/GS tank) were used to obtain blood plasma samples for circulating plasma cortisol analysis and gill samples for relative gene expression analysis. This sampling point was considered as the basal point, t = 0 h (pre-stress challenge), in the statistical analysis.

2.4. Oxidative Stress Challenge

After 72 days of a feeding trial, experimental fish were subjected to an oxidative stress challenge consisting of a 1 h bath exposure to hydrogen peroxide (H2O2), following the procedure previously described by Roque and co-authors in 2010 [8]. Briefly, H2O2 treatment was applied by stopping experimental tanks’ water flow and aeration and adding H2O2 at a nominal concentration of 50 ppm. After 1 h of exposure, the tanks’ water flow and aeration were restored and kept at maximum renovation rate for 2 h in order to remove all the remaining H2O2.
At 2 h and 24 h after the oxidative stress challenge, six fish per dietary treatment and genotype level (two fish/WT tank and six fish/GS tank) were used to obtain blood plasma samples for circulating plasma cortisol analysis and gill samples for relative gene expression analysis.

2.5. Sampling Methodology

Prior to manipulation, the fish were anesthetized using diluted clove oil (diluted in ethanol 100% (1:2)) (Guinama S.L; La Pobla de Vall Bona, Valencia (46185), Spain, Ref. Mg83168) at a concentration of 0.02 mL/L.
Blood samples were obtained by a caudal sinus puncture with 1 mL syringes, stored on an heparin-coated Eppendorf and immediately centrifuged at 3000 g for 5 min at 4 °C in order to obtain plasma samples. Plasma samples were stored at −80 °C until plasmatic cortisol analysis. The plasmatic cortisol concentration was determined using the assay kit (Access Cortisol ref 33600, ©2010 Beckman Coulter, Inc.; Alcobendas, Madrid (28108), Spain) by an external laboratory Animal Lab (Las Palmas de Gran Canaria, Gran Canaria, Canary Island, Spain).
Gill samples for relative gene expression were obtained after fish euthanasia by head blow. The second and third holobranch from the fish’s left side were excised, placed in 1.5 mL Eppendorf with RNAlater and kept at 4 °C for 24 h. Afterwards, RNAlater was removed, and the samples were frozen at −80 °C until the relative gene expression analysis. RNAlater was prepared by dilution in 1 L deionized water of 650 g ammonium sulfate, 7.4 g sodium citrate dihydrate, 7.4 g EDTA di sodium salt and 200–500 µL concentrated sulfuric acid, with a final pH of 5.2, obtaining 1.4 L of RNAlater.

2.6. RNA Extraction and Real-Time PCR Analysis

The gill (approx. 50 mg/sample) total mRNA (ng/μL) was extracted by employing TRI-reagent (Sigma-Aldrich, Sant Louis, MO, USA) from the extraction kit RNeasy Minikit from Qiagen. An iScriptTM cDNA synthesis Kit (Bio-Rad, Hercules, CA, USA) was employed to perform the reverse transcriptions to obtain cDNA in a 20 μL reaction containing 1 μL of the total mRNA at a concentration of 0.5 μg/μL.
The real-time PCR analysis was performed with an iCycler with the optical module in a final volume of a 20 μL reaction, containing 10 μL iQTM-SYBER® Green Supermix (Bio-Rad, Hercules, CA, USA), 5 μL of free-nuclease water, 3 μL of cDNA (1:10 dilution) and 1 μL of forward and reverse primer. The target genes were the nuclear factor kappa beta-2 (nfκβ2), interleukin 1β (il1β); hypoxia inducible factor 1α (hif-1α), NADH dehydrogenase subunit 5 (nd5), cytochrome b (cyb), cytochrome oxidase subunit 1 (cox), mitochondrial respiratory uncoupling protein 1 (ucp1), superoxide dismutase (sod), catalase (cat), glutathione peroxidase (gpx), tumor necrosis factor 1α (tnf-1α) and caspase 9 (casp-9). The specific primer sequences, annealing temperatures and accession numbers are presented in Table 2. The real-time running conditions were: 95 °C for 1 min, followed by 40 cycles at 95 °C for 10 s and an annealing temperature for 30 s (Table 2). All reactions were performed in duplicate for each sample, and a blank control containing nuclease-free water instead of cDNA in the final volume mix was included in each assay. Two constitutive genes were tested: α-tubulin (α-tub) and the ribosomal protein L17 (rpl17). Applying the CFX MaestroTM Software selection tool (CFX Maestro™ Software User Guide Version 1.1, Biorad), the α-tub was selected as the most stable and amplification-efficient reference gene. The relative gene expression levels were calculated using the 2−ΔΔCt method [47,48], using α-tubulin as the housekeeping gene. The gene expression was calculated relative to the transcript levels of WT fish fed the control diet at t = 0 h (pre-stress challenge).

2.7. Statistical Analyses

All the analyses were performed with R Project for Statistical Computing. Means and standard deviations (SD) were calculated for each parameter measured.
To assess differences in fish growth and feed utilization among the genotypes, differences in the mean specific growth rate (SGR), feed conversion ratio (FCR) and individual feed intake among the selected genotypes were tested by one-way analysis of variance (ANOVA) and a Tukey test. Similarly, to assess differences in fish growth and feed utilization among the experimental diets, differences in the mean SGR, FCR and individual feed intake among the selected experimental diets were tested by one-way analysis of variance (ANOVA) and a Tukey test. A three-way analysis of variance (ANOVA) and a Tukey test were performed to assess differences in the fish stress response and gill relative gene expression between the genotypes and experimental dietary treatments along the different sampling points.
Prior to analysis, all data were tested for outlying values through linear regression adjustment, defining the outside cut-offs as 1.5 times the Inter-Quantile Range (IQR) below the first and above the third quantiles [57,58]. Before the analysis, a Kolmogorov–Smirnov test was used to assess the quantile normality, and Levene’s test was used to assess the homogeneity of the variance. Where there was significant variance heterogeneity, the data were transformed by the square root or log transformation. When transformations did not remove the heterogeneity, the analysis was performed with untransformed data with the F-test α-value set at 0.01 [59].

3. Results

3.1. Feeding Experience

All fish grew properly along the feeding trial (72 days), presenting GS fish with significantly (p < 0.05) higher final body weights than those of WT fish (p < 0.05). GS fish presented significantly improved FCR values and lower individual feed intake values than WT fish (Table 3). Within each genotype, dietary functional additives did not affect the fish final body weight and length. No significant differences in the fish specific growth rate were found (Table 3).

3.2. Stress Response

At the end of the feeding experience (pre-oxidative stress challenge, t = 0 h), the GS fish presented significantly lower (p < 0.05) levels of mean basal circulating plasma cortisol than the WT fish. The GS fish presented a mean basal concentration of 1.7 ± 0.51 ng/mL per fish g; meanwhile, the WT fish presented a mean basal concentration of 3.67 ± 0.15 ng/ mL per fish g (Table 4).
In response to the oxidative stress challenge, at 2 h after H2O2 exposure, all the experimental groups presented a significant increase (p < 0.05) in circulating cortisol levels compared to the basal levels, regardless of the genotype or the dietary treatment fed. The H2O2 exposure increased the GS fish cortisol up to levels ×2.4 fold higher compared to the basal levels. Meanwhile, the WT fish presented an increase in cortisol levels of ×1.7 fold compared to their basal levels.
After 24 h of the oxidative stress challenge, all experimental groups presented a significant reduction (p < 0.05) in plasmatic cortisol levels down to the basal levels observed at t = 0 h pre-oxidative stress challenge, regardless of the genotype or the dietary treatment fed. The GS fish presented a decrease in cortisol levels of ×2.2 fold compared to those levels observed at 2 h post-oxidative stress challenge, whereas the WT fish cortisol levels presented a decrease of ×1.7 fold compared to those levels observed at 2 h after the oxidative stress challenge.

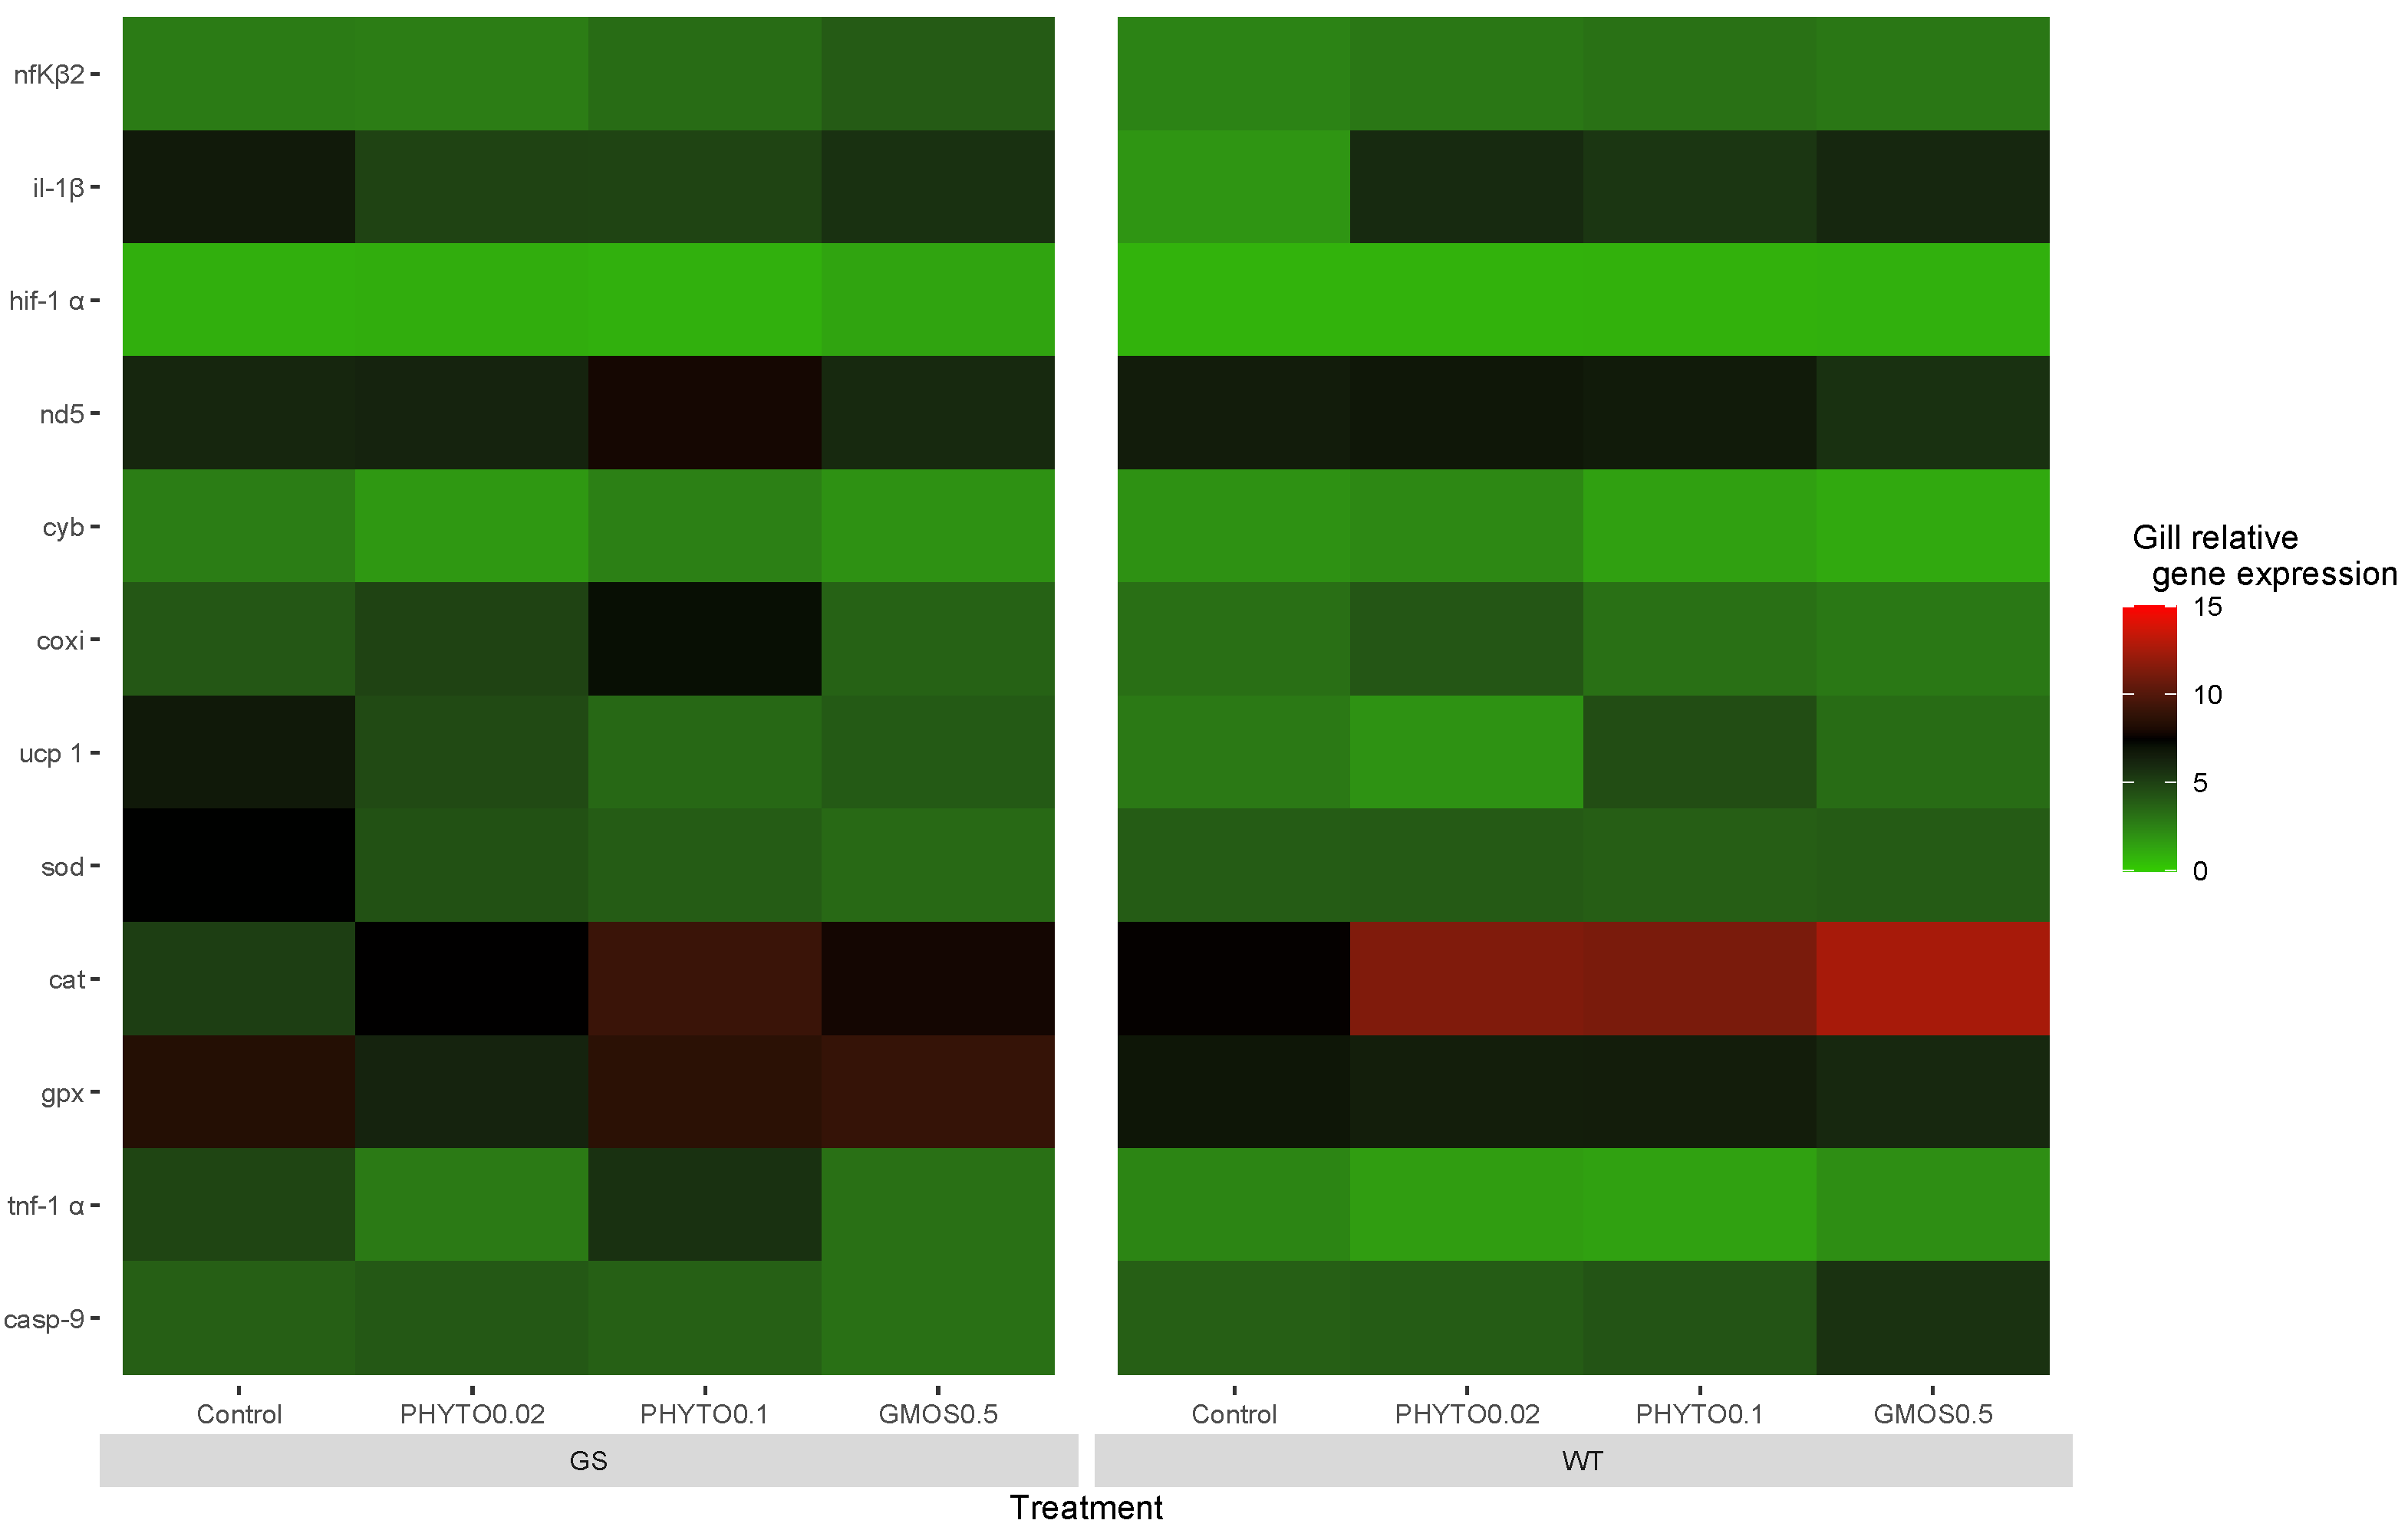
3.3. Gill Relative Gene Expression

Prior to the oxidative stress challenge (t = 0 h), the fish gill antioxidant defense-related gene expression presented significant differences (p < 0.05) associated with the interaction between the genotype and the dietary treatment fed (Figure 1). The GS fish fed the control and PHYTO0.1 diets showed a higher (p < 0.05) cat basal gill expression compared to the WT fish fed the same dietary treatments. The GS fish fed the control diet also presented upregulated (p < 0.05) sod gene expression levels compared to the WT fish fed the same diet. On the contrary, the WT fish fed the GMOS0.5 diet presented a higher (p < 0.05) sod basal gene expression than the GS fish fed the same dietary treatment.
Within the WT fish genotype, the diet fed directly affected the fish gill basal antioxidant gene expression. The fish fed the GMOS0.5 diet presented the highest (p < 0.05) sod expression levels, followed by PHYTO0.02 and PHYTO0.1, respectively. Similarly, those fish fed with PHYTO0.1 and GMOS0.5 diets presented the highest (p < 0.05) gpx gill expression levels. Those fish fed the GMOS0.5 diet presented significantly higher (p < 0.05) hif-1α relative expression levels than those fish fed the control and PHYTO0.1 diets (Appendix A Table A1).
Two hours post-oxidative stress challenge, a generalized upregulation of antioxidant defense-related gene expression was observed. All fish presented a significant increase (p < 0.05) in cat and gpx gill expression levels (Appendix A Table A1), whereas the gill sod gene expression presented significant differences associated with the fish genotype and the dietary treatment fed. The GS fish fed the control diet presented an upregulation (p < 0.05) of gill sod relative expression levels compared to the WT fish fed the same dietary treatment. In fact, within the GS genotype, the fish fed the control diet induced the highest (p < 0.05) sod expression levels. Accordingly, as a response to the H2O2 exposure, an up-regulation of the mitochondrial ETC-related gene expression was observed. All the experimental fish groups presented a general increase (p < 0.05) in cox transcript levels, independently of the fish origin or diet fed. However, this response was more acute for GS fish fed the PHYTO0.1 diet, which presented a higher (p < 0.05) expression than the WT fish fed the same diet. The GS fish fed the control diet were the only experimental group presenting an increase (p < 0.05) in gill ucp1 relative gene expression in relation to their basal levels (Figure 2).
In regard to the results observed on genes related with a proinflammatory response, 2 h after the oxidative stress challenge, all the experimental groups presented a significantly increased (p < 0.05) nfΚβ2 gill gene expression. Only the WT fish fed the PHYTO0.2 and GMOS0.5 diets presented significantly increased (p < 0.05) il-1β gill transcription levels in relation to basal levels. At this sampling point, feeding a GMOS0.5 diet to WT fish resulted in an increase (p < 0.05) in the casp-9 gill relative gene expression, whereas the GS fish fed the GMOS0.5 diet presented an increased (p < 0.05) hif-1α gill relative gene expression.
Twenty-four hours after the oxidative stress challenge, the GS fish fed the control diet and the WT fish fed the GMOS0.5 diet presented a downregulation (p < 0.05) of sod and gpx gill relative gene expression, respectively. Despite the changes mentioned above, no significant differences were found among the different experimental groups in terms of the antioxidant defense gene response (Figure 3).
At this sampling point, the GS fish fed the PHYTO0.1 diet presented a significant downregulation (p < 0.05) of gill cox relative gene expression. No differences among the groups were observed in the fish cox gill gene expression. On the contrary, the WT fish fed the PHYTO0.1 diet presented higher (p < 0.05) ucp1 gill relative gene expressions than the WT fish fed the GMOS0.5 diet.
At the end of the oxidative stress challenge, no significant change in the fish gill pro-inflammatory gene response was observed, with an exception for the il-1β gill relative gene expression, which was increased (p < 0.05) in the WT fish fed the control diet in relation to the previous sampling point (Appendix A Table A1).

4. Discussion

The results of the present study highlight the strong effect exerted by breeding selection, leading to a two-fold higher body weight for GS fish compared to WT at the same age, 300 days post-hatching. At the end of the feeding trial, both genotypes presented proper growth, almost doubling the initial body weight regardless of the dietary treatment fed. Despite the fish from both genotypes presenting similar specific growth rates, the GS fish presented improved feed conversion ratios and lower individual feed intakes than the WT fish, indicating a better capacity to harness feed even when dealing with low FM/FO-based diets. In agreement with these results, in the study carried out by Montero and co-authors in 2023 [40], GS fish belonging to the same breeding program presented a higher growth performance and a better plasticity to cope with the possible nutritional imbalances derived from low FM/FO-based diets. At the end of the feeding experience, GS fish presented a higher body weight, decreased fish perivisceral fat deposition and increased flesh DHA and ARA contents compared to WT fish.
The use of selective breeding strategies as a tool to increase fish growth performance may lead to favoring the selection of secondary functional phenotypes, such as stress tolerance and behavioral traits [38], which are keystones in domestication processes [60]. In 2016, Vandeputte and co-authors [61] studied the stress response of three different genotypes of European sea bass (wild, domesticated and selected for growth) subjected to acute confinement followed by a swimming stress challenge. The authors reported a negative correlation between the fish body weight and the circulating plasma cortisol levels after the stress challenge, concluding that selective breeding may favor fish’s low stress responsiveness. Accordingly, in the present study, the GS fish presented significantly lower basal cortisol levels than the WT fish, pointing to a possible effect of growth selective breeding on fish stress indicators. Furthermore, and despite presenting higher cortisol levels than the WT fish in the first hours after the oxidative stress challenge, the GS fish presented a better recovery back to the basal cortisol levels at 24 h post-H2O2 exposure. A better competence for recovering a homeostatic status might be advantageous under aquaculture conditions in which fish are constantly exposed to stressful conditions [17,18]. An effective and controlled physiological stress response will avoid the negative side-effects associated with a chronic cortisol exposure [39,62]. An example of stress tolerance benefits for aquaculture production was reported by Øverli and co-authors in 2006 [63]. The authors studied the effects of a transport stress challenge on the feed utilization of two different genotypes of rainbow trout (Oncorhynchus mykiss) selected for low or high stress responsiveness. The low stress responsive genotype presented a significantly higher feed efficiency and a lower food waste production after the stress challenge.
In the present study, the genetic selection also induced differences in fish antioxidant defense gene expression. At the basal level, at t = 0 h pre-stress challenge, the GS fish presented higher cat gene expression levels than the WT fish. Similarly, other studies have reported higher antioxidant defenses in the selected genotypes of other fish species. For example, Solberg and co-authors, in 2012 [64], described higher glutathione reductase, Cu/Zn sod and gpx relative gene expression levels in response to environmental stress processes for a domesticated strain of Atlantic salmon (Salmo salar) in comparison to a wild strain. In 2010, Sauvage and co-authors [65] observed a higher gene expression of three genes associated with protective properties against oxidative stress processes (precursor of hemopexin, heme-binding protein 2, precursor of fibrinogen γ chain and precursor of the inter-α trypsin inhibitor heavy chain H2) on a selected strain of Brook charr (Salvelinus fontinalis) (F4 generation) compared to a reference population obtained from randomly mixed breeders (F1 generation) kept at the same environmental conditions. Palinska-Zarska and co-authors, in 2021 [66], compared the antioxidant enzymatic activity of two genotypes, domesticated and wild, of perch (Perca fluviatilis) larvae presenting higher sod and cat activities than the domesticated strain. These authors suggested that a higher antioxidant enzyme activity in the selected strain resulted in a better adaptation to the formulated feed, leading to better survival rates and performance during the larval weaning period. In the present study, the functional additives also presented an effect on fish antioxidant defense. The WT fish fed functional diets presented higher sod, cat and gpx basal gene expression levels than the WT fish fed the control diet. In the same way, at two hours after H2O2 exposure, those fish fed the functional additives presented the highest cat gene expression levels compared to the fish fed the control diet, regardless of the genotype. This could suggest an enhanced antioxidant capacity associated with functional additives supplementation, as catalase is the main enzyme contributing to H2O2 removal when found in high concentrations in the intercellular space [66]. Dietary supplementation with plant origin compounds may reinforce the fish antioxidant status through the interaction with several signaling transcription factors modulating fish antioxidant-related gene expression [33]. Li and co-authors, in 2018 [67], evaluated the effects of pinostrobin, a potent flavonoid extracted from pines, on zebra fish’s (Danio rerio) neural antioxidant status. This phytogenic compound increased fish GSH-PX, GSH/GSSG, SOD and CAT enzymes, reducing fish neural oxidative stress damages and apoptotic processes. Mansour and co-authors, in 2020 [68], analyzed the antioxidant capacity of sea bream (Sparus aurata) fed diets supplemented with Moringa (Moringa oleifera) against an H2O2 exposure at a concentration of 50 ppm. The authors reported an enhanced response of the fish fed the supplemented diets, with an increased gill cat gene expression compared to that of those fish fed diets void of supplementation. In addition, these compounds are rich in terpenes and flavonoids, which present high antioxidant properties preventing the formation or directly quenching the oxygen and nitrogen reactive species derived from aerobic metabolism [22,69].
An increased aerobic metabolism rate, in order to respond against a stress process, may also suppose an important source of oxidative stress processes. During oxidative phosphorylation, between 1 and 3% of all electrons may “leak” from the electron transport chain [14] being released into the mitochondrial intermembrane space, where they will react with O2 generating ROS. In the present study, the stress challenge resulted in a generalized overexpression of the ETC-related genes nd5, cyb and cox, regardless of the fish genotype or the dietary treatment fed. However, an interesting response was observed for GS fish fed the control diet, which, unless presenting similar levels of expression as the other experimental groups, presented an increased ucp1 gene expression after H2O2 exposure. In the absence of an external surplus of antioxidant defenses such as the antioxidant properties of functional additives, this may suggest a feedback mechanism limiting mitochondrial ROS formation, in a process called “uncoupling to survive” [15], and protecting gill tissue from oxidative stress processes.
ROS are important metabolic agents involved in fish inflammatory responses through the interaction with the nuclear factor kappa beta (NFKβ) [70,71] and leading to the activation of the pro-inflammatory cytokines IL-1β and TNF-α [72]. In the present study, all experimental treatments presented similar expressions of pro-inflammatory genes in gills after H2O2 exposure. Nevertheless, the GS fish fed the GMOS0.5 diet presented upregulated hif-1α gill expression levels compared to the fish fed the rest of the dietary treatments. Under hypoxic conditions associated with inflammatory processes [73], the hif-1α mediates the activation of the O2-independent glycolytic pathway, ensuring ATP production to cope with the bio-energetic requirements [74,75]. On the other hand, the WT fish fed GMOS0.5, which did not present an increased expression of hif-1α, presented an increased expression of caspase 9, which is the activator of caspase-dependent apoptotic processes [76], suggesting a lower ability to cope with the side-effects associated with the inflammatory process.

5. Conclusions

In conclusion, H2O2 exposure induced the triggering of both the fish stress response and oxidative stress defense. The GS genotype fish presented a better capacity to recover the basal cortisol levels, suggesting a higher tolerance to potential stressful scenarios associated with fish rearing conditions. In addition, the use of functional additives enhanced the fish antioxidant response via upregulating the expression of cat in gill expression levels in response to the oxidative insult. The GMOS0.5 diet induced the activation of hif-1α gene expression in the gills of GS fish, modulating the triggering of pro-inflammatory-associated processes. Nevertheless, in the view of the complexity of interactions between fish genetic traits and the diversity of functional ingredients, more experiences must be carried out to address the best nutritional and genetic selection strategies in order to promote fish health and welfare under rearing conditions.

Author Contributions

Conceptualization, S.T., A.M. and D.M.; formal analysis, A.S.; data curation, A.S.; software, A.S.; validation, S.T., P.H. and D.M.; writing—original draft preparation, A.S.; writing—review and editing, S.T., D.M., G.T., S.R., A.B., P.H. and F.A. (François Allal); project administration, D.M.; funding acquisition, S.T., F.A. (Félix Acosta) and D.M. All authors have read and agreed to the published version of the manuscript.

Funding

This work was supported by the European Union Horizon 2020 research and innovation program under grant agreement no. 818367; AquaIMPACT—Genomic and nutritional innovations for genetically superior farmed fish to improve efficiency in European aquaculture.

Institutional Review Board Statement

The described experiment complies with the guidelines of the European Union Council (2010/63/EU) for the use of experimental animals. The experimental protocol was approved by the Institutional Review Board (or Ethics Committee) of the University of Las Palmas de Gran Canaria (approval no. OEBA_ULPGC_14/2020) for studies involving animals.

Informed Consent Statement

Not applicable.

Data Availability Statement

Not applicable.

Acknowledgments

Authors are thankful to the European Union for the funding of this study through the Horizon 2020 agreement no. 818367 concession (AquaIMPACT: Genomic and nutritional innovations for genetically superior farmed fish to improve efficiency in European aquaculture). Special thanks go to Delacon Biotechnik GmBH, which provided the functional additive products.

Conflicts of Interest

The authors declare no conflict of interest. The company had no role in the design of the study; in the collection, analyses, or interpretation of data; in the writing of the manuscript, or in the decision to publish the results.

Appendix A

Table A1. Gill relative gene expression of European sea bass (Dicentrarchus labrax) juveniles at t = 0 h pre-oxidative stress challenge and at t = 2 h and 24 h after the oxidative stress challenge.
High-Growth Selected Genotype (GS)Wild Type Genotype (WT)
ControlPHYTO0.02PHYTO0.1GMOS0.5ControlPHYTO0.02PHYTO0.1GMOS0.5
Sampling PointTarget Gene
t = 0 h
(pre-H2O2 exposure)
nfΚβ20.89 1 ± 0.261.36 1 ± 0.191.17 1 ± 0.131.49 1 ± 0.351.02 1 ± 0.170.90 1 ± 0.141.41 1 ± 0.480.98 1 ± 0.58
il-1β2.58 ± 1.041.94 ± 0.431.94 ± 0.452.48 ± 0.480.95 1 ± 0.330.93 1 ± 0.331.42 1 ± 0.490.93 1 ± 0.23
hif-1α0.60 ± 0.160.64 ± 0.070.45 ± 0.190.33 a1 ± 0.200.78 A ± 0.411.22 AB ± 0.440.73 A ± 0.131.61 bB ± 0.16
nd51.42 ± 0.761.24 ± 0.311.01 1 ± 0.141.34 ± 0.410.89 1 ± 0.131.05 1 ± 0.161.28 1 ± 0.150.85 ± 0.31
cyb1.32 ± 0.070.53 ± 0.110.54 1 ±0.180.46 ± 0.180.92 ± 0.201.20 ± 1.121.50 ± 0.551.39 ± 0.63
cox1.16 1 ± 0.111.63 1 ± 0.421.59 1 ± 0.460.91 1 ± 0.210.84 1 ± 0.111.45 1 ± 0.321.56 1 ± 0.471.01 1 ± 0.50
ucp11.46 1 ± 0.652.07 ± 1.272.39 ± 1.242.98 ± 1.520.75 ± 0.090.53 ± 0.071.10 1 ± 0.200.68 ± 0.30
sod1.06 a1± 0.231.32 1 ± 0.201.24 1 ± 0.271.44 a1± 0.170.81 bA1 ± 0.232.14 B1 ± 0.192.00 AB1 ± 1.134.28 bC ± 0.88
cat3.40 a1± 0.624.59 1 ± 0.863.97 a1 ± 0.343.44 1 ± 0.500.85 b1 ± 0.262.16 1 ± 1.281.25 b1 ± 0.451.60 1 ± 0.74
gpx1.62 1 ± 0.461.85 1 ± 0.291.88 1 ± 0.262.00 1 ± 0.360.85 A1 ± 0.181.80 A1 ± 0.063.21 C1 ± 1.592.55 B1 ± 1.27
tnf-1α0.55 1 ± 0.550.29 ± 0.110.28 1 ± 0.070.30 1 ± 0.280.96 ± 0.281.03 ± 0.621.15 ± 0.922.32 ± 0.80
casp-91.69 ± 1.681.36 ± 0.241.33 ± 0.341.46 ± 0.210.82 ± 0.260.98 ± 0.171.70 ± 0.581.01 1 ± 0.34
t = 2 h
(post-H2O2 exposure)
nfΚβ22.75 2 ± 0.392.66 2 ± 0.333.34 2 ± 0.323.90 2 ± 0.962.55 2 ± 0.252.92 2 ± 0.403.08 2 ± 0.582.95 2 ± 0.10
il-1β5.75 ± 4.144.80 ± 1.424.78 ± 1.285.65 ± 0.625.47 12 ± 0.195.66 2 ± 2.255.38 ± 1.04 6.06 2 ± 0.79
hif-1α0.96 ± 0.121.02 ± 0.140.94 ± 0.111.29 2 ± 0.410.84 ± 0.130.88 ± 0.060.89 ± 0180.93 ± 0.06
nd56.03 ± 1.465.99 ± 2.156.69 2 ± 5.135.95 ± 1.086.56 2 ± 0.346.70 2 ± 1.506.62 2 ± 0.525.55 ± 1.35
cyb2.59 ± 0.861.72 ± 0.482.59 2 ± 0.231.90 ± 0.821.89 ± 0.872.21 ± 0.871.47 ± 0.251.15 ± 0.30
cox4.13 AB2 ± 0.414.77 AB2 ± 1.567.12 aB2 ± 0.453.69 A2 ± 0.463.21 2 ± 0.494.10 2 ± 0.943.20 b12 ± 0.332.84 12 ± 0.80
ucp16.65 2 ± 1.294.38 ± 1.932.94 ± 2.333.72 ± 1.942.56 ± 1.541.84 ± 0.903.72 12 ± 3.143.30 ± 0.72
sod7.45 aA2 ± 0.844.38 B2 ± 0.273.90 B2 ± 0.823.41 B2 ± 0.663.88 b2 ± 0.834.01 2 ± 0.413.85 2 ± 0.303.98 ± 0.37
cat4.97 A2 ± 1.627.51 AB12 ± 0.499.18 B2 ± 0.817.86 AB2 ± 0.427.39 A2 ± 2.0511.29 AB2 ± 2.0611.23 AB2 ± 1.2312.58 B2 ± 0.11
gpx8.34 2± 1.416.24 2 ± 0.188.62 2 ± 1.218.99 2 ± 0.796.83 2 ± 0.846.47 2 ± 0.806.44 2 ± 1.296.00 2 ± 0.70
tnf-1α4.70 2 ± 1.342.47 ± 1.684.49 2 ± 4.242.45 12 ± 2.512.27 ± 1.231.55 ± 0.511.42 ± 0.392.02 ± 0.93
casp-93.32 ± 2.363.64 ± 2.303.50 ± 1.732.98 ± 1.333.72 ± 1.003.93 ± 0.594.24 ± 0.515.34 2 ± 2.14
t = 24 h
(post-H2O2 exposure)
nfΚβ23.20 2 ± 0.173.20 2 ± 0.243.21 2 ± 0.553.69 a2 ± 0.172.42 2 ± 0.452.64 2 ± 0.772.91 2 ± 0.392.37 b2 ± 0.15
il-1β3.50 ± 0.243.42 ± 0.224.88 ± 1.305.43 ± 1.793.81 2 ± 1.605.27 2 ± 2.504.72 ± 1.203.73 2 ± 1.43
hif-1α0.91 ± 0.301.09 ± 0.130.90 ± 0.151.24 2 ± 0.090.94 ± 0.151.00 ± 0.230.92 ± 0.140.93 ± 0.37
nd56.05 ± 1.406.99 ± 1.433.22 12 ± 1.416.28 ± 3.564.45 12 ± 1.314.45 12 ± 1.114.44 12 ± 1.443.70 ± 0.72
cyb1.61 ± 0.281.53 ± 0.191.63 12 ± 0.211.55 ± 0.411.27 ± 0.431.41 ± 0.431.69 ± 0.362.00 ± 0.86
cox4.88 2 ± 0.714.33 2 ± 0.474.05 3 ± 0.335.47 2 ± 2.843.30 2 ± 0.714.00 2 ± 1.033.92 2 ± 1.363.14 2 ± 0.22
ucp13.42 12 ± 1.822.31 ± 1.012.29 ± 0.543.90 ± 1.552.99 AB ± 0.583.22 AB ± 1.436.96 A2 ± 1.231.54 B ± 0.74
sod3.60 3 ± 0.663.35 2 ± 0.303.64 2 ± 0.433.41 2 ± 0.283.93 2 ± 0.574.16 2 ± 0.684.32 2 ± 0.384.77 ± 0.68
cat8.69 2 ± 1.459.61 2 ± 2.3410.30 2 ± 1.059.77 2 ± 1.176.80 2 ± 0.727.87 2 ± 2.227.42 2 ± 1.507.31 3 ± 1.47
gpx8.82 2 ± 0.948.74 2 ± 1.128.49 2 ± 0.457.89 2 ± 0.865.69 2 ± 0.845.5 2 ± 1.106.76 2 ± 0.736.68 2 ± 0.79
tnf-1α2.44 12 ± 1.082.04 ± 0.812.41 12 ± 0.943.82 2 ± 1.531.68 ± 0.402.04 ± 0.893.28 ± 1.651.23 ± 0.34
casp-93.96 ± 2.264.06 ± 1.284.47 ± 1.325.83 ± 3.452.88 ± 0.382.54 ± 0.622.39 ± 0.332.63 12 ± 0.30
Three-way ANOVA
DietGenotypeTimeD × GD × TG × TD × G × T
nfΚβ2F = 4.306
p-val = 0.009
F = 16.398
p-val = 0.0018
F = 158.176
p-val = < 2 × 10⁻¹⁶
F = 3.481
p-val = 0.0229
nsF = 3.335
p-val = 0.0474
ns
il-1βnsF = 8.798
p-val = 0.0047
F = 65.499
p-val = 1.91 × 10⁻¹⁴
nsnsnsns
hif-1αF = 5.231
p-val = 0.0033
F = 4.422
p-val = 0.041
F = 5.714
p-val = 0.006
nsns F = 21.397
p-val = 2.27 × 10⁻⁷
F = 4.260
p-val = 0.00162
nd5nsnsF = 63.876
p-val = 2.97 × 10⁻¹⁴
nsnsnsns
cybnsnsF = 19.325
p-val = 6.97 × 10⁻⁷
nsnsF = 5.819
p-val = 0.005
ns
coxF = 4.108
p-val = 0.0113
F = 21.469
p-val = 2.77 × 10⁻⁵
F = 127.517
p-val = < 2 × 10⁻¹⁶
nsnsF = 4.051
p-val = 0.0237
F = 2.616
p-val = 0.028
ucp1ns F = 7.93
p-val = 0.007
F = 19.895
p-val = 5.09 × 10⁻⁷
F = 4.471
p-val = 0.007
nsF = 5.287
p-val = 0.008
F = 2.699
p-val = 0.024
sodns F = 10.086
p-val = 0.002
F = 181.372
p-val = < 2 × 10⁻¹⁶
F = 17.654
p-val = 7.36 × 10⁻⁸
F = 13.457
p-val = 6.98 × 10⁻⁹
F = 19.065
p-val = 8.06 × 10⁻⁷
F = 2.748
p-val = 0.022
catF = 9.911
p-val = 3.38 × 10⁻⁵
F = 10.017
p-val = 0.002
F = 242.091
p-val = < 2 × 10⁻¹⁶
nsF = 2.914
p-val = 0.017
F = 44.054
p-val = 1.37 × 10⁻¹¹
ns
gpxF = 2.859
p-val = 0.046
F = 35.012
p-val = 3.36 × 10⁷
F = 294.593
p-val = < 2 × 10⁻¹⁶
nsnsF = 13.893
p-val = 1.74 × 10⁻⁵
F = 3.079
p-val = 0.013
tnf-1αnsnsF = 25.759
p-val = 2.51 × 10⁻⁸
nsns F = 10.79
p-val = 0.0001
ns
casp-9nsnsF = 39.156
p-val = 8.23 × 10⁻¹¹
nsnsF = 5.946
p-val = 0.005
ns
Different uppercase letters denote significant differences (p < 0.05) between dietary treatments inside each fish genotype at each sampling point (three-way ANOVA: Diet × Genotype × Time; Tukey post hoc test). Different lowercase letters denote significant differences (p < 0.05) between genotypes at each sampling point (three-way ANOVA: Diet × Genotype × Time; Tukey post hoc test). Different numbers denote significant differences (p < 0.05) between experimental sampling points (three-way ANOVA: Diet × Genotype × Time; Tukey post hoc test). ns = not significant. Values expressed in mean ± SD. Control (Control diet); PHYTO0.02 (PHYTO0.02 diet, supplemented with a 200 ppm blend of phytogenic feed additives consisting of a mixture of garlic and Labiatae plant essential oils with 87.5 mg terpens/kg diet); PHYTO0.1 (PHYTO0.1 diet, supplemented with a 1000 ppm blend of phytogenic feed additives, consisting of a mixture of citrus fruits and Asteraceae and Labiatae plant essential oils with 57 mg terpens/kg diet); GMOS0.5 (GMOS0.5 diet; supplemented with 5000 ppm galactomannan-oligosaccharides); GS (high-growth selected genotype); WT (wild type genotype).

References

  1. Acosta, F.; Montero, D.; Izquierdo, M.; Galindo-Villegas, J. High-level biocidal products effectively eradicate pathogenic γ-proteobacteria biofilms from aquaculture facilities. Aquaculture 2021, 532, 736004. [Google Scholar] [CrossRef]
  2. Magara, G.; Sangsawang, A.; Pastorino, P.; Oddon, S.B.; Caldaroni, B.; Menconi, V.; Kovitvadhi, U.; Gasco, L.; Meloni, D.; Dörr, A.J.M.; et al. First insights into oxidative stress and theoretical environmental risk of Bronopol and Detarox® AP, two biocides claimed to be ecofriendly for a sustainable aquaculture. Sci. Total Environ. 2021, 778, 146375. [Google Scholar] [CrossRef] [PubMed]
  3. Avendaño-Herrera, R.; Magariños, B.; Irgang, R.; Toranzo, A.E. Use of hydrogen peroxide against the fish pathogen Tenacibaculum maritimum and its effect on infected turbot (Scophthalmus maximus). Aquaculture 2006, 257, 104–110. [Google Scholar] [CrossRef]
  4. Pedersen, L.F. Investigations of Environmental Benign Aquaculture Therapeutics Replacing Formalin; DTU Aqua Report, no. 218–2010; DTU Aqua: Charlottenlund, Denmark, 2010. [Google Scholar]
  5. Hodkovicova, N.; Chmelova, L.; Sehonova, P.; Blahova, J.; Doubkova, V.; Plhalova, L.; Fiorino, E.; Vojtek, L.; Vicenova, M.; siroka, Z.; et al. The effects of a therapeutic formalin bath on selected immunological and oxidative stress parameters in common carp (Cyprinus carpio). Sci. Total Environ. 2019, 653, 1120–1127. [Google Scholar] [CrossRef] [PubMed]
  6. Seoud, S.S.M.; Zaki, V.H.; Ahmed, G.E.; Abd El-Khalek, N.K. Studies on Amyloodinium infestation in European seabass (Dicentrarchus labrax) fishes with special reference for treatment. Int. J. Mar. Sci. 2017, 7. [Google Scholar] [CrossRef] [Green Version]
  7. Ragab, R.H.; Elgendy, M.Y.; Sabry, N.M.; Sharaf, M.S.; Attia, M.M.; Korany, R.M.; Abdelsalam, M.; Eltahan, A.S.; Eldessouki, E.A.; El-Demerdash, G.O.; et al. Mass kills in hatchery-reared European seabass (Dicentrarchus labrax) triggered by concomitant infections of Amyloodinium ocellatum and Vibrio alginolyticus. Int. J. Vet. Sci. Med. 2022, 10, 33–45. [Google Scholar] [CrossRef]
  8. Roque, A.; Yildiz, H.Y.; Carazo, I.; Duncan, N. Physiological stress responses of sea bass (Dicentrarchus labrax) to hydrogen peroxide (H2O2) exposure. Aquaculture 2010, 304, 104–107. [Google Scholar] [CrossRef]
  9. Seker, E.; Ispir, U.; Yonar, S.M.; Yonar, M.E.; Turk, C. Antioxidant responses of rainbow trout (Oncorhynchus mykiss) gills after exposure to hydrogen peroxide. Fresenius Environ. Bull. 2015, 24, 1837–1840. [Google Scholar]
  10. Hwang, P.-P.; Lee, T.-H.; Lin, L.-Y. Ion regulation in fish gills: Recent progress in the cellular and molecular mechanisms. Am. J. Physiol. -Regul. Integr. Comp. Physiol. 2011, 301, R28–R47. [Google Scholar] [CrossRef]
  11. Li, M.; Zhu, X.; Tian, J.; Liu, M.; Wang, G. Dietary flavonoids from Allium mongolicum Regel promotes growth, improves immune, antioxidant status, immune-related signaling molecules and disease resistance in juvenile northern snakehead fish (Channa argus). Aquaculture 2019, 501, 473–481. [Google Scholar] [CrossRef]
  12. Rodnick, K.J.; Planas, J.V. The stress and stress mitigation effects of exercise: Cardiovascular, metabolic, and skeletal muscle adjustments. In Fish Physiology; Academic Press: Cambridge, MA, USA, 2016; Volume 35, pp. 251–294. [Google Scholar] [CrossRef]
  13. Gorissen, M.; Flik, G. The endocrinology of the stress response in fish: An adaptation-physiological view. In Fish Physiology; Academic Press: Cambridge, MA, USA, 2016; Volume 35, pp. 75–111. [Google Scholar] [CrossRef]
  14. Spiers, J.G.; Chen, H.-J.C.; Sernia, C.; Lavidis, N.A. Activation of the hypothalamic-pituitary-adrenal stress axis induces cellular oxidative stress. Front. Neurosci. 2015, 8, 456. [Google Scholar] [CrossRef] [Green Version]
  15. Zhao, R.-Z.; Jiang, S.; Zhang, L.; Yu, Z.-B. Mitochondrial electron transport chain, ROS generation and uncoupling. Int. J. Mol. Med. 2019, 44, 3–15. [Google Scholar] [CrossRef] [PubMed] [Green Version]
  16. Zafir, A.; Banu, N. Modulation of in vivo oxidative status by exogenous corticosterone and restraint stress in rats. Stress 2009, 12, 167–177. [Google Scholar] [CrossRef] [PubMed]
  17. Fanouraki, E.; Mylonas, C.C.; Papandroulakis, N.; Pavlidis, M. Species specificity in the magnitude and duration of the acute stress response in Mediterranean marine fish in culture. Gen. Comp. Endocrinol. 2011, 173, 313–322. [Google Scholar] [CrossRef] [PubMed]
  18. Samaras, A.; Pavlidis, M.; Lika, K.; Theodoridi, A.; Papandroulakis, N. Scale matters: Performance of European sea bass, Dicentrarchus labrax, L. (1758), reared in cages of different volumes. Aquac. Res. 2017, 48, 990–1005. [Google Scholar] [CrossRef]
  19. Hematyar, N.; Rustad, T.; Sampels, S.; Kastrup Dalsgaard, T. Relationship between lipid and protein oxidation in fish. Aquac. Res. 2019, 50, 1393–1403. [Google Scholar] [CrossRef]
  20. Irkin, L.C.; Yigit, M.; Yilmaz, S.; Maita, M. Toxicological Evaluation of Dietary Garlic (Allium sativum) Powder in European Sea Bass Dicentrarchus labrax Juveniles. Food Nutr. Sci. 2014, 5, 46429. [Google Scholar] [CrossRef] [Green Version]
  21. Yonar, M.E.; Yonar, S.M.; İspir, Ü.; Ural, M.Ş. Effects of curcumin on haematological values, immunity, antioxidant status and resistance of rainbow trout (Oncorhynchus mykiss) against Aeromonas salmonicida subsp. achromogenes. Fish Shellfish Immunol. 2019, 89, 83–90. [Google Scholar] [CrossRef]
  22. Hoseinifar, S.H.; Yousefi, S.; Van Doan, H.; Ashouri, G.; Gioacchini, G.; Maradonna, F.; Carnevali, O. Oxidative stress and antioxidant defense in fish: The implications of probiotic, prebiotic, and synbiotics. Rev. Fish. Sci. Aquac. 2020, 29, 198–217. [Google Scholar] [CrossRef]
  23. Singh, J.; Gaikwad, D.S. Phytogenic feed additives in animal nutrition. In Natural Bioactive Products in Sustainable Agriculture; Springer: Singapore, 2020; pp. 273–289. [Google Scholar] [CrossRef]
  24. Caipang, C.M.A.; Suharman, I.; Avillanosa, A.L.; Gonzales-Plasus, M.M. Influence of phytogenic feed additives on the health status in the gut and disease resistance of cultured fish. IOP Conf. Ser. Earth Environ. Sci. 2021, 695, 012024. [Google Scholar] [CrossRef]
  25. Choubey, M.; Pattanaik, A.K.; Baliyan, S.; Dutta, N.; Jadhav, S.E.; Sharma, K. Dietary supplementation of a novel phytogenic feed additive: Effects on nutrient metabolism, antioxidant status and immune response of goats. Anim. Prod. Sci. 2015, 56, 1612–1621. [Google Scholar] [CrossRef]
  26. Serradell, A.; Torrecillas, S.; Makol, A.; Acosta, F.; Valdenegro, V.; Montero, D. Functional additives in low fish meal and fish oil based diets for European sea bass (Dicentrarchus labrax): Effects on immune response, stress and disease resistance. Fish Shellfish Immunol. 2020, 91, 464–465. [Google Scholar] [CrossRef]
  27. Ali, A.; Ponnampalam, E.N.; Pushpakumara, G.; Cottrell, J.J.; Suleria, H.A.R.; Dunshea, F.R. Cinnamon: A natural feed additive for poultry health and production—A review. Animals 2021, 11, 2026. [Google Scholar] [CrossRef]
  28. Cho, H.A.; Song, M.H.; Lee, J.H.; Oh, H.J.; Kim, Y.J.; An, J.W.; Chang, S.Y.; Go, Y.B.; Song, D.C.; Cho, S.Y.; et al. Effects of different stocking density and various phytogenic feed additives dosage levels on growing-finishing pigs. J. Anim. Sci. Technol. 2023, 65, 535–549. [Google Scholar] [CrossRef]
  29. Dawood, M.A.O.; Abo-Al-Ela, H.G.; Hasan, M.T. Modulation of transcriptomic profile in aquatic animals: Probiotics, prebiotics and synbiotics scenarios. Fish Shellfish Immunol. 2020, 97, 268–282. [Google Scholar] [CrossRef]
  30. Rimoldi, S.; Torrecillas, S.; Montero, D.; Gini, E.; Makol, A.; Valdenegro V., V.; Izquierdo, M.; Terova, G. Assessment of dietary supplementation with galactomannan oligosaccharides and phytogenics on gut microbiota of European sea bass (Dicentrarchus labrax) fed low fishmeal and fish oil based diet. PLoS ONE 2020, 15, e0231494. [Google Scholar] [CrossRef] [PubMed] [Green Version]
  31. Torrecillas, S.; Terova, G.; Makol, A.; Serradell, A.; Valdenegro, V.; Gini, E.; Izquierdo, M.S.; Acosta, F.; Montero, D. Dietary phytogenics and galactomannan oligosaccharides in low fish meal and fish oil-based diets for European sea bass (Dicentrarchus labrax) juveniles: Effects on gut health and implications on in vivo gut bacterial translocation. PLoS ONE 2019, 14, e0222063. [Google Scholar] [CrossRef]
  32. Torrecillas, S.; Terova, G.; Makol, A.; Serradell, A.; Valdenegro-Vega, V.; Izquierdo, M.; Acosta, F.; Montero, D. Dietary phytogenics and galactomannan oligosaccharides in low fish meal and fish oil-based diets for European sea bass (Dicentrarchus labrax) juveniles: Effects on gill structure and health and implications on oxidative stress status. Front. Immunol. 2021, 12, 663106. [Google Scholar] [CrossRef]
  33. Guerreiro, I.; Serra, C.R.; Enes, P.; Couto, A.; Salvador, A.; Costas, B.; Oliva-Teles, A. Effect of short chain fructooligosaccharides (scFOS) on immunological status and gut microbiota of gilthead sea bream (Sparus aurata) reared at two temperatures. Fish Shellfish Immunol. 2016, 49, 122–131. [Google Scholar] [CrossRef] [Green Version]
  34. Torrecillas, S.; Rivero-Ramírez, F.; Izquierdo, M.S.; Caballero, M.J.; Makol, A.; Suarez-Bregua, P.; Fernández-Montero, A.; Rotllant, J.; Montero, D. Feeding European sea bass (Dicentrarchus labrax) juveniles with a functional synbiotic additive (mannan oligosaccharides and Pediococcus acidilactici): An effective tool to reduce low fishmeal and fish oil gut health effects? Fish Shellfish Immunol. 2018, 81, 10–20. [Google Scholar] [CrossRef] [PubMed]
  35. Encarnação, P. Functional feed additives in aquaculture feeds. In Aquafeed Formulation; Academic Press: Cambridge, MA, USA, 2016; pp. 217–237. [Google Scholar] [CrossRef]
  36. Vandeputte, M.; Dupont-Nivet, M.; Haffray, P.; Chavanne, H.; Cenadelli, S.; Parati, K.; Vidal, M.-O.; Vergnet, A.; Chatain, B. Response to domestication and selection for growth in the European sea bass (Dicentrarchus labrax) in separate and mixed tanks. Aquaculture 2009, 286, 20–27. [Google Scholar] [CrossRef] [Green Version]
  37. Kause, A.; Kiessling, A.; Martin, S.A.M.; Houlihan, D.; Ruohonen, K. Genetic improvement of feed conversion ratio via indirect selection against lipid deposition in farmed rainbow trout (Oncorhynchus mykiss Walbaum). Br. J. Nutr. 2016, 116, 1656–1665. [Google Scholar] [CrossRef] [Green Version]
  38. Vandeputte, M.; Gagnaire, P.-A.; Allal, F. The European sea bass: A key marine fish model in the wild and in aqua-culture. Anim. Genet. 2019, 50, 195–206. [Google Scholar] [CrossRef]
  39. Kiron, V. Fish immune system and its nutritional modulation for preventive health care. Anim. Feed. Sci. Technol. 2012, 173, 111–133. [Google Scholar] [CrossRef]
  40. Montero, D.; Carvalho, M.; Terova, G.; Fontanillas, R.; Serradell, A.; Ginés, R.; Tuset, V.; Acosta, F.; Rimoldi, S.; Bajek, A.; et al. Nutritional innovations in superior European sea bass (Dicentrarchus labrax) genotypes: Implications on fish performance and feed utilization. Aquaculture 2023, 572, 739486. [Google Scholar] [CrossRef]
  41. Tort, L. Stress and immune modulation in fish. Dev. Comp. Immunol. 2011, 35, 1366–1375. [Google Scholar] [CrossRef] [PubMed]
  42. National Research Council. Nutrient Requirements of Fish and Shrimp; National Academies Press: Washington, DC, USA, 2011. [Google Scholar]
  43. Kousoulaki, K.; Sæther, B.-S.; Albrektsen, S.; Noble, C. Review on European sea bass (Dicentrarchus labrax, Linnaeus, 1758) nutrition and feed management: A practical guide for optimizing feed formulation and farming protocols. Aquac. Nutr. 2015, 21, 129–151. [Google Scholar] [CrossRef]
  44. Torrecillas, S.; Rimoldi, S.; Montero, D.; Serradell, A.; Acosta, F.; Fontanillas, R.; Allal, F.; Haffray, P.; Bajek, A.; Terova, G. Genotype x nutrition interactions in European sea bass (Dicentrarchus labrax): Effects on gut health and intestinal microbiota. Aquaculture 2023, 574, 739639. [Google Scholar] [CrossRef]
  45. Izquierdo, M.S.; Socorro, J.; Roo, J. Studies on the appearance of skeletal anomalies in red porgy: Effect of culture intensiveness, feeding habits and nutritional quality of live preys. J. Appl. Ichthyol. 2010, 26, 320–326. [Google Scholar] [CrossRef]
  46. Atalah, E.; Hernández-Cruz, C.M.; Ganuza, E.; Benítez-Santana, T.; Ganga, R.; Roo, J.; Montero, D.; Izquierdo, M.S. Importance of dietary arachidonic acid for survival, growth and stress resistance of larval European sea bass (Dicentrarchus labrax) fed high dietary docosahexaenic and eicosapentaenoic acids. Aquac. Res. 2011, 42, 1261–1268. [Google Scholar] [CrossRef]
  47. Livak, K.J.; Schmittgen, T.D. Analysis of relative gene expression data using real-time quantitative PCR and the 2−ΔΔCT method. Methods 2001, 25, 402–408. [Google Scholar] [CrossRef] [PubMed]
  48. Schmittgen, T.D.; Livak, K.J. Analyzing real-time PCR data by the comparative CT method. Nat. Protoc. 2008, 3, 1101–1108. [Google Scholar] [CrossRef]
  49. Azeredo, R.; Pérez-Sánchez, J.; Sitjà-Bobadilla, A.; Fouz, B.; Tort, L.; Aragão, C.; Oliva-Teles, A.; Costas, B. European Sea Bass (Dicentrarchus labrax) Immune Status and Disease Resistance Are Impaired by Arginine Dietary Supplementation. PLoS ONE 2015, 10, e0139967. [Google Scholar] [CrossRef] [PubMed] [Green Version]
  50. Román, L.; Real, F.; Padilla, D.; El Aamri, F.; Déniz, S.; Grasso, V.; Acosta, F. Cytokine expression in head-kidney leucocytes of European sea bass (Dicentrarchus labrax L.) after incubation with the probiotic Vagococcus fluvialis L-21. Fish Shellfish Immunol. 2013, 35, 1329–1332. [Google Scholar] [CrossRef]
  51. Terova, G.; Rimoldi, S.; Corà, S.; Bernardini, G.; Gornati, R.; Saroglia, M. Acute and chronic hypoxia affects HIF-1α mRNA levels in sea bass (Dicentrarchus labrax). Aquaculture 2008, 279, 150–159. [Google Scholar] [CrossRef]
  52. Brandts, I.; Teles, M.; Tvarijonaviciute, A.; Pereira, M.L.; Martins, M.A.; Tort, L.; Oliveira, M. Effects of polymethylmethacrylate nanoplastics on Dicentrarchus labrax. Genomics 2018, 110, 435–441. [Google Scholar] [CrossRef]
  53. Basto, A.; Calduch-Giner, J.; Oliveira, B.; Petit, L.; Sá, T.; Maia, M.R.G.; Fonseca, S.C.; Matos, E.; Pérez-Sánchez, J.; Valente, L.M.P. The Use of Defatted Tenebrio molitor Larvae Meal as a Main Protein Source Is Supported in European Sea Bass (Dicentrarchus labrax) by Data on Growth Performance, Lipid Metabolism, and Flesh Quality. Front. Physiol. 2023, 12, 659567. [Google Scholar] [CrossRef] [PubMed]
  54. Tovar-Ramírez, D.; Mazurais, D.; Gatesoupe, J.F.; Quazuguel, P.; Cahu, C.L.; Zambonino-Infante, J.L. Dietary probiotic live yeast modulates antioxidant enzyme activities and gene expression of sea bass (Dicentrarchus labrax) larvae. Aquaculture 2010, 300, 142–147. [Google Scholar] [CrossRef] [Green Version]
  55. Reis, M.I.R.; Nascimento, D.S.; do Vale, A.; Silva, M.T.; dos Santos, N.M.S. Molecular cloning and characterisation of sea bass (Dicentrarchus labrax L.) caspase-3 gene. Mol. Immunol. 2007, 44, 774–783. [Google Scholar] [CrossRef]
  56. Bodur, T.; León-Bernabeu, S.; Navarro, A.; Tort, L.; Afonso, J.M.; Montero, D. Effects of new plant based anesthetics Origanum sp. and Eucalyptus sp. oils on stress and welfare parameters in Dicentrarchus labrax and their comparison with clove oil. Aquaculture 2018, 495, 402–408. [Google Scholar] [CrossRef]
  57. Hoaglin, D.C.; Iglewicz, B. Fine-tuning some resistant rules for outlier labeling. J. Am. Stat. Assoc. 1987, 82, 1147–1149. [Google Scholar] [CrossRef]
  58. Feng, M.; Ll, Q.; Zou, Z. An outlier identification and judgment method for an improved neural-network BOF forecasting model. Steel Res. Int. 2008, 79, 323–332. [Google Scholar] [CrossRef]
  59. Underwood, A.J. Experiments in Ecology: Their Logical Designand Interpretation Using Analysis of Variance; Cambridge University Press: Cambridge, UK, 1997; 504p. [Google Scholar]
  60. Jensen, P. Behavior genetics and the domestication of animals. Annu. Rev. Anim. Biosci. 2014, 2, 85–104. [Google Scholar] [CrossRef] [PubMed]
  61. Vandeputte, M.; Porte, J.D.; Auperin, B.; Dupont-Nivet, M.; Vergnet, A.; Valotaire, C.; Claireaux, G.; Prunet, P.; Chatain, B. Quantitative genetic variation for post-stress cortisol and swimming performance in growth-selected and control populations of European sea bass (Dicentrarchus labrax). Aquaculture 2016, 455, 1–7. [Google Scholar] [CrossRef] [Green Version]
  62. Schreck, C.B.; Tort, L. The Concept of Stress In Fish. In Biology of Stress in Fish; Schreck, C.B., Tort, L., Farrell, A.P., Brauner, C.J., Eds.; Academic Press: Cambridge, MA, USA, 2016; pp. 1–34. [Google Scholar] [CrossRef]
  63. Øverli, Ø.; Sørensen, C.; Kiessling, A.; Pottinger, T.G.; Gjøen, H.M. Selection for improved stress tolerance in rainbow trout (Oncorhynchus mykiss) leads to reduced feed waste. Aquaculture 2006, 261, 776–781. [Google Scholar] [CrossRef] [Green Version]
  64. Solberg, M.F.; Kvamme, B.O.; Nilsen, F.; Glover, K.A. Effects of environmental stress on mRNA expression levels of seven genes related to oxidative stress and growth in Atlantic salmon Salmo salar L. of farmed, hybrid and wild origin. BMC Res. Notes 2012, 5, 672. [Google Scholar] [CrossRef] [Green Version]
  65. Sauvage, C.; Derome, N.; Normandeau, E.; St.-Cyr, J.; Audet, C.; Bernatchez, L. Fast transcriptional responses to domestication in the brook charr Salvelinus fontinalis. Genetics 2010, 185, 105–112. [Google Scholar] [CrossRef] [Green Version]
  66. Palińska-Żarska, K.; Król, J.; Woźny, M.; Kamaszewski, M.; Szudrowicz, H.; Wiechetek, W.; Brzuzan, P.; Fopp-Bayat, D.; Żarski, D. Domestication affected stress and immune response markers in Perca fluviatilis in the early larval stage. Fish Shellfish Immunol. 2021, 114, 184–198. [Google Scholar] [CrossRef]
  67. Li, C.; Tang, B.; Feng, Y.; Tang, F.; Pui-Man Hoi, M.; Su, Z.; Ming-Yuen Lee, S. Pinostrobin exerts neuroprotective actions in neurotoxin-induced parkinson’s disease models through Nrf2 induction. J. Agric. Food Chem. 2018, 66, 8307–8318. [Google Scholar] [CrossRef]
  68. Mansour, A.T.; Espinosa, C.; García-Beltrán, J.M.; Miao, L.; Ceballos Francisco, D.C.; Alsaqufi, A.S.; Esteban, M. Dietary supplementation of drumstick tree, Moringa oleifera, improves mucosal immune response in skin and gills of seabream, Sparus aurata, and attenuates the effect of hydrogen peroxide exposure. Fish Physiol. Biochem. 2020, 46, 981–996. [Google Scholar] [CrossRef]
  69. Aedo, J.E.; Fuentes-Valenzuela, M.; Molina, A.; Valdés, J.A. Quantitative proteomics analysis of membrane glucocorticoid receptor activation in rainbow trout skeletal muscle. Comp. Biochem. Physiol. Part D Genom. Proteom. 2019, 32, 100627. [Google Scholar] [CrossRef]
  70. Busiello, R.A.; Savarese, S.; Lombardi, A. Mitochondrial uncoupling proteins and energy metabolism. Front. Physiol. 2015, 6, 36. [Google Scholar] [CrossRef] [PubMed] [Green Version]
  71. Biswas, R.; Bagchi, A. NFkB pathway and inhibition: An overview. Comput. Mol. Biol. 2016, 6, 1–20. [Google Scholar] [CrossRef]
  72. Zhang, X.; Zhang, J.-H.; Chen, X.-Y.; Hu, Q.-H.; Wang, M.-X.; Jin, R.; Zhang, Q.-Y.; Wang, W.; Wang, R.; Kang, L.-L.; et al. Reactive oxygen species-induced TXNIP drives fructose-mediated hepatic inflammation and lipid accumulation through NLRP3 inflammasome activation. Antioxid. Redox Signal. 2015, 22, 848–870. [Google Scholar] [CrossRef] [Green Version]
  73. Eltzschig, H.K.; Carmeliet, P. Hypoxia and inflammation. N. Engl. J. Med. 2011, 364, 656–665. [Google Scholar] [CrossRef] [Green Version]
  74. Lazado, C.C.; Voldvik, V.; Breiland, M.W.; Osório, J.; Hansen, M.H.S.; Krasnov, A. Oxidative chemical stressors alter the physiological state of the nasal olfactory mucosa of Atlantic salmon. Antioxidants 2020, 9, 1144. [Google Scholar] [CrossRef] [PubMed]
  75. Kierans, S.J.; Taylor, C.T. Regulation of glycolysis by the hypoxia-inducible factor (HIF): Implications for cellular physiology. J. Physiol. 2021, 599, 23–37. [Google Scholar] [CrossRef]
  76. Brentnall, M.; Rodriguez-Menocal, L.; De Guevara, R.L.; Cepero, E.; Boise, L.H. Caspase-9, caspase-3 and caspase-7 have distinct roles during intrinsic apoptosis. BMC Cell Biol. 2013, 14, 32. [Google Scholar] [CrossRef] [Green Version]
Figure 1. European sea bass gill relative gene expression heat map at 0 h pre-oxidative stress challenge for high-growth selected genotype (GS) and wild type genotype (WT) European sea bass. Control (Control diet); PHYTO0.02 (PHYTO0.02 diet, supplemented with a 200 ppm blend of phytogenic feed additives consisting of a mixture of garlic and Labiatae plant essential oils with 87.5 mg terpens/kg diet); PHYTO0.1 (PHYTO0.1 diet, supplemented with a 1000 ppm blend of phytogenic feed additives, consisting of a mixture of citrus fruits and Asteraceae and Labiatae plant essential oils with 57 mg terpens/kg diet); GMOS0.5 (GMOS0.5 diet; supplemented with 5000 ppm galactomannan-oligosaccharides).
Animals 13 02265 g001
Figure 2. European sea bass gill relative gene expression heat map at 2 h after oxidative stress challenge for high-growth selected genotype (GS) and wild type genotype (WT) European sea bass. Control (Control diet); PHYTO0.02 (PHYTO0.02 diet, supplemented with a 200 ppm blend of phytogenic feed additives consisting of a mixture of garlic and Labiatae plant essential oils with 87.5 mg terpens/kg diet); PHYTO0.1 (PHYTO0.1 diet, supplemented with a 1000 ppm blend of phytogenic feed additives, consisting of a mixture of citrus fruits and Asteraceae and Labiatae plant essential oils with 57 mg terpens/kg diet); GMOS0.5 (GMOS0.5 diet; supplemented with 5000 ppm galactomannan-oligosaccharides).
Animals 13 02265 g002
Figure 3. European sea bass gill relative gene expression heat map at 24 h after oxidative stress challenge for high-growth selected genotype (GS) and wild type genotype (WT) European sea bass. Control (Control diet); PHYTO0.02 (PHYTO0.02 diet, supplemented with a 200 ppm blend of phytogenic feed additives consisting of a mixture of garlic and Labiatae plant essential oils with 87.5 mg terpens/kg diet); PHYTO0.1 (PHYTO0.1 diet, supplemented with a 1000 ppm blend of phytogenic feed additives, consisting of a mixture of citrus fruits and Asteraceae and Labiatae plant essential oils with 57 mg terpens/kg diet); GMOS0.5 (GMOS0.5 diet; supplemented with 5000 ppm galactomannan-oligosaccharides).
Animals 13 02265 g003
Table 1. Main ingredients and analyzed proximal composition of the experimental diets.
IngredientsDiet (%)
ControlPHYTO0.02PHYTO0.1GMOS0.5
Fish meal 19.69.69.69.6
Soya protein concentrate18.218.218.218.2
Soya meal11.611.611.611.6
Corn gluten meal24.124.124.124.1
Wheat8.5858.5658.4858.085
Wheat gluten1.91.91.91.9
Guar meal7.77.77.77.7
Rapeseed extracted3.03.03.03.0
Fish oil 26.56.56.56.5
Rapeseed oil 35.25.25.25.2
Vitamin and mineral premix 43.63.63.63.6
Antioxidant 50.0150.0150.0150.015
Phytogenic (garlic and Labiatae plant essential oils) 600.0200
Phytogenic (citrus fruits and Asteraceae and Labiatae plant essential oils) 7000.10
Galactomannan-oligosaccharides (GMOS) 80000.5
Proximate composition (% of dry matter)
Crude lipids19.9120.4420.4420.47
Crude protein49.3049.2749.2749.76
Moisture5.105.015.015.06
Ash7.026.416.416.49
Dietary ingredient composition and proximal composition expressed as % of dry weight. Control (Control diet), PHYTO0.02 (PHYTO diet, 200 ppm mixture of garlic and Labiatae plant essential oils), PHYTO0.1 (PHYTO diet, 1000 ppm mixture of citrus fruits and Asteraceae and Labiatae plant essential oils), GMOS (GMOS diet, 5000 ppm galactomannan-oligosaccharides). 1 South American, Superprime 68%. 2 South American fish oil. 3 DLG AS, Denmark. 4 Vilomix, Denmark. 5 BAROX BECP, BHT. 6 Delacon Biotechnik GmbH, Austria. 7 Delacon Biotechnik GmbH, Austria. 8 Delacon Biotechnik GmbH, Austria.
Table 2. Primer sequences of the different genes analyzed and their RT-PCR conditions.
GeneAccess.
Number
PrimerNucleotide Sequence 5′-3′Annealing T (°C)Reference
nfΚβ2KM225790FwCTGGAGGAAACTGGCGGAGAAGC60[49]
RvCAGGTACAGGTGAGTCAGCGTCATC
il-1bAJ53742FwATTACCCACCACCCACTGAC60[50]
RvTCTCTTCCACTATGCTCTCCAG
hif-1aDQ171936FwGACTTCAGCTGCCCTGATTC60[51]
RvGGCTGGTTTATAGCGCTGAG
nd5KF857307FwCCCGATTTCTGTGCCCTACTA60[52]
RvAGGAAAGGAGTGCCTGTGA
cybEF427553FwTGCCTACGCTTCCTTCGCTCGATCC60[53]
RvTAACGCCAACACCCCGCCCAAT
coxKF857308FwATACTTCACATCCGCAACCATAA60[53]
RvAAGCCTCCGACTGTAAATAAGAAA
ucp1MH138003FwCGATTCCAAGCCCAGACGAACCT60[53]
RvTGCCAGTGTAGCGACGAGCC
sodFJ860004.1FwCATGTTGGAGACCTGGGAGA60[54]
RvTGAGCATCTTGTCCGTGATGT
catFJ860003.1FwTGGGACTTCTGGAGCCTGAG60[54]
RvGCAAACCTCGATCGCTGAAC
gpxFM013606.1FwAGTTCGTGCAGTTAATCCGGA60[54]
RvGCTTAGCTGTCAGGTCGTAAAAC
tnf-1αDQ200910.1FwGCCAAGCAAACAGCAGGAC60[52]
RvACAGCGGATATGGACGGTG
casp-9DQ345775FwGGCAGGACTCGACGAGATAG62.7[55]
RvCTCGCTCTGAGGAGCAAACT
α-tub (hk)AY326429.1FwAGGCTCATTGGCCAGATTGT60[31]
RvCAACATTCAGGGCTCCATCA
rpl17AF139590FwGAGGACGTGGTGGTTCATCT60[56]
RvCTGGCTTGCCTTTCTTGACT
Fw: Forward primer sequence, Rv: Reverse primer sequence.
Table 3. Growth parameters and feed utilization of European sea bass (Dicentrarchus labrax) juveniles (at age 372 dph) after 72 days of the feeding experience.
WT GenotypeGS Genotype
DietControlPHYTO0.02PHYTO0.1GMOS0.5ControlPHYTO0.02PHYTO0.1GMOS0.5
One-way ANOVA
Diet
(Inside Each Genotype)
IBW (g)
(300 dph)
58 ± 9.257.8 ± 10.258.6 ± 1057.5 ± 9.4108.7 ± 15.4106.2 ± 17.1102.2 ± 17102.4 ± 15.6ns
IL
(300 dph)
17.6 ± 117.6 ± 0.917.7 ± 117.6 ± 0.8720.8 ± 1.120.9 ± 1.120.5 ± 1.220.6 ± 1.3ns
FBW (g) (372 dps)99.4 ± 18.395.3 ± 18.2103 ± 1999.8 ± 18.1192.8 ± 31.7189.7 ± 34176.1 ± 33.2180.4 ± 30.3ns
FL (cm)
(372 dph)
21 ± 2.120.8 ± 1.221 ± 2.121.1 ± 1.225.6 ± 1.125.5 ± 1.325.1 ± 1.324.8 ± 1.4ns
One-way ANOVA
Diet Genotype
1 SGR
(%/day)
0.75 ± 0.030.70 ± 0.060.78 ± 0.040.76 ± 0.010.80 ± 0.010.83 ± 0.010.81 ± 0.010.80 ± 0.01nsns
2 FCR 1.84 a ± 0.161.99 a ± 0.291.78 a ± 0.171.70 a ± 0.121.48 b ± 0.011.46 b ± 0.011.58 b ± 0.011.58 b ± 0.01nsF = 8.335,
p-val = 0.0119
3 FI
(g feed/ 100 g BW/day)
0.48 a ± 0.020.48 a ± 0.020.47 a ± 0.020.46 a ± 0.010.27 b ± 0.000.28 b ± 0.000.27 b ± 0.000.29 b ± 0.00nsF = 364.1,
p-val = 2.03 × 10⁻¹¹
Different lowercase letters denote significant differences (p < 0.05) between genotypes in each sampling point (three-way ANOVA: Genotype × Diet × Time; Tukey post hoc test). ns = not significant. Values expressed in the mean ± SD. Control (Control diet); PHYTO0.02 (PHYTO0.02 diet, supplemented with a 200 ppm blend of phytogenic feed additives consisting of a mixture of garlic and Labiatae plant essential oils with 87.5 mg terpens/kg diet); PHYTO0.1 (PHYTO0.1 diet, supplemented with a 1000 ppm blend of phytogenic feed additives, consisting of a mixture of citrus fruits and Asteraceae and Labiatae plant essential oils with 57 mg terpens/kg diet); GMOS0.5 (GMOS0.5 diet; supplemented with 5000 ppm galactomannan-oligosaccharides); GS (high-growth selected genotype); WT (wild type genotype); IBW (initial body weight (g)); FBW (final body weight (g) 72 days after feeding experience); FL (final length (g) 72 days after feeding experience); SGR (specific growth rate 72 days after feeding experience). 1 SGR = [(ln average final body weight − ln average initial body weight/no days] × 100. 2 FCR = Feed consumption (g)/weight gain (g). 3 FI = Individual feed intake (g).
Table 4. Circulating plasma cortisol level expressed in ng/mL per fish g of European sea bass (Dicentrarchus labrax) juveniles at t = 0 h pre-oxidative stress challenge and at t = 2 h and 24 h after the oxidative stress challenge.
WT GenotypeGS Genotype
ControlPHYTO0.02PHYTO0.1GMOS0.5ControlPHYTO0.02PHYTO0.1GMOS0.5
Time
0 h 3.49 a1 ± 1.103.77 a1 ± 0.623.61 a1 ± 0.923.83 a1 ± 1.150.92 b1 ± 0.231.96 b1 ± 0.891.95 b1 ± 0.211.97 b1 ± 0.85
2 h7.22 a2 ± 2.955.80 a2 ± 1.625.51 a2 ± 1.296.20 a2 ± 1.133.43 b2 ± 0.533.43 b2 ± 0.534.23 b2 ± 1.433.81 b2 ± 0.24
24 h3.26 a1 ± 0.313.54 a1 ± 1.353.57 a1 ± 1.734.10 a1 ± 1.322.14 b1 ± 0.411.61 b1 ± 0.471.58 b1 ± 0.131.79 b1 ± 0.68
Three-way ANOVA
DietGenotypeTimeD × G D × TG × TD × G × T
Plasmatic
cortisol
nsF = 0.41;
p-val = 2 × 10⁻¹⁶
F = 55.023;
p-val = 3.16 × 10⁻¹⁶
nsnsnsns
Different lowercase letters denote significant differences (p < 0.05) between genotypes in each sampling point (three-way ANOVA: Diet × Genotype × Time; Tukey post hoc test). Different numbers denote significant differences (p < 0.05) between experimental sampling points (three-way ANOVA: Genotype × Diet × Time; Tukey post hoc test). ns = not significant. Values expressed in mean ± SD. Control (Control diet); PHYTO0.02 (PHYTO0.02 diet, supplemented with a 200 ppm blend of phytogenic feed additives consisting of a mixture of garlic and Labiatae plant essential oils with 87.5 mg terpens/kg diet); PHYTO0.1 (PHYTO0.1 diet, supplemented with a 1000 ppm blend of phytogenic feed additives, consisting of a mixture of citrus fruits and Asteraceae and Labiatae plant essential oils with 57 mg terpens/kg diet); GMOS0.5 (GMOS0.5 diet; supplemented with 5000 ppm galactomannan-oligosaccharides); GS (high-growth selected genotype); WT (wild type genotype).
Disclaimer/Publisher’s Note: The statements, opinions and data contained in all publications are solely those of the individual author(s) and contributor(s) and not of MDPI and/or the editor(s). MDPI and/or the editor(s) disclaim responsibility for any injury to people or property resulting from any ideas, methods, instructions or products referred to in the content.

