Article

Horse Racing as a Model to Study the Relationship between Air Pollutants and Physical Performance

Integrative Laboratory of Biomechanics and Physiology of Effort, LIBFE, School of Kinesiology, Faculty of Medicine, Universidad de los Andes, Santiago 8320000, Chile
Animals 2022, 12(9), 1139; https://doi.org/10.3390/ani12091139
Submission received: 17 March 2022 / Revised: 15 April 2022 / Accepted: 26 April 2022 / Published: 28 April 2022
(This article belongs to the Special Issue Research on the Factors Affecting the Performance of Sport Horses)

Abstract

:

Simple Summary

Ambient air contains a mixture of pollutants, the effects of which on animal and human health have been widely described. In contrast, the effects on physical performance are poorly understood, largely due to the difficulty of implementing an experimental model to study this problem. Thoroughbred horse racing involves many animal athletes, of similar genetics, environmental exposure, training, and diet, who participate by breathing varying mixtures of ambient air. This paper presents an analysis strategy based on the homogeneity of the races, the distance, and the design of the track. This paper presents a preliminary analysis in which we observe that the level of performance is decreased by concentrations of PM10, PM2.5, NO2, NO, and CO in the air. Thus, we note that this natural experiment may constitute a model of interest to advance the understanding of the problem.

Abstract

This study proposes the theoretical principles for the selection of a sample of horse races to study the relationship between air pollutants and performance. These criteria were then applied to an original dataset comparing the correlations between these variables obtained in “Handicap” versus “Conditional” type races. Methods: The mean concentration of pollutants during the six hours prior to the race and the speed of the test were determined in 441 official races at a racecourse in Santiago, Chile, during the summer and winter months of 2012. Using layout, track condition and distance (1000, 1100 and 1200 m) as criteria, a homogeneous group of races (“Handicap”; n = 214) versus a heterogeneous group (“Conditional”; n = 95) were compared using simple correlations (Spearman’s test). Results: Race speed was related to greater levels of PM10, PM2.5, NO2, NO and SO2 and it was positively related to O3, a trend that was observed in the 1000, 1100 m races and in the total “Handicap” group. Similar results were observed only in 1000 m for the “Conditional” group with lower Rho, except for PM10 and PM2.5. The total races of the conditional group showed lower Rho values and significant associations of the same trend for CO, NO2, NO and SO2. Conclusions: Horse races between 1000 and 1200 m of the “Handicap” type appear to be an interesting group to study the relationship between air pollutants and the performance of racehorses. In the future, our observations should be expanded to other distances and other types of races.

1. Introduction

Physical performance is an area of broad interest in both animal and human sport competitions. The factors affecting this variable are numerous. There are performer’s own, or intrinsic, factors, such as genetic load [1], degree of training [2], biomechanical aspects, energy cost of movements [3], type of metabolism used, magnitude of maximal oxygen consumption [4], or age [5]. Psychological factors, race strategy and behavior are also intrinsic variables [6]. Another large group of variables, classified as extrinsic, correspond to the conditions in which the competition takes place, such as the distance of the race, the type, condition and design of the track, wind speed, humidity, ambient temperature, or geographical altitude. Ambient air pollutants (please see details in the technical report by the WHO [7]) also belong to this group, which, from a theoretical point of view, are widely recognized as potentially influencing performance; but the magnitude of their influence has been little described. From the ambient air point of view, the problem is constituted both by the great variability of the mixture and by the fact that its components affect performance by more than one mechanism. Thus, in the case of carbon monoxide (CO), for example, this gas binds to blood forming carboxyhemoglobin, which affects oxygen transport [8], while particulate matter (PM10 and PM2.5), nitrogen oxides (NO2 and NO), sulfur oxides (SO3 and SO2) and ozone (O3) act as irritants and inflame the airway, favoring the formation of secretions and increasing their resistance [9,10]. In view of the complexity of the problem, this question has been rarely addressed, and when it has been addressed, it referred to the laboratory application of individual contaminants in humans [11,12]. There are also a limited number of studies that have used values obtained in competitions, some of them made up of groups of human athletes of very different levels of performance [13]. To our knowledge, the only study on horse racing assessed the effect of air pollution on performance in 675 Grade I Stakes Thoroughbred racing conducted over 35 years at various US racetracks, for distances ranging between seven and twelve furlongs (about 1400 and 2400 m, respectively). The author described a marked decrease in the level of performance at high concentrations of O3 (unusual) with an overall minimal effect of the pollutants under the studied environmental conditions [14].
Experimental implementation to study the relationship between air pollutants and performance, under ideal conditions, would involve having a group of athletes from a similar gene pool and with comparable training and nutrition, as well as similar baseline environmental exposure, performing at their best in multiple tests in the presence of air with great variability in composition; which clearly represents a challenge of great magnitude. In this way, the study of a natural experiment, such as horse racing, may be an interesting approach, because these competitions are carried out by thoroughbred race horses; a group of animal athletes, bred, selected and trained specifically for these purposes that compete in multiple opportunities during the year in many countries around the world [15]. In addition, horse racing is highly regulated, which gives rise to varied types of races, designs and track surfaces that can potentially affect the model. For this reason, it is necessary to establish the best conditions to generate an adequate corpus of study to analyze the problem. Thus, in this paper we have created a dataset of official thoroughbred horse races in which we have applied some theoretical principles to establish a study model for the relationship between air pollutants and performance. Once these theoretical principles were applied, we compared a group of races of relative homogeneity, in terms of race conditions and competitors, versus a group of more heterogeneous races to evaluate our selection method.

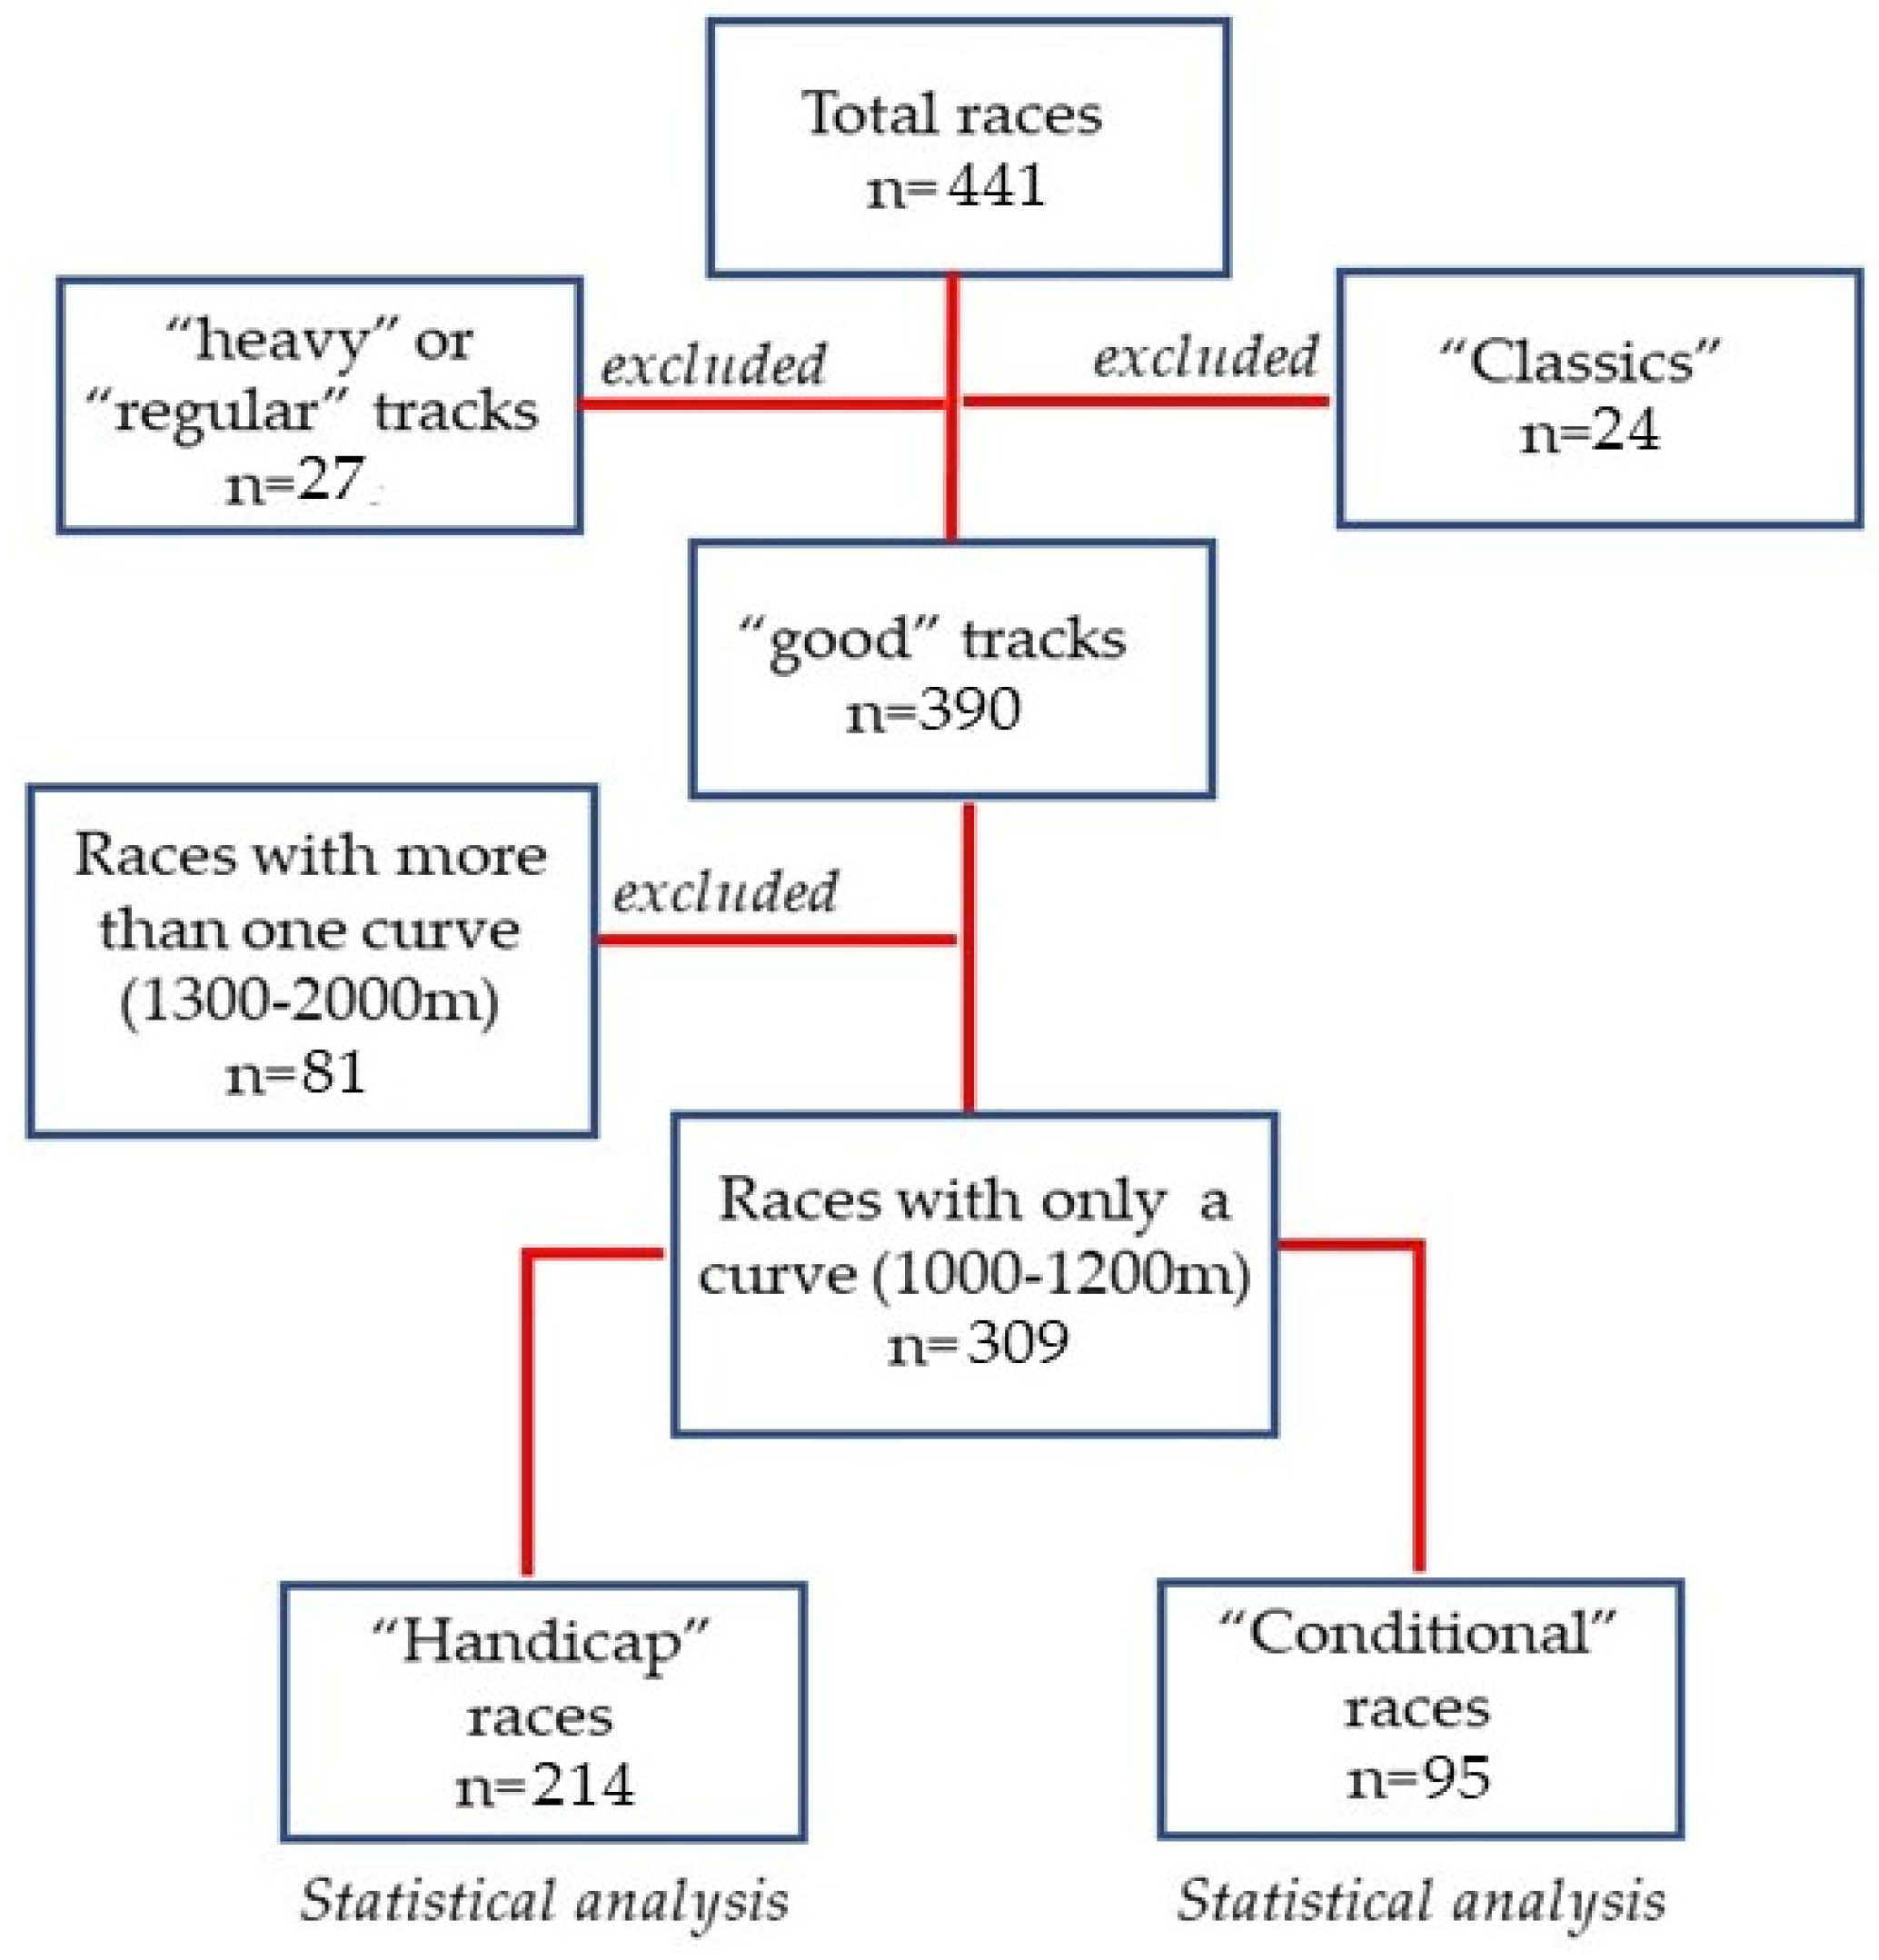
2. Materials and Methods

Air pollutants: pollutant concentrations were obtained 470 m from the equestrian center at the “Parque O’Higgins” station (see Figure 1), which is part of the air quality monitoring network of the city of Santiago, Chile (http://macam.mma.gob.cl (accessed on 1 February 2022). According to information from the environmental network, NO2, NO and O3 gases (expressed in ppm) were determined by chemiluminescence. For SO2, ultraviolet fluorescence was used, while CO concentration (expressed in ppm) was determined by dispersive infrared photometry. Finally, the determination of particulate matter (PM10 and PM2.5, (expressed in µg/m3) was carried out by gravimetry. The time of the winning horse, names and sexes of the horses, as well as the schedule, type of race, distance, track design and condition, were obtained from the official website of the “Club Hípico de Santiago” equestrian center (http://www.clubhipico.cl/ (accessed on 1 February 2022)). Since the data was in the public domain, no ethical evaluation was required.
Dataset: The sample included 441 official races carried out on an open 2000-m-long, 25-m-wide sand or grass track. The selected races were carried out over a total period of eight months during the summer (January, February) and winter (May, June, July, and August) of 2012. The races ranged from 1000 to 2000 m in length with varying layouts according to the distance, and the track conditions were described by the organizers as “good”, “regular” or “heavy”. The “Classics” type races (n = 24) were eliminated from our analysis because their competitors were selected for very high previous performance. Thus, the races analyzed were classified as “Handicap”, in which thoroughbred racehorses of both sexes competed, grouped according to a similar level of performance established by a ranking, to which an additional weight was added to balance the chances of winning the race. The other category was for “Conditional” races that included some mechanism for selecting participants according to their previous results, by being categorized as “winners”, “losers”, and those in which animals ran separated by sexes (e.g., “winning females”, “losing males”) or by age (e.g., “winning three-year-old males”).
Analysis strategy: according to the seasonal variation profile of pollutants typical of the city of Santiago, Chile, and with the purpose of generating the greatest variability in the composition of the ambient air, we included races carried out in summer and winter months. In addition, knowing that there can be immediate and delayed effects of pollutants on the animals, it was strategically chosen to measure the “delayed effect” by using the mean of the pollutants in the six hours prior to the competitions for the subsequent analysis. In order to reduce variation in performance, due to extrinsic and intrinsic factors, only the winning animal’s time was included for races carried out on a similar track (one curve and one straight) at short distances (1000, 1100 and 1200 m) to reduce the effect of strategy, and with a track described by the organizers as “good”. The tests studied were carried out in a short period of time (months), on a single racetrack to include a limited number of observed animals observed. Regarding the types of races carried out at the racetrack, these are highly standardized and regulated by the organizers. In this regard, to participate in the “Handicap” races, the horses must achieve a good level of performance. Based on these sporting achievements, they are ranked, assigned a “handicap index” and grouped according to this ranking when competing. In addition, within each race, they are assigned weights according to their ranking, which, according to the organizers, is intended to equalize the possibility of winning the race. From a theoretical point of view, this group appears as an opportunity to study our problem, since it has a relative homogeneity in terms of its participants and the conditions of competition. To evaluate the usefulness of this group, we compared it versus the “Conditional” races where there are different criteria to compete, making it more heterogeneous. For this comparison, correlations were calculated between race speed and pollutant concentration at the distances described. In addition, to give strength to our observations, the correlations were performed more than once, when studied at each distance and group, and were calculated after grouping the three distances to give a truer view of the associations and increase the statistical power of the associations.
Statistical analysis: in the “Handicap” and “Conditional” race groups, the basic statistics were obtained, and the type of distribution was determined by applying the D’Agostino and Pearson test for each variable. To describe any differences and compare the pollutant levels between the distances analyzed, according to the type of distribution, an ANOVA or Kruskal-Wallis test was performed, using Tukey’s or Dunn’s test as a posteriori test, respectively. When differences were detected, the “Eta squared” was calculated to evaluate the size of the difference. Subsequently, the data of the three distances were collected, for which a similar analysis was performed. Depending on the group distribution, the unpaired t-test or the Mann-Whitney test was used, and then, if differences were detected, Cohen’s d was calculated. The magnitude of the differences observed in both cases were interpreted according to Cohen’s criteria [16]. Finally, the correlations between race speed and individual pollutant concentrations were obtained using Spearman’s method; a significant value being considered when p was less than 0.05. Statistical analysis was performed using GraphPad Prism (version 9.0; San Diego, CA, USA).

3. Results

Of the 441 total races, using our analysis strategy, 27 (6.12%) were discarded because the track was described as “heavy” or “regular”, and then 81 (18.36%) because of their racetrack morphology (see Figure 2). Thus, the two groups where the effect of the homogeneity of the races on the pollutants, versus performance, was compared consisted of 214 (48.5%) races of the “Handicap” type and 95 (21.54%) of the “Conditional” type. Table S1 summarizes the mean, standard deviation, and interquartile range for the run speed and concentration of pollutants in the “Handicap” races. There, a lower concentration of PM2.5 can be observed in the 1100-m races compared to the 1000-m races, with a small difference in size. The same parameters for the “Conditional” races are presented in Table S2, which shows a lower concentration of PM2.5, CO, NO2 and NO at 1100 m versus 1200 m. This same difference is seen for PM10, in addition to a lower value for the 1000-m races. With respect to O3, the trend is reversed, with a higher concentration at 1100 versus 1200 m. Regarding the size of the difference, the pollutants that presented changes showed a medium value. It was also evaluated whether the load of the different pollutants was similar for the total of the “Handicap” versus “Conditional” races. In this regard, it was observed that the group of “Conditional” races was exposed to a higher concentration of PM2.5, CO, NO and SO2 with the magnitude of the difference observed being small (see Table 1). To evaluate the heterogeneity of the “Conditional” group, we compared the determinants of race speed, according to the various subtypes of tests of this category (see methods section); thus, we performed a 2 × 2 ANOVA test, using the sex of the animals and their previous results (winners/non-winners) as factors considered in selecting the competitors for these races. The factor “previous results” proved to be the determinant (p = 0.0007), the factor “animal sex” did not appear to be a determinant of the result (p = 0.12), while the interaction between the factors was significant (0.041). The analysis by group showed that the winning females (n = 9; 63.43 km/hr) were faster than the non-winning females (n = 37; 62.54 km/hr), value of p = <0.0001, with a large difference size (d = 1.81). Regarding the group of males, no differences were observed. Since neither of these two factors were used to select the competitors in the “Handicap” group, it was not possible to make a similar comparison.
Table 2 shows the Spearman’s Rho calculated for the correlations studied, and the p-values for the associations between speed and pollutant concentration in the “Handicap” group. In these tables, it is possible to observe that, at 1000 m, there are negative correlations with PM10, PM2.5, CO, NO2, NO and SO2, while with O3 the correlation is positive. In the 1100-m group, the same trends are maintained, but with lower Rho values, except for CO. At 1200 m, the same trends can be seen, with lower Rho values for CO, NO2, NO and SO2, without significant associations.
Regarding the “Conditional” races, Table 3 shows the Spearman’s Rho values and the p-values calculated for the speed/pollutant correlations. The 1000-m races show correlations with the same trends as those found in the “Handicap” group, except for PM10 and PM2.5, but with lower Rho values for NO2 and SO2. In turn, in this group higher CO and O3 values were found with respect to the first group. At 1100 m, lower Rho values than in the first group analyzed for this type of race were observed, and only CO and SO2 showed a significant association. Also, when comparing their values with the same distance as the “Handicap” group, lower Rho values were observed in this group of races. In the case of 1200 m, we did not find significant associations. Finally, when analyzing the correlations with the total data of each category, the “Handicap” group presented significant associations of speed with all pollutants, with the same trend observed in each distance of this group, while the group of “Conditional” races showed lower Rho values than the “Handicap” group for all pollutants and presented significant correlations only for CO, NO2, NO and SO2. It should be noted that, in view of the multiple comparisons made between speed and pollutants, the possibility of making the type I error increases. Using the p-value adjustment criterion with the use of the Bonferroni adjustment for the total dataset of each category, we found that the described significances are maintained for all the correlations of the “Handicap” group, while the significance is only maintained in the relationship between the winning horse’s speed and SO2.

4. Discussion

In this paper, we developed a dataset and applied theoretical principles for its analysis in search of a study model for the relationship between air pollutants and performance in racehorses. Our analysis showed that race categories may add unwanted variability to an eventual model, so any tendency to correlate data for all races and conditions involved in horse racing must be treated with caution. For this reason, one of the first tasks was to look for the appropriate group of races for our purposes. Thus, in view of wanting to establish the most standardized conditions, in terms of design and track conditions (see Figure 2), we considered that the “Handicap” type of races might constitute a corpus of analysis. This is because to take part in this type of race, animals of both sexes must comply with age requirements and sporting achievements. In addition, at the time of the race, an attempt is made to equalize the conditions of success among the participants. In this way, the “Handicap” type of races generates a degree of homogeneity that transforms these races into a group of interest to solve our research problem. Thus, as a way of evaluating the effect of the homogeneity of these races on the relationship under study, we compared this group against a group of races of great heterogeneity, where performance is strongly influenced by the selection of the sample.
The first step of this analysis consisted in characterizing the pollutant concentrations to which the animals were exposed, which can be seen in Tables S1 and S2. Using the medians of the total races presented in Table 1 as a parameter, we found that the concentrations at which these races were conducted are above the suggested pollutant exposure norms for humans according to WHO [17]. Thus, this institution recommends for PM10 an annual mean of 10 versus the 84–88 µg/m3 found in our races. For PM2.5, an annual mean of 5 is recommended, versus a range between 22–23 µg/m3 present in our sample. For NO2 an annual mean of 5.14 is recommended versus the observed value between 16–21 ppb, or a daily maximum value of 29.56, taken as an 8 h mean over 6 months is recommended, while in our sample observed values varied between 27 to 32 ppb. This is relevant, since our observations were made in a highly contaminated area. The explanation for this has to do with the fact that the city of Santiago, Chile, has high general levels of pollution [18], which is exacerbated by the fact that the track analyzed is located about 800 m from a large interprovincial highway that has a high vehicular flow (see “Autopista Central” in Figure 1). The fact that it is an area with high levels of pollution allowed us to sample animals exposed to multiple mixtures of pollutants that occur naturally in the environment. Exposing animals to such multiple levels of pollutants in a laboratory would be difficult to reproduce, due to ethical concerns when proposing such tests in view of the known effects of the pollutants. From another aspect, it is important to remember that these animals are bred and live in environments with high pollution within their stables with the presence of dust and endotoxins [19], which has been linked to recurrent coughing and inflammatory airway disease in horses, [20] which, in turn, is linked to poor athletic performance. In our case, the horses grew up and trained in an environment with high levels of other pollutants, which may influence their acute response to exercise in these conditions [21,22]. This should be studied in the future against data obtained from racetracks with better air conditions.
The study of the association between speed and pollutants is presented in Table 2. Strategically, we made the comparison by distance in both groups and once we found that the speed of the race did not vary in both cases, we were able to gather the data from these races, which allowed us to repeat the correlations more than once. In the “Handicap” group, the Rho values tended to be lower as the distance increased, and we found significant associations for all pollutants at 1000 and 1100 m but not at 1200 m. A general comparison with the “Conditional” group showed that, in this group, for the most part, there were lower Rho values for the same distance, with the most significant associations occurring at the shortest distance. In another aspect, regarding the potential effect on correlations of different pollutant loads in the “Conditional” group, there is no difference in pollutants between 1000 and 1100 m (see Table S2). Regarding the 1200 m results, given that the weakest associations (lower Rho values) were seen at this distance, we speculate that this is largely a reflection of the application of race strategies, but this will need to be resolved in other studies. In any case, it is worth mentioning that, for the “Handicap” group, the Rho values obtained for this distance are lower, but with the same trend as those of the previous distances, so that the absence of significance may be explained by a low number of races at this distance. Additionally, this is reinforced because, when calculating the Rho for the three distances, significant inverse relationships appear that respond to a biological logic in view of the effects that pollutants can generate in exercising animals, such as increased resistance and inflammation of the airway [23]. This was true for most of the pollutants, except for O3, the gas with the lowest Rho value. Speculatively, perhaps its performance-lowering action is more acute due to its irritant effect on the airway [24]. However, it should be noted that the minimum concentration of the gas that induces a bronchoconstrictor effect in exercise has been described in humans at concentrations five times higher than those reported here [25]. Alternatively, it is possible that the association found reflects its relationship with other factors, such as environmental temperature (not currently studied), in view of the fact that its concentration increases in the warmer and brighter months [26].
Regarding the limitations of our research, there was a low percentage of races in which horses who regularly competed in the “Handicap” races also competed in the “Conditional” races. We believe that the effect of this overlapping of competitors is lessened because we only considered the winning horse of the races, but, even so, 14 horses won races in both types of races, which represented 5% of the total of both groups. Another limitation inherent to the nature of the study is that, regardless of the correlations described and the biological reasoning of our findings, we cannot affirm that the correlations are cause and effect, and we lack a complete study of the phenomenon to do so. Finally, at the single racetrack analyzed, most of the programmed races are carried out at distances between 1000 and 1200 m; however, a large number of races are held over longer distances.
The observed decreased level of performance at high concentrations of pollutants, is associated with the fact that exercise causes ventilation to increase. This phenomenon in humans is associated with an increase in the deposition of particulate material in the lungs [27]. In addition, when O3 is present, chest pain, dyspnea and wheezing appear [28] and, in some cases, airway reactivity increases, expressed in a lower FEV1 [29]. A similar result has been reported for the administration of particulate matter [30]) and SO2 [31]. In humans, exercise produces inflammation and oxidative lung damage [32,33]). In the same direction, Ivester et al. in 2018 found a high percentage (80%) of inflammatory patterns, compatible with moderate asthma, in 64 racehorses when analyzing bronchial-alveolar lavage. This process was associated with increased exposure to particulate matter below 4 μm and lower performance of the animals [34]. The phenomena described above may affect the level of performance by limiting O2 intake, increasing the work of breathing [35] and may eventually affect the exchange of O2 and CO2 at tissue level. From the cardiovascular point of view, during exercise, particulate matter has been associated with increased vascular reactivity, due to increased sympathetic activity [36,37]. In addition, in humans, a decrease in physical performance was reported from exposure to high concentrations of CO in comparison with our data (100 ppm), affecting both oxygen transport and evidencing cardiac malfunction [38]. Thus, it is possible that the decreased level of performance may be, in part, associated with a deficit in delivery due to a deficit in cardiovascular action (cardiac pump/blood vessels).
Regarding the projections of the presented study presented, it represents in itself a contribution to horseracing as a whole (breeders, owners, organizers). Furthermore, it is relevant to conduct this study on horses, given the eventual translational implications for humans, since several studies pn horses have been used as a model in the search for mechanisms in areas such as exercise physiology [39,40], diseases of the musculoskeletal system, such as osteoarthritis [41] and tendon damage [42], as well as in the study of tissue regeneration [43,44] and immunological processes linked to exercise [45].

5. Conclusions

Thoroughbred racehorses are a highly selected and trained group that compete in many parts of the world, in diverse environmental conditions. In view of these conditions, this activity appears an opportunity to advance the understanding of the effect of air pollution on physical performance. In addition, it is possible that within a standardized and diverse activity there are types of races that can be a good model for study. Thus, according to our results, we believe that horse racing (<1200 m) in the “Handicap” category can constitute a good group to study the relationship between pollutants and performance.

Supplementary Materials

The following supporting information can be downloaded at: https://www.mdpi.com/article/10.3390/ani12091139/s1, Table S1: Comparison of air pollutant load and speed of the “Handicap” races. Table S2: Comparison of air pollutant load and speed of the “Conditional” races. Table S3: Dataset of “Handicap” races; Table S4: Dataset of “Conditional” races.

Funding

This research received no external funding.

Institutional Review Board Statement

Not applicable.

Informed Consent Statement

Not applicable.

Data Availability Statement

The database is included in the Supplementary Materials.

Conflicts of Interest

The authors declare no conflict of interest.

References

  1. Todd, E.T.; Ho, S.Y.W.; Thomson, P.C.; Ang, R.A.; Velie, B.D.; Hamilton, N.A. Founder-specific inbreeding depression affects racing performance in Thoroughbred horses. Sci. Rep. 2018, 8, 6167. [Google Scholar] [CrossRef] [Green Version]
  2. Tanner, J.C.; Rogers, C.W.; Firth, E.C. The association of 2-year-old training milestones with career length and racing success in a sample of Thoroughbred horses in New Zealand. Equine Vet. J. 2013, 45, 20–24. [Google Scholar] [CrossRef]
  3. Jones, J.H.; Ohmura, H.; Stanley, S.D.; Hiraga, A. Energetic cost of locomotion on different equine treadmills. Equine Vet. J. Suppl. 2006, 36, 365–369. [Google Scholar] [CrossRef] [PubMed]
  4. Gramkow, H.L.; Evans, D.L. Correlation of race earnings with velocity at maximal heart rate during a field exercise test in thoroughbred racehorses. Equine Vet. J. Suppl. 2006, 36, 118–122. [Google Scholar] [CrossRef]
  5. Gramm, M.; Marksteiner, R. The effect of age on thoroughbred racing performance. J. Equine Sci. 2010, 21, 73–78. [Google Scholar] [CrossRef] [PubMed] [Green Version]
  6. Spence, A.J.; Thurman, A.S.; Maher, M.J.; Wilson, A.M. Speed, pacing strategy and aerodynamic drafting in Thoroughbred horse racing. Biol. Lett. 2012, 8, 678–681. [Google Scholar] [CrossRef]
  7. World Health Organization. Regional Office for Europe. Review of Evidence on Health Aspects of Air Pollution: REVIHAAP Project: Technical Report. 2021. Available online: https://apps.who.int/iris/handle/10665/341712 (accessed on 13 March 2022).
  8. Ryter, S.W.; Ma, K.C.; Choi, A.M.K. Carbon monoxide in lung cell physiology and disease. Am. J. Physiol. Cell Physiol. 2018, 314, C211–C227. [Google Scholar] [CrossRef] [PubMed]
  9. Ivester, K.M.; Couëtil, L.L.; Zimmerman, N.J. Investigating the link between particulate exposure and airway inflammation in the horse. J. Vet. Intern. Med. 2014, 28, 1653–1665. [Google Scholar] [CrossRef] [Green Version]
  10. Santos, U.P.; Arbex, M.A.; Braga, A.L.F.; Mizutani, R.F.; Cançado, J.E.D.; Terra-Filho, M.; Chatkin, J.M. Environmental air pollution: Respiratory effects. J. Bras. Pneumol. 2021, 47, e20200267. [Google Scholar] [CrossRef]
  11. Seltzer, J.; Bigby, B.G.; Stulbarg, M.; Holtzman, M.J.; Nadel, J.A.; Ueki, I.F.; Leikauf, G.D.; Goetzl, E.J.; Boushey, H.A. O3-induced change in bronchial reactivity to methacholine and airway inflammation in humans. J. Appl. Physiol. 1986, 60, 1321–1326. [Google Scholar] [CrossRef]
  12. Linn, W.S.; Venet, T.G.; Shamoo, D.A.; Valencia, L.M.; Anzar, U.T.; Spier, C.E.; Hackney, J.D. Respiratory effects of sulfur dioxide in heavily exercising asthmatics. A dose-response study. Am. Rev. Respir. Dis. 1983, 127, 278–283. [Google Scholar]
  13. Marr, L.C.; Ely, M.R. Effect of air pollution on marathon running performance. Med. Sci. Sports Exerc. 2010, 42, 585–591. [Google Scholar] [CrossRef] [PubMed]
  14. Gates, M. The influence of air pollution on Thoroughbred race performance. Equine Comp. Exerc. Physiol. 2007, 4, 79–88. [Google Scholar] [CrossRef]
  15. Flash, M.L.; Renwick, M.; Gilkerson, J.R.; Stevenson, M.A. Descriptive analysis of Thoroughbred horses born in Victoria, Australia, in 2010; barriers to entering training and outcomes on exiting training and racing. PLoS ONE 2020, 15, e0241273. [Google Scholar] [CrossRef]
  16. Cohen, J. Statistical Power Analysis for the Behavioral Sciences, 2nd ed.; Lawrence Erlbaum Associates: New York, NY, USA, 1988. [Google Scholar]
  17. WHO (World Health Organization). Air Pollution. Available online: https://www.who.int/health-topics/air-pollution (accessed on 21 February 2022).
  18. Franck, U.; Leitte, A.M.; Suppan, P. Multifactorial airborne exposures and respiratory hospital admissions—The example of Santiago de Chile. Sci. Total Environ. 2015, 502, 114–121. [Google Scholar] [CrossRef]
  19. Riihimäki, M.; Raine, A.; Elfman, L.; Pringle, J. Markers of respiratory inflammation in horses in relation to seasonal changes in air quality in a conventional racing stable. Can. J. Vet. Res. 2008, 72, 432–439. [Google Scholar] [PubMed]
  20. Couetil, L.L.; Hoffman, A.M.; Hodgson, J.; Buechner-Maxwell, V.; Viel, L.; Wood, J.L.N.; Lavoie, J.-P. Inflammatory airway disease in horses, ACVIM consensus statement. J. Vet. Intern. Med. 2007, 21, 356–361. [Google Scholar] [CrossRef] [PubMed]
  21. Brankston, G.; Greer, A.L.; Marshall, Q.; Lang, B.; Moore, K.; Hodgins, D.; Hennessey, J.T.G.; Beeler-Marfisi, J. Increased Weekly Mean PM2.5, and NO2 Are Associated with Increased Proportions of Lower Airway Granulocytes in Ontario Horses. Front. Vet. Sci. 2020, 7, 185. [Google Scholar] [CrossRef]
  22. Mullins, J.T. Ambient air pollution and human performance: Contemporaneous and acclimatization effects of ozone exposure on athletic performance. Health Econ. 2018, 27, 1189–1200. [Google Scholar] [CrossRef]
  23. Araneda, O.F.; Kosche-Cárcamo, F.; Verdugo-Marchese, H.; Tuesta, M. Pulmonary Effects Due to Physical Exercise in Polluted Air: Evidence from Studies Conducted on Healthy Humans. Appl. Sci. 2021, 11, 2890. [Google Scholar] [CrossRef]
  24. Lee, L.Y.; Widdicombe, J.G. Modulation of airway sensitivity to inhaled irritants: Role of inflammatory mediators. Environ. Health Perspect. 2001, 109 (Suppl. S4), 585–589. [Google Scholar] [PubMed] [Green Version]
  25. Adams, W.C. Effects of ozone exposure at ambient air pollution episode levels on exercise performance. Sports Med. 1987, 4, 395–424. [Google Scholar] [CrossRef] [PubMed]
  26. Zhang, J.J.; Wei, Y.; Fang, Z. Ozone Pollution: A Major Health Hazard Worldwide. Front. Immunol. 2019, 10, 2518. [Google Scholar] [CrossRef] [Green Version]
  27. Daigle, C.C.; Chalupa, D.C.; Gibb, F.R.; Morrow, P.E.; Oberdörster, G.; Utell, M.J.; Frampton, M.W. Ultrafine particle deposition in humans during rest and exercise. Inhal. Toxicol. 2003, 15, 539–552. [Google Scholar] [CrossRef] [PubMed]
  28. Brunekreef, B.; Hoek, G.; Breugelmans, O.; Leentvaar, M. Respiratory effects of low-level photochemical air pollution in amateur cyclists. Am. J. Respir. Crit. Care Med. 1994, 150, 962–966. [Google Scholar] [CrossRef]
  29. Balmes, J.R.; Chen, L.L.; Scannell, C.; Tager, I.; Christian, D.; Hearne, P.Q.; Kelly, T.; Aris, R.M. Ozone-induced decrements in FEV1 and FVC do not correlate with measures of inflammation. Am. J. Respir. Crit. Care Med. 1996, 153, 904–909. [Google Scholar] [CrossRef]
  30. Rundell, K.W.; Slee, J.B.; Caviston, R.; Hollenbach, A.M. Decreased lung function after inhalation of ultrafine and fine particulate matter during exercise is related to decreased total nitrate in exhaled breath condensate. Inhal. Toxicol. 2008, 20, 1–9. [Google Scholar] [CrossRef]
  31. Rondinelli, R.C.; Koenig, J.Q.; Marshall, S.G. The effects of sulfur dioxide on pulmonary function in healthy nonsmoking male subjects aged 55 years and older. Am. Ind. Hyg. Assoc. J. 1987, 48, 299–303. [Google Scholar] [CrossRef]
  32. Araneda, O.F.; Guevara, A.J.; Contreras, C.; Lagos, N.; Berral, F.J. Exhaled breath condensate analysis after long distance races. Int. J. Sports Med. 2012, 33, 955–961. [Google Scholar] [CrossRef]
  33. Bonsignore, M.R.; Morici, G.; Riccobono, L.; Insalaco, G.; Bonanno, A.; Profita, M.; Paternò, A.; Vassalle, C.; Mirabella, A.; Vignola, A.M. Airway inflammation in nonasthmatic amateur runners. Am. J. Physiol. Lung Cell Mol. Physiol. 2001, 281, L668–L676. [Google Scholar] [CrossRef]
  34. Ivester, K.M.; Couëtil, L.L.; Moore, G.E. An observational study of environmental exposures, airway cytology, and performance in racing thoroughbreds. J. Vet. Intern. Med. 2018, 32, 1754–1762. [Google Scholar] [CrossRef]
  35. Giles, L.V.; Brandenburg, J.P.; Carlsten, C.; Koehle, M.S. Physiological responses to diesel exhaust exposure are modified by cycling intensity. Med. Sci. Sports Exerc. 2014, 46, 1999–2006. [Google Scholar] [CrossRef] [PubMed]
  36. Rundell, K.W.; Hoffman, J.R.; Caviston, R.; Bulbulian, R.; Hollenbach, A.M. Inhalation of ultrafine and fine particulate matter disrupts systemic vascular function. Inhal. Toxicol. 2007, 19, 133–140. [Google Scholar] [CrossRef] [PubMed]
  37. Cutrufello, P.T.; Rundell, K.W.; Smoliga, J.M.; Stylianides, G.A. Inhaled whole exhaust and its effect on exercise performance and vascular function. Inhal. Toxicol. 2011, 23, 658–667. [Google Scholar] [CrossRef] [PubMed]
  38. Aronow, W.S.; Cassidy, J. Effect of carbon monoxide on maximal treadmill exercise. A study in normal persons. Ann. Intern. Med. 1975, 83, 496–499. [Google Scholar] [CrossRef] [PubMed]
  39. Witkowska-Piłaszewicz, O.; Bąska, P.; Czopowicz, M.; Żmigrodzka, M.; Szarska, E.; Szczepaniak, J.; Nowak, Z.; Winnicka, A.; Cywińska, A. Anti-Inflammatory State in Arabian Horses Introduced to the Endurance Training. Animals 2019, 9, 616. [Google Scholar] [CrossRef] [Green Version]
  40. Witkowska-Piłaszewicz, O.; Pingwara, R.; Winnicka, A. The Effect of Physical Training on Peripheral Blood Mononuclear Cell Ex Vivo Proliferation, Differentiation, Activity, and Reactive Oxygen Species Production in Racehorses. Antioxidants 2020, 9, 1155. [Google Scholar] [CrossRef]
  41. McIlwraith, C.W.; Frisbie, D.D.; Kawcak, C.E. The horse as a model of naturally occurring osteoarthritis. Bone Jt. Res. 2012, 1, 297–309. [Google Scholar] [CrossRef]
  42. Patterson-Kane, J.C.; Becker, D.L.; Rich, T. The pathogenesis of tendon microdamage in athletes: The horse as a natural model for basic cellular research. J. Comp. Pathol. 2012, 147, 227–247. [Google Scholar] [CrossRef] [Green Version]
  43. Sarrafian, T.L.; Garcia, T.C.; Dienes, E.E.; Murphy, B.; Stover, S.M.; Galuppo, L.D. A nonterminal equine mandibular model of bone healing. Vet. Surg. 2015, 44, 314–321. [Google Scholar] [CrossRef]
  44. Brehm, W.; Burk, J.; Delling, U. Application of stem cells for the treatment of joint disease in horses. Methods Mol. Biol. 2014, 1213, 215–228. [Google Scholar] [PubMed]
  45. Horohov, D.W. The equine immune responses to infectious and allergic disease: A model for humans? Mol. Immunol. 2015, 66, 89–96. [Google Scholar] [CrossRef] [PubMed]
Figure 1. Satellite map of the “Club Hípico de Santiago”. The monitoring station “Parque O’Higgins” is indicated in red. The image was obtained from the Google maps site https://www.google.cl/maps (accessed on 13 March 2022).
Animals 12 01139 g001
Figure 2. Data analysis inclusion and exclusion criteria. First, a “Classic” type race with a “heavy” or “regular” track was excluded. Then, those that included more than one curve were excluded by track design. Finally, statistical analysis was performed in the 1000, 1100 and 1200 m races comparing the “Handicap” races with the “Conditional” races.
Animals 12 01139 g002
Table 1. Comparison between the race speed and pollutant concentration of all races in the “Handicap” versus “Conditional” groups. The p value shown corresponds to the t-student or Mann-Whitney test, according to the distribution of the data, in addition to Cohen’s “d”, calculated when there were differences. Values are expressed as mean ± standard deviation and median (IQR).
HandicapConditionalp-Value/
Cohen’s d
Races (n)21495
Speed (km/h)62.36 ± 0.8962.25 ± 0.910.32
62.43 (1.22)62.19 (1.37)
PM10 (µg/m3)90.42 ± 31.6192.25 ± 31.04
86.50 (44.25)84.30 (37.00)0.94
PM2.5 (µg/m3)24.97 ± 12.4729.25 ± 15.10
21.35 (16.05)23.90 (18.10)0.0247/0.25
Ozone (ppb)25.66 ± 12.6928.68 ± 13.23
27.80 (22.28)31.70 (23.60)0.086
CO (ppm)0.44 ± 0.290.56 ± 0.44
0.35 (0.40)0.30 (0.40)0.033/0.23
NO2 (ppb)26.15 ± 21.3328.61 ± 24.46
17.60 (37.75)16.50 (28.10)0.14
NO (ppb)16.12 ± 28.0733.34 ± 46.64
4.65 (18.88)10.90 (35.50)<0.0001/0.48
SO2 (ppb)2.73 ± 1.253.17 ± 1.56
2.30 (1.12)2.60 (2.00)0.044/0.23
Table 2. Spearman’s Rho (above) and p-values (in italics below) calculated between the winning horse’s speed and the mean values of the pollutant concentration during the six hours prior to the race in the “Handicap” category for the distances of 1000, 1100, 1200 m and for all the races together. The n for O3 were 32, 138, 30 respectively, while for the total races it was 200. Significant p-values using the Bonferroni adjustment are shown in bold italics.
1000 m1100 m1200 mTotal
Races (n)3314832214
PM10−0.65
0.000037
−0.25
0.0019
−0.25
0.16
−0.32
0.0000015
PM2.5−0.63
0.000060
−0.25
0.0019
−0.34
0.059
−0.31
0.0000026
Ozone0.44
0.012
019
0.024
0.20
0.28
0.20
0.0038
CO−0.42
0.014
−0.39
0.0000010
−0.26
0.16
−0.37
0.000000018
NO2−0.64
0.000048
−0.35
0.000011
−0.30
0.099
−0.40
0.0000000021
NO−0.58
0.00034
−0.38
0.0000019
−0.18
0.32
−0.38
0.0000000096
SO2−0.67
0.000013
−0.27
0.00082
−0.18
0.32
−0.33
0.00000061
Table 3. Spearman’s Rho (above) and p-values (in italics below) calculated between the winning horse’s speed and the mean values of the pollutant concentration during the six hours prior to the race in the “Conditional” category for the distances of 1000, 1100, 1200 m and for all the races together. The n for O3 were 17, 51, 19 respectively, while for the total races it was 87. Significant p-values, using the Bonferroni adjustment. are shown in bold italics.
1000 m1100 m1200 mTotal
Races (n)17552395
PM100.045
0.86
−0.15
0.27
−0.21
0.34
−0.04
0.67
PM2.5−0.46
0.063
−0.07
0.63
−0.25
0.24
−0.16
0.13
Ozone0.48
0.050
−0.05
0.73
0.07
0.76
0.03
0.79
CO−0.59
0.015
−0.28
0.038
−0.06
0.78
−0.23
0.023
NO2−0.42
0.093
−0.22
0.10
−0.17
0.44
−0.26
0.010
NO−0.56
0.020
−0.19
0.18
−0.23
0.30
−0.23
0.024
SO2−0.62
0.010
−0.35
0.010
−0.17
0.43
−0.32
0.0015
Publisher’s Note: MDPI stays neutral with regard to jurisdictional claims in published maps and institutional affiliations.

