Article

Feeding Calcium-Ammonium Nitrate to Lactating Dairy Goats: Milk Quality and Ruminal Fermentation Responses

by
Kleves V. Almeida
1,2,
Geraldo T. Santos
1,*,
Jesus A. C. Osorio
1,
Jean C. S. Lourenço
1,
Monique Figueiredo
1,
Thomer Durman
1,
Francilaine E. Marchi
1,
Claudete R. Alcalde
1,
Ranulfo C. Silva-Junior
3,
Camila C. B. F. Itavo
4,
Rafael C. Araujo
5 and
Andre F. Brito
2
1
Department of Animal Science, State University of Maringa, Maringa 87020, Brazil
2
Department of Agriculture, Nutrition, and Food Systems, University of New Hampshire, Durham, NH 03824, USA
3
Department of Chemistry, State University of Maringa, Maringa 87020, Brazil
4
Faculty of Veterinary Medicine and Animal Science, Federal University of Mato Grosso do Sul, Campo Grande 79070, Brazil
5
GRASP Ind. & Com. LTDA, Curitiba 81260, Brazil
*
Author to whom correspondence should be addressed.
Animals 2022, 12(8), 983; https://doi.org/10.3390/ani12080983
Submission received: 11 March 2022 / Revised: 6 April 2022 / Accepted: 9 April 2022 / Published: 11 April 2022
(This article belongs to the Special Issue Advances in Animal Novel Alternative Feed)

Abstract

:

Simple Summary

Calcium-ammonium nitrate (CAN) has been extensively used as a potential methane inhibitor for ruminants; however, there is still a need for studies focused on investigating its effects on the fatty acid profile and antioxidant capacity of milk, especially from dairy goats. Therefore, we evaluated the effects of CAN on nutrient digestibility, ruminal fermentation, and milk quality of lactating Saanen goats. Treatments consisted of a control diet (without CAN), 10 g of CAN per kg of dry matter, and 20 g of CAN per kg of dry matter. Supplemental CAN did not affect feed intake, digestibility of nutrients, and most ruminal fermentation parameters. Yields and composition of milk were not affected, and minor treatment effects were observed on the milk fatty acid profile. Milk antioxidant capacity was altered by increased conjugated dienes and reduced thiobarbituric acid reactive substances, along with greater concentrations of nitrate and nitrite residues in milk. Calcium-ammonium nitrate can be fed to lactating dairy goats up to 20 g per kg of dry matter without negative effects on nutrient digestibility and milk composition; however, it increased the concentration of conjugated dienes in milk, which may induce its faster lipid oxidation.

Abstract

We aimed to investigate the effects of calcium-ammonium nitrate (CAN) fed to lactating dairy goats on dry matter (DM) intake, digestibility of nutrients, milk properties (composition, antioxidant capacity, fatty acid profile, and nitrate residues), and ruminal fermentation parameters. Twelve lactating Saanen goats averaging 98.5 ± 13.1 days in milk, 53.5 ± 3.3 kg of body weight, and 2.53 ± 0.34 kg of milk/day were randomly assigned in four 3 × 3 Latin squares to receive the following diets: a control group (without CAN) with 7.3 g/kg DM of urea (URE), 10 g/kg DM of CAN (CAN10), and 20 g/kg DM of CAN (CAN20). Each period lasted 21 days, with 14 days for diet adaptation and seven days for data and sample collection. The DM intake, digestibility of nutrients, yields of milk, 3.5% fat-corrected milk, and energy-corrected milk were not affected by treatments. Similarly, there were no treatment effects on the yields and concentrations of milk fat, true protein, and lactose, along with minor effects on milk fatty acid profile. Total antioxidant capacity in milk was unaffected by treatments; however, concentration of conjugated dienes increased, while thiobarbituric acid reactive substances in milk decreased linearly. Nitrate and nitrite residues in milk were elevated by treatments, while the total of volatile fatty acids and ammonia-N concentration in the rumen were unaffected. Collectively, feeding CAN (up to 20 g/kg of DM) to lactating dairy goats did not affect feed intake, nutrient digestibility, and milk composition; however, it may increase milk lipid oxidation, as evidenced by increased conjugated diene concentration.

1. Introduction

Nitrate (NO3) is an inorganic anion that has been largely used in ruminant diets as a potential feed additive to inhibit enteric methane (CH4) production and concomitantly as a source of non-protein nitrogen (NNP) due to its capacity to provide ammonia (NH3) to ruminal microbes [1,2]. Methane suppression within the rumen occurs because NO3 is an electron acceptor that acts at the expense of methanogenesis as metabolic hydrogen [H] sink, and because of the reduction from NO3 to NH3 via denitrification, it may generate intermediates such as nitrous oxide (N2O), nitric oxide (NO), and nitrite (NO2), the latter considered toxic for ruminal methanogens [3,4,5,6].
It is well-established that supplementing NO3 to ruminants must be conducted cautiously and an adaptation period with incremental doses of NO3 in the diet is highly recommended to avoid animal poisoning due to an unwanted NO2 accumulation in the rumen, which may also be absorbed through the rumen wall and transferred to tissues and animal products such as milk [7,8,9]. Indeed, previous studies showed that feeding NO3 to dairy cows with a prior adaptation period warranted low NO3 and NO2 residues in milk and therefore without risks for food safety [10,11,12]. Nevertheless, additional studies investigating residues of NO3 and NO2 in milk from treated dairy goats are required, mainly due to its importance for human nutrition, considering singularities such as lower allergenic properties when compared to the milk from dairy cows [13].
In addition, there is still limited information behind the mechanism of NO3 and NO2 transference to milk, and how these residues would affect milk antioxidant capacity. As mentioned previously, NO can also be produced during the reduction of NO3 to NH3. Thus, it is speculated that the presence of NO might may affect the milk antioxidant capacity because of its potential to induce nitrosative stress and impact milk oxidative stability [14,15]. To our knowledge, the effects of NO3 supplementation to lactating dairy goats on milk properties such as fatty acid (FA) profile and antioxidant capacity have never been reported in the literature.
Despite the well-documented effect of NO3 supplementation at mitigating enteric CH4 production [1,8] and responses such as reduced dry matter intake (DMI) caused by aspects such as lower diet palatability [12,16], there is still a discrepancy between studies on how nitrate would affect ruminal fermentation, with exception to a greater acetate proportion response [17,18]. More studies are warranted to clarify NO3 responses on nutrient digestibility and potential changes in ruminal fermentation, which may affect the synthesis of milk components and FA profile.
We hypothesized that feeding calcium-ammonium nitrate (CAN) gradually to lactating dairy goats would not affect animal performance and nutrient digestibility, increasing acetate proportion, although without negative impacts on milk quality due to low transference of NO3 and NO2 residues to milk, regardless of the dose supplemented. Therefore, the objectives were to investigate the effects of incremental amounts of CAN fed to lactating dairy goats on dry matter intake, nutrient digestibility, milk production and composition, milk FA profile and antioxidant capacity, and ruminal fermentation parameters.

2. Materials and Methods

Experimental procedures involving animals were approved by the Animal Care Ethics Committee of the State University of Maringa to meet the guidelines of the National Council for the Control of Animal Experimentation (protocol 9512221018). The experiment was conducted at the goat unit of the State University of Maringa, Maringa, Parana, Brazil.

2.1. Animals, Experimental Design, and Diets

Twelve lactating Saanen goats averaging 98.5 ± 13.12 days in milk, 53.5 ± 3.34 kg of body weight (BW), and 2.53 ± 0.342 kg of milk/day (mean ± SD) were distributed in four 3 × 3 Latin squares balanced for carryover effects. The experiment lasted 63 days, divided into three periods of 21 days, with 14 days for adaptation to the experimental diets and seven days for sampling and data collection. Animals were housed in pens and fed individually to assess the DMI. Experimental diets were formulated to meet the NRC [19] requirements for lactating goats weighing 60 kg and producing 3 kg of milk/day (Table 1).
Feed ingredients (corn silage, ground corn, and soybean meal) were analyzed for chemical composition prior to the formulation of diets and corn silage was sampled weekly throughout the study and analyzed for dry matter (DM) to maintain the same forage-to-concentrate ratio. The source of NO3 used in the study was the calcium-ammonium nitrate decahydrate [5Ca(NO3)·2NH4NO3·10H2O], with 85.0% of DM, 16.5% of N, 19.6% of Ca, and 76.5% NO3 on a DM basis (Yara, Oslo, Norway).
Experimental diets were URE: 7.32 g of urea/kg of DM as a control group, CAN10: 10 g of CAN (7.65 g/kg of NO3 on a DM basis), and CAN20: 20 g of CAN (15.3 g/kg of NO3 on a DM basis). Animals were pre-adapted to the treatments during the first four days of each experimental period, with CAN added gradually (increasing 25% per day) until reaching the amount established for each treatment. Experimental diets were fed as total mixed ration (TMR) twice per day at 0800 and 1600 h in proportions of 70 and 30% of the total DMI, respectively. Diets were adjusted daily to allow approximately 5% of refusals and animal BW was recorded at the end of each experimental period before the morning feeding.

2.2. Sample Collection and Chemical Analyses

Data and sample collections were performed in the last seven days of each experimental period. Fecal grab samples (~30 g) were collected once daily from days 15 to 21 at different time points (0600, 0800, 1000, 1200, 1400, 1600, and 1800 h on days 15, 16, 17, 18, 19, 20, and 21, respectively) and frozen at −20 °C until analyses. Samples of concentrate, corn silage, and refusals were collected from days 15 to 20 and frozen at −20 °C for later chemical composition analyses. Feed, refusal, and fecal samples were dried at 60 °C for 48 h in a forced-air oven (Heratherm OMS180; Thermo Fisher Scientific, Waltham, MA, USA) to determine DM concentration. Samples were ground to pass through a 4-mm sieve and then to a 1-mm sieve using a Wiley mill (Thomas Scientific, Swedesboro, NJ, USA) before chemical analyses.
Concentrate and corn silage were pooled individually to obtain one sample per period, while fecal and refusal samples were composited proportionally based on their DM concentration to yield one sample per animal per period. All samples were analyzed according to AOAC [20] for DM (method 934.01), crude protein (CP; method 990.03), neutral detergent fiber (NDF; method 2002.04), ash (method 942.05), and ether-extract (EE; method 920.39). Fecal excretion was estimated according to the methodology proposed by Cochran et al. [21]. In brief, approximately 0.5 g of feed, feces, and refusals were weighed into Ankom F57 bags (25-µm porosity; Ankom Technology, Macedon, NY, USA) and incubated in the rumen of two Holstein ruminally cannulated cows. Animals were housed in a tie-stall barn with free access to water and individually fed a diet composed of 60% of corn silage and 40% of grain mix (on a DM basis). The ruminal incubations lasted 288 h and cannulas were checked twice daily to guarantee the welfare of the animals. After removing from the rumen, bags were drained, rinsed, and then analyzed for NDF in a Ankom 200 Fiber Analyzer (Ankom Technology, Macedon, NY, USA).

2.3. Milk Collection and Laboratory Assays

Goats were manually milked twice daily (0800 and 1600 h) and milk yield was weighed and recorded during the last seven days of each experimental period. Milk samples were collected on days 15 and 16 during each milking (morning and afternoon) and mixed proportionally according to the milk yield. A 50 mL aliquot of milk was collected and preserved with 2-bromo-2-nitropopano-1.3-diol for analyses of fat (%), protein (%), and lactose (%) by mid infrared spectrophotometry (Bentley 2000; Bentley Instrument Inc., Chaska, MN, USA) according to De Andrade [22], and milk urea nitrogen (MUN) using the Berthelot method (Chemspec 150; Bentley Instrument Inc., Chaska, MN, USA). Somatic cell count (SCC) was conducted using the Somacount FC (Bentley Instrument Inc., Chaska, MN, USA) based on Arcuri [23]. Yields of 3.5% fat corrected milk (FCM) and energy corrected milk (ECM) were calculated according to Sklan et al. [24] and Sjaunja et al. [25], respectively. Feed efficiency (FE) was calculated by the ratio between ECM yield and DMI. Five additional aliquots of milk (50 mL each) including backup samples were collected and frozen at −20 °C for later analyses of antioxidant capacity, NO3 and NO2 residues, and FA profile.
Conjugated dienes (CD) were measured at 232 nm by a UV–Vis spectrophotometer (Spectrum SP-2000, Castelnuovo, DB, Italy) and the results were expressed as mmol/kg of fat [26]. Thiobarbituric acid reactive substances (TBARS) were analyzed according to Vyncke [27] with modifications [28] using a UV–Vis spectrophotometer (Spectrum SP-2000, Castelnuovo, DB, Italy) with readings at 532 nm and results were expressed as mmol of malonaldehyde/kg of fat. Total antioxidant capacity (TAC) was determined as described by Nenadis et al. [29], with readings at 734 nm using a UV–Vis spectrophotometer (Spectrum SP-2000, Castelnuovo, DB, Italy) and results were expressed in Trolox equivalent (μM Trolox/mL).
Concentration of NO3 residues in milk was obtained by alkaline catalytic oxidation, which converts nitrogenous compounds into NO3. Subsequently, NO3 was reduced to NO2 using the cadmium metal and determined by diazotization with sulfanilamide and N-naphthyl (1-naphthyl-ethylenediamine-dihydrochloride) according to Cortas and Wakid [30].
Milk FA profile was analyzed via fat extraction, first by centrifugation as proposed by Murphy et al. [31] and then by esterification according to the ISO 5509 method [32] using KOH/methanol and n-heptane. Fatty acid methyl esters were quantified using a gas chromatograph (Trace GC 52 Ultra; Thermo Scientific, Waltham, MA, USA) equipped with a flame ionization detector at 240 °C and a fused silica capillary column (100 m in length, 0.25 mm internal diameter, and 0.20 μm; Restek 2560, Thermo Scientific, Waltham, MA, USA). Gas flow rate was 45 mL/min for H2 (carrier gas), 45 mL/min for N2 (auxiliary gas), and 45 to 400 mL/min of synthetic air (flame gas). Column temperature was initially set at 50 °C (4 min), raised gradually (10 °C/min) up to 200 °C (15 min), and finally raised (20 °C/min) to reach 240 °C (8 min) as the final temperature. Milk FAs were quantified by comparing the retention time of FA methyl esters from standards (18919-1 Sigma Aldrich, St. Louis, MO, USA) and milk samples.

2.4. Blood and Ruminal Fluid Collections

Blood was sampled by puncture of the jugular vein on day 19 of each experimental period before (0 h) and 4 h after the morning feeding into serum separator evacuated tubes, centrifuged (3200× g for 15 min at 4 °C), and stored at −20 °C for subsequent analyses. Concentration of plasma urea nitrogen (PUN) was analyzed colorimetrically by commercial kits (Gold Analisa, Belo Horizonte, MG, Brazil) using a spectrophotometer (Bio-2000; Bioplus, São Paulo, SP, Brazil).
Ruminal fluid was collected on day 20 of each experimental period using an esophageal tube coupled to a vacuum pump about 2 and 8 h after morning feeding. An aliquot of 50 mL was collected, and pH was immediately measured using a pH meter (Tecnal, Piracicaba, SP, Brazil). A second aliquot of 50 mL was filtered through four layers of cheesecloth, acidified with 1 mL of sulfuric acid (1:1 vol/vol), and stored at −20 °C for later analyses. Concentration of volatile fatty acids (VFAs) was determined using a gas chromatograph (Shimadzu GC-2010 Plus; Shimadzu, Kyoto, Japan) equipped with an AOC-20i automatic injector, Stabilwax-DA capillary column (30 m, 0.25 mm ID, 0.25 μm; Restek, Bellefonte, PA, USA) and a flame ionization detector after acidifying with 1 M of phosphoric acid and spiked with a water-soluble FA-2 standard. A 1 μL aliquot of each sample was injected with a 40:1 split rate using H2 as the carrier gas. Injector and detector temperatures were 250 °C and 300 °C, respectively. Column temperature started at 40 °C, was raised to 120 °C at a rate of 40 °C/min, followed by a gradient of 120 °C to 180 °C at the rate of 10 °C/min and a rate of 120 °C/min for 180 °C to 240 °C, and then the temperature was maintained at 240 °C for an additional 3 min. Ammonia-N (NH3-N) concentration was measured via colorimetric quantification of N using the phenol-hypochlorite reaction according to Broderick and Kang [33].

2.5. Statistical Analyses

Data were checked for the normality of residuals using the Shapiro–Wilk test. Responses that violated the assumptions of normality (ruminal NH3–N) were subjected to power transformation as described by Box and Cox [34]. The LSM and SEM were back transformed prior to the presentation of results [35].
The MIXED procedure of SAS (SAS ver. 9.4, SAS Institute Inc., Cary, NC, USA) was used to analyze the data according to the following model:
Yijkl = μ + Si + Pj + A(S)ki + Tl + єijkl,
where Yijkl = dependent variable; μ = overall mean; Si = random effect of i-th square (i = 1 to 4); Pj = random effect of the j-th period (j = 1 to 3); A(S)ki = random effect of the k-th animal nested within the i-th square; Tl = fixed effect of the l-th treatment (1 = URE, 2 = CAN10, and 3 = CAN20); and єijkl = residual error associated with each observation as a random effect.
Orthogonal polynomial contrasts were used to determine linear and quadratic effects of treatments on the responses analyzed. Treatment significances and trends were declared at p ≤ 0.05, and 0.05 < p ≤ 0.10, respectively.

3. Results

3.1. Dry Matter Intake and Nutrient Digestibility

Supplemental CAN did not affect BW and DMI, averaging 53.2 kg and 1.77 kg/day, respectively (Table 2). Apparent digestibility of DM (p = 0.08), organic matter (OM; p = 0.09), and CP (p = 0.06) tended to a quadratic response by supplementing CAN to lactating dairy goats. However, treatment did not affect EE and NDF digestibility (Table 2).

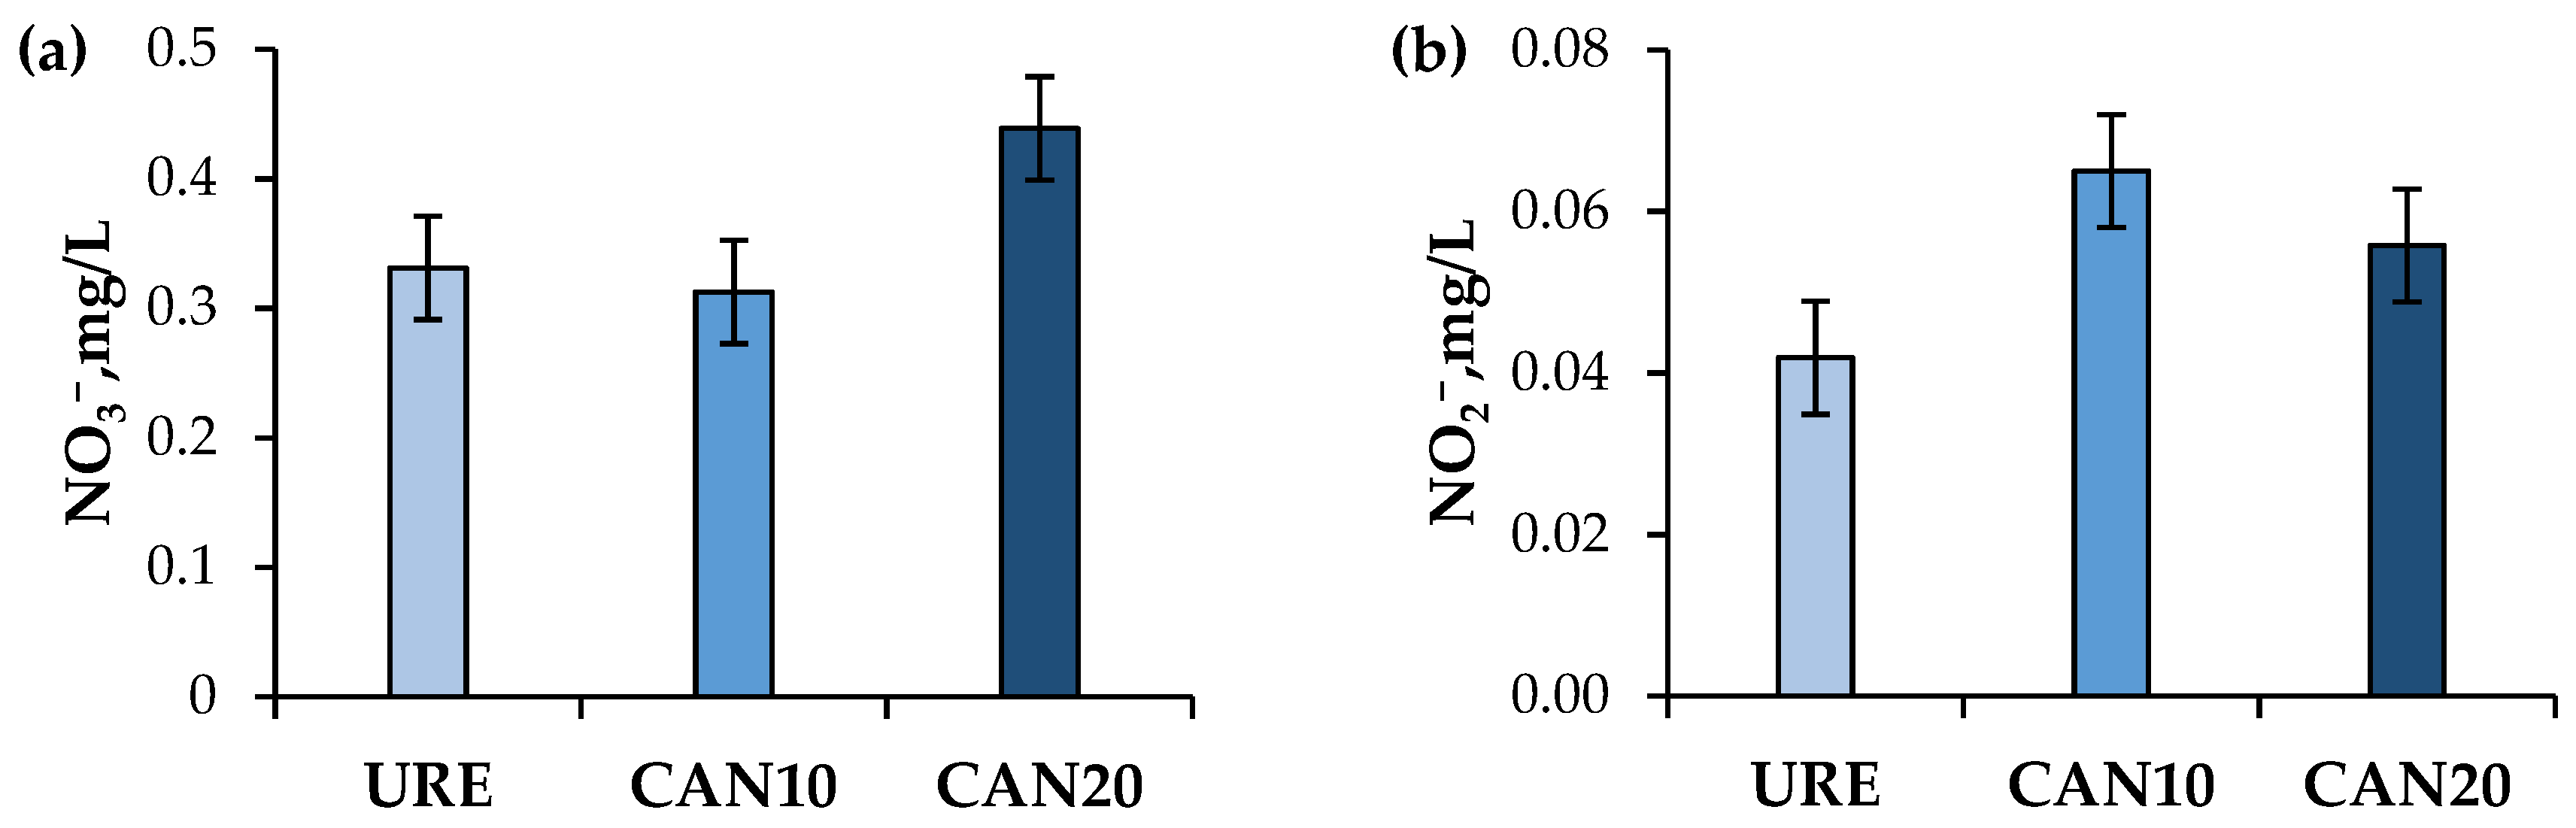
3.2. Yield, Composition, Antioxidant Capacity, and Nitrate and Nitrite Residues in Milk

Feeding CAN to lactating dairy goats did not affect the yields of milk, 3.5% FCM, and ECM, with means of 2.10, 2.03, and 1.97 kg/day, respectively (Table 3). Likewise, FE was similar between treatments. Additionally, treatment had no effect on the concentrations (%) or yields (kg/d) of fat, true protein, and lactose (Table 3).
Treatment did not affect the TAC of milk (average = 203.1 μM of Trolox equivalent/mL), whereas TBARS concentration linearly reduced (p < 0.01) as the levels of CAN increased. In contrast, the concentration of CD in milk linearly increased (p = 0.02) according to the increment of CAN in the diet, while no treatment effect was observed on MUN concentration. Somatic cell count and Log10 SCC were not affected by treatment (Table 3).
Concentration of NO3 residue in milk linearly increased (p < 0.01; URE = 0.33 mg/L vs. CAN10 = 0.31 mg/L vs. CAN20 = 0.44 mg/L; Figure 1a) with CAN supplementation, while a quadratic response (p = 0.03) was observed on the concentration of NO2 in milk, with the maximum concentration for CAN10 (0.065 mg/L), followed by CAN20 (0.056 mg/L), and URE (0.042 mg/L), as shown in Figure 1b.
Dietary CAN did not affect the proportions of most saturated FA (SFA; 6:0, 8:0, 10:0, 13:0, 14:0, 15:0, 16:0, 18:0, 20:0) and monounsaturated FA (MUFA; 14:1, 15:1, 16:1, 17:1; Table 4). Additionally, there were no treatment effects on individual polyunsaturated FA (PUFA; trans-6 18:2, cis-6 18:2, cis-9-trans-11 CLA), while linear trends were observed for FA proportions of 11:0 (p = 0.08) and 17:0 (p = 0.09). The milk FA proportion of 12:0 was reduced (p = 0.04; linear effect), whereas trans-9 18:1 (p = 0.03) linearly increased. Total SFA, MUFA, and PUFA were not affected by CAN supplementation (Table 4).
Concentration of PUN presented a quadratic response (p = 0.02) by supplemental CAN and a linear increase (p < 0.01) over time, with the greatest levels observed after 4 h of the morning feeding; however, no interactions were observed between CAN versus time (Figure 2).
There were no interactions (data not shown) between the treatment and collection time (2 and 8 h after the morning feeding) for all ruminal fermentation parameters. Therefore, time of collection was not considered for the final presentation of results.
Supplemental CAN did not affect the ruminal pH, NH3-N, and Total VFA, with means of 7.2, 15.3 mM, and 52.3 mM, respectively (Table 5). Similarly, there were no treatment effects on the proportions of acetate, isobutyrate, butyrate, and isovalerate, whereas propionate proportion linearly decreased (p = 0.01) and acetate:propionate ratio linearly increased (p < 0.01; Table 5).

4. Discussion

4.1. Feed Intake and Nutrient Digestibility

We evaluated the supplementation of CAN (up to 20 g/kg on a DM basis) to lactating dairy goats and observed no treatment effects on DMI. According to Lee and Beauchemin [7], nitrate has a bitter taste, which might negatively affect feed intake in ruminants. Such effects were previously observed by De Raphélis-Soissan et al. [18] in sheep by supplementing 31 g of calcium-ammonium nitrate (~20 g/kg of NO3 on DM basis) compared to urea. In contrast, corroborating our findings, others have observed no effects on DMI of dairy cows by supplementing CAN up to 27.9 g/kg of DM [11] or when feeding sodium nitrate (14.6 g on DM basis) as a urea replacer in low protein diets [2]. In the present study, the treatment was gradually included in the diet during the adaptation period and provided as a TMR to avoid sorting, which could partially explain the absence of effects on DMI. In addition, another reason is that the availability of NO3 toward the rumen in both treatments (CAN10 = 7.65 g of NO3 and CAN20 = 15.30 g of NO3) was relatively lower when compared to studies with small ruminants that observed the effects of NO3 on DMI [18,36].
Supplemental CAN caused only minor effects on nutrient digestibility, evidenced by quadratic trends on DM, OM, and CP. A previous in vitro study of Zhou et al. [37] showed that higher levels of supplemental NO3 (~48 g/kg on a DM basis) reduced cellulolytic bacteria population, which may cause negative effects on NDF digestibility. We believe that the level of NO3 used in our study (up to 15.30 g of NO3 on DM basis), included gradually in the diet during an adaptation period of 14 days, was appropriate to avoid negative effects on ruminal microbiota, validated by the absence of treatment effects on DMI. Corroborating our findings, others observed no effects of supplemental CAN (up to 27.9 g/kg of DM) to lactating dairy cows on DM, OM, CP, and NDF digestibility in the rumen, small intestine, and hindgut [11]. In addition, Wang et al. [2], supplemented sodium nitrate (14.6 g of NO3 on a DM basis) to dairy cows and observed no negative effects on fiber digestibility, supported by the absence of changes in cellulolytic bacteria (Ruminococcus albus, R. flavefaciens, and Fibrobacter succinogenes).

4.2. Milk Quality and Nitrate and Nitrite Residues in Milk

Dietary CAN did not affect any milk performance parameters (milk yield, 3.5% FCM, ECM, or FE). This absence of treatment response is highly related to the also unchanged milk composition in the present study. We can assume that the lack of effects on DMI, nutrient digestibility, and some VFA concentrations (acetate) can be attributable to the non-significant effect observed for milk fat. In addition, our study did not observe the effects on yield and the composition of milk true protein, which may be related as a response to the unchanged DMI. Indeed, previous studies have shown that lower DMI in response to NO3 supplementation may cause negative effects on milk performance because the lower ingestion of nutrients can lead to a lack of gluconeogenic precursors, and consequently, affect the synthesis of milk components [10,12,38]. In line with our findings, Olijhoek et al. [11] demonstrated that supplemental CAN (up to 21.1 g/kg on a DM basis) fed to dairy cows did not change milk yield or ECM, validated by the unchanged DMI.
To our knowledge, the antioxidant capacity of milk from dairy goats supplemented with CAN has not been reported yet in the literature. Overall, TAC was not affected by treatments; however, the concentration of TBARS decreased and CD increased. Conjugated dienes are considered indicators of lipid oxidation, which may influence milk antioxidant capacity as a response to reduced-fat stability [39]. There are many methods (e.g., physical and chemical) for evaluating the oxidative stability of fats. Each method provides information about a particular state of the oxidative process, which depends on the conditions applied and the lipid substrates evaluated. The oxidation of PUFA results in the formation of hydroperoxides and displacement of double bonds, with consequent formation of CD, corresponding to the primary product from the oxidative process [40,41]. The increase in the concentration of CD was also observed earlier [42] by supplementing CAN (up to 30 g/kg of DM) to lactating dairy cows, which seemed to be associated with an initial oxidation process of the milk fat, supported by trends to increase MUFA and PUFA in milk from treated cows [42]. Thus, the supply of CAN, in a way, may have anticipated the beginning of the milk oxidation process. A possible explanation for this effect is that there was increased production of NO in milk as a product from the NO3 to NH3 conversion. It is believed that increased NO, along with NO2, can induce the nitrosative stress of milk fat by accumulating lipid peroxides, and consequently alter the milk antioxidant capacity [43]. Despite the unchanged milk SCC in the present study, milk oxidative stress can also be associated with subclinical mastitis, as observed by Silanikove et al. [43], who also suggested that milk from dairy goats was less susceptible to nitrosative stress than milk from dairy cows because of its increased TAC.
During the lipid peroxidation, compounds such as aldehydes can be formed as secondary products [44]. The nature and relative proportions of aldehydes from degradation processes are highly dependent on the type of FA oxidized and the oxidation conditions. For this evaluation, the most widely used test is the TBARS, which is based on the reaction of thiobarbituric acid with the decomposition products of hydroperoxides. One of the main products formed in the oxidative process is malondialdehyde [41]. The reduction in TBARS concentration with NO3 supplementation in our study may be associated with a positive effect, indicating greater resistance to secondary spoilages and therefore increasing the shelf life of milk products [26]. Additionally, the absence of effects on milk TAC in the present study can also be associated with a positive effect, as this parameter generally provides information about the status of the antioxidant potential of milk, which was previously reported to be higher in dairy goats when compared to the milk from dairy cows [45].
Nitrate residue in milk was higher when the levels of CAN increased, although the maximum concentration observed (0.44 mg/L for 20 g of CAN) was still under the recommendations of the WHO [46] for human consumption, which is limited to 50 mg of NO3/L per day. Corroborating with our results, others have observed low or undetectable NO3 concentration in milk from treated dairy cows [11,12]. Interestingly, the intermediate treatment (CAN10) presented the highest concentration (0.07 mg/L) of NO2 residue in milk. While these findings are difficult to explain, the concentration of 0.07 mg/L is still under the WHO [46] guidelines, which regulates amounts below 3 mg of NO2/L to be accepted for human consumption. Overall, our study provided, for the first time, an outline of NO3 and NO2 residues in milk from treated dairy goats mainly to establish considerations for food safety due to toxicity concerns (e.g., methemoglobinemia in infants), which can be caused by the ingestion of high levels of NO2 from food or water [47]. These findings suggest that despite the presence of NO3 and NO2 residues in the milk, its consumption should not be a concern for food safety; however, as mentioned previously, milk antioxidant capacity may be affected. Indeed, NO3 exposure is much greater (~91 mg/person) through the daily ingestion of other foods (e.g., vegetables, water, beer) when compared to the consumption of fresh animal products such as milk, comprising about 7% of the total exposure to NO3 residues [48].
To date, there are no previous data evaluating the effects of CAN on milk FA profile from treated dairy goats. Milk FA are generally derived from two main sources: diet and ruminal microbial activity [49]. Changes in the ruminal microbiome might affect milk FA proportions and consequently, the production of milk fat precursors (acetate and butyrate), besides the intermediates of PUFA biohydrogenation in the rumen [50]. However, there is still information needed with regard to the rumen microbial role on milk FA synthesis, especially in goats [51]. The minor response on ruminal fermentation parameters in our study may explain the lack of major effects on milk FA profile. Similar to our results, Klop et al. [16] investigated the effects of dietary NO3 to dairy cows and observed minor effects on milk FA composition. In our study, we observed a decreased propionate production associated with greater acetate:propionate ratio, which may partially explain the minimal treatment effects found on the FA profile. Some FAs are largely derived from rumen bacteria such as odd-chain FA (15:0 and 17:0), which may be formed by the elongation of propionate or valerate [52] that decreased and tended to decrease, respectively, in response to CAN supplementation in our study.
Despite the inconsistency of treatment effects on individual FA (tended to decrease 11:0, decreased 12:0, tended to increase 17:0, increased trans-9 18:1 and 21:0), no treatment effects were observed on the FA groups (SFA, MUFA, and PUFA). This response validates that CAN (up to 20 g/kg DM) does not seem to cause adverse effects to the FA profile when gradually fed to lactating dairy goats.

4.3. Plasma Urea Nitrogen and Ruminal Fermentation Parameters

Supplemental CAN fed at 10 g/kg DM presented the highest concentration of PUN, regardless of the collection time (0 or 4 h after the morning feeding). A suitable explanation for these findings is that providing a lower dose of CAN in the diet (7.65 g/kg NO3 on DM basis) led to faster NO3 reduction to NH3 within the rumen, favoring its absorption through the rumen wall. Conversely, CAN20 seemed to cause a slight reduction in the nitrate-reducing bacteria activity, which likely caused a ruminal NO2 accumulation, and consequently limited NH3 absorption into the bloodstream. Theoretically, the reduction of NO2 to NH3 is much slower than the reduction of NO3 to NO2, which may cause the accumulation of NO2 and other intermediates in the rumen, depending on the balance of enzyme activities [3,53].
The concentration of ruminal NH3–N was similar regardless of the treatment, which may be considered as a positive effect, assuming no lack of substrate toward the microbial protein synthesis either by feeding CAN or urea. As mentioned previously, the nitrate-ammonia reduction occurs in two steps in the rumen, whereby NO3 is converted to NO2 rapidly because of higher thermodynamic energy, and subsequently NO2 is converted to NH3–N [5]. Despite the confounding effect of lower PUN concentration for CAN20, attributed to a slower nitrate-reducing bacteria activity, it seemed that potential toxic effects to the rumen microbiota were alleviated after a while, considering the different time of collection for blood and rumen fluid, performed at 4 h and 8 h postprandial, respectively. In line with our findings, van Zijderveld et al. [54] did not find any effects on NH3–N concentration by supplementing 34 g/kg of calcium-ammonium nitrate (~25.5 g/kg of NO3 on a DM basis) to growing male lambs.
Calcium-ammonium nitrate supplemented to lactating dairy goats did not affect most ruminal fermentation parameters. As mentioned before, this lack of response is highly related to the absence of secondary effects on nutrient digestibility and milk composition observed in the present study. According to Giger-Reverdin et al. [51], despite the possibility of changes in the rumen environment by switching diets, the ruminal microbiota of goats usually have high stability and resilience, validating the absence of CAN effects on most ruminal fermentation parameters. The reduction in propionate production in our study was also observed by Asanuma et al. [55], along with reductions in acetate and total VFA concentration when potassium nitrate (up to 9 g/day) was fed to male goats. Similar to NO3, propionate is also a methane antagonist because of its hydrogen-sink activity in the rumen. Thus, a competition for ruminal [H] was likely the reason for the decreased propionate production, and consequent greater acetate:propionate ratio, even though no changes were observed in acetate proportion.

5. Conclusions

Calcium-ammonium nitrate has been extensively used as a methane inhibitor for ruminants; however, further studies to investigate its effects on milk quality from treated animals are still warranted. Our results indicated that supplementing CAN (up to 20 g/kg of DM) to lactating dairy goats did not affect feed intake, nutrient digestibility, yields and composition of milk, and most ruminal fermentation parameters. Low concentration of NO3 and NO2 residues in milk supports the importance of using safe levels of CAN preceding an adaptation period to prevent negative effects on production performance. Despite the increased CD concentration, indicating sooner lipid oxidation, supplementing CAN (up to 20 g/kg of DM) to dairy goats should not be a concern considering the unchanged TAC in milk and other parameters of milk quality and ruminal fermentation.

Author Contributions

Conceptualization, K.V.A., G.T.S., F.E.M. and R.C.A.; Methodology, K.V.A., J.A.C.O., J.C.S.L., M.F., T.D., F.E.M. and R.C.S.-J.; Formal analysis, K.V.A., J.A.C.O., J.C.S.L., M.F., T.D., F.E.M. and R.C.S.-J.; Investigation, K.V.A., J.A.C.O., J.C.S.L., M.F., T.D., F.E.M. and R.C.S.-J.; Resources, G.T.S., C.R.A., R.C.A., C.C.B.F.I. and A.F.B.; Data curation, K.V.A., G.T.S. and F.E.M.; Writing—original draft preparation, K.V.A.; Writing—review and editing, K.V.A., G.T.S., F.E.M., R.C.A., C.C.B.F.I. and A.F.B.; Supervision, G.T.S., F.E.M. and C.R.A.; Project administration, G.T.S. All authors have read and agreed to the published version of the manuscript.

Funding

This research was funded by the “Conselho Nacional de Desenvolvimento Científico e Tecnológico (CNPq, Brasília, Brazil)”, grant number 405.689/2016-0.

Institutional Review Board Statement

This study was conducted according to the guidelines of the Animal Care Ethics Committee of the State University of Maringa (protocol 9512221018).

Informed Consent Statement

Not applicable.

Data Availability Statement

The data presented in this study are available on request from the corresponding author.

Acknowledgments

The authors thank the “Coordenação de Aperfeiçoamento de Pessoal de Nível Superior (CAPES, Brasília, Brazil)” for granting the scholarship to the first author (finance code 001), GRASP (Curitiba, Brazil) for providing the supplies used in the study, members of the study group “Núcleo de pesquisa e estudo em pecuária leiteira (NUPEL, Maringá, Brazil; Jakeline F. Cabral, Micheli R. Sippert, and Karoline L. G. Yamada)” for their support during the experiment, and all collaborators of the goat unit of the State University of Maringa (Maringa, Brazil).

Conflicts of Interest

The authors declare no conflict of interest. We also confirm that there are no relevant financial or non-financial competing interests to report.

References

  1. Feng, X.Y.; Dijkstra, J.; Bannink, A.; van Gastelen, S.; France, J.; Kebreab, E. Antimethanogenic effects of nitrate supplementation in cattle: A meta-analysis. J. Dairy Sci. 2020, 103, 11375–11385. [Google Scholar] [CrossRef] [PubMed]
  2. Wang, R.; Wang, M.; Ungerfeld, E.M.; Zhang, X.M.; Long, D.L.; Mao, H.X.; Deng, J.P.; Bannink, A.; Tan, Z.L. Nitrate improves ammonia incorporation into rumen microbial protein in lactating dairy cows fed a low-protein diet. J. Dairy Sci. 2018, 101, 9789–9799. [Google Scholar] [CrossRef] [PubMed] [Green Version]
  3. Leng, R.A. The potential of feeding nitrate to reduce enteric methane production in ruminants. In A Report to The Department of Climate Change; Commonwealth Government of Australia: Canberra, Australia, 2008; pp. 1–90. [Google Scholar]
  4. Popova, M.; Guyader, J.; Silberberg, M.; Seradj, A.R.; Saro, C.; Bernard, A.; Gérard, C.; Martin, C.; Morgavi, D.P. Changes in the Rumen Microbiota of Cows in Response to Dietary Supplementation with Nitrate, Linseed, and Saponin Alone or in Combination. Appl. Environ. Microbiol. 2019, 85, e02657-18. [Google Scholar] [CrossRef] [PubMed] [Green Version]
  5. Latham, E.A.; Anderson, R.C.; Pinchak, W.E.; Nisbet, D.J. Insights on alterations to the rumen ecosystem by nitrate and nitrocompounds. Front. Microbiol. 2016, 7, 1–15. [Google Scholar] [CrossRef] [Green Version]
  6. Torres, M.J.; Simon, J.; Rowley, G.; Bedmar, E.J.; Richardson, D.J.; Gates, A.J.; Delgado, M.J. Nitrous Oxide Metabolism in Nitrate-Reducing Bacteria: Physiology and Regulatory Mechanisms, 1st ed.; Elsevier Ltd.: Amsterdam, The Netherlands, 2016; Volume 68, ISBN 9780128048238. [Google Scholar]
  7. Lee, C.; Beauchemin, K.A. A review of feeding supplementary nitrate to ruminant animals: Nitrate toxicity, methane emissions, and production performance. Can. J. Anim. Sci. 2014, 94, 557–570. [Google Scholar] [CrossRef]
  8. Beauchemin, K.A.; Ungerfeld, E.M.; Eckard, R.J.; Wang, M. Review: Fifty years of research on rumen methanogenesis: Lessons learned and future challenges for mitigation. Animal 2020, 14, S2–S16. [Google Scholar] [CrossRef] [Green Version]
  9. Villar, M.L.; Godwin, I.R.; Hegarty, R.S.; Erler, D.V.; Farid, H.T.; Nolan, J.V. Nitrate and nitrite absorption, recycling and retention in tissues of sheep. Small Rumin. Res. 2021, 200, 106392. [Google Scholar] [CrossRef]
  10. Guyader, J.; Doreau, M.; Morgavi, D.P.; Gérard, C.; Loncke, C.; Martin, C. Long-term effect of linseed plus nitrate fed to dairy cows on enteric methane emission and nitrate and nitrite residuals in milk. Animal 2016, 10, 1173–1181. [Google Scholar] [CrossRef] [Green Version]
  11. Olijhoek, D.W.; Hellwing, A.L.F.; Brask, M.; Weisbjerg, M.R.; Højberg, O.; Larsen, M.K.; Dijkstra, J.; Erlandsen, E.J.; Lund, P. Effect of dietary nitrate level on enteric methane production, hydrogen emission, rumen fermentation, and nutrient digestibility in dairy cows. J. Dairy Sci. 2016, 99, 6191–6205. [Google Scholar] [CrossRef] [Green Version]
  12. Meller, R.A.; Wenner, B.A.; Ashworth, J.; Gehman, A.M.; Lakritz, J.; Firkins, J.L. Potential roles of nitrate and live yeast culture in suppressing methane emission and influencing ruminal fermentation, digestibility, and milk production in lactating Jersey cows. J. Dairy Sci. 2019, 102, 6144–6156. [Google Scholar] [CrossRef]
  13. Clark, S.; Mora García, M.B. A 100-Year Review: Advances in goat milk research. J. Dairy Sci. 2017, 100, 10026–10044. [Google Scholar] [CrossRef]
  14. Silanikove, N.; Fira, S.; Mayan, S.; Uzi, M.; Gabriel, L. Hydrogen peroxide-dependent conversion of nitrite to nitrate as a crucial feature of bovine milk catalase. J. Agric. Food Chem. 2009, 57, 8018–8025. [Google Scholar] [CrossRef]
  15. Silanikove, N.; Rauch-Cohen, A.; Shapiro, F.; Arieli, A.; Merin, U.; Leitner, G. Lipopolysaccharide challenge of the mammary gland in cows induces nitrosative stress that impairs milk oxidative stability. Animal 2012, 6, 1451–1459. [Google Scholar] [CrossRef] [Green Version]
  16. Klop, G.; Hatew, B.; Bannink, A.; Dijkstra, J. Feeding nitrate and docosahexaenoic acid affects enteric methane production and milk fatty acid composition in lactating dairy cows. J. Dairy Sci. 2016, 99, 1161–1172. [Google Scholar] [CrossRef] [Green Version]
  17. Villar, M.L.; Hegarty, R.S.; Nolan, J.V.; Godwin, I.R.; McPhee, M. The effect of dietary nitrate and canola oil alone or in combination on fermentation, digesta kinetics and methane emissions from cattle. Anim. Feed Sci. Technol. 2020, 259, 114294. [Google Scholar] [CrossRef]
  18. De Raphélis-Soissan, V.; Li, L.; Godwin, I.R.; Barnett, M.C.; Perdok, H.B.; Hegarty, R.S. Use of nitrate and Propionibacterium acidipropionici to reduce methane emissions and increase wool growth of Merino sheep. Anim. Prod. Sci. 2014, 54, 1860–1866. [Google Scholar] [CrossRef]
  19. NRC. Nutrient Requirements of Small Ruminants: Sheep, Goats, Cervids, and New World Camelids; The National Academies Press: Washington, DC, USA, 2007; p. 384. [Google Scholar]
  20. AOAC International. Official Methods of Analysis, 19th ed.; AOAC Int.: Arlington, VA, USA, 2012. [Google Scholar]
  21. Cochran, R.C.; Adams, D.C.; Wallace, J.D. Predicting digestibility of different diets with internal markers: Evaluation of four potential markers. J. Anim. Sci. 1986, 63, 1476–1483. [Google Scholar] [CrossRef]
  22. De Andrade, P.V.D.; De Souza, M.R.; Penna, C.F.A.D.M.; Ferreira, J.M. Características microbiológicas e físico- químicas do leite de cabra submetido à pasteurização lenta pós-envase e ao congelamento. Cienc. Rural 2008, 38, 1424–1430. [Google Scholar] [CrossRef] [Green Version]
  23. Arcuri, E.F.; da Silva, P.D.L.; Brito, J.R.F.; Silva, M.R.; Souza, G.N. Emprego do Somacount 300, calibrado com leite de vaca, na contagem de células somáticas no leite de cabra. Ciência Rural 2004, 34, 1497–1500. [Google Scholar] [CrossRef]
  24. Sklan, D.; Ashkenazi, R.; Braun, A.; Devorin, A.; Tabori, K. Fatty Acids, Calcium Soaps of Fatty Acids, and Cottonseeds Fed to High Yielding Cows. J. Dairy Sci. 1992, 75, 2463–2472. [Google Scholar] [CrossRef]
  25. Sjaunja, L.O.; Bævre, L.; Junkkarinen, L.; Pedersen, J.; Setälä, J. A nordic proposal for an energy corrected milk (ECM) formula. Perform. Rec. Anim. State Art 1990, 1990, 156–157. [Google Scholar]
  26. Kiokias, S.N.; Dimakou, C.P.; Tsaprouni, I.V.; Oreopoulou, V. Effect of compositional factors against the thermal oxidative deterioration of novel food emulsions. Food Biophys. 2006, 1, 115–123. [Google Scholar] [CrossRef]
  27. Vyncke, W. Direct determination of the thiobarbituric acid value in trichoracetic acid extracts of fish as a measure of oxidative rancidity. Fette Seifen Anstrichm. 1970, 72, 1084–1087. [Google Scholar] [CrossRef]
  28. Osorio, J.A.C.; Daniel, J.L.P.; Cabral, J.F.; Almeida, K.V.; Guimarães, K.L.; Sippert, M.R.; Lourenço, J.C.S.; De Marchi, F.E.; Velho, J.P.; Santos, G.T. Annatto seeds as antioxidants source with linseed oil for dairy cows. Animals 2021, 11, 1465. [Google Scholar] [CrossRef]
  29. Nenadis, N.; Wang, L.F.; Tsimidou, M.; Zhang, H.Y. Estimation of scavenging activity of phenolic compounds using the ABTS.+ assay. J. Agric. Food Chem. 2004, 52, 4669–4674. [Google Scholar] [CrossRef]
  30. Cortas, N.K.; Wakid, N.W. Determination of inorganic nitrate in serum and urine by a kinetic cadmium-reduction method. Clin. Chem. 1990, 36, 1440–1443. [Google Scholar] [CrossRef]
  31. Murphy, J.J.; Connolly, J.F.; McNeill, G.P. Effects on milk fat composition and cow performance of feeding concentrates containing full fat rapeseed and maize distillers grains on grass-silage based diets. Livest. Prod. Sci. 1995, 44, 1–11. [Google Scholar] [CrossRef]
  32. ISO 5509; ISO Animal and Vegetable Fats and Oils—Preparation of Methyl Esters of Fatty Acids. International Organization for Standardization: Geneva, Switzerland, 1978; Volume 2000, pp. 1–6.
  33. Broderick, G.A.; Kang, J.H. Automated Simultaneous Determination of Ammonia and Total Amino Acids in Ruminal Fluid and In Vitro Media. J. Dairy Sci. 1980, 63, 64–75. [Google Scholar] [CrossRef]
  34. Cox, G.E.P.; Box, D.R. An analysis of transformations revisited. J. R. Stat. Soc. 1964, 26, 211–252. [Google Scholar]
  35. Jorgensen, E.; Pedersen, A.R. How to obtain those nasty standard errors from transformed data—And why they should not be used. Biometry Res. Unit Dan. Inst. Agric. Sci. 1998, 7, 1–20. [Google Scholar]
  36. Silveira, R.F.; Fernandes, M.H.M.R.; Almeida, A.K.; Araujo, R.C.; Biagioli, B.; Lima, A.R.C.; Teixeira, I.A.M.A.; Resende, K.T. Energy partition and nitrogen utilization by male goats fed encapsulated calcium nitrate as a replacement for soybean meal. Anim. Feed Sci. Technol. 2019, 248, 67–76. [Google Scholar] [CrossRef]
  37. Zhou, Z.; Yu, Z.; Meng, Q. Effects of nitrate on methane production, fermentation, and microbial populations in in vitro ruminal cultures. Bioresour. Technol. 2012, 103, 173–179. [Google Scholar] [CrossRef] [PubMed]
  38. van Zijderveld, S.M.; Gerrits, W.J.J.; Dijkstra, J.; Newbold, J.R.; Hulshof, R.B.A.; Perdok, H.B. Persistency of methane mitigation by dietary nitrate supplementation in dairy cows. J. Dairy Sci. 2011, 94, 4028–4038. [Google Scholar] [CrossRef]
  39. Guillén, M.D.; Cabo, N. Fourier transform infrared spectra data versus peroxide and anisidine values to determine oxidative stability of edible oils. Food Chem. 2002, 77, 503–510. [Google Scholar] [CrossRef]
  40. Hamilton, R.J.; Rossell, J.B.; Hudson, B.J.F.; Löliger, J. Chemistry of rancidity in foods. In Chemistry of Rancidity in Foods; Allen, J.C., Hamilton, R.J., Eds.; Applied Science Publishers Ltd.: London, UK, 1983. [Google Scholar]
  41. Jadhav, S.J.; Nimbalkar, S.S.; Kulkarni, A.D. Lipid Oxidation in Biological and Food Systems. In Food Antioxidants: Technological, Toxicological, and Health Perspectives; Madhavi, D.L., Deshpande, S.S., Salunkhe, D.K., Eds.; CRC Press: New York, NY, USA, 1996. [Google Scholar]
  42. Almeida, K.V.; Santos, G.T.; Daniel, J.L.P.; Osorio, J.A.C.; Yamada, K.L.G.; Sippert, M.R.; Cabral, J.F.; Marchi, F.E.; Araujo, R.C.; Vyas, D. Effects of calcium ammonium nitrate fed to dairy cows on nutrient intake and digestibility, milk quality, microbial protein synthesis, and ruminal fermentation parameters. J. Dairy Sci. 2022, 105, 2228–2241. [Google Scholar] [CrossRef]
  43. Silanikove, N.; Merin, U.; Shapiro, F.; Leitner, G. Subclinical mastitis in goats is associated with upregulation of nitric oxide-derived oxidative stress that causes reduction of milk antioxidative properties and impairment of its quality. J. Dairy Sci. 2014, 97, 3449–3455. [Google Scholar] [CrossRef]
  44. Ayala, A.; Muñoz, M.F.; Argüelles, S. Lipid peroxidation: Production, metabolism, and signaling mechanisms of malondialdehyde and 4-hydroxy-2-nonenal. Oxid. Med. Cell. Longev. 2014, 2014, 360438. [Google Scholar] [CrossRef]
  45. Beghelli, D.; Lupidi, G.; Damiano, S.; Cavallucci, C.; Bistoni, O.; De Cosmo, A.; Polidori, P. Rapid Assay to Evaluate the Total Antioxidant Capacity in Donkey Milk and in more Common Animal Milk for Human Consumption. Austin Food Sci. 2016, 1, 1003. [Google Scholar]
  46. WHO. Chemical Fact Sheets, 4th ed.; World Health Organization: Geneva, Switzerland, 2011. [Google Scholar]
  47. Hord, N.G.; Ghannam, J.S.; Garg, H.K.; Berens, P.D.; Bryan, N.S. Nitrate and Nitrite Content of Human, Formula, Bovine, and Soy Milks: Implications for Dietary Nitrite and Nitrate Recommendations. Breastfeed. Med. 2011, 6, 393–399. [Google Scholar] [CrossRef]
  48. Cockburn, A.; Brambilla, G.; Fernández-Cruz, M.L.; Arcella, D.; Bordajandi, L.R.; Cottrill, B.; van Peteghem, C.; Dorne, J. Lou Nitrite in feed: From animal health to human health. Toxicol. Appl. Pharmacol. 2013, 270, 209–217. [Google Scholar] [CrossRef]
  49. Parodi, P.W. Milk fat in human nutrition. Aust. J. Dairy Technol. 2004, 59, 3–59. [Google Scholar]
  50. Lindmark Månsson, H. Fatty acids in bovine milk fat. Food Nutr. Res. 2008, 52, 5–8. [Google Scholar] [CrossRef] [PubMed] [Green Version]
  51. Giger-Reverdin, S.; Domange, C.; Broudiscou, L.P.; Sauvant, D.; Berthelot, V. Rumen function in goats, an example of adaptive capacity. J. Dairy Res. 2020, 87, 45–51. [Google Scholar] [CrossRef] [Green Version]
  52. Fievez, V.; Colman, E.; Stefanov, I.; Vlaeminck, B. Milk odd- and branched-chain fatty acids as biomarkers of rumen function—An update. Anim. Feed Sci. Technol. 2012, 172, 51–65. [Google Scholar] [CrossRef]
  53. Yang, C.; McKain, N.; McCartney, C.A.; Wallace, R.J. Consequences of inhibiting methanogenesis on the biohydrogenation of fatty acids in bovine ruminal digesta. Anim. Feed Sci. Technol. 2019, 254, 114189. [Google Scholar] [CrossRef]
  54. Van Zijderveld, S.M.; Gerrits, W.J.J.; Apajalahti, J.A.; Newbold, J.R.; Dijkstra, J.; Leng, R.A.; Perdok, H.B. Nitrate and sulfate: Effective alternative hydrogen sinks for mitigation of ruminal methane production in sheep. J. Dairy Sci. 2010, 93, 5856–5866. [Google Scholar] [CrossRef] [Green Version]
  55. Asanuma, N.; Yokoyama, S.; Hino, T. Effects of nitrate addition to a diet on fermentation and microbial populations in the rumen of goats, with special reference to Selenomonas ruminantium having the ability to reduce nitrate and nitrite. Anim. Sci. J. 2015, 86, 378–384. [Google Scholar] [CrossRef]
Figure 1. Effects of calcium-ammonium nitrate (CAN) fed to lactating dairy goats on (a) concentration of nitrate (NO3) in milk (p-value: linear = 0.01; quadratic = 0.05; SEM = 0.042) and (b) concentration of nitrite (NO2) in milk (p-value: linear = 0.11; quadratic = 0.04; SEM = 0.007).
Animals 12 00983 g001
Figure 2. Effects of calcium-ammonium nitrate (CAN) fed to lactating dairy goats on plasma urea nitrogen (PUN) before (0 h) and after (4 h) the morning feeding (p-value: treatment = 0.07; time = 0.01; treatment × time = 0.37; SEM = 1.959).
Animals 12 00983 g002
Table 1. Ingredient proportion and nutritional composition of the experimental diets.
ItemTreatment 1
URECAN10CAN20
Ingredient proportion, g/kg DM
 Corn silage450450450
 Ground corn382381381
 Soybean meal139139139
 Urea 27.323.660.00
 Calcium-ammonium nitrate 30.0010.020.0
 Limestone 411.55.770.00
 Mineral supplement 510.010.010.0
Nutritional composition, g/kg DM 6
 Dry matter, as-fed basis505504504
 Organic matter944941939
 Crude protein160160160
 Rumen degradable protein107107107
 Neutral detergent fiber299299299
 Ether extract 32.332.332.3
 Nitrate0.007.6515.3
1 URE = 7.32 g of urea/kg of DM as a control group (without nitrate); CAN10 = 10 g of calcium-ammonium nitrate (CAN)/kg of DM; CAN20 = 20 g of CAN/kg of DM. 2 Prote-N, 99.5% DM and 41.7% N on a DM basis (GRASP Ind. & Com. LTDA; Curitiba, Brazil). 3 Double salt of calcium-ammonium nitrate decahydrate [5Ca(NO3)2∙NH4NO3∙10H2O], 85.0% DM; 16.5% N, 19.6% Ca, and 76.5% NO3 on a DM basis (Yara; Olso, Norway). 4 Composition (per kg of product): 340 g of Ca and 40 g of Mg. 5 Composition (per kg of product): 150 g Ca, 60 g P, 50 g S, 5 g Mg, 136 g Na, 90 mg Co, 150 mg Cu, 180 mg I, 400 mg Mn, 13 mg Se, and 3000 mg Zn. 6 Unless otherwise stated.
Table 2. Effects of calcium-ammonium nitrate (CAN) fed to lactating dairy goats on body weight, dry matter intake, and apparent digestibility of nutrients.
ItemTreatment 1SEMp-Value 2
URECAN10CAN20LinQuad
BW, kg53.253.353.01.8330.810.73
DMI, kg/d1.731.781.760.0590.330.21
Digestibility, g/kg DM
 DM58961855320.930.230.08
 OM60963557420.270.230.09
 CP59164961319.890.440.06
 EE71072868516.210.260.13
 NDF44546041715.680.190.11
1 URE = control group (without nitrate); CAN10 = 10 g of CAN per kg of DM; CAN20 = 20 g of CAN per kg of DM. 2 Lin = linear effect of CAN and Quad = quadratic effect of CAN.
Table 3. Effects of calcium-ammonium nitrate (CAN) fed to lactating dairy goats on milk production, composition, yield, and antioxidant capacity.
ItemTreatment 9SEMp-Value 10
URECAN10CAN20LinQuad
Production, kg/d
 Milk yield2.042.142.130.1230.160.41
 3.5% FCM 11.982.062.050.1450.290.36
 ECM 21.922.001.990.1360.260.40
 FE 31.121.141.140.0760.520.65
Composition, %
 Fat3.263.263.190.1770.480.68
 True protein2.762.732.750.0710.920.61
 Lactose4.094.084.070.0670.700.98
Yield, kg/d
 Fat0.0670.0700.0690.0060.490.39
 True protein0.0560.0580.0590.0030.200.66
 Lactose0.0840.0870.0870.0050.230.37
Antioxidant capacity
 TAC 42022072008.2110.680.14
 TBARS 59.747.007.340.7970.010.06
 CD 647.155.766.04.8980.010.78
MUN 7, mg/dL22.822.423.32.0630.670.55
SCC 8, 1000/mL157021721417666.70.860.37
Log10 SCC2.983.002.890.1430.630.64
1 3.5% Fat-corrected milk [24]; 2 Energy-corrected milk [25]; 3 Feed efficiency = ECM/DMI; 4 Total antioxidant capacity (μM of Trolox equivalent/mL); 5 Thiobarbituric acid reactive substances (mmol of malondialdehyde/kg of fat); 6 Conjugated dienes (mmol/kg of fat); 7 Milk urea nitrogen (mg/dL); 8 Somatic cell count (1000/mL); 9 URE = control group (without nitrate); CAN10 = 10 g of CAN per kg of DM; CAN20 = 20 g of CAN per kg of DM; 10 Lin = linear effect of CAN and Quad = quadratic effect of CAN.
Table 4. Effects of calcium-ammonium nitrate (CAN) fed to lactating dairy goats on milk fatty acid (FA) profile.
Item 1Treatment 5SEMp-Value 6
URECAN10CAN20LinQuad
FA proportions
 6:00.570.500.490.1430.690.87
 8:01.411.321.250.2220.540.98
 10:08.818.618.030.8980.370.80
 11:00.260.220.210.0260.080.44
 12:05.635.304.960.4310.040.99
 13:00.200.180.180.0170.250.48
 14:014.3714.2814.100.3280.340.85
 14:10.880.860.820.0610.310.92
 15:01.261.231.360.0850.340.40
 15:10.260.270.270.0300.880.79
 16:036.836.938.01.2550.120.39
 16:10.620.590.660.0310.210.07
 17:00.780.810.870.0380.090.71
 17:10.150.160.170.0210.490.91
 18:08.279.248.580.6010.560.08
trans-9 18:14.705.375.470.2370.030.33
cis-9 18:1 12.912.212.40.4900.370.33
trans-6 18:2 0.530.520.540.0340.800.74
cis-6 18:2 0.940.940.890.0690.500.74
cis-9, trans-11 CLA0.110.090.140.0550.840.68
 20:00.140.140.140.0060.550.97
 20:20.040.050.050.0080.150.46
 21:00.170.200.300.0480.050.59
FA groups
 SFA 276.877.176.80.5170.920.47
 MUFA 319.619.519.80.5940.750.69
 PUFA 41.591.561.560.1040.780.85
1 g/100 g of total FA; 2 SFA = Saturated fatty acids; 3 MUFA = Monounsaturated fatty acids; 4 PUFA = Polyunsaturated fatty acids; 5 URE = control group (without nitrate); CAN10 = 10 g of CAN per kg of DM; CAN20 = 20 g of CAN per kg of DM; 6 Lin = linear effect of CAN and Quad = quadratic effect of CAN.
Table 5. Effects of calcium-ammonium nitrate (CAN) fed to lactating dairy goats on ruminal pH, NH3-N concentration, and VFA profile.
ItemTreatment 1SEMp-Value 2
URECAN10CAN20LinQuad
pH6.907.177.000.2700.540.13
NH3-N, mM16.015.314.73.7720.770.98
Total VFA, mM49.550.557.06.8850.340.68
Individual VFA, mol/100 mol
 Acetate62.363.165.51.6430.140.62
 Propionate22.721.819.21.7690.010.39
 Isobutyrate0.820.860.710.1280.320.31
 Butyrate12.212.612.91.0000.600.99
 Isovalerate0.850.710.710.0910.140.33
 Valerate1.070.930.850.1130.080.76
Acetate:Propionate2.762.913.610.356<0.010.22
1 URE = control group (without nitrate); CAN10 = 10 g of CAN per kg of DM; CAN20 = 20 g of CAN per kg of DM; 2 Lin = linear effect of CAN and Quad = quadratic effect of CAN.
Publisher’s Note: MDPI stays neutral with regard to jurisdictional claims in published maps and institutional affiliations.

