Review

Enteric Methane Emissions and Animal Performance in Dairy and Beef Cattle Production: Strategies, Opportunities, and Impact of Reducing Emissions

1
College of Agriculture, Environment and Nutrition Sciences, Tuskegee University, Tuskegee, AL 36088, USA
2
Animal Nutrition & Physiology Division, National Institute of Animal Science, Rural Development Administration, Wanju-gun 55365, Jeollabuk-do, Korea
3
Agroecosystem Management Research Unit, USDA/ARS, 354 Filly Hall, Lincoln, NE 68583, USA
*
Author to whom correspondence should be addressed.
Animals 2022, 12(8), 948; https://doi.org/10.3390/ani12080948
Submission received: 18 February 2022 / Revised: 27 March 2022 / Accepted: 29 March 2022 / Published: 7 April 2022
(This article belongs to the Special Issue Advances and Challenges in Tackling Livestock Methane Production)

Abstract

:

Simple Summary

Numerous enteric methane (CH4) mitigation opportunities exist to reduce enteric CH4 and other greenhouse gas emissions per unit of product from ruminants. Research over the past century in genetics, animal health, microbiology, nutrition, and physiology has led to improvements in dairy and beef cattle production. The objectives of this review are to evaluate options that have been demonstrated to mitigate enteric CH4 emissions per unit of products (energy-corrected milk, milk yield, average daily gain, dry matter intake, and gross energy intake) from dairy and beef cattle on a quantitative basis and in a sustained manner, and to integrate approaches in feeding, rumen fermentation profiles, and rumen microbiota changes to emphasize the understanding of these relationships between enteric CH4 emissions and animal productivities.

Abstract

Enteric methane (CH4) emissions produced by microbial fermentation in the rumen resulting in the emission of greenhouse gases (GHG) into the atmosphere. The GHG emissions reduction from the livestock industry can be attained by increasing production efficiency and improving feed efficiency, by lowering the emission intensity of production, or by combining the two. In this work, information was compiled from peer-reviewed studies to analyze CH4 emissions calculated per unit of milk production, energy-corrected milk (ECM), average daily gain (ADG), dry matter intake (DMI), and gross energy intake (GEI), and related emissions to rumen fermentation profiles (volatile fatty acids [VFA], hydrogen [H2]) and microflora activities in the rumen of beef and dairy cattle. For dairy cattle, there was a positive correlation (p < 0.001) between CH4 emissions and DMI (R2 = 0.44), milk production (R2 = 0.37; p < 0.001), ECM (R2 = 0.46), GEI (R2 = 0.50), and acetate/propionate (A/P) ratio (R2 = 0.45). For beef cattle, CH4 emissions were positively correlated (p < 0.05–0.001) with DMI (R2 = 0.37) and GEI (R2 = 0.74). Additionally, the ADG (R2 = 0.19; p < 0.01) and A/P ratio (R2 = 0.15; p < 0.05) were significantly associated with CH4 emission in beef steers. This information may lead to cost-effective methods to reduce enteric CH4 production from cattle. We conclude that enteric CH4 emissions per unit of ECM, GEI, and ADG, as well as rumen fermentation profiles, show great potential for estimating enteric CH4 emissions.

1. Introduction

Ruminant animal production is dependent on the anaerobic microbial ecosystem (including bacteria, archaea, protozoa, and fungi) to ferment and transform human indigestible forages into high-grade dairy and meat products for human consumption. Ruminant animals, however, are major emitters of enteric methane (CH4) due to the microbial breakdown of carbohydrates in the rumen [1,2], representing an unproductive loss of dietary energy [3]. The rumen microbial fermentation process, also referred to as enteric fermentation, produces various gases, including carbon dioxide (CO2) and CH4, as by-products, exhaled or eructated by the ruminant (Table 1). The eructation of gases via belching is important in bloat prevention and a primary route for CH4 emission to the atmosphere [4]. Estimates of the gas production rate in cattle range from less than 0.2 L/min in the fasted animal to 2.0 L/min following feeding [5]. Generally, lower feed quality and higher feed intake lead to higher CH4 emissions [1]. Although feed intake is positively correlated with animal size, growth rate, level of activity, and production (e.g., milk production, wool growth, pregnancy, or work [6]), it also varies among animal types and management practices for individual animal types (e.g., cattle in feedlots or grazing on grassland). From an energy perspective, enteric CH4 emissions associated with rumen fermentation activities result in the loss of 6–12% of gross energy intake (GEI), or 8–14% of the digestible energy intake (DEI) of ruminants [3,7,8], which could, in principle, otherwise be available for animal growth or milk production. Reducing enteric CH4 emissions from cattle would benefit the environment and improve meat and milk production’s efficiency and economic profitability.
Livestock production systems face challenges posed by increasing food demand and environmental issues. When animal productivity is improved through nutrition, feeding management, reproduction, or genetics, CH4 production per unit of meat or milk is reduced [9]. Beauchemin and McGinn [10] estimated that a 20% reduction in CH4 production could allow growing cattle to gain an additional 75 g/d of body weight and 1 L/d more milk yield (MY) from dairy cows. Although total CH4 emissions in cattle fed full mixed rations (TMR) increase with increasing concentrate feed levels [11,12,13,14], emissions per unit of milk produced [15], or emissions per kg of average daily gain (ADG [16]) generally decrease. However, much less evidence exists concerning the effect of dry matter intake (DMI), feed efficiency, rumen fermentation profiles, rumen microbiome changes, and enteric CH4 emissions per unit of ADG or MY (CH4 intensity; g CH4/kg of MY) from dairy and beef cattle, respectively [16,17,18].
Several reviews of enteric CH4 production from cattle have been published [1,16,19,20,21]. Unlike this review, they all focus more on mitigation options than understanding relationships among dietary and rumen properties that lead to CH4 production associated with enteric CH4 emissions factors (Ym; % GEI) and CH4 emissions intensity (product yield [16,20]). This review aims to explain how enteric CH4 emissions are associated with DMI, GEI, ADG, MY, energy-corrected milk (ECM), rumen fermentation rate, and ruminal microbiota changes in dairy and beef cattle fed forage- and grain-based diets. The improved understanding of these relationships between enteric CH4 emissions and animal productivities may provide insights into cost-effective means to reduce enteric CH4 production.

2. Interrelationships between Methane (CH4) Production, Dry Matter Intake (DMI), and Gross Energy Intake (GEI)

In this analysis, a database of several studies examining the effects of mitigation strategies on enteric CH4 emissions per unit of milk production, ADG, DMI, and GEI in dairy cows (Table 2 and Table 3) and beef cattle (Table 4 and Table 5) was created with enteric CH4 emissions per unit of ECM (CH4/kg of ECM) (Table 2 and Table 6) and rumen fermentation parameters (Table 7) are also evaluated. Statistical analyses of the dataset [16,20] included calculations of slopes, correlation coefficients, and regression coefficients using the Proc Corr. procedure (SAS Institute Inc., Cary, NC, USA). A simple regression analysis using Proc Reg in SAS (SAS Institute Inc., Cary, NC, USA) was conducted to evaluate how DMI, GEI, milk production, ADG, and rumen fermentation profiles were related to CH4 emissions from cattle (Figure 1, Figure 2, Figure 3, Figure 4, Figure 5 and Figure 6). An ordinary least squares regression (OLS) was also used to estimate the impacts of animal performance on the enteric CH4 emission in dairy and beef cattle, respectively (Table 3, Table 5, Table 6, Table 7 and Table 8), used in Equation (1):
Y i = β 0 + β 1 X i + ε i
where Yi denotes CH4 production (enteric CH4 emissions) per unit of output from dairy/beef cattlei, Xi is the animal performance of cattlei (such as dry matter intake (DMIi), gross energy intake (GEIi), milk productioni, ADGi, proipionatei, A/Pi). The impact(s) of animal performance on enteric CH4 emissions is/are denoted by β i . In each analysis, a test the null hypothesis that β 1 is zero was evaluated. When the regression analysis was conducted using Table 3 and Table 4, the null hypothesis that animal performance had no impact on enteric CH4 emissions was rejected, as shown in Table 3, Table 4, Table 5, Table 6, Table 7 and Table 8 and Figure 1, Figure 2, Figure 3, Figure 4 and Figure 5. That is to say, CH4 production (g/d) was significantly correlated with the animal performance- DMIi, GEIi, milk productioni, ADGi, propionatei, or A/Pi.
In temperate regions, our estimates of DMI i have an impact on CH4 emissions (18.53 and 18.93 g of CH4/kg DMI for dairy and beef cattle, respectively; Table 2) and were similar to the range of 19.6 to 21.5 g/kg DMI found in previously published studies [73,74,75,76]. This is consistent with both dairy cattle (fed temperate forages) and beef cattle (fed temperate and tropical forages) studies and reported that the relationships between CH4 production and DMI were very similar (CH4 production (g/day) = 20.7 ± 0.28 × DMI (kg/d); R2 = 0.92, p < 0.001) for all three production categories [73]. However, individual determinations of enteric CH4 carried out in respiration chambers found that the average CH4 production for cattle (e.g., Brahman steers) fed tropical grasses ranged from 19.3 to 34.1 g CH4/kg DMI [77], indicating that tropical (C4) grasses contribute to enteric CH4 emissions to a greater extent than temperate (C3) grasses [78]. This is probably due to the difference in dietary composition between typical diets in temperate grasses (high-quality grasses) and tropical grasses (low-quality grasses), and the digestibility of these diets. Previously published studies showed variance in CH4 production values from beef cattle, due to different CH4-measurement methods, age, feed type, cattle breeds, day-to-day variations, individual physiological stage, and metabolic BW [3,6,20,36,73,79,80,81,82]. The model of Chamley et al. [73] also reported that these factors might mutually present an error of ~13.4% in predicting CH4 emissions for individual animals. In the present study, measurements in the above dataset were from lactating Holstein–Friesian, Jersey, and cannulated dairy cows with a high DMI and high CH4 production. The beef dataset consisted of growing/finishing steers or non-lactating heifers with lower BW and DMI and low CH4 production. Data included CH4 measurements from indoor respiration chambers (RC), using the sulfur-hexafluoride (SF6) method, and the GreenFeed method (GF; C-Lock Inc., Rapid City, SD, USA), which may account for some of the variances in the dataset. It should be noted that Hammond et al. [39,83] used RC for the silage study, while the SF6 technique was used for the grazing study. Recently, Min et al. [82] indicated that the three different CH4-measurement methods (RC, SF6, and GF) might be highly variable in the relationship between daily CH4 production and DMI (g/kg DMI). Based on Hammond et al. [68,84], the average estimate of CH4 production (g/d) varied among the three measurement techniques (RC, SF6, and GF).
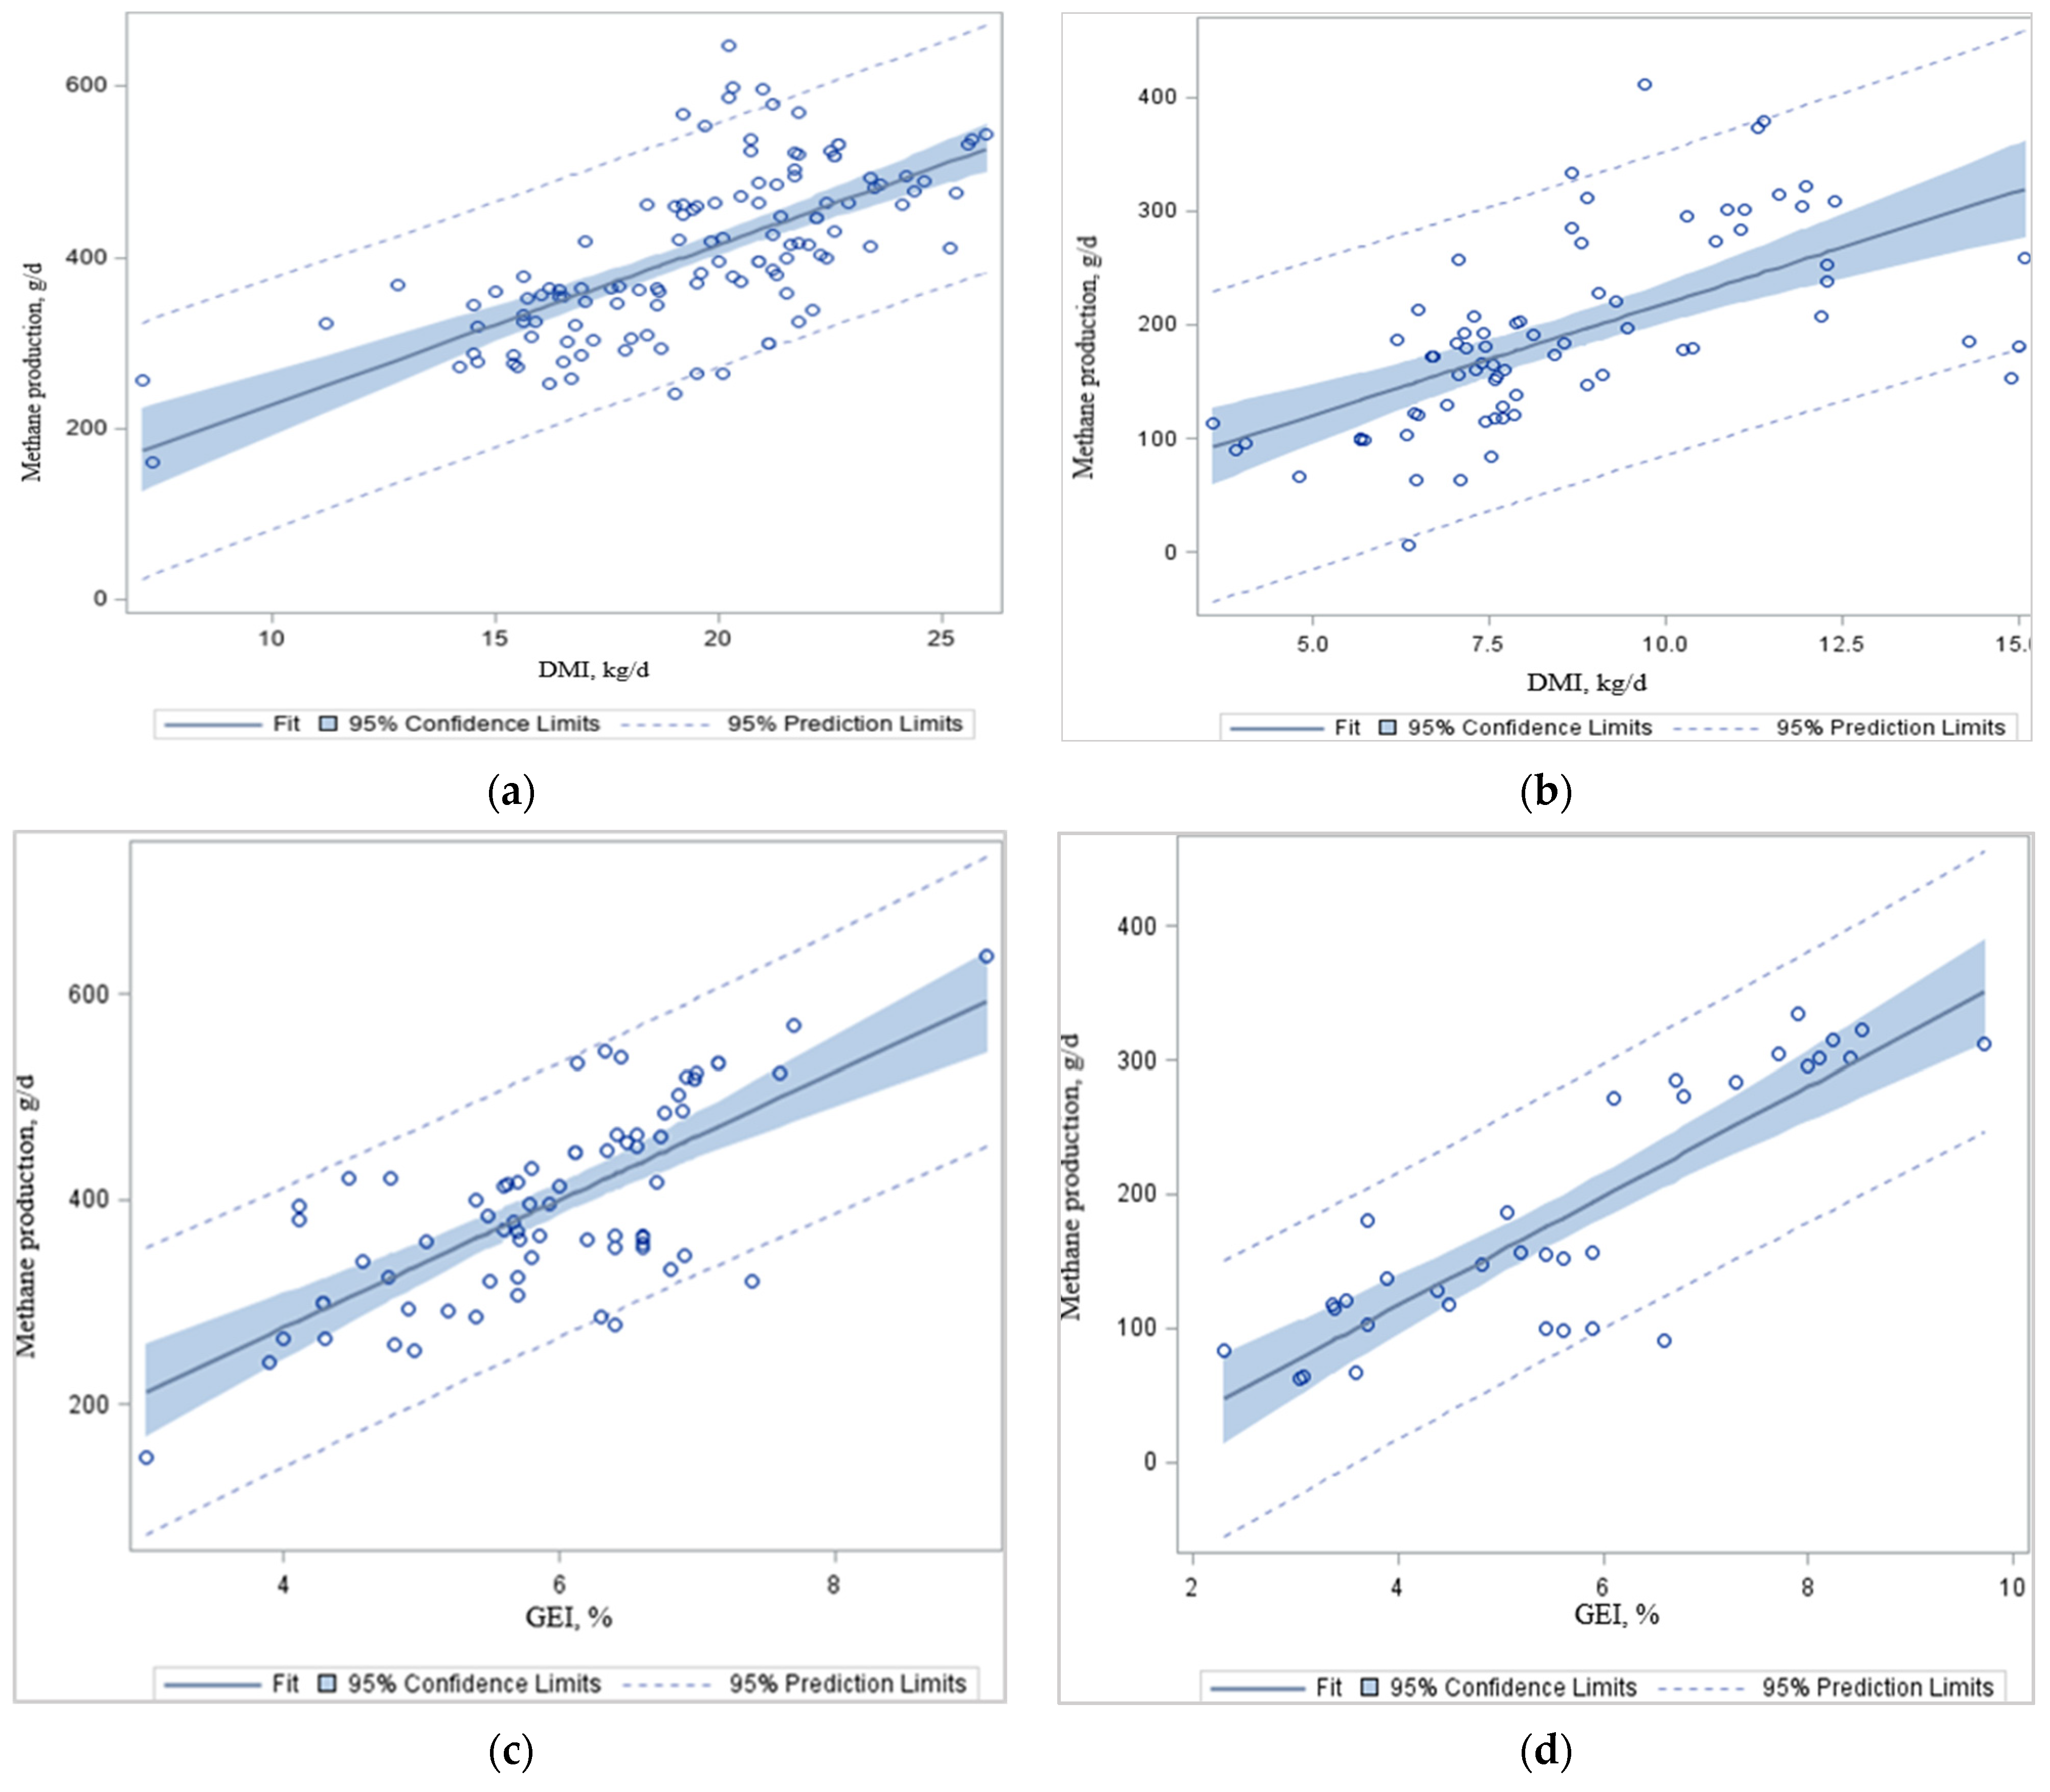
When the regression analysis was conducted using the data in Table 2 and Table 4, CH4 productions (g/d) were significantly correlated with DMIi, and GEIi in dairy and beef cattle (Table 2, Table 3, Table 4 and Table 5 and Figure 1a–d), respectively. In agreement with others, animal feed intake, either as GEI or DMI, had a strong linear relationship with CH4 production: models based on these variables were of comparable accuracy with negligible bias [80,85,86]. In the present analysis, total CH4 production (g/d) increased with increasing DMI (Figure 1a,b) and GEI (Figure 1c,d) in dairy and beef cattle, simply because there was more feed available for rumen fermentation. Johnson and Johnson [3] reported that, for each kg of increase in DMI, there was, on average, a 1.6% decrease of feed gross energy (GE) lost as CH4. One study found a 2.1% reduction in the CH4 conversion factor (Ym; the proportion of the GEI converted to enteric CH4 energy) per kg of DMI increase from dairy cows [87]. Typical ruminant diets contain about 18.4 MJ of GE per kg of DM, and CH4 has an energy content of 55.65 MJ/kg [88]. The IPCC [89] recommends Ym ranges of 3.0 ± 1.0% GEI lost as CH4 for feedlot cattle and 6.5 ± 1.0% GEI lost as CH4 for dairy and other well-fed cattle consuming temperate-climate feed types [89]. However, the Ym does not consider other relevant animal or dietary characteristics that impact CH4 emissions, such as digestibility, rumen fermentation characteristics, nutrient profiles, microbial community structure, diet composition, or cattle management.
The annual global CH4 emission from dairy cows is approximately 18.9 Tg [90], representing a loss of 5.5–6.5% of dietary GEI [91]. However, CH4, as a proportion of DMI or GEI (CH4/kg of GEI), usually decreases as DMI increases above maintenance [69,92,93], and is related to decreased DM digestibility at higher DMI [1]. It has been reported that CH4 production decreases with increasing levels of dietary concentrate fed [94] and can be as low as 3% of GEI [3] for diets with a high proportion (>60%) of concentrate. Metabolizable energy intake (MEI), neutral detergent fiber (NDF), acid detergent fiber (ADF), ether extract, lignin, and forage proportion need to be considered in the development of models to predict CH4 emissions [95]. Although the information on milk production would be relevant to assess the impact of animal performance on CH4 estimates, data on milk production, ADG, rumen fermentation characteristics, and microbiome changes in CH4 studies were insufficient.

3. Enteric Methane (CH4) Emissions, Milk Production, and Average Daily Gain (ADG) in Dairy and Beef Cattle

Numerous studies reported that a close relationship exists between DMI and milk production of dairy cows [96,97,98,99,100], but limited information is available to calculate the relationships between milk production and CH4 emissions in dairy cattle or ADG and CH4 emissions in beef cattle. It has been reported that a linear relationship (R2 = 0.47) exists between DMI and milk production [101,102]. The current analysis confirms a positive relationship (p < 0.01; Figure 2a) between DMI and milk production (Table 5) in dairy cattle (y = 1.31x + 1.34 ± 2.70; R2 = 0.34; p < 0.001). We found that, as DMI increased by 1.0 kg/d, there was a 1.31 kg/d increase in milk production in dairy cattle (Figure 2a). This agrees with Trupa et al. [103], who proposed that, for every 2 kg of milk production, a cow consumes at least 1 kg of DMI (legume hay + concentrate). It has been documented that pasture DMI generally decreases when grazing cows are offered concentrate supplements, whereas total DMI and milk yield increase with concentrate feeding [104]. This analysis confirmed this positive relationship (Table 5; Figure 2a). Min et al. [105] reported that milk production increased by 1.7 and 0.9 kg for each additional kg of concentrate fed per day during the first and second years of lactation by dairy goats, respectively. The same authors reported that improved nutrition leads to an increase in daily milk yield (22%), peak yield (17%), time of peak yield (14 d), and persistency (8%; as the ability of a cow to continue milk production at a high level after the peak yield), compared with control treatment.
For our dataset, we found a positive relationship (Table 6; Figure 2b) between DMI and ADG (kg/d) in beef cattle (y = 0.09x + 2.44 ± 0.98; R2 = 0.50; p < 0.01), whereas DMI increased by 1.0 kg/d, and there were a 0.09 kg/d increase in ADG in beef cattle fed mixed (grazing + feedlot) diets (Figure 2b). Other studies reported that each 1 kg increase in DMI increases ADG by 0.08–0.09 kg/d (silage-based diet) and 0.14–0.16 kg/d (grain-based diet) in finishing cattle [59,60,106]. Along with DMI, intake of dietary energy and protein, or individual carbohydrate and protein contents, environmental stress, ration palatability, and feed processing may be important factors affecting milk and meat production, and require further analyses in the future [103,107]. The dietary energy associated with animal maintenance is about 70–75% in beef cattle and 50% in dairy cattle [105]. The remaining nutritional energy is used to produce meat, milk, or gestation. Thus, as productivity increases, CH4 emissions also increase (Figure 3a,b), but CH4 emissions per unit of product decrease [106].
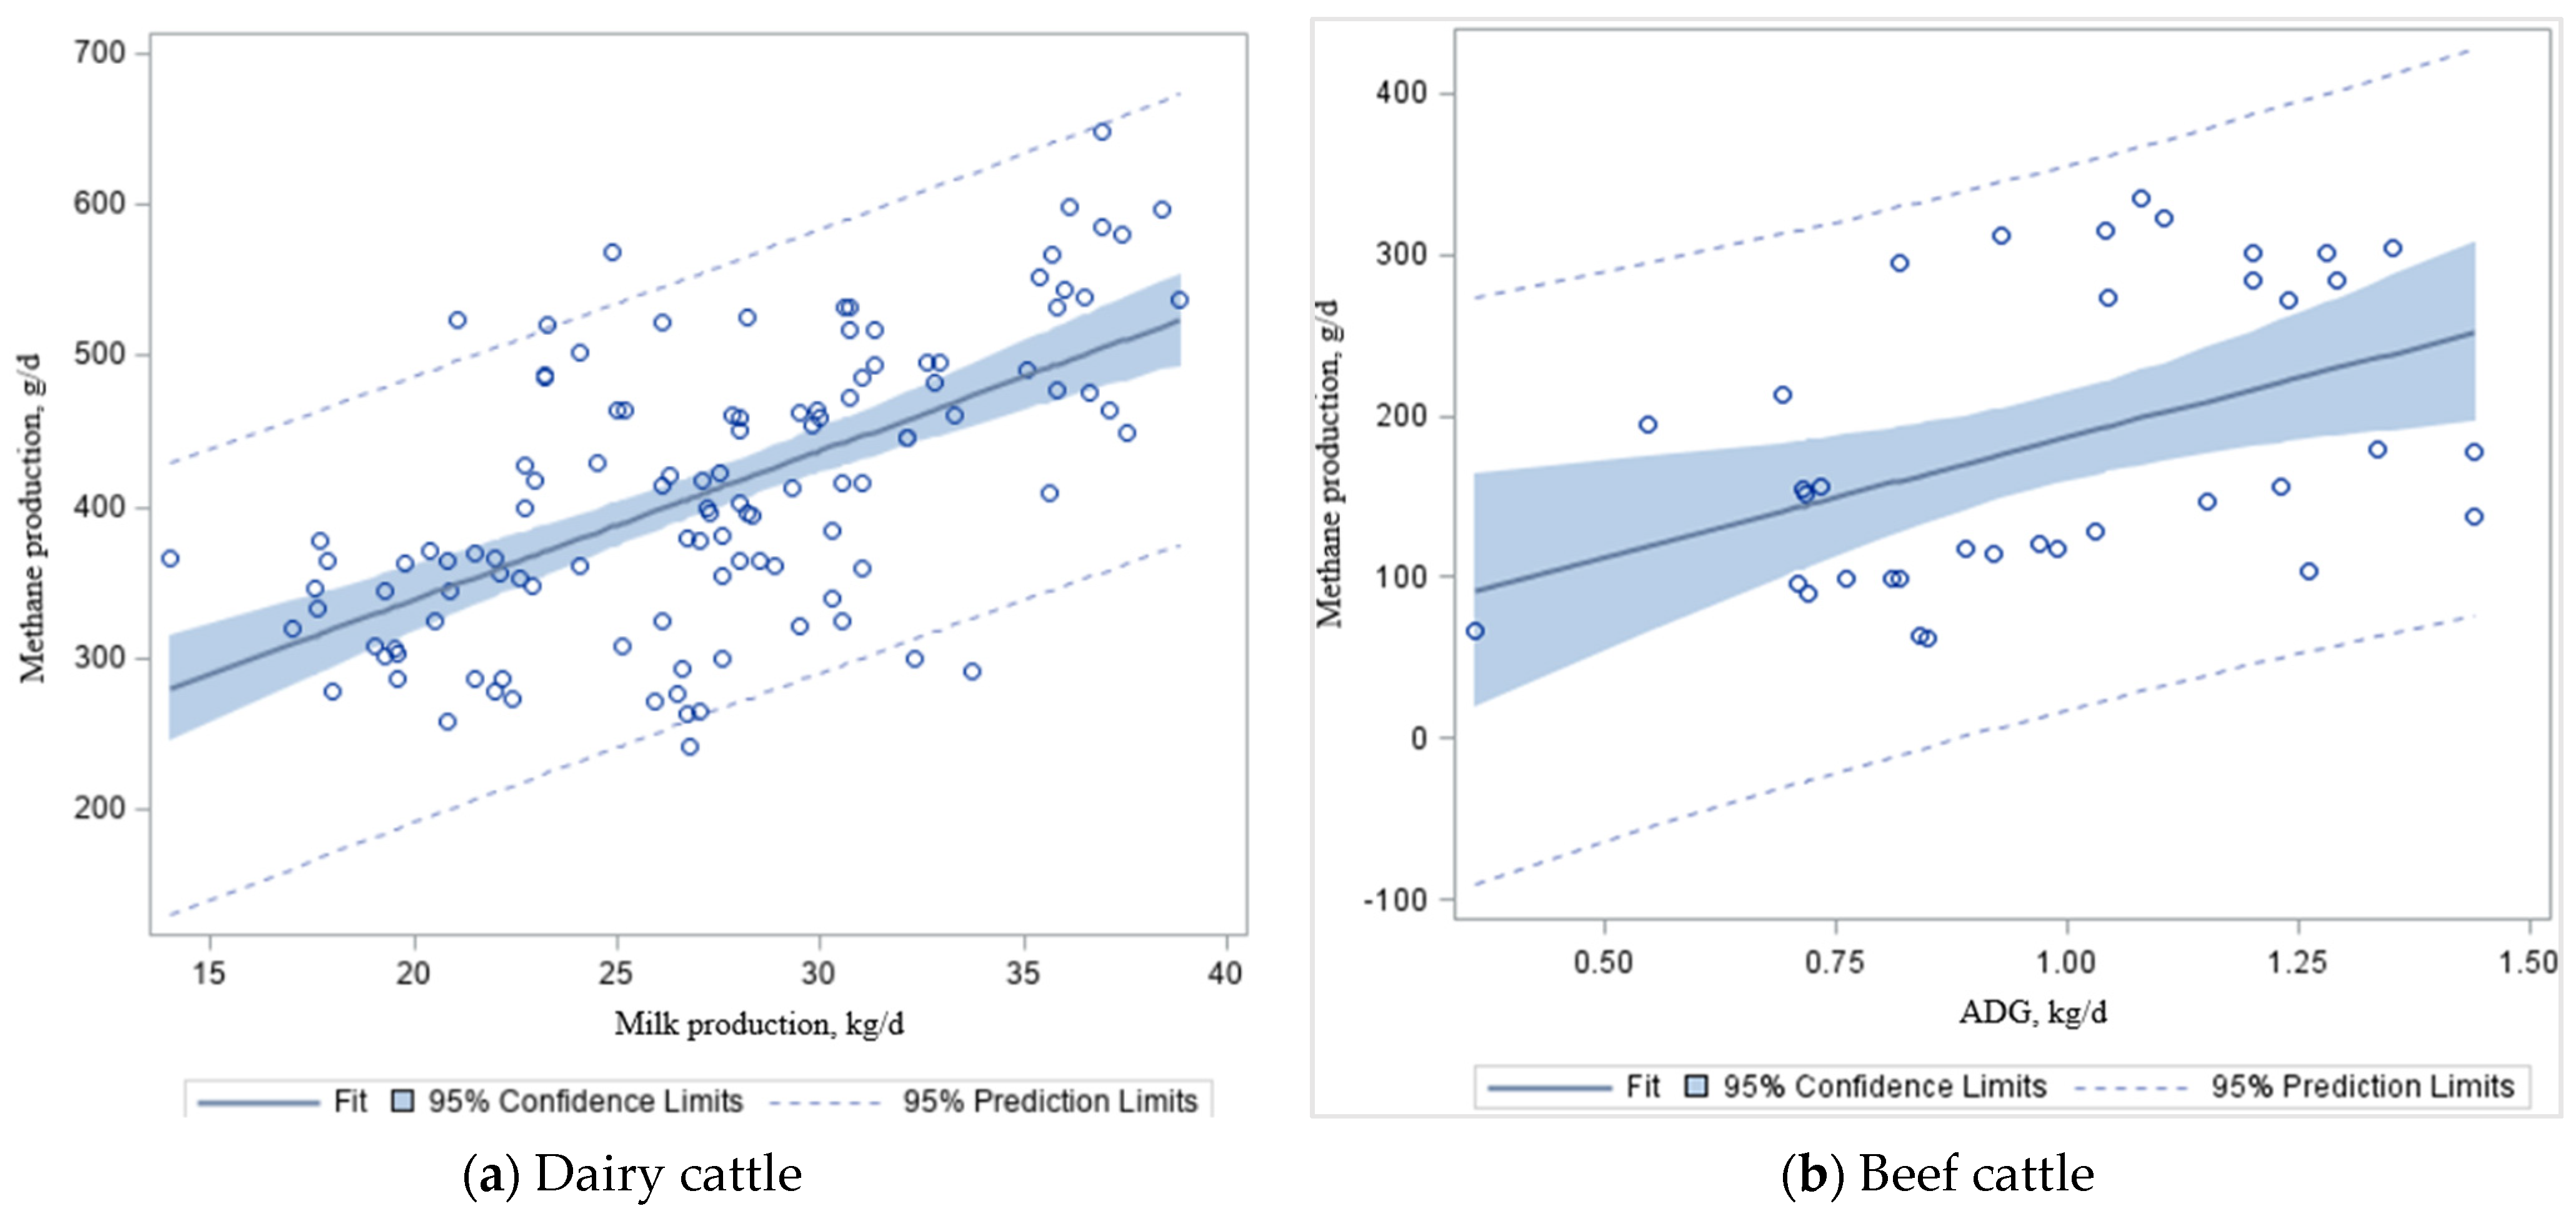
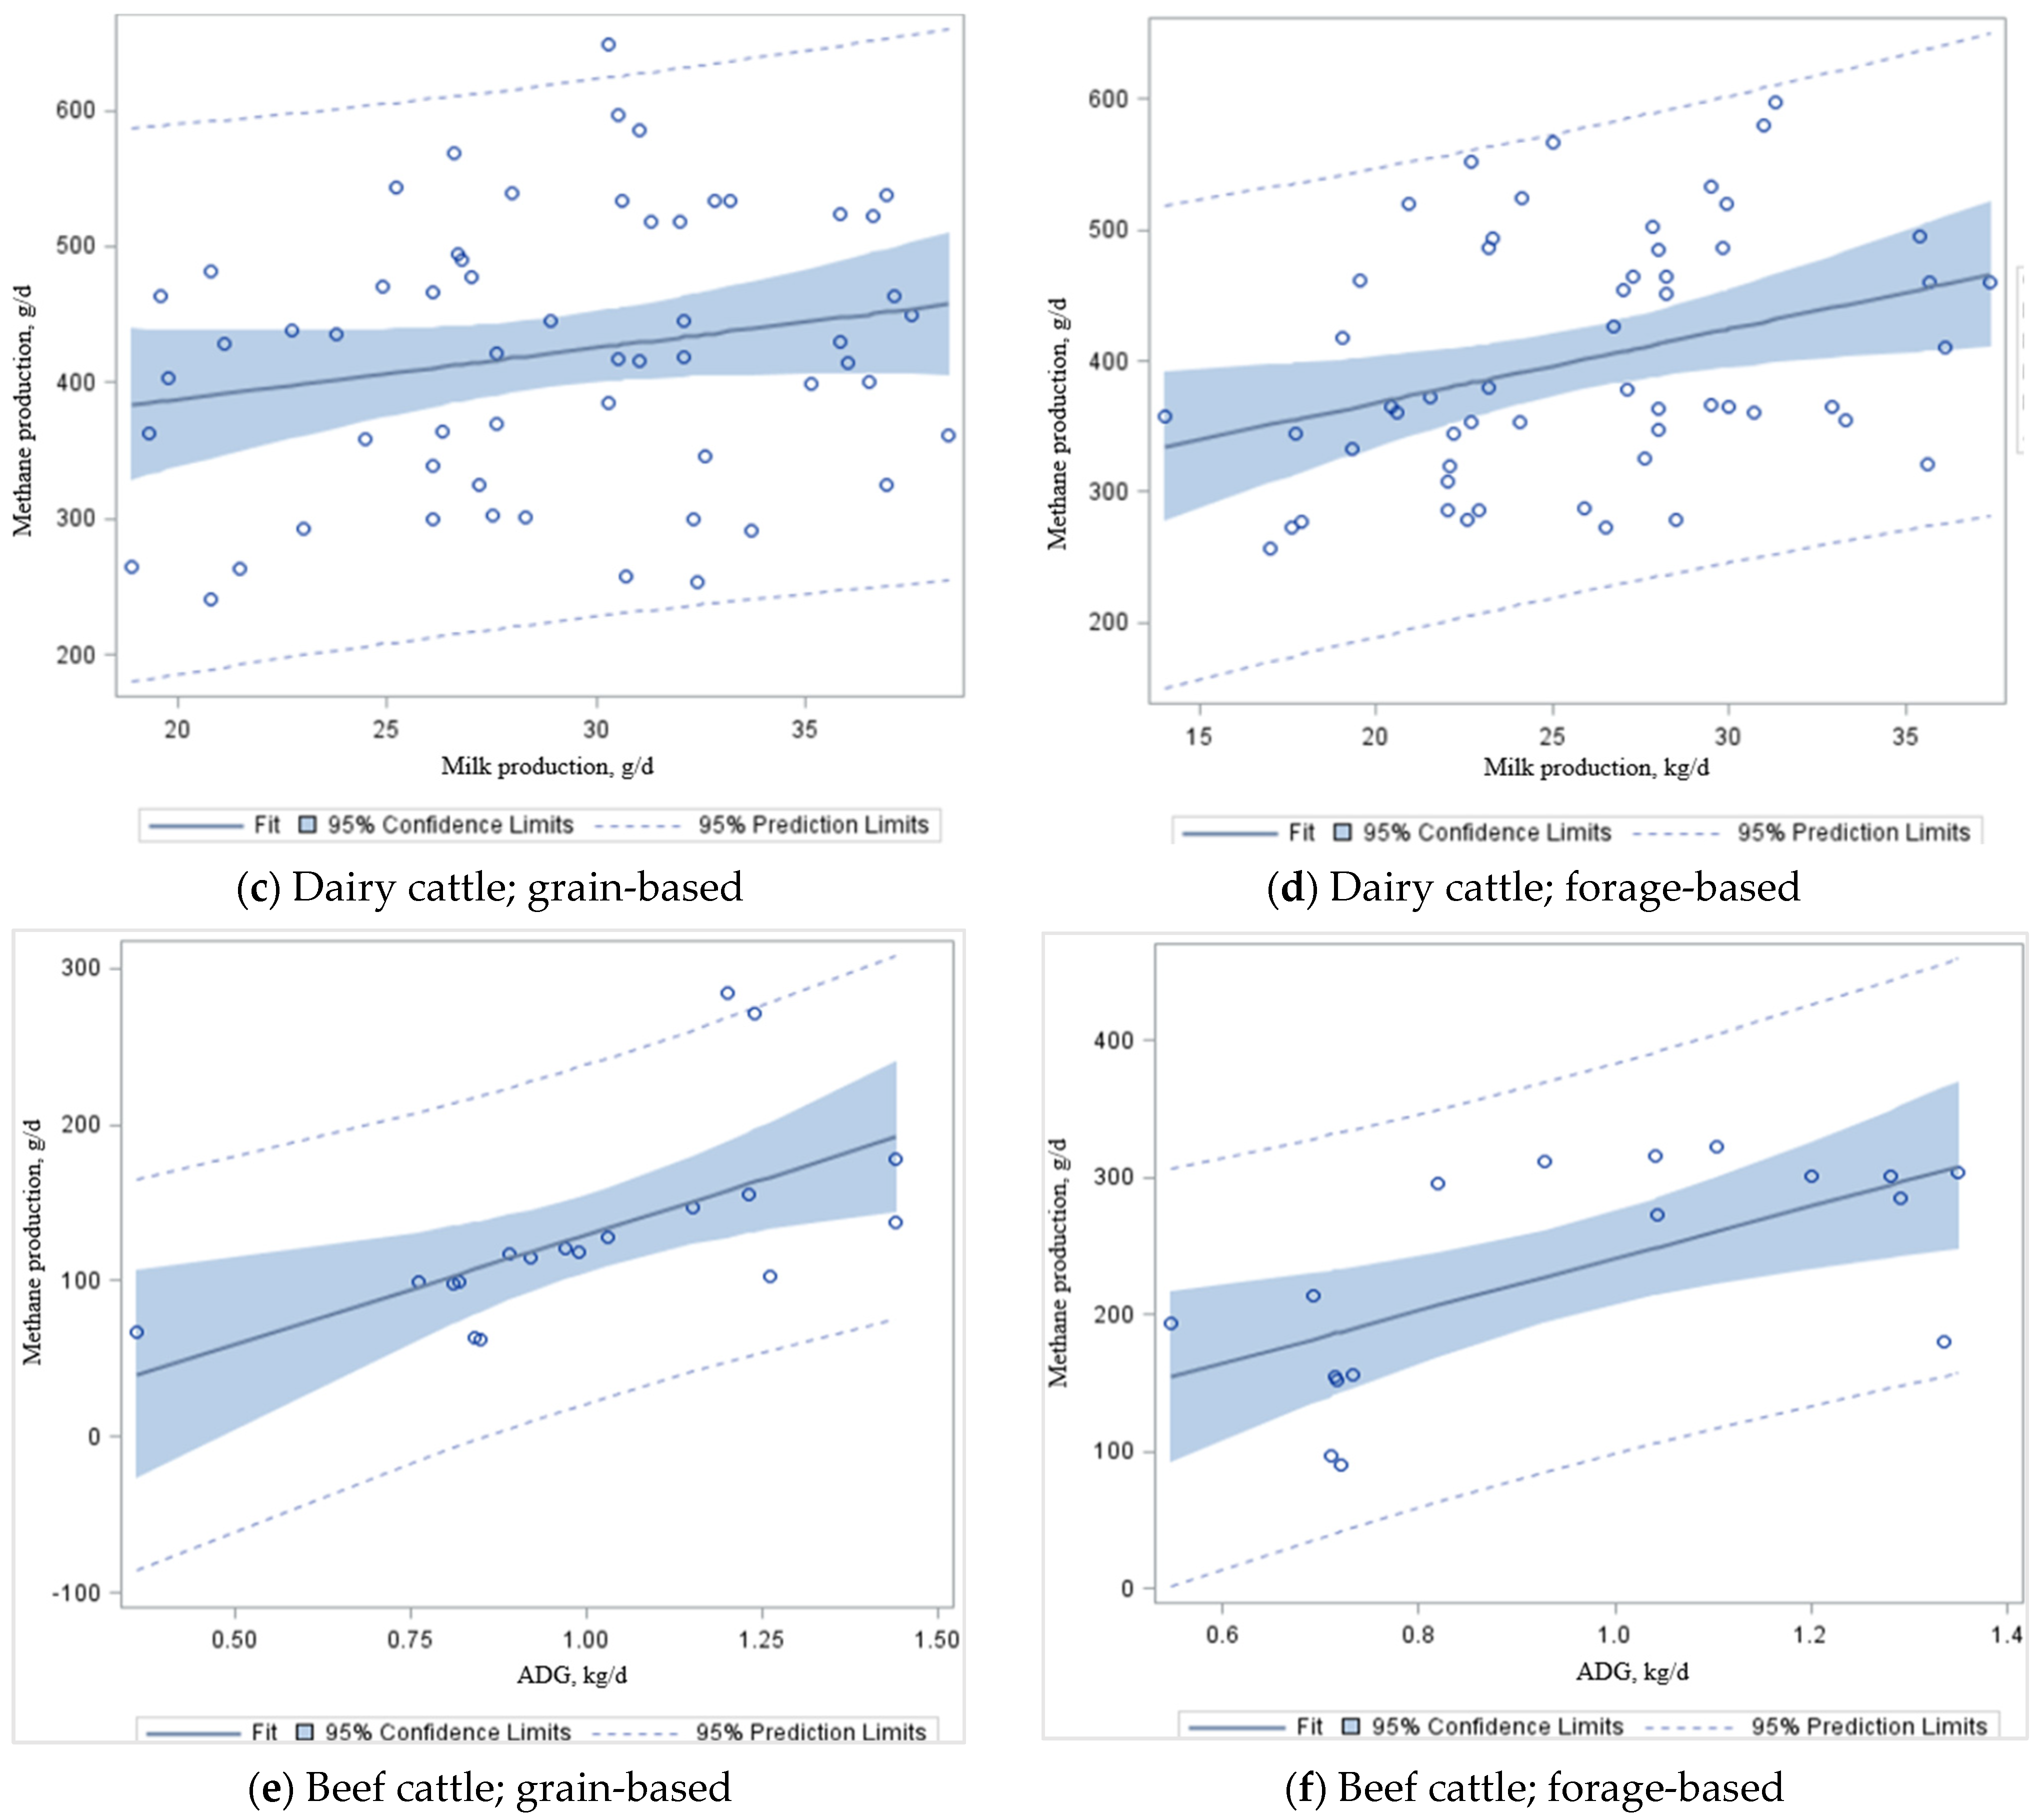
When the regression analysis was conducted on our dataset (Table 3 and Table 4), milk production was associated (p < 0.001) with CH4 production (Figure 3a; y = 9.82x + 142. 69 ± 33.55); R2 = 0.37) in dairy cattle (Table 6). The ADG (kg/d) was also associated (p < 0.01) with CH4 emission (Figure 3b; y = 117.33x + 38.34 ± 53.7); R2 = 0.19) in beef steers (Table 6). Despite significance from the combined estimated slope (Figure 3a), the relationship between milk production and CH4 production in a grain-based diet (Figure 3c) is not significant (p = 0.12). However, there was a significant difference (p < 0.01) in CH4 emissions per kg ADG in beef cattle (R2 = 0.38–0.40) fed grain-based (Figure 3e) and forage-based (Figure 3f) diets. This dataset took measurements on lactating Holstein–Friesian, Jersey, and cannulated dairy cows on high-quality dairy rations with some silage (e.g., corn, wheat, or grass silages) supplementation or high-quality grazing forage (e.g., alfalfa). These animals were found to have similar CH4 production between high-forage and low-forage diets. In contrast, measurements in the beef dataset were from growing/finishing steers or non-lactating heifers with two different energy content diets (e.g., high forage- and high grain-based diets) that had significantly different CH4 production between forage-based and grain-based diets. Adding grain to the feed ration increases the starch content. It reduces the amount of crude fiber, reducing rumen pH and promoting propionate production in the rumen while reducing the CH4 yield [103]. McGeough et al. [60,107] reported in their study that CH4 emissions from beef cattle increased from 15.3 g/kg DMI for ad libitum concentrates to 25.9–30.1 g/kg DMI for whole crop wheat silage diets using the SF6 technique. These data are comparable to those documented in the current study. Likewise, McGeough et al. [60,107] reported that CH4 emissions increased from 22.1 g/kg DMI for the ad libitum grain-based diet to 26.2–29.4 g/kg DMI for diets based on corn silage from crops at various growth stages at harvest (supplemented with concentrates at 0.23 to 0.25 g/kg DM of the diet). Therefore, diet quality and ingredients have substantial effects on CH4 production: if the feed quality is poor (e.g., high forage), the production of CH4 is high (Figure 3d,f). This is the primary cause of the loss of cow energy and, if it could be avoided, it would be critical to attaining increases in the ADG or milk production. However, improving productivity with the use of high-grain diets must be evaluated in terms of the cost of feed production and the use of fertilizers and machinery, which will increase fossil fuel use and increase N2O emissions.
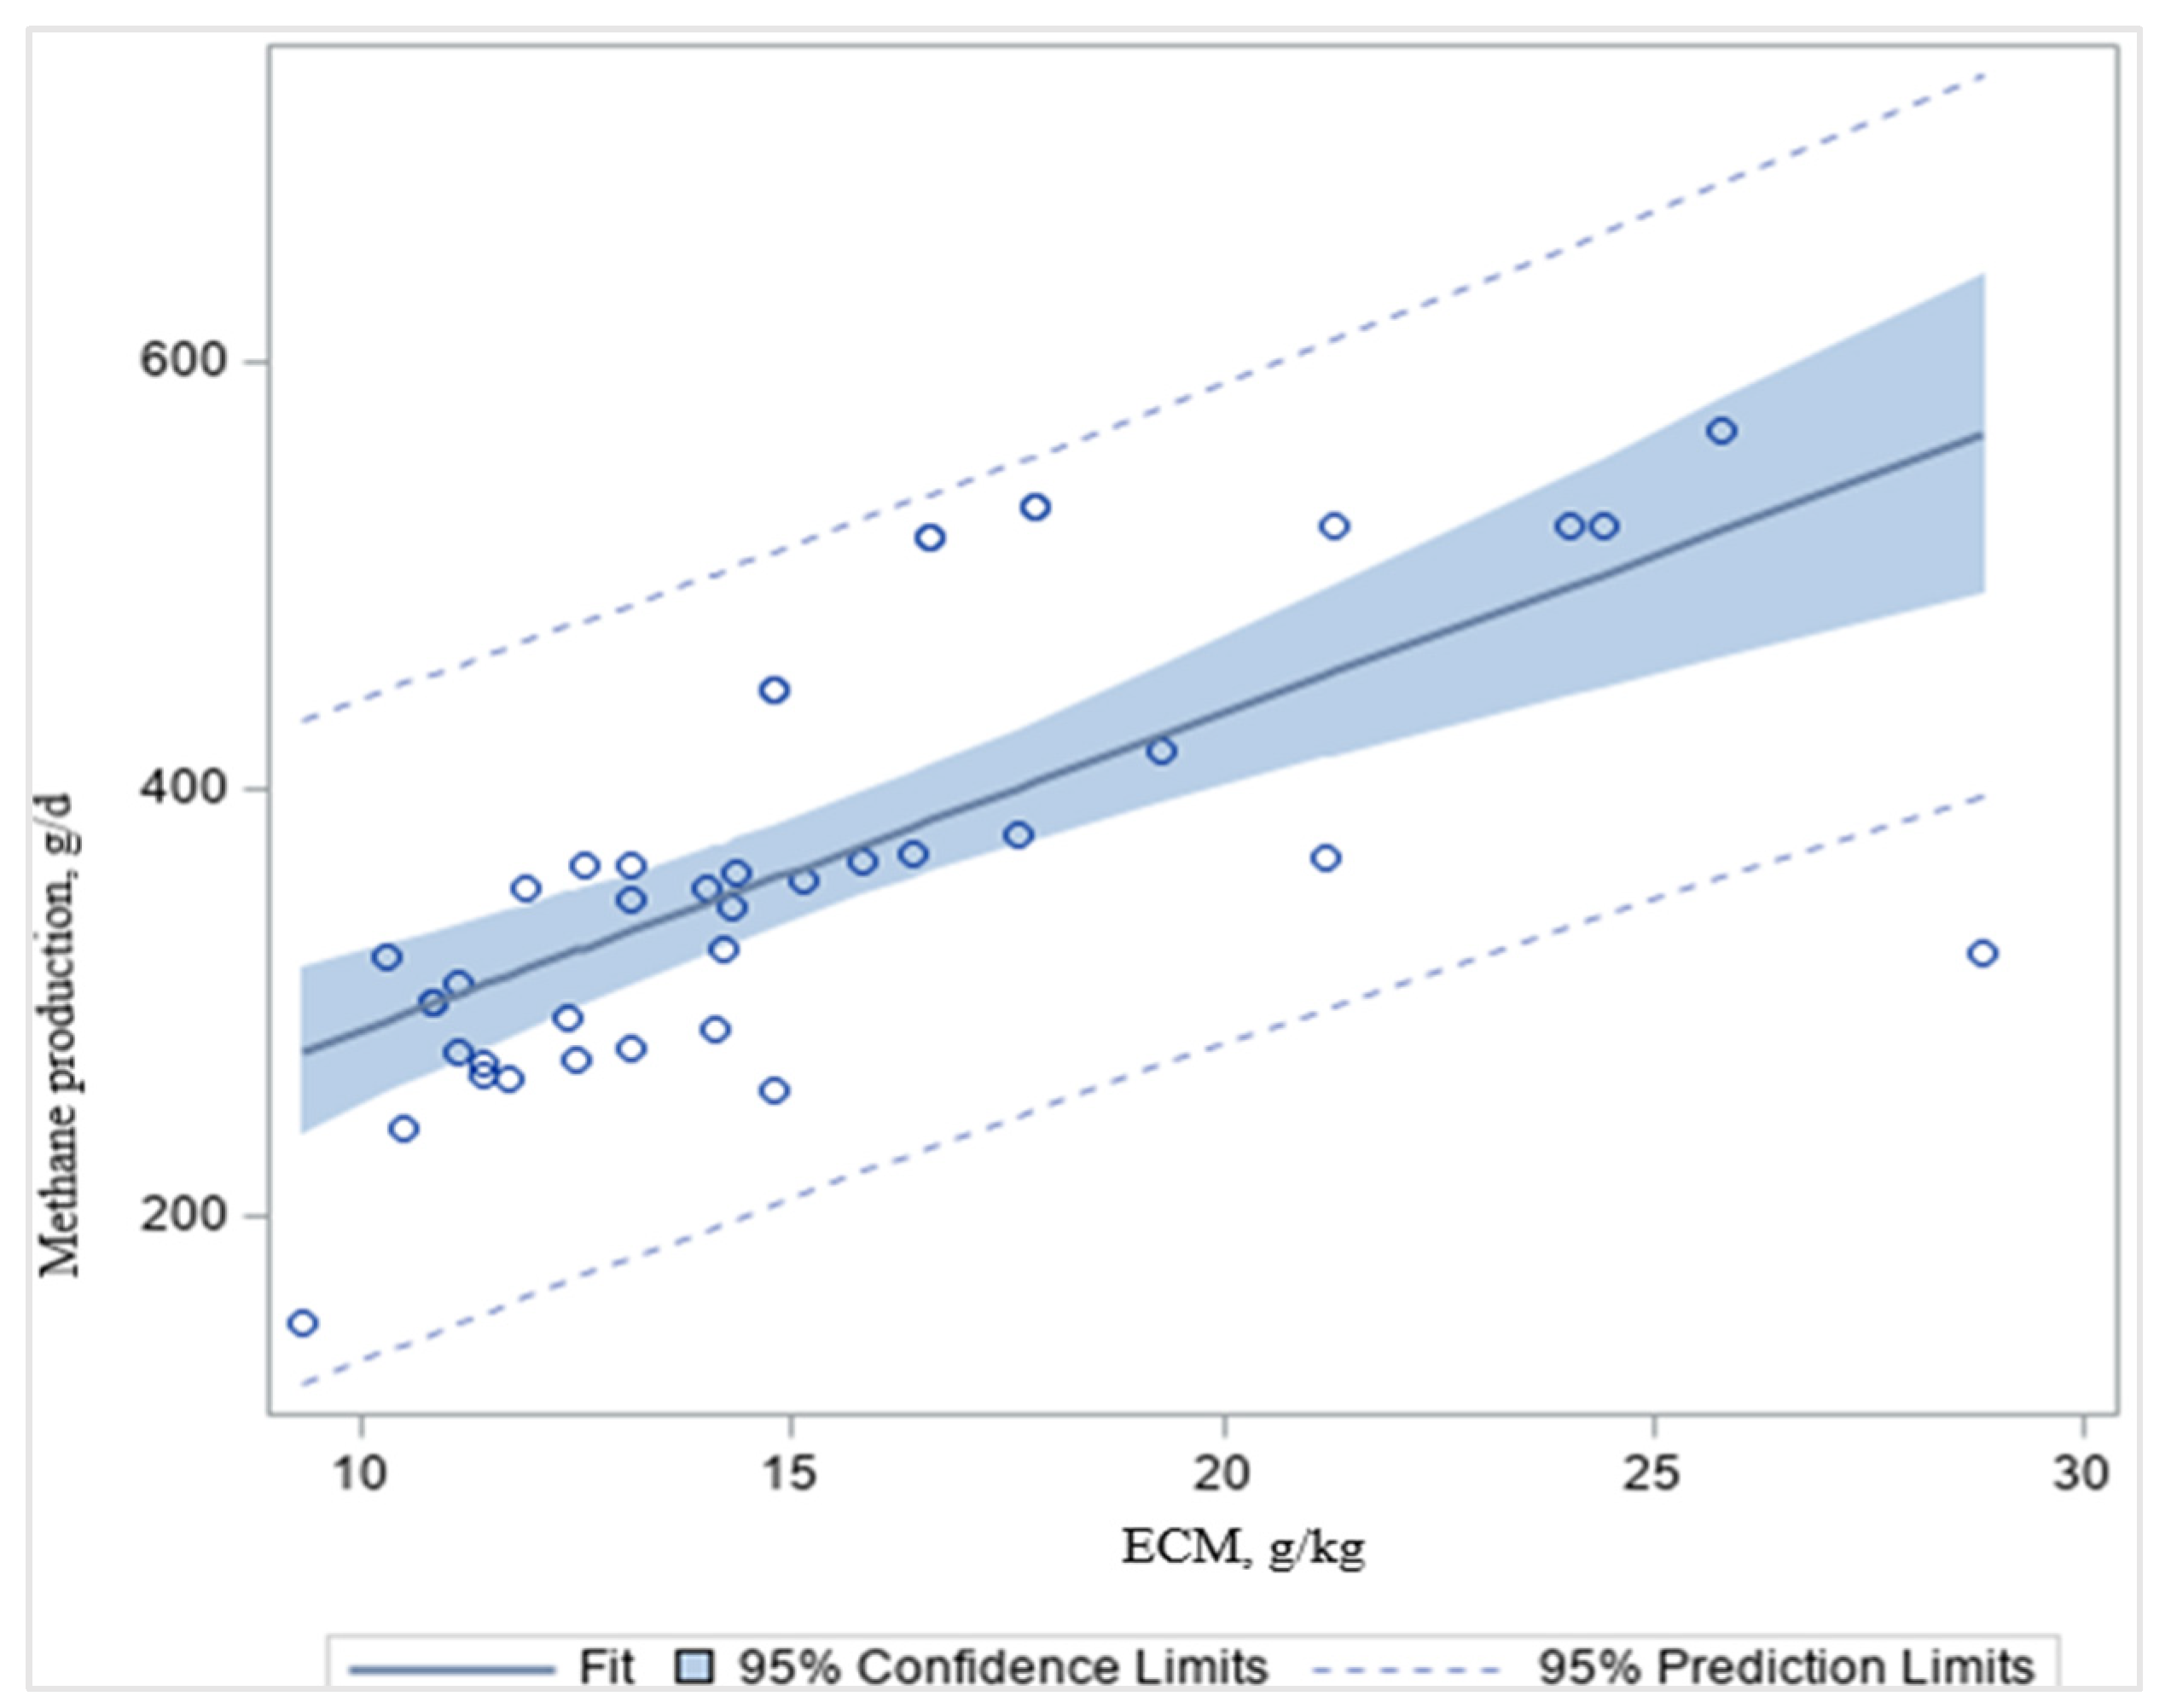
Research over the past century in dietary interventions, animal genetics, modified rumen microbial community structure, nutrition, and physiology has led to improvements in dairy production. Intensively managed dairy farms have GHG emissions as low as 1 kg of CO2 equivalents (CO2e)/kg of ECM, compared with >7 kg of CO2eq/kg of ECM in less extensively managed farms [1]. High-quality grain-based diets deliver more energy for animal production as a proportion of the GEI or DMI (kg/d), and dilute the costs of maintenance more than low-quality forage-based diets or grazing, resulting in lower CH4 g/kg ECM (Table 8; Figure 4), consistent with Knapp et al. [1]. Accordingly, we found that CH4 g/d decreased (p < 0.001; R2 = 0.46) with increasing ECM, g/kg in dairy cattle (Figure 4). As a result, the enteric CH4 emissions per unit of ECM (CH4/ECM) are useful measurements in biology, nutrition, environmental quality, and economics [1]. These data indicated that altering the forage quality and forage-to-concentrate ratio can affect enteric CH4 emissions. Forage feeds are high in NDF, ADF, and lignin, which are more difficult to digest than concentrates [60]. The slower digestion of a forage-based diet results in higher acetate formation in the rumen, and produces more CH4 than the faster digestion of a grain-based diet (Figure 4). Grain-based diets are high in starch and soluble carbohydrates and are more digestible than fibrous forage-based diets [60]. It has been reported that a higher forage-to-concentrate ratio in the diets increases enteric CH4 emissions and may decrease milk production depending upon the quality (digestibility) of the forage [1]. Aguerre et al. [14] found that enteric CH4 emissions increased by 20% when increasing the forage-to-concentrate ratio from 47:53 to 68:32. However, grain-based diets can be more expensive, decrease milk fat content, and result in metabolic disorders [107].
Alterations in milk pricing, from systems based on butterfat content to systems based on protein or other milk components, have been recommended to reduce CH4 emissions [106]. The fat content of milk accounts for about 9253 calories per gram of fat or 750 calories per 1 kg of 4% milk of the energy content of milk, and therefore reducing milk fat content will decrease the need for feed energy [108], which, sequentially, will reduce enteric CH4 emissions. A change in milk pricing based on solid-non-fat has been projected to reduce CH4 emissions from U.S. milk cows by 15% [106]. With the application of low-fat milk increasing, pricing based on milk protein will increase producers to adapt feeding systems to include highly digestible protein feeds, which will increase productivity and reduce CH4 emissions. However, high protein ingredients are expensive in dairy rations, and excessive nitrogen (N) may be excreted in urine and feces. The impact on the environment as well as dietary feed accounts associated with such an approach must be assessed in terms of the overall profits that can be attained.

4. Enteric Methane Emissions and Rumen Fermentation Profiles

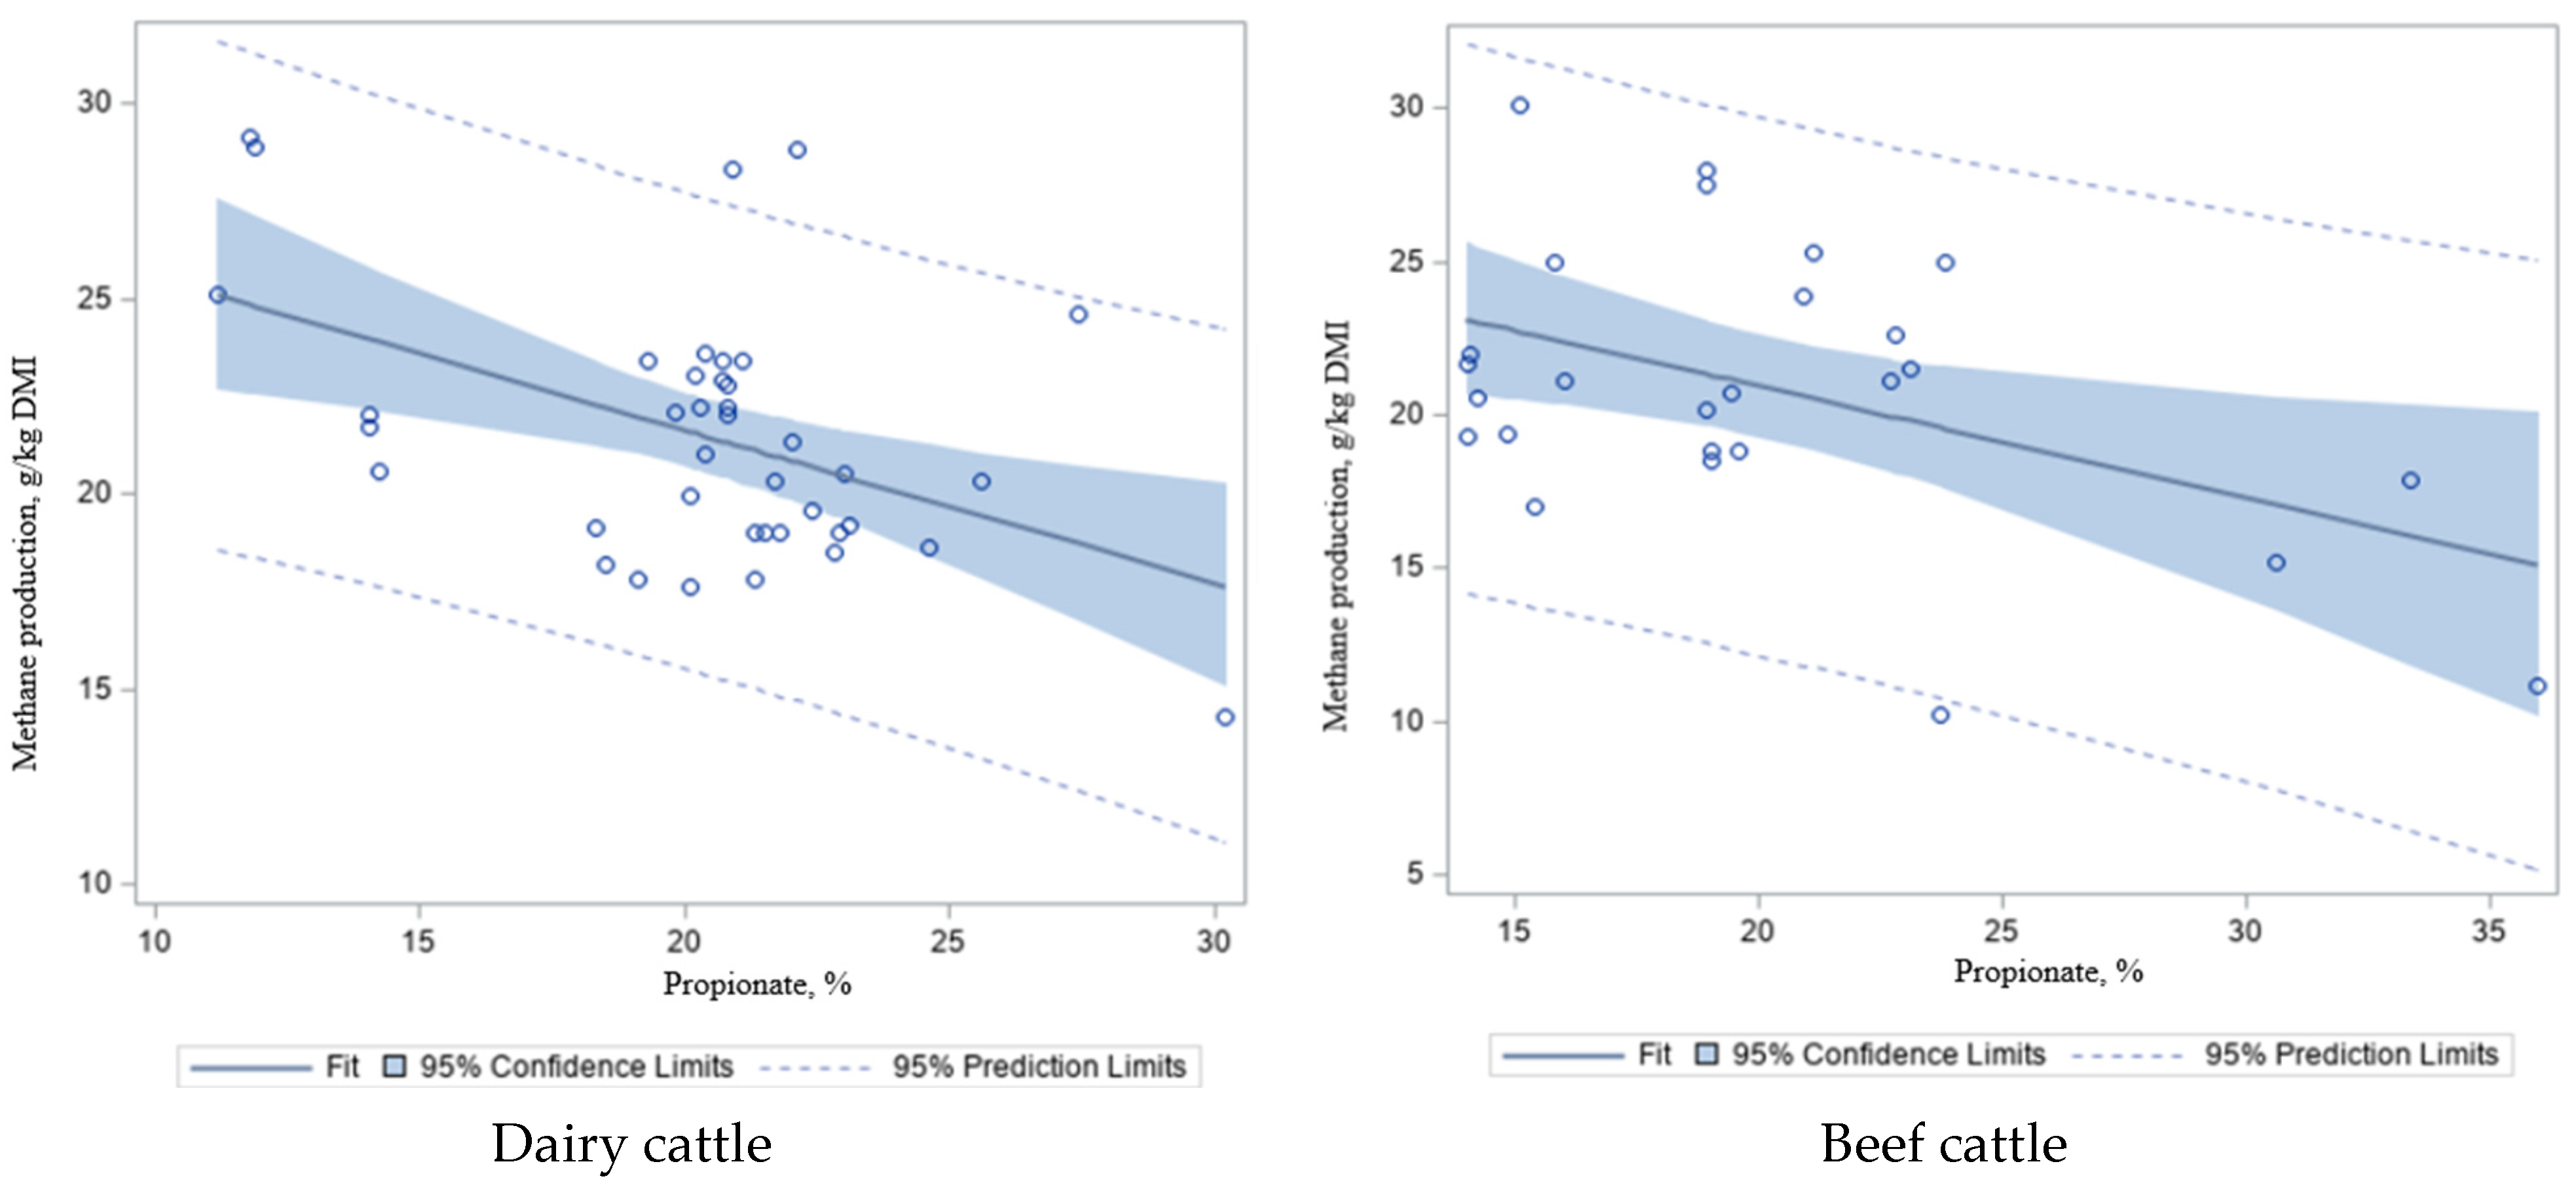
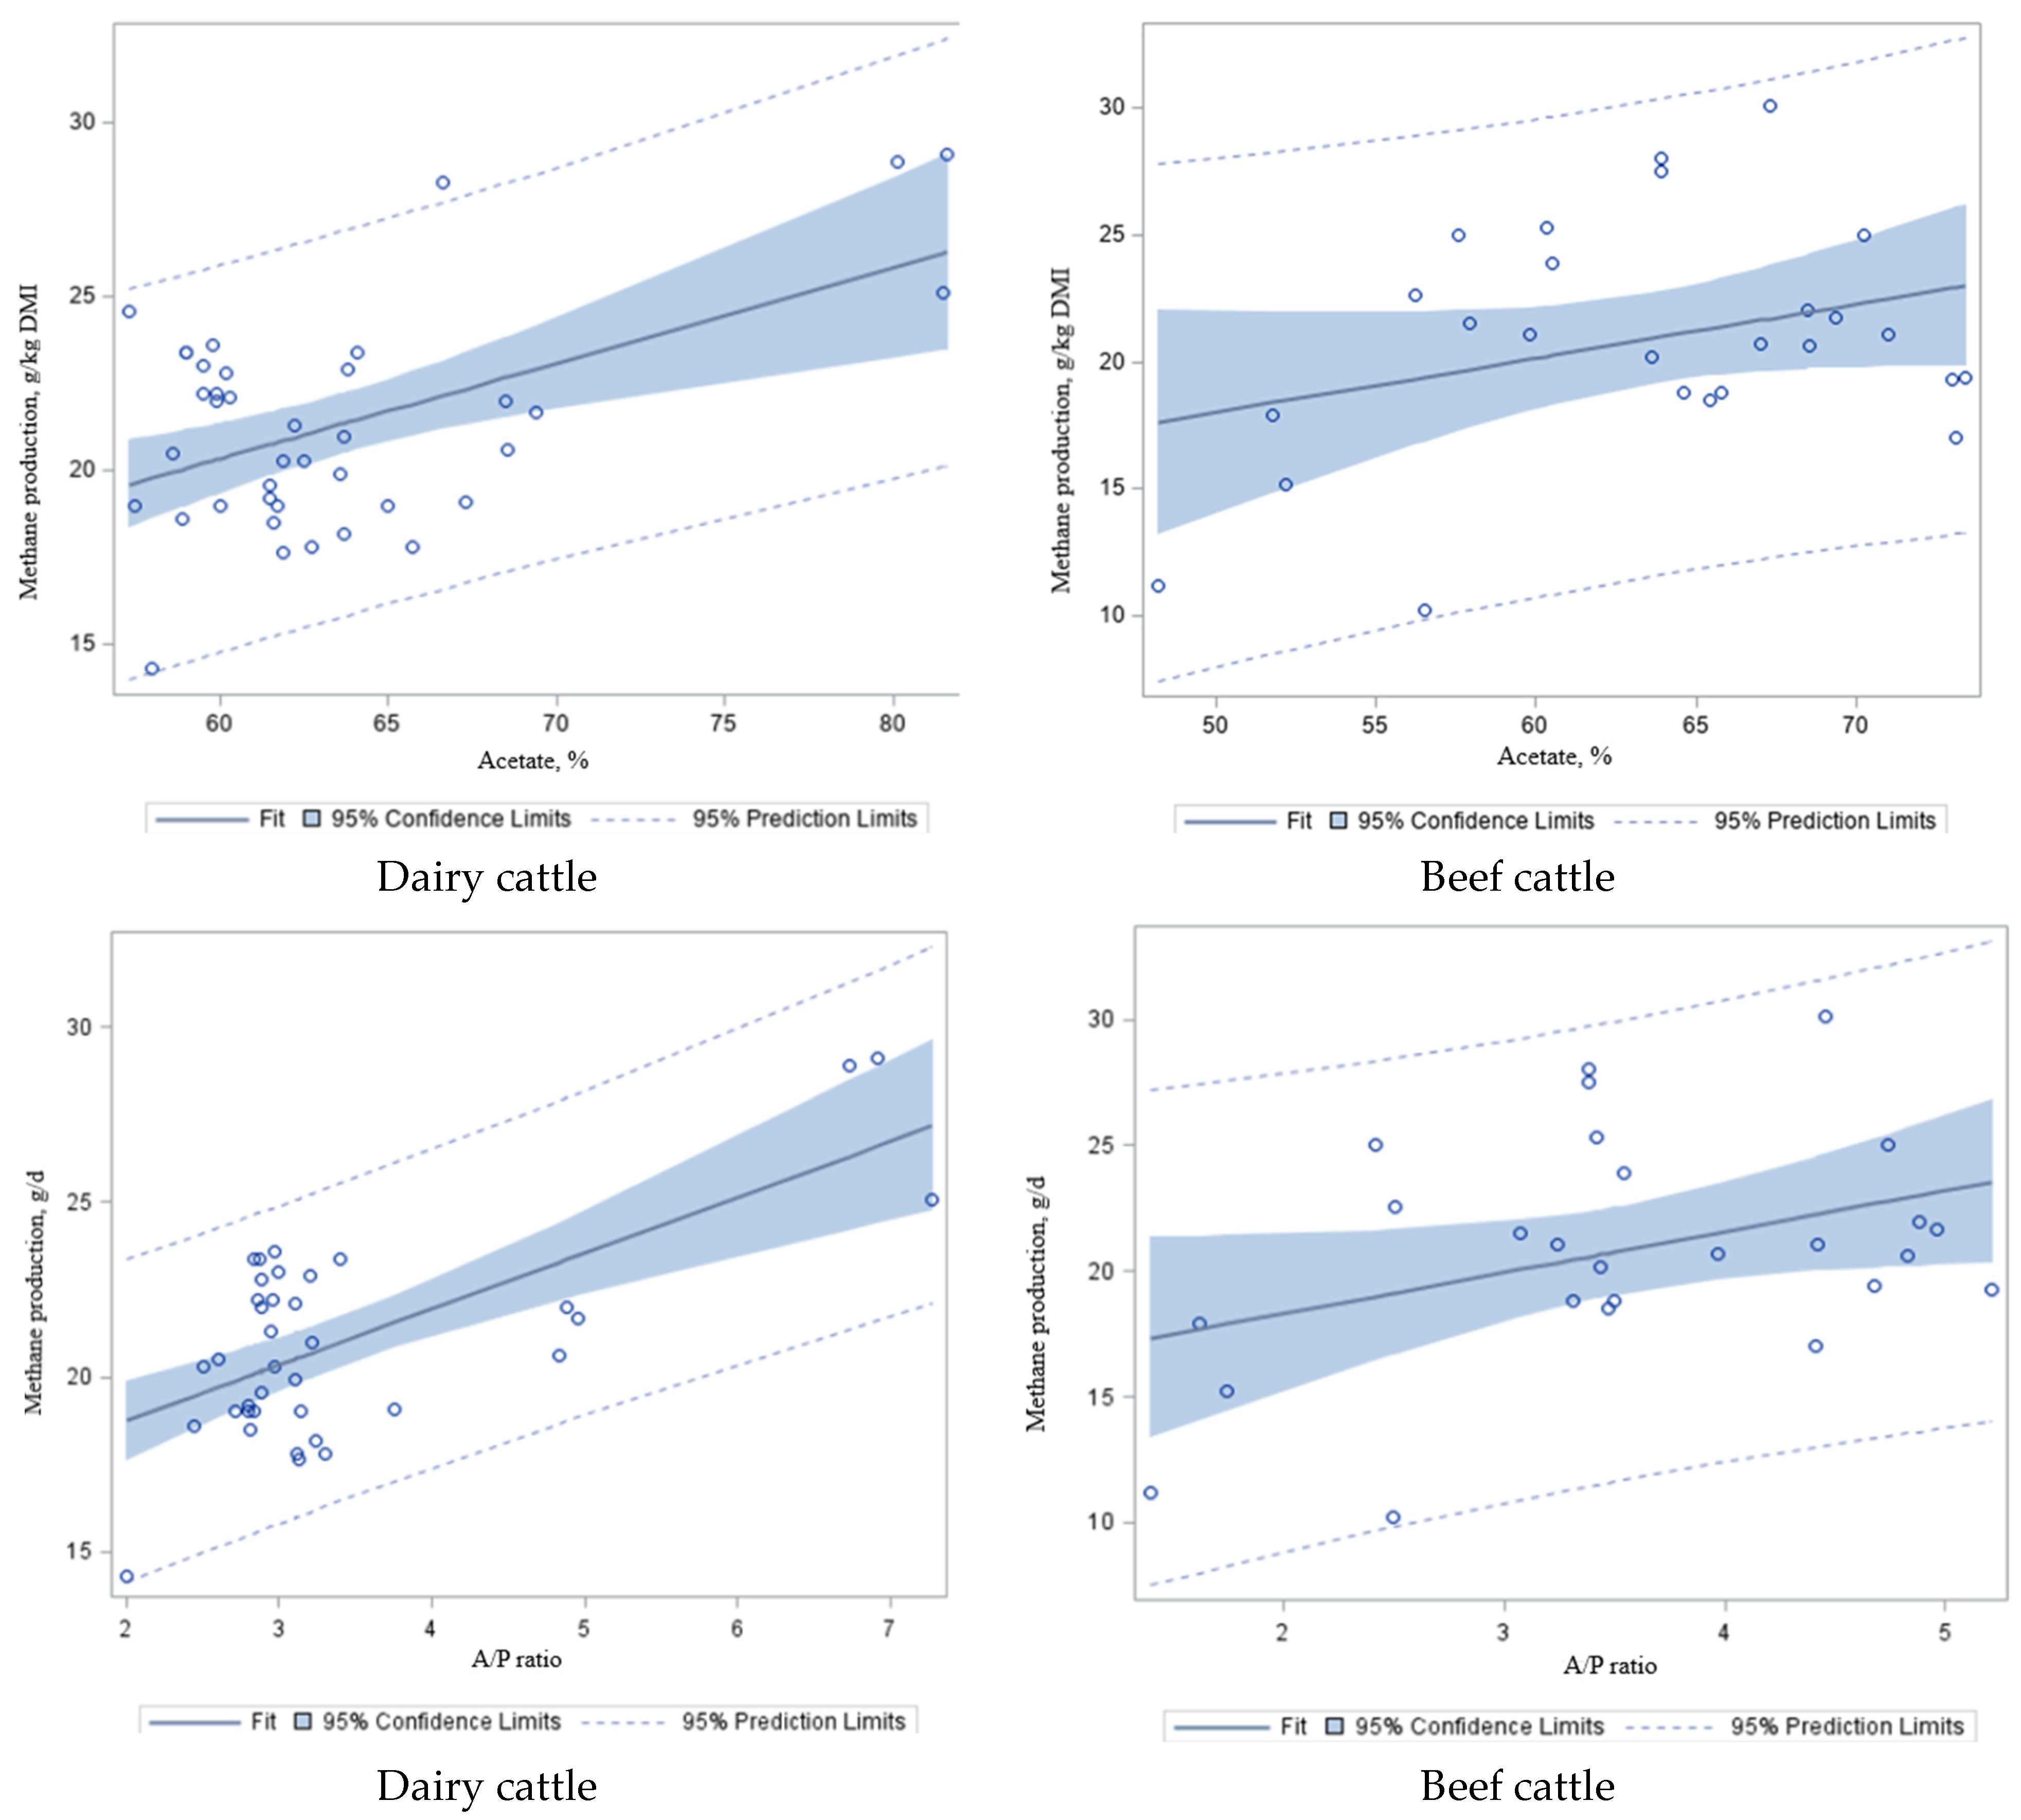
To further explore the effect of energy sources, as measured by volatile fatty acids (VFA; Figure 5a–d) and acetate/propionate (A/P) ratio (Figure 5e,f) on CH4 emissions, these values were regressed against CH4 in dairy and beef cattle in the study dataset (Table 7). We found that there was a negative correlation between propionate concentration and CH4 emissions in dairy (R2 = 0.21; p < 0.001; Figure 5a) and beef cattle (R2 = 0.21; p < 0.02; Figure 5b), and a positive correlation between acetate and CH4 productions (more acetate, more CH4 in the rumen) in dairy (R2 = 0.28; p < 0.001; Figure 5c) and beef cattle (R2 = 0.10; p = 0.10; Figure 5d), which is similar to the A/P ratio (R2 = 0.45–0.15; p < 0.001–0.05; Figure 5e,f) and CH4 emissions in dairy and beef cattle, respectively. Acetate is the most important intermediate substrate of CH4 production (acetoclastic methanogenesis or syntrophic acetate oxidation coupled with hydrogenotrophic methanogenesis) during anaerobic digestion and the biogas process [109]. Aceticlastic methanogenesis is carried out by Methanosarcinaceae spp. and Methanosaetaceae spp., while syntrophic acetate oxidation is performed by methanogens (mediated by Methanobacteriales spp. and/or Methanomicrobiales spp.) and acetate-oxidizing bacteria, including Clostridium ultunense, Syntrophaceticus schinkii, Tepidanaerobacter acetatoxydan, and other thermophilic bacterial species [110,111,112,113,114]. Likewise, Kittelmann et al. [115] proposed that proportionally more propionate was present in one of the low CH4 emitting cattle types in that study. Intrinsically, a dietary element or intervention that initiates a shift in support of propionate production will yield a reduction in CH4 production per unit of feed fermented. In contrast, the opposite is true for acetate and butyrate [115]. Danielsson et al. [116] reported that the ruminal fermentation pattern of VFA showed that the proportion of propionate was higher in cluster L cows (low-CH4 production), while the proportion of butyrate was higher in cluster H cows (high-CH4 production). As a result, propionate fermentation is the most energy-efficient fermentation process due to energy assimilation from H2 and propionate being the main precursor of gluconeogenesis in animals [117,118]. This phenomenon at least partially explains the relationship between propionate concentration, the A/P ratio, and CH4 production observed in this study (Figure 5e,f). Rumen fermentation that leads to propionate synthesis results in less H2 being available for CH4 production [115,119], which is primarily formed using H2 by methanogenic archaea (CO2 + 4H2 – CH4 +2H2O [120]).
Weimer et al. [121] observed that the ruminal total VFA concentration and propionate proportion were higher in highly efficient cows than in low-efficiency cows. The primary energy sources for dairy and beef cattle are carbohydrates. Rumen microbes ferment these energy sources in the rumen to produce VFA (up to 200 mM) and various gases (Table 1), which are used by ruminants as the energy source for milk and meat production, resulting in up to 75% of the cow’s metabolizable energy requirement [117,118]. It is reported that, as ruminal VFA production moves towards more propionate at the cost of acetate (e.g., a lower A/P), more ADG is achieved, and presumably more energy is utilized for animal growth [115]. When glucose is metabolized into acetate, propionate, or butyrate, the animal’s energy efficiency relative to glucose is 62%, 109%, and 78%, respectively [118,122]. Accordingly, the production of acetate and butyrate results in the production of additional methanogenic substrates (formate and H2), which may explain the increased amount of CH4 emissions in high-CH4 emitting animals.

5. Methanogenesis and Microbial Ecosystem

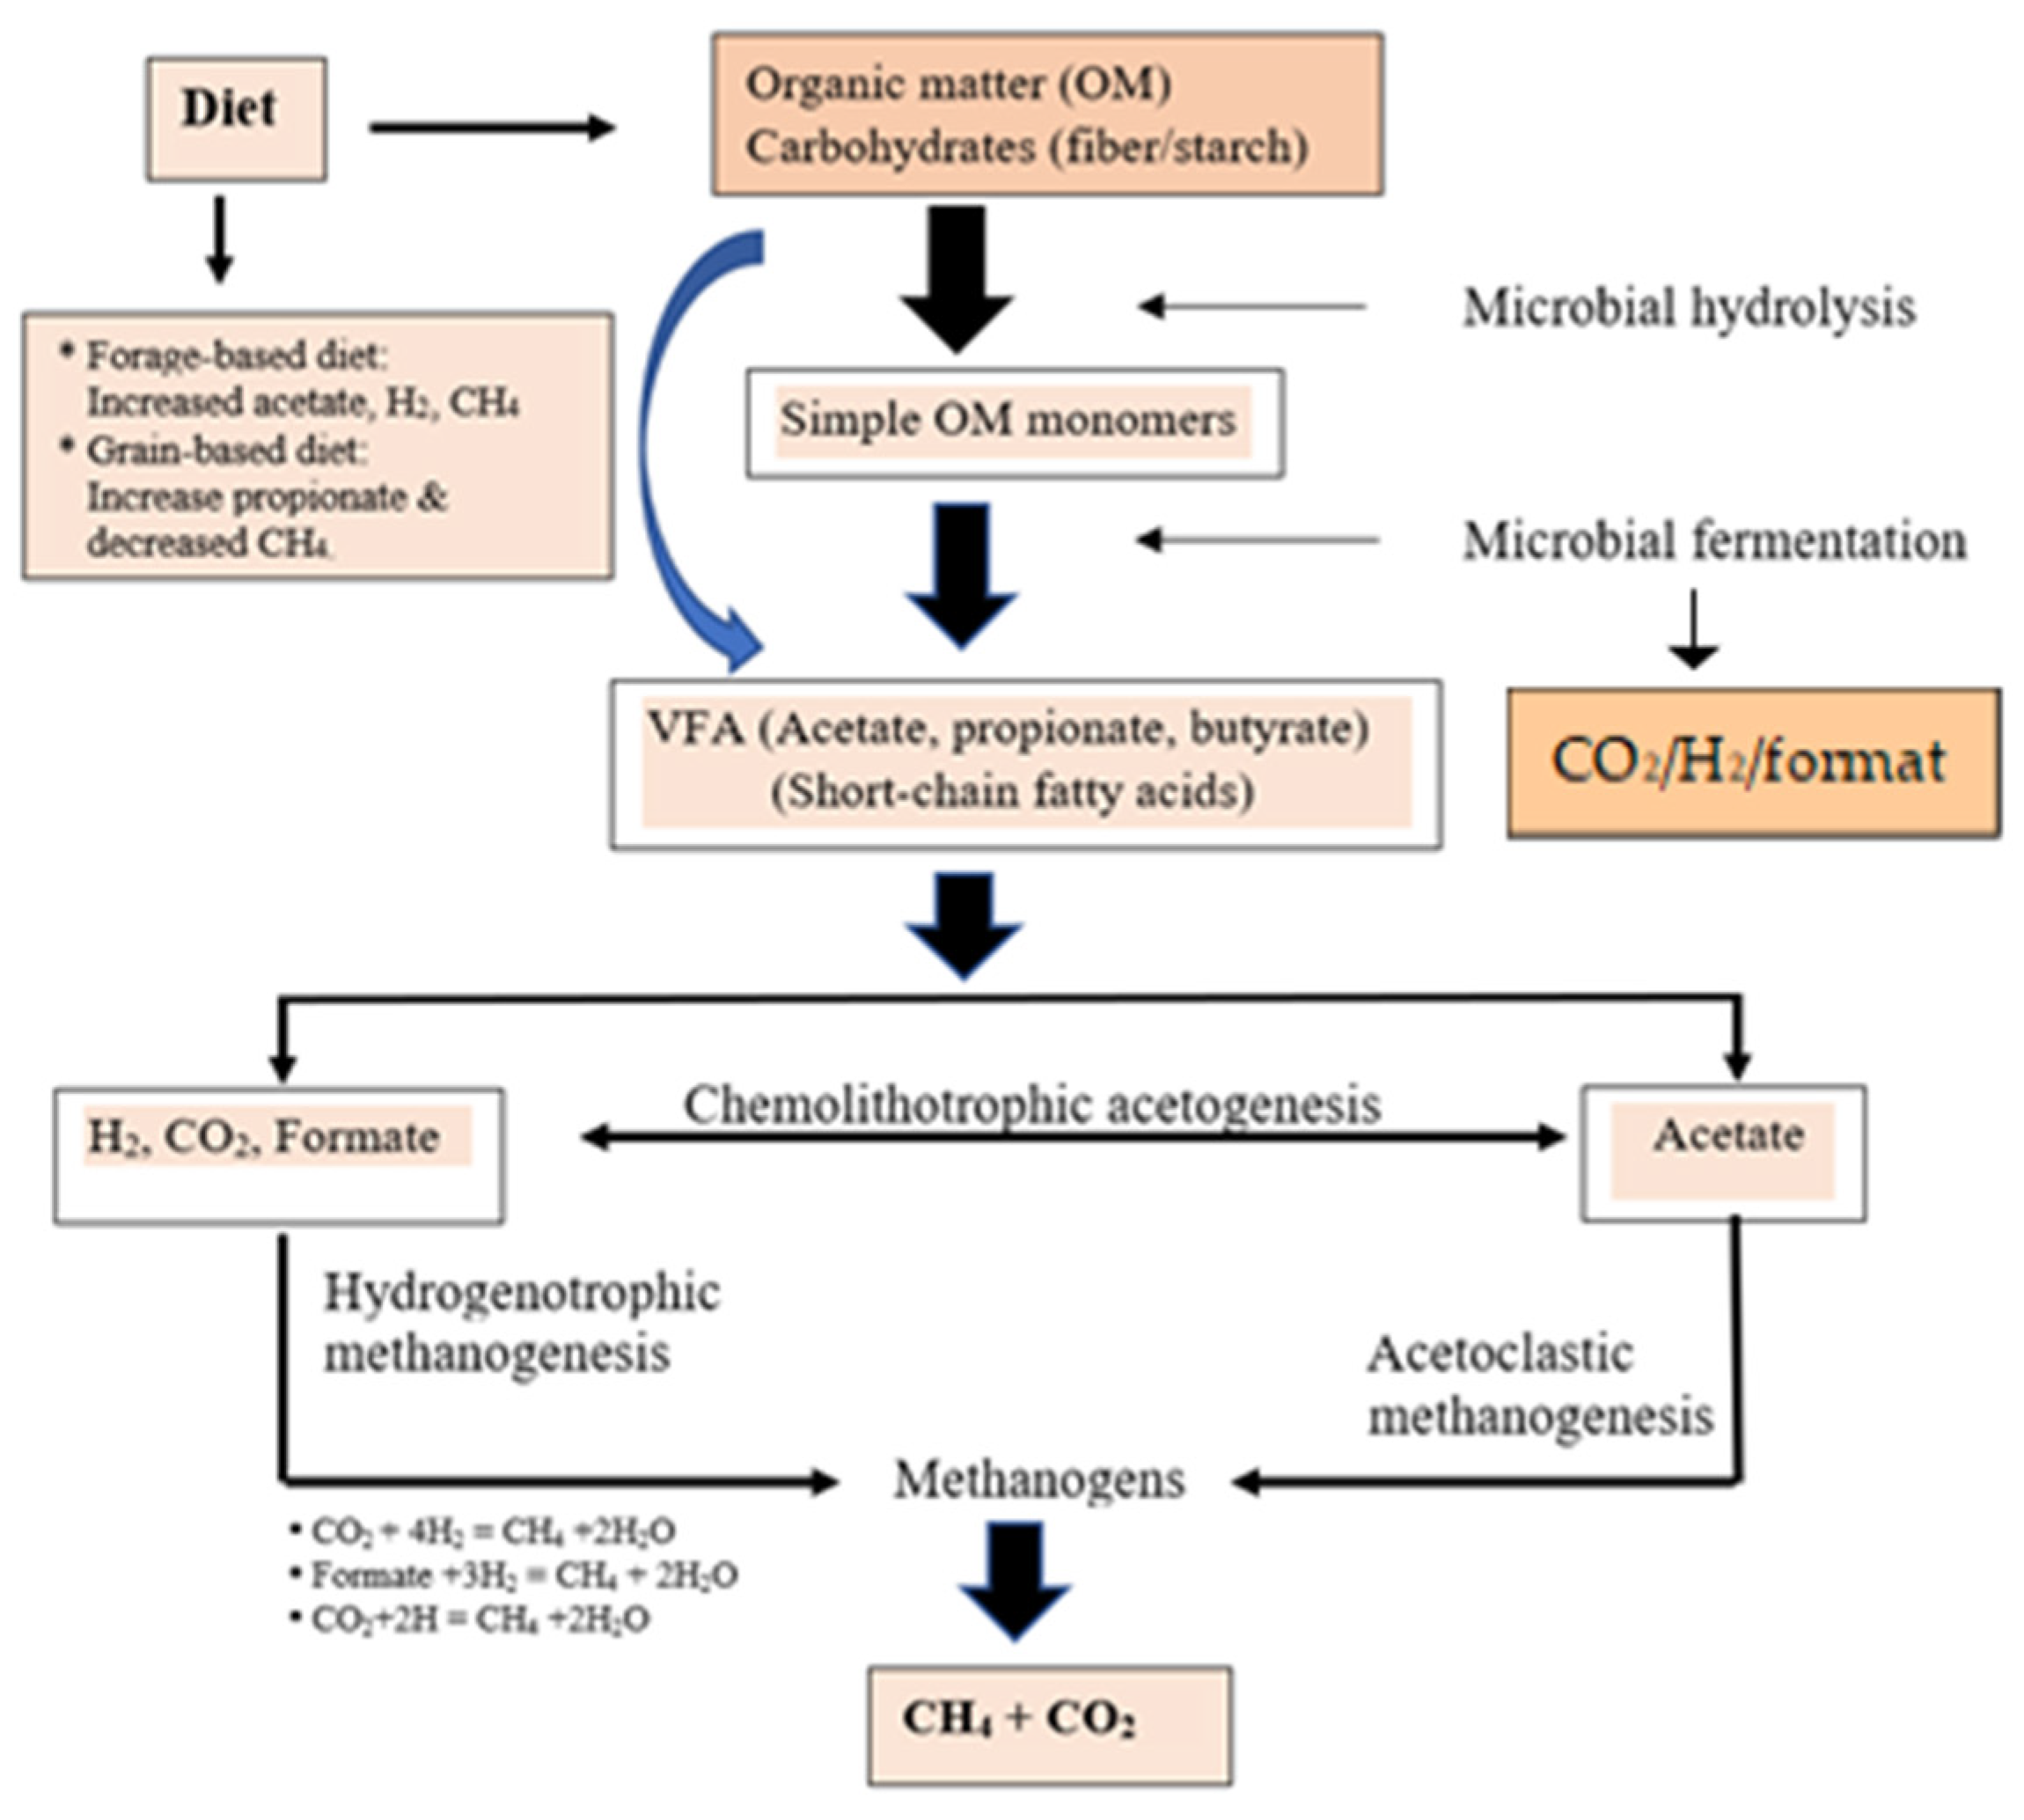
Several reports on the methanogenic potential of the rumen have garnered significant attention in the last decade due to the impact that methanogenesis has on ruminant animal performance and the environment [21,56,74,75,82]. Methanogens exist within several locations within the rumen, including the association with the rumen epithelium, integration into biofilms, protozoa, and fungi [21,123,124,125]. A summary of the methanogenesis and microbial fermentation of dietary components in the rumen resulting in the production of VFA, CH4, CO2, and H2 produced through belching is presented in Figure 6. It has been noted that feeding concentrate diets that are high in energy substrates (non-structural carbohydrates) instantly lowered CH4 emission (g/d and g/kg DMI); whereas high fiber diets (forages) resulted in increased CH4 emissions. Ruminal methanogens utilize reducing equivalents produced by fermentative microflora (generally H2-producing microorganisms) such as Ruminococcus albus, R. flavefaciens, Neocalimastrix spp., Desulfovibrio, and ciliate protozoa [126,127,128,129]. According to Min et al. [4], R. albus and R. flavefaciens (cellulolytic bacteria) produced the most H2 among purified strains and sustained production of CH4 when cocultured with the Methanobrevibacte smithii that utilized the H2 to reduce CO2 to CH4 [130], which is also consistent with reports by Miller and Wolin [131] and Wolin et al. [132]. Syntrophic cooperation between H2 consumers (e.g., methanogens) and H2 producers alters the overall fermentation balance of the primary substrate toward the improved use of energy substances (Conrad et al. 1985). Subsequently, Kim et al. [133] stated that the supplementation of acetogenic bacteria (Proteiniphilum acetatigenes) isolated from Korean native goats (Capra hircus coreanae) decreased methanogenic archaea. Hence, acetogens may function as a net H2 sink that consequently reduces CH4 emissions [115].
Among the abundant bacterial phyla previously reported in numerous studies, Firmicutes and Bacteroidetes are the most abundant rumen microbiota in the guts of humans, mice, pigs, cattle, and meat goats [134,135,136,137,138,139]. Enteric CH4 emissions from ruminants are mainly generated by hydrogenotrophic methanogenic archaea (i.e., methanogens) that support the normal function of the rumen ecosystem through the reduction (sink) of CO2 by H2 [140,141]. Fibrinolytic bacteria, especially cellulolytic Ruminococcus and several Eubacterium spp., are well documented H2 producers. Conversely, the prominent cellulolytic flora, Fibrobacter spp., does not produce H2, while Bacteroidetes are net H2 utilizers [142]. Furthermore, the primary ciliate protozoa and fibrinolytic bacterial species in the rumen are H2 producing microbes that counteract CH4 reduction strategies that reduce available H2 and may slow fiber digestion [130,143]. However, the constant removal of H2 is vital to maintaining the biological fermentative function of the rumen because excessive H2 accumulation constrains carbohydrate fermentation by preventing the regeneration of NAD+ [140,144]. At an equivalent level of DMI, cattle diets with a higher amount of concentrate are more rapidly fermented, which results in a higher ruminal digesta passage rate, a shorter digestion time between feed particles and methanogens, and subsequently, reduced CH4 production and numbers of archaeal methanogens [145,146,147]. Moreover, feeding efficiently fermentable carbohydrates lowers ruminal pH and the number of cellulolytic bacteria and protozoa, resulting in reduced fiber degradation, proportionally less acetate and more propionate (thus also less free hydrogen), and, finally, less CH4 production, because propionate serves as an H2 sink [86]. A potential explanation for this could be competition for the same substrate, as Methanobrevibacter species are hydrogenotrophic [148] and use H2 and formate as substrates for CH4 production (Figure 6). These findings imply that the prevailing microbes in the rumen (Firmicutes and Bacteroidetes; F/B), ciliates protozoa, and methanogen archaea populations might have a role in adapting host biological parameters to reduce CH4 production, and can potentially be utilized to estimate CH4 emissions [149,150]. It has been reported that the richness of Firmicutes and the F/B ratio was positively associated with ADG due to lower A/P ratios [138,139] and positively correlated with enhanced CH4 emissions (Figure 5e,f [149]). These same authors confirmed that Firmicutes populations were linked to lower VFA levels when CH4 production was high, demonstrating that the F/B ratio could be used as an indicator to analyze rumen microbiome and GHG emissions. In addition, a significant positive relationship between fecal methanogen archaea concentration (µg/g fecal DM) and CH4 emissions, expressed on a DMI basis (g/kg DMI), was found (R2 = 0.53; n = 20) [86]. A reduction of methanogenesis or methanogens in the rumen should be associated with a decrease in methanogen archaea.
As the single producers of CH4, a reasonable assumption would consider an increased abundance of methanogens within the rumen environment, producing a greater CH4 emission. However, the composition, rather than the abundance, of the rumen methanogen is more closely related to CH4 production [144]. An earlier study with 21 dairy cows fed mixed diets containing concentrate and silage showed no differences in the abundance of methanogens between high and low CH4-emitter dairy cows [116]. However, the same authors reported an increased relative abundance of Methanobrevibacter gottschalkii (1.5-fold more abundant) and Methanobrevibacter ruminantium (1.3-fold more abundant) that was linked with high and low CH4-emitting dairy cows, respectively. In addition, Lettat et al. [151] reported that CH4 reduction was related to the decrease in protozoa populations in multiparous dairy cattle fed different types of silage diets (corn silage vs. alfalfa silages). Correspondingly, particular species of the methanogen archaea community, rather than the overall abundance of Archaea, were found to be related to enteric CH4 emissions in New Zealand sheep [70,114]. However, the precise mechanism causing the high and low CH4 emissions phenotypes detected in sheep and cattle remains unclear [19,82,152]. Concerning the microbial community structure, previous studies reported a decrease in CH4 production when the archaeal richness and diversity were reduced [82,153,154]. In addition to the alterations observed within the microbiome community structure, an adaptation in the methanogenic archaeal community structure toward less efficient CH4-producing species is still poorly defined, and deserves further investigation.
Ciliate protozoa are important H2 producers that play an essential role in the interspecies H2 transfer and CH4 emissions within the rumen microbial ecosystem [155,156]. A relatively strong interaction between protozoal numbers and CH4 emissions has been reported and suggests that protozoa might be a good target for CH4 mitigation [82,156,157]. Rumen methanogen archaea can represent as much as 1–2% of the host ciliate volume [158]. Up to 20% of rumen methanogens can be found attached to protozoa [159]. In addition, dietary strategies to reduce CH4 by eliminating or inhibiting ciliate protozoa were reviewed by Hegarty [160] and Boadi et al. [107]. These nutritional strategies to mitigate the protozoa population included an increase in the proportion of the grain-based diet, the use of selected fatty acids (lauric- [C12:0], myristic- [C14:0] or linolenic acid [C18:3]), trace minerals (Cu and Zn), and various feed additives, such as saponins, ionophore, and monensin. Rumen ciliate protozoa are prodigious H2 producers, the main substrate for methanogenesis in the rumen, and their removal (defaunation; protozoa-free) yielded an average 13–45% lower CH4 emissions in vivo [107,155,160,161], but the results are not always consistent [141,150,162,163]. Most studies have used sheep, goat, or beef cattle as experimental models, and the effects of defaunation on the productivity of highly productive dairy cows fed intensive diets are not well known [164]. As stated in previous data [165,166,167,168], the proportion of methanogens relative to total bacteria was more evenly distributed between the liquid and solid rumen content phases in wether sheep with unaltered protozoa populations, while defaunated sheep had a lower proportion of methanogens associated with the liquid phase. These results indicate that methanogenesis is regulated not only by methanogen activity, but also impacted by various factors such as diets and varying biological ecosystems with protozoa, bacteria (Firmicutes/Bacteroidetes), and fungi community diversity affected by VFA (acetate, butyrate, and propionate), H2, and other substrate availability [120,149,164,165]. Therefore, future work relating to microbial diversity and the function of this community associated with animal products, especially methanogens, could be helpful to improve our understanding of the mechanisms involved in methanogenesis pathways in the rumen. In addition, cost-effective ways to change the microbial ecology to reduce H2 production, to re-partition H2 into products other than CH4, or to promote methanotrophic microbes with the ability to oxidize CH4 still need to be found and developed.

6. Conclusions

New technologies offer the potential to manipulate the rumen microbiome through genetic selection and varying degrees by various dietary intervention strategies to reduce CH4 emissions. Strategies to reduce GHG emissions, however, still need to be developed, which increase ruminant production efficiency, whereas reducing the production of CH4 from cattle, sheep, and goats. Many of the approaches discussed are only partial strategies; all approaches to reducing enteric CH4 emissions should consider the economic impacts on farm profitability and the relationships between enteric CH4 and other GHG. Numerous dietary mitigation interventions have been identified, which could help reduce CH4 emissions, and other strategies currently being explored and identified. The greatest declines in CH4 emissions are likely to be achieved through a combination of approaches, including dietary modification and improved rumen fermentation for improving feed conversion efficiency.
Dietary manipulation influences CH4 production by directly influencing the rumen microbiome. There is the potential to affect the rumen fermentation profiles and microbiota community structure positively and meet sustainability goals by reducing CH4 emissions from cattle production systems. Increased animal productivity resulted in reduced enteric CH4 production per animal production (milk and ADG) and improved feed efficiency. Animal DMI, GEI, ECM, ADG, and A/P ratio are the most important predictors of CH4 production; however, diet quality and type, rumen fermentation profiles (acetate, propionate), and microbial community structure (methanogens, bacteria, protozoa) can significantly affect this relationship. Approaches to mitigating enteric CH4 emissions from beef and dairy cattle production can improve animal performance and feed efficiency, while helping to reduce atmospheric GHG emissions that contribute to global warming. One possible strategy to reduce GHG emissions is a beneficial modification of the rumen microbiome to maintain a low A/P ratio and limit H2 production via feed management. The populations of prevailing microbial types in the rumen (Firmicutes: Bacteroidetes ratio), ciliate protozoa, and methanogen archaea might have a role in adapting host biological parameters to reduce CH4 production, and can potentially be utilized to estimate CH4 emissions. Properly designed dietary interventions can reduce enteric CH4 production without detrimental impacts on animal production. Therefore, GHG reduction strategies should be established to increase ruminant production efficiency, while minimizing losses of CH4 energy from cattle production systems.
Author Contributions

B.-R.M. wrote the paper, S.L., R.C., H.J. and D.N.M. edited the paper. All authors have read and agreed to the published version of the manuscript.

Funding

This research received no external funding.

Institutional Review Board Statement

Not applicable.

Informed Consent Statement

Not applicable.

Data Availability Statement

Not available.

Conflicts of Interest

We declare that we have no financial and personal relationships with other people or organizations that can inappropriately influence our work, and there is no professional or other personal interest of any nature or kind in any product, service, and/or company that could be constructed as influencing the content of this paper.

References

  1. Knaap, J.R.; Laur, G.L.; Vadas, P.A.; Weiss, W.P.; Tricarico, J.M. Enteric methane in dairy cattle production: Quantifying the opportunities and impact of reducing emissions. J. Dairy Sci. 2014, 97, 3231–3261. [Google Scholar] [CrossRef] [PubMed] [Green Version]
  2. Intergovernmental Panel on Climate Change (IPCC). Climate Change 2014: Mitigation of Climate Change; Working Group 3 Contribution to the Fifth Assessment Report of the Intergovernmental Panel on Climate Change (IPCC); Cambridge University Press: New York, NY, USA, 2014; Technical Summary and Chapter 6 (Assessing Transformation Pathways); Available online: http://https://www.ipcc.ch/pdf/assessment-report/ar5/wg3/ipcc_wg3_ar5_full.pdf (accessed on 20 May 2021).
  3. Johnson, K.A.; Johnson, D.E. Methane emissions from cattle. J. Anim. Sci. 1995, 73, 2483–2492. [Google Scholar] [CrossRef] [PubMed]
  4. Min, R.R.; Pinchark, W.R.; Anderson, R.C.; Hume, M.E. In vitro bacterial growth and in vivo ruminal microbiota populations associated with bloat in steers grazing wheat forage. J. Anim. Sci. 2006, 84, 2873–2882. [Google Scholar] [CrossRef] [PubMed]
  5. Clarke, R.T.; Reid, C.S.W. Foamy bloat of cattle. A review. J. Dairy Sci. 1974, 57, 753–785. [Google Scholar] [CrossRef]
  6. The United States Environmental Protection Agency (USEPA). Inventory of U.S. Greenhouse Gas Emissions and Sinks, 1990–2019; EPA 430-R-21-005; USEPA: Washington, DC, USA, 2021; pp. 1–51. Available online: https://www.epa.gov/ghgemissions/inventory-us (accessed on 21 May 2021).
  7. Johnson, D.E.; Hill, T.M.; Ward, G.M.; Johnson, K.A.; Branine, M.E.; Carmean, B.R.; Lodman, D.W. Ruminants and other animals. In Atmospheric Methane: Sources, Sinks and Role in Global Change; Khalil, M.A.K., Ed.; NATO ASI Series 1: Global Environmental Change; Springer: Berlin/Heidelberg, Germany, 1993; Volume 13, pp. 219–229. [Google Scholar]
  8. Okine, E.K.; Basarab, J.A.; Laki, A.; Goonewardene, L.A.; Mir, P. Residual feed intake and feed efficiency: Differences and implications. In Florida Ruminant Nutrition Symposium; The University of Florida: Gainesville, FL, USA, 2004; Available online: http://dairy.ifas.ufl.edu/files/rns/2004/Okine.pdf (accessed on 23 May 2021).
  9. Cottle, D.J.; Nolan, J.V.; Wiedeman, S.G. Ruminant enteric methane mitigation: A review. Anim. Prod. Sci. 2011, 51, 491–514. [Google Scholar] [CrossRef]
  10. Beauchemin, K.A.; McGinn, S.M. Reducing Methane in Dairy and Beef Cattle Operations: What Is Feasible. 2020. Available online: www.prairiesoilsandcrops.ca (accessed on 10 November 2020).
  11. Ferris, C.P.; Gordon, F.J.; Patterson, D.C.; Porter, M.G.; Yan, T. The effect of genetic merit and concentrate proportion in the diet on nutrient utilization by lactating dairy cows. J. Agric. Sci. 1999, 132, 483–490. [Google Scholar] [CrossRef]
  12. Schils, R.L.M.; Verhagen, A.; Aarts, H.F.M.; Kuikman, P.J.; Šebek, L.B.J. Effect of improved nitrogen management on greenhouse gas emissions from intensive dairy systems in the Netherlands. Glob. Chang. Biol. 2006, 12, 382–391. [Google Scholar] [CrossRef]
  13. Patel, M.; Wredle, E.; Börjesson, G.; Danielsson, R.; Iwaasa, A.D.; Spörndly, E.; Bertilsson, J. Enteric methane emissions from dairy cows fed different proportions of highly digestible grass silage. Acta Agric. Scand. Anim. Sci. 2011, 61, 128–136. [Google Scholar] [CrossRef]
  14. Aguerre, M.J.; Wattiaux, M.A.; Powell, J.M.; Broderick, G.A.; Arndt, C. Effect of forage-to-concentrate ratio in dairy cow diets on the emission of methane, carbon dioxide, and ammonia, lactation performance, and manure excretion. J. Dairy Sci. 2011, 94, 3081–3093. [Google Scholar] [CrossRef]
  15. Yan, T.; Mayne, C.S.; Gordon, F.G.; Porter, M.G.; Agnew, R.E.; Patterson, D.C.; Ferris, C.P.; Kilpatrick, D.K. Mitigation of enteric methane emissions through improving the efficiency of energy utilization and productivity in lactation dairy cows. J. Dairy Sci. 2010, 93, 2630–2638. [Google Scholar] [CrossRef]
  16. Arndt, C.; Hristov, A.N.; Price, W.J.; McClelland, S.C.; Pelaez, A.; Welchez, S.F.C.; Oh, J.; Bannink, A.; Bayat, A.R.; Crompton, L.A.; et al. Successful strategies to reduce enteric methane emission from ruminants: A meta-analysis. J. Dairy Sci. 2020, 103, 157. Available online: https://www.adsa.org/Meetings/2020-Annual-Meeting (accessed on 15 January 2021).
  17. Beauchemin, K.A.; McGinn, S.M.; Martinez, T.F.; McAllister, T.A. Use of condensed tannin extract from quebracho trees to reduce methane emissions from cattle. J. Anim. Sci. 2007, 85, 1990–1996. [Google Scholar] [CrossRef] [PubMed] [Green Version]
  18. Beauchemin, K.A.; Kreuzer, M.; O’Mara, F.; McAllister, T.A. Nutritional management for enteric methane abatement: A review. Aust. J. Exp. Agric. 2008, 48, 21–27. [Google Scholar] [CrossRef]
  19. Waghorn, G.C.; Hegarty, R.S. Lowering ruminant methane emissions through improved feed conversion efficiency. Anim. Feed Sci. Technol. 2011, 166, 290–301. [Google Scholar] [CrossRef]
  20. Cottle, D.J.; Eckard, R.J. Global beef cattle methane emissions: Yield prediction by cluster and meta-analyses. Anim. Prod. Sci. 2018, 58, 2167–2177. [Google Scholar] [CrossRef]
  21. Patra, A.; Park, T.; Kim, M.; Yu, Z. Rumen methanogens and mitigation of methane emission by anti-methanogenic compounds and substances. J. Anim. Sci. Biotechnol. 2017, 8, 1–18. [Google Scholar] [CrossRef] [Green Version]
  22. Sniffen, C.J.; Herdt, H.H. The Veterinary Clinics of North America: Food Animal Practice; W.B. Saunders Company: Philadelphia, PA, USA, 1991; Volume 7. [Google Scholar]
  23. Enriquez-Hidalgo, D.; Gilliland, T.; Deighton, M.H.; O’Donovan, M.; Hennessy, D. Milk production and enteric methane emissions by dairy cows grazing fertilized perennial ryegrass pasture with or without the inclusion of white clover. J. Dairy Sci. 2014, 97, 1400–1412. [Google Scholar] [CrossRef]
  24. Jiao, H.P.; Dale, A.J.; Carson, A.F.; Murray, S.; Gordon, A.W.; Ferris, C.P. Effect of concentrate feed level on methane emissions from grazing dairy cows. J. Dairy Sci. 2014, 97, 7043–7053. [Google Scholar] [CrossRef]
  25. Lee, J.M.; Woodward, S.L.; Waghorn, G.C.; Clark, D.A. Methane emissions by dairy cows fed increasing proportions of white clover (Trifolium repens) in pasture. Proc. N. Z. Soc. Anim. Prod. 2004, 66, 151–155. [Google Scholar] [CrossRef]
  26. Wims, C.M.; Deighton, M.H.; Lewis, E.; O’Loughlin, B.; Delaby, L.; Boland, T.M.; O’Donovan, M. Effect of pre-grazing herbage mass on methane production, dry matter intake, and milk production of grazing dairy cows during the mid-season period. J. Dairy Sci. 2010, 93, 4976–4985. [Google Scholar] [CrossRef]
  27. Hollmann, M.; Powers, W.J.; Fogiel, A.C.; Liesman, J.S.; Bello, N.M.; Beede, D.K. Enteric methane emissions and lactational performance of Holstein cows fed different concentrations of coconut oil. J. Dairy Sci. 2012, 95, 2602–2615. [Google Scholar] [CrossRef] [PubMed]
  28. Moate, P.J.; Williams, S.R.O.; Jacobs, J.L.; Hannah, M.C.; Beauchemin, K.A.; Eckard, R.J.; Wales, W.J. Wheat is more potent than corn or barley for dietary mitigation of enteric methane emissions from dairy cows. J. Dairy Sci. 2017, 100, 7139–7153. [Google Scholar] [CrossRef] [PubMed] [Green Version]
  29. Grainger, C.; Williams, E.; Eckard, R.J.; Hannah, M.C. A high dose of monensin does not reduce methane emissions of dairy cows offered pasture supplemented with grain. J. Dairy Sci. 2010, 93, 5300–5308. [Google Scholar] [CrossRef] [PubMed]
  30. Lovett, D.K.; Stack, L.; Lovell, S.; Callan, J. Manipulating Enteric Methane Emissions and Animal Performance of Late-Lactation Dairy Cows through Concentrate Supplementation at Pasture. J. Dairy Sci. 2005, 88, 2836–2842. [Google Scholar] [CrossRef]
  31. Alvarez-Hess, P.S.; Williams, S.R.O.; Jacobs, J.L.; Hannah, M.C.; Beauchemin, K.A.; Eckard, R.J.; Wales, W.J.; Morris, G.L.; Moate, P.J. Effect of dietary fat supplementation on methane emissions from dairy cows fed wheat or corn. J. Dairy Sci. 2019, 102, 2714–2723. [Google Scholar] [CrossRef] [Green Version]
  32. Benchaar, C.; Hassanat, F.; Gervais, R.; Chouinard, P.Y.; Julien, C.; Petit, H.V. Effects of increasing amounts of corn-dried distillers’ grains with solubles in dairy cow diets on methane production, ruminal fermentation, digestion, N balance, and milk production. J. Dairy Sci. 2013, 96, 2413–2427. [Google Scholar] [CrossRef]
  33. Beauchemin, K.A.; McGinn, S.M.; Benchaar, C.; Holtshausen, L. Crushed sunflower, flax, or canola seeds in lactating dairy cow diets: Effects on methane production, rumen fermentation, and milk production. J. Dairy Sci. 2009, 92, 2118–2127. [Google Scholar] [CrossRef]
  34. Chilliard, Y.; Martin, C.; Rouel, J.; Doreau, M. Milk fatty acids in dairy cows fed whole crude linseed, extruded linseed, or linseed oil, and their relationship with methane output. J. Dairy Sci. 2009, 92, 5199–5211. [Google Scholar] [CrossRef]
  35. Van Zijderveld, S.M.; Fonken, B.C.J.; Dijkstra, J.; Gerrits, W.J.J.; Perdok, H.B.; Fokkink, W.B.; Newbold, J.R. Effects of a combination of feed additives on methane production, diet digestibility and animal performance in lactating dairy cows. J. Dairy Sci. 2011, 94, 1445–1454. [Google Scholar] [CrossRef] [Green Version]
  36. Moate, P.J.; Deighton, M.H.; Hannah, M.C.; Williams, S.R.O. Intake effects on methane emissions from dairy cows. In Proceedings of the Climate Change Research Strategy for Primary Industries (CCRSPI) Conference, Melbourne, Australia, 27–29 November 2012; pp. 60–61. [Google Scholar]
  37. Wilson, R.L.; Bionaz, M.; MacAdam, J.W.; Beauchemin, K.A.; Naumann, H.D.; Ates, S. Milk production, nitrogen utilization, and methane emissions of dairy cows grazing grass, forb, and legume-based pastures. J. Anim. Sci. 2020, 98, 1–13. [Google Scholar] [CrossRef]
  38. Huyen, N.T.; Desrues, O.; Alferink, S.J.J.; Zandstra, T.; Verstegen, M.W.A.; Hendrinks, W.H.; Pellikaan, W.F. The inclusion of sainfoin (Onobrychis viciifolia) silage in dairy cow rations affects nutrient digestibility, nitrogen utilization, energy balance, and methane emissions. J. Dairy Sci. 2016, 99, 3566–3577. [Google Scholar] [CrossRef] [PubMed]
  39. Hammond, K.J.; Jones, A.K.; Humphries, D.J.; Crompton, L.A.; Reynolds, C.K. Effects of diet forage source and neutral detergent fiber content on milk production of dairy cattle and methane emissions determined using Greenfeed and respiration chamber techniques. J. Dairy Sci. 2016, 99, 7904–7917. [Google Scholar] [CrossRef] [PubMed]
  40. Von Wyngaard, J.D.V.; Meeske, R.; Erasmus, L.J. Effect of concentrate level on enteric methane emissions, production performance, and rumen fermentation of Jersey cows grazing Kikuyu-dominant pasture during summer. J. Dairy Sci. 2018, 101, 9954–9966. [Google Scholar] [CrossRef] [PubMed] [Green Version]
  41. Holtschausen, L.; Chaves, A.V.; Beauchemin, K.A.; McGinn, S.M.; McAllister, T.A.; Odongo, N.E.; Cheeke, P.R.; Benchaar, C. Feeding saponin-containing Yucca schidigera and Quillaja saponaria to decrease enteric methane production in dairy cows. J. Dairy Sci. 2009, 92, 2809–2821. [Google Scholar] [CrossRef]
  42. Livingston, K.M.; Humphries, D.J.; Kirton, P.; Kliem, K.E.; Givens, D.I.; Reynolds, C.K. Effects of forage type and extruded linseed supplementation on methane production and milk fatty acid composition of lactating dairy cows. J. Dairy Sci. 2015, 98, 4000–4011. [Google Scholar] [CrossRef] [Green Version]
  43. Grainger, C.; Auldist, M.J.; Clarke, T.; Beauchemin, K.A.; McGinn, S.M.; Hannah, M.C.; Eckard, R.J.; Lowe, L.B. Use of monensin controlled-release capsules to reduce methane emissions and improve milk production of dairy cows offered pasture supplemented with grain. J. Dairy Sci. 2008, 91, 1159–1165. [Google Scholar] [CrossRef]
  44. Williams, S.R.; Chaves, A.; Deighton, M.H.; Morris, G.L.; Wales, W.J.; Moate, P. Influence of feeding supplements of almond hulls and ensiled citrus pulp on the milk production, milk composition, and methane emissions of dairy cows. J. Dairy Sci. 2018, 101, 2072–2083. [Google Scholar] [CrossRef]
  45. Gislon, G.; Colombini, S.; Borreani, G.; Crovetto, M.G.; Sandrucci, A.; Galassi, G.; Tabacco, E.; Rapetti, L. Milk production, methane emissions, nitrogen, and energy balance of cows fed diets based on different forage systems. J. Dairy Sci. 2020, 103, 8048–8061. [Google Scholar] [CrossRef]
  46. Cherif, C.; Hasanet, F.; Claveau, F.; Girard, R.; Gervais, R.; Benchaar, C. Faba bean (Vicia faba) inclusion in dairy cow diets: Effect on nutrient digestion, rumen fermentation, nitrogen utilization, methane production, and milk performance. J. Dairy Sci. 2018, 101, 8916–8928. [Google Scholar] [CrossRef]
  47. Olijhoek, D.W.; Hellwing, A.L.F.; Grevsen, K.; Haveman, L.S.; Chowdhury, M.R.; Lovendahl, P.; Weisbierg, M.R.; Noel, S.J.; Hojberg, O.; Wikinfg, L.; et al. Effect of dried oregano (Origanum vulgare L.) plant material in feed on methane production, rumen fermentation, nutrient digestibility, and milk fatty acid composition in dairy cows. J. Dairy Sci. 2019, 102, 9902–9918. [Google Scholar] [CrossRef]
  48. Van Wesemael, D.; Vandaele, L.; Ampe, B.; Cattrysse, H.; Duval, S.; Kindermann, M.; Fievez, V.; de Campeneere, S.; Peiren, N. Reducing enteric methane emissions from dairy cattle: Two ways to supplement 3-nitrooxypropanol. J. Dairy Sci. 2019, 102, 1780–1787. [Google Scholar] [CrossRef] [PubMed] [Green Version]
  49. Doreau, M.; Baumont, R. Greenhouse gas emissions in cattle breeding: Methane. Prod. Anim. -Paris-Inst. Natl. De La Rech. Agron. 2011, 24, 411–414. [Google Scholar]
  50. Meller, R.A.; Wenner, B.A.; Ashworth, J.; Gehman, A.M.; Lakritz, J.; Firkins, J.L. Potential roles of nitrate and live yeast culture in suppressing methane emission and influencing ruminal fermentation, digestibility, and milk production in lactating Jersey cows. J. Dairy Sci. 2019, 102, 6144–6156. [Google Scholar] [CrossRef] [PubMed]
  51. McCaughey, W.P.; Wittenbergand, K.; Corrigan, D. Impact of pasture type on methane production by lactating beef cows. Can. J. Anim. Sci. 1999, 79, 221–226. [Google Scholar] [CrossRef]
  52. Kurihara, M.; Magner, T.; Hunter, R.A.; McCrabb, G.J. Methane production and energy partition of cattle in the tropics. Br. J. Nutr. 1999, 81, 227–234. [Google Scholar] [CrossRef]
  53. McGinn, S.M.; Beauchemin, K.A.; Coates, T.; Colombatto, D. Methane emissions from beef cattle: Effects of monensin, sunflower oil, enzymes, yeast and fumaric acid. J. Anim. Sci. 2004, 82, 3346–3356. [Google Scholar] [CrossRef]
  54. Méo-Filho, P.; Berndt, A.; Marcondes, C.R.; Pedroso, A.F.; Sakamoto, L.S.; Boas, D.F.V.; Rodrigues, P.H.M.; Rivero, M.J.; Bueno, I.C.S. Methane emissions, performance, and carcass characteristics of different lines of beef steers reared on pasture and finished feedlot. Animals 2020, 10, 303. [Google Scholar] [CrossRef] [Green Version]
  55. Herd, R.M.; Arthur, P.F.; Bird, S.H.; Donoghue, K.A.; Hegarty, R.S. Genetic variation for methane traits in beef cattle. In Proceedings of the 10th World Congress on Genetics Applied to Livestock Production (WCGALP), Vancouver, QC, Canada, 17–22 August 2014. [Google Scholar]
  56. Beauchemin, K.A.; Janzen, H.H.; Little, S.M.; McAllister, T.A.; McGinn, S.M. Mitigation of greenhouse gas emissions from beef production in western Canada—Evaluation using farm-based life cycle assessment. Anim. Feed Sci. Technol. 2011. [Google Scholar] [CrossRef]
  57. Aboagye, I.A.; Oba, M.; Castillo, A.R.; Koenig, K.M.; Iwaasa, A.D.; Beauchemin, K.A. Effects of hydrolyzable tannin with or without condensed tannin on methane emissions, nitrogen use, and performance of beef cattle fed a high-forage diet. J. Anim. Sci. 2018, 96, 5276–5286. [Google Scholar] [CrossRef]
  58. Florentini, G.; Carvalho, I.; Messana, J.D.; Canesin, R.C. Effect of lipid sources with different fatty acid profiles on the intake, performance, and methane emissions of feedlot Nellore steers. J. Anim. Sci. 2015, 92, 1613–1620. [Google Scholar] [CrossRef] [Green Version]
  59. Owens, F.N.; Secrist, D.S.; Hill, W.J.; Gill, D.R. The effect of grain and grain processing on performance of feedlot cattle: A review. J. Anim. Sci. 1997, 75, 868–879. [Google Scholar] [CrossRef] [PubMed] [Green Version]
  60. McGeough, E.J.; O’kiely, P.; Foley, P.A.; Hart, K.J.; Boland, T.M.; Kenny, D.A. Methane emissions, feed intake, and performance of finishing beef cattle offered maize silages harvested at 4 different stages of maturity. J. Anim. Sci. 2010, 88, 1479–1491. [Google Scholar] [CrossRef] [PubMed] [Green Version]
  61. Neto, A.J.; Messana, J.D.; Ribeiro, A.F.; Vito, E.S.; Rossi, L.G.; Berchielli, T.T. Effect of starch-based supplementation level combined with oil on intake, performance, and methane emissions of growing Nellore bulls on pasture. J. Anim. Sci. 2015, 93, 2275–2284. [Google Scholar] [CrossRef] [Green Version]
  62. Jordan, E.; Kenny, D.A.; Hawkins, M.; Malone, R. Effect of refined soy oil or whole soybeans on intake, methane output, and performance of young bulls. J. Anim. Sci. 2006, 84, 2418–2425. [Google Scholar] [CrossRef] [PubMed] [Green Version]
  63. Jordan, E.; Lovett, D.K.; Monahan, F.J.; Callan, J.; Flynn, B.; O’Mara, F.P. Effect of refined coconut oil or copra meal on methane output and intake and performance of beef heifers. J. Anim. Sci. 2006, 84, 162–170. [Google Scholar] [CrossRef] [PubMed]
  64. Jiao, H.; Yan, T.; McDowell, D.A.; Carson, A.F.; Ferris, C.P.; Easson, D.L. Measurement of enteric methane emissions and the efficiency of utilization of energy and nitrogen in Holstein heifers and steers at age of six months. J. Anim. Sci. 2013, 91, 356–362. [Google Scholar] [CrossRef] [PubMed] [Green Version]
  65. Hünerberg, M.; McGinn, S.M.; Beauchemin, K.A.; Okine, E.K.; Harstad, O.M.; McAllister, T.A. Effect of dried distillers’ grains plus solubles on enteric methane emissions and nitrogen excretion from growing beef cattle. J. Anim. Sci. 2013, 91, 2846–2857. [Google Scholar] [CrossRef] [PubMed] [Green Version]
  66. Guyader, J.; Eugene, M.; Meunier, B.; Doreau, M.; Morgavi, D.P.; Silberberg, M.; Rochette, Y.; Gerard, C.; Loncke, C.; Martin, C. The additive methane-mitigating effect between linseed oil and nitrate fed to cattle. J. Anim. Sci. 2015, 93, 3564–3577. [Google Scholar] [CrossRef]
  67. Chiavegato, M.B.; Rowntree, J.E.; Carmichael, D.; Powers, W.J. Enteric methane from lactating beef cows managed with high- and low-input grazing systems. J. Anim. Sci. 2015, 93, 1365–1375. [Google Scholar] [CrossRef]
  68. Hammond, K.J.; Humphries, D.; Crompton, L.; Green, C.; Reynolds, C. Effects of forage source and extruded linseed supplementation on methane emissions from growing dairy cattle of differing body weights. J. Dairy Sci. 2015, 98, 8066–8077. [Google Scholar] [CrossRef] [Green Version]
  69. Pinares-Patiño, C.S.; Waghorn, G.C.; Hegarty, R.S.; Hoskin, S.O. Effects of intensification of pastoral farming on greenhouse gas emissions in New Zealand. N. Z. Vet. J. 2009, 57, 252–261. [Google Scholar] [CrossRef] [PubMed]
  70. Lettat, A.; Hassanat, F.; Benchaar, C. Corn silage in dairy cow diets to reduce ruminal methanogenesis: Effects on the rumen metabolically active microbial communities. J. Dairy Sci. 2013, 96, 5237. [Google Scholar] [CrossRef] [PubMed]
  71. Boland, T.M.; Quinlan, C.; Pierce, K.M.; Lynch, M.B.; Kelly, A.K.; Purcell, P.J. The effect of pasture pre-grazing vegetation mass on methane emissions, ruminal fermentation, and average daily gain of grazing beef heifers. J. Anim. Sci. 2013, 91, 3867–3874. [Google Scholar] [CrossRef] [PubMed]
  72. Judy, J.V.; Bachman, G.C.; Brown-Brandl, T.M.; Fernando, S.C.; Hales, K.E.; Miller, P.S.; Stowell, R.R.; Kononoff, P.J. Reducing methane production with corn oil and calcium sulfate: Responses on whole-animal energy and nitrogen balance in dairy cattle. J. Dairy Sci. 2019, 102, 2054–2067. [Google Scholar] [CrossRef] [PubMed] [Green Version]
  73. Charmley, E.; Williams, S.R.O.; Moate, P.J.; Hegarty, R.S.; Herd, R.M.; Oddy, V.H.; Reyenga, P.; Staunton, K.M.; Anderson, A.; Hannah, M.C. A universal equation to predict methane production of forage-fed cattle in Australia. Anim. Prod. Sci. 2016, 56, 169–180. [Google Scholar] [CrossRef] [Green Version]
  74. Hristov, A.N.; Oh, J.; Firkins, J.L.; Dijkstra, J.; Kebreab, E.; Waghorn, G.C.; Makkar, A.P.S.; Adesogan, A.T.; Yang, W.; Lee, C.; et al. Mitigation of methane and nitroxide emissions from animal operations: I. A review of enteric methane mitigation options. J. Anim. Sci. 2013, 91, 5045–5069. [Google Scholar] [CrossRef] [Green Version]
  75. Hristov, A.N.; Oh, J.; Lee, C.; Montes, M.R.; Ott, T.; Firkins, J.; Rotz, A.; Dell, C.; Adesogan, C.; Yang, W.; et al. Mitigation of Greenhouse Gas Emissions in Livestock Production: A Review of Technical Options for Non-CO2 Emissions; Gerber, P., Henderson, B., Makkar, H., Eds.; FAO Animal Production and Health; FAO: Rome, Italy, 2013; p. 177. [Google Scholar]
  76. Clark, H.; Pinares-Patiño, C.S.; de Klein, C.A.M. Methane and nitrous oxide emissions from grazed grasslands. In Grassland: A Global Resource; McGilloway, D.A., Ed.; Wageningen Academic: Wageningen, The Netherlands, 2005; pp. 279–293. [Google Scholar]
  77. Ku-Vera, J.C.; Castelan-Ortega, O.A.; Galindo-Maldonado, F.A.; Arango, J.; Chirinda, N.; Jimenez-Ocampo, R.; Valencia-Salazar, S.S.; Flores-Santiago, E.J.; Solorio-Sanchez, F.J. Review: Strategies for enteric methane mitigation in cattle-fed tropical forages. Animal 2020, 14, 453–463. [Google Scholar] [CrossRef]
  78. Archimède, H.; Rira, M.; Eugène, M.; Fleury, J.; Lastel, M.L.; Periacarpin, F.; Silou-Etienne, T.; Morgavi, D.P.; Doreau, M.Z. Intake, total tract digestibility and methane emissions of Texel and Blackbelly sheep fed C4 and C3 grasses were tested simultaneously in a temperate and a tropical area. J. Clean. Prod. 2018, 185, 455–463. [Google Scholar] [CrossRef]
  79. Hegarty, R.S.; Goopy, J.P.; Herd, R.M.; McCorkell, B. Cattle selected for lower residual feed intake have reduced daily methane production. J. Anim. Sci. 2006, 85, 1479–1486. [Google Scholar] [CrossRef]
  80. Ricci, P.; Rooke, J.A.; Nevison, I.; Waterhouse, A. Methane emissions from beef and dairy cattle: Quantifying the effect of physiological stage and diet characteristics. J. Anim. Sci. 2013, 91, 5379–5389. [Google Scholar] [CrossRef]
  81. Gardiner, T.D.; Coleman, M.D.; Innocenti, F.; Tompkins, J.; Connor, A.; Garnsworthy, P.C.; Moorby, J.M.; Reynolds, C.K.; Waterhouse, A.; Wills, D. Determination of the absolute accuracy of UK chamber facilities used in measuring methane emissions from livestock. Measurement. J. Int. Meas. Conf. 2015, 66, 272–279. [Google Scholar] [CrossRef]
  82. Min, B.R.; Solaiman, S.; Waldrip, H.M.; Parker, D.; Todd, R.W.; Brauer, D. Dietary mitigation of enteric methane emissions from ruminants: A review of plant tannins mitigation options. Anim. Nutr. 2020, 6, 231–246. [Google Scholar] [CrossRef] [PubMed]
  83. Hammond, K.J.; Humphries, D.J.; Westbury, D.B.; Thompson, A.; Crompton, L.A.; Kirton, P.; Green, C.; Reynolds, C.K. The inclusion of forage mixtures in the diet of growing dairy heifers: Impacts on digestion, energy utilization, and methane emissions. Agric. Ecosyst. Environ. 2014, 197, 88–95. [Google Scholar] [CrossRef]
  84. Hammond, K.J.; Humphries, D.; Crompton, L.; Green, C.; Reynolds, C. Methane emissions from cattle: Estimates from short-term measurements using a Green Feed system compared with measurements obtained using respiration chambers or Sulphur hexafluoride tracer. Anim. Feed Technol. 2015, 203, 41–52. [Google Scholar] [CrossRef]
  85. Hammond, K.J.; Muetzel, S.; Waghorn, G.G.; Pinares-Patino, C.S.; Burke, J.L.; Hoskin, S.O. The variation in methane emissions from sheep and cattle is not explained by the chemical composition of ryegrass. Proc. N. Z. Soc. Anim. Prod. 2009, 69, 174–178. [Google Scholar]
  86. Sandberg, L.-M.; Thaller, G.; Gors, S.; Kuhla, B.; Metges, C.C.; Krattenmacher, N. The relationship between methane emissions and daytime-dependent fecal archaeol concentration in lactating dairy cows fed two different diets. Arch. Anim. Breed. 2020, 3, 211–218. [Google Scholar] [CrossRef] [PubMed]
  87. Warner, D.; Bannink, A.; Hatew, B.; van Laar, H.; Dijkstra, J. Effects of grass silage quality and level of feed intake on enteric methane production in lactating dairy cows. J. Anim. Sci. 2017, 95, 3687–3700. [Google Scholar] [CrossRef]
  88. CSIRO. Nutrient Requirements of Domesticated Ruminants; Freer, M., Dove, H., Nolan, J.V., Eds.; CSIRO Plant Industry: Canberra, Australia, 2007. [Google Scholar]
  89. Intergovernmental Panel on Climate Change (IPCC). Agriculture, forestry and other land use. 2006 Intergovernmental Panel on Climate Change (IPCC) Guidelines for National Greenhouse Gas Inventories; Intergovernmental Panel on Climate Change (IPCC): Geneva, Switzerland, 2006; Volume 4. Available online: http://www.ipcc-nggip.iges.or.jp/public/2006gl/vol4.html (accessed on 2 February 2010).
  90. McMichael, A.J.; Powles, J.W.; Butler, C.D.; Uauy, R. Food, livestock production, energy, climate change, and health. Lancet 2007, 370, 1253–1263. [Google Scholar] [CrossRef]
  91. Johnson, D.E.; Ward, G.M. Estimates of animal methane emissions. Environ. Monit. Assess. 1996, 42, 133–141. [Google Scholar] [CrossRef]
  92. Blaxter, K.L.; Clapperton, J.L. Prediction of the amount of methane produced by ruminants. Br. J. Nutr. 1965, 19, 511–522. [Google Scholar] [CrossRef] [Green Version]
  93. Moe, P.W.; Tyrrell, H.F. Methane production in dairy cows. J. Dairy Sci. 1970, 62, 1583–1586. [Google Scholar] [CrossRef]
  94. Tyrrell, H.F.; Moe, P.W. Net energy value for lactation of a high and low concentrate ration containing corn silage. J. Dairy Sci. 1972, 55, 1106–1112. [Google Scholar] [CrossRef]
  95. Ellis, J.L.; Kebreab, E.; Odongo, N.E.; McBride, B.W.; Okine, E.K.; France, J. Prediction of methane production from dairy and beef cattle. J. Dairy Sci. 2007, 90, 3456–3467. [Google Scholar] [CrossRef] [PubMed]
  96. Rook, A.J.; Sutton, J.D.; France, J. Prediction of the yield of milk constituents in dairy cows offered silage ad libitum and concentrates at a flat rate. Anim. Sci. 1992, 54, 313–322. [Google Scholar] [CrossRef]
  97. Roseler, D.K.; Fox, D.G.; Pell, A.N.; Chase, L.E. Evaluation of alternative equations for prediction of intake for Holstein dairy cows. J. Dairy Sci. 1997, 80, 864–877. [Google Scholar] [CrossRef]
  98. Brouk, M.J.; Smith, J.D. Factors affecting dry matter intake by lactating dairy cows. Kans. Agric. Exp. Stn. Res. Rep. 2000, 54–58. [Google Scholar] [CrossRef] [Green Version]
  99. Martin, O.; Sauvant, D. Meta-analysis of input/output kinetics in lactating dairy cows. J. Dairy Sci. 2002, 85, 3363–3381. [Google Scholar] [CrossRef] [Green Version]
  100. Voelker, J.A.; Burato, G.M.; Allen, M.S. Effects of pretrial milk yield on responses of feed intake, digestion, and production to dietary forage concentration. J. Dairy Sci. 2002, 85, 2650–2661. [Google Scholar] [CrossRef] [Green Version]
  101. Hristov, A.N.; Hristov, K.A.; Price, W.J. Relationship between dry matter intake, body weight, and milk yield in dairy cows: A summary of published data. J. Dairy Sci. 2000, 83 (Suppl. 1), 260. [Google Scholar]
  102. Hristov, A.N.; Price, W.J.; Shafii, B. A meta-analysis examining the relationship among dietary factors, dry matter intake, and milk yield and milk protein yield in dairy cows. J. Dairy Sci. 2004, 87, 2184–2196. [Google Scholar] [CrossRef] [Green Version]
  103. Trupa, A.; Aplocina, E.; Degola, L. Forage quality and feed intake effect on methane emissions from dairy farming. In Proceedings of the 14th International Scientific Conference—Engineering Rural Development, Jelgava, Germany, 20–22 May 2015; pp. 601–605. [Google Scholar]
  104. Bernard, J.K.; Montgomery, M.J. Managing Intake of Lactating Dairy Cows; PB 1598; The University of Tennessee Agricultural Extension Service. 2020. Available online: https://extension.tennessee.edu/publications/Documents/pb1598.pdf (accessed on 20 May 2021).
  105. Bargo, F.; Varga, G.A.; Muller, L.D.; Kolver, E.S. Pasture intake and substitution rate; effects on nutrient digestion and nitrogen metabolism during continuous culture fermentation. J. Dairy Sci. 2003, 86, 1330–1340. [Google Scholar] [CrossRef] [Green Version]
  106. Min, B.R.; Hart, S.P.; Sahlu, T.; Satter, L.D. The Effect of Diets on Milk Production and Composition, and on Lactation Curves in Pastured Dairy Goats. J. Dairy Sci. 2005, 88, 2604–2615. [Google Scholar] [CrossRef] [Green Version]
  107. McGeough, E.J.; O’kiely, P.; Foley, P.A.; Hart, K.J.; Boland, T.M.; Kenny, D.A. Methane emissions, feed intake, performance, digestibility, and rumen fermentation of finishing beef cattle offered whole-crop wheat silages differing in grain content. J. Anim. Sci. 2010, 88, 2703–2716. [Google Scholar] [CrossRef] [PubMed] [Green Version]
  108. De Peters, E.J.; Cant, J.P. Nutritional factors influencing the nitrogen composition of bovine milk: A review. J. Dairy Sci. 1992, 75, 2043–2070. [Google Scholar] [CrossRef]
  109. Overman, O.R.; Gains, W.L. Milk-energy formulas for various breeds of cattle. J. Agric. Res. 1993, 46, 1109–1120. [Google Scholar]
  110. Gujer, W.; Zehnder, A.J.B. Conversion processes in anaerobic digestion. Water Sci. Technol. 1993, 15, 127–167. [Google Scholar] [CrossRef]
  111. Jetten, M.S.M.; Stams, A.J.M.; Zehnder, A.J.B. Methanogenesis from acetate: A comparison of the acetate metabolism in Methanothrix soehngenii and Methanosarcina spp. FEMS Microbiol. Lett. 1992, 88, 181–197. [Google Scholar] [CrossRef]
  112. Schnurer, A.; Schink, B.; Svensson, B.H. Clostridium ultunense sp. nov., a mesophilic bacterium oxidizing acetate in syntrophic association with a hydrogenotrophic methanogenic bacterium. Int. J. Syst. Bacteriol. 1996, 46, 1145–1152. [Google Scholar] [CrossRef]
  113. Westerholm, M.; Müller, B.; Arthurson, V.; Schnürer, A. Changes in the acetogenic population in a mesophilic anaerobic digester in response to increasing ammonia concentration. Microbes Environ. 2011, 26, 347–353. [Google Scholar] [CrossRef] [Green Version]
  114. Fotidis, I.; Karakashev, D.; Kotsopulos, T.A.; Martzopulos, G.G.; Angelidaki, I. Effect of ammonium and acetate on methanogenic pathway and methanogenic community composition. FEMS Microbiol. Ecol. 2013, 83, 38–48. [Google Scholar] [CrossRef] [Green Version]
  115. Kittelmann, S.; Pinares-Patiño, C.S.; Seedorf, H.; Kirk, M.R.; Ganesh, S.; McEwan, J.C.; Janssen, P.H. Two different bacterial community types are linked with the low-methane emission trait in sheep. PLoS ONE 2014, 9, e103171. [Google Scholar] [CrossRef] [PubMed]
  116. Van Nevel, C.J.; Demeyer, D.I. Control of rumen methanogenesis. Environ. Mon. Assess. 1996, 42, 73–77. [Google Scholar] [CrossRef] [PubMed]
  117. Danielsson, R.; Dicksved, J.; Sun, L.; Gonda, H.; Muller, B.; Schnurer, A.; Bertilsson, J. Methane production in dairy cows correlates with rumen methanogenic and bacterial community structure. Front. Microbiol. 2017, 8, 266. [Google Scholar] [CrossRef] [PubMed]
  118. Bergman, E.N. Energy contributions of volatile fatty acids from the gastrointestinal tract in various species. Physiol. Rev. 1990, 70, 567–590. [Google Scholar] [CrossRef] [Green Version]
  119. Millen, D.D.; Arrigoni, M.D.B.; Pacheco, R.D.L. Ruminology, 1st ed.; Springer International Publishing: Berlin, Germany, 2016. [Google Scholar]
  120. Moss, A.R.; Jouany, J.-P.; Newbold, J. Methane production by ruminants: Its contribution to global warming. Ann. Zootech. 2000, 49, 231–253. [Google Scholar] [CrossRef] [Green Version]
  121. Janssen, P.H. Influence of hydrogen on rumen methane formation and fermentation balances through microbial growth kinetics and fermentation thermodynamics. Anim. Feed Sci. Technol. 2010, 160, 1–22. [Google Scholar] [CrossRef]
  122. Weimer, P.J.; Cox, M.S.; de Paula, T.V.; Lin, M.; Hall, M.B.; Suen, G. Transient changes in milk production efficiency and bacterial community composition resulting from near total exchange of ruminal contents between high- and low-efficiency Holstein cows. J. Dairy Sci. 2017, 100, 7165–7182. [Google Scholar] [CrossRef]
  123. Janssen, P.H.; Kirs, M. Structure of the archaeal community of the rumen. Appl. Environ. Microbiol. 2008, 74, 3619–3625. [Google Scholar] [CrossRef] [Green Version]
  124. Pei, C.-X.; Mao, S.Y.; Cheng, Y.F.; Zhu, W.Y. Diversity, abundance and novel 16s rRNA gene sequences of methanogens in rumen liquid, solid and epithelium fractions of Jinnan cattle. Animal 2010, 4, 20–29. [Google Scholar] [CrossRef] [Green Version]
  125. McAllister, T.A.; Meale, S.J.; Valle, E.; Guan, L.L.; Zhou, M.; Kelly, W.J.; Henderson, G.; Attwood, G.T.; Janssen, P.H. Use of genomics and transcriptomics to identify strategies to lower ruminal methanogenesis. J. Anim. Sci. 2015, 93, 1431–1449. [Google Scholar] [CrossRef]
  126. Conrad, R.; Phelpsm, T.J.; Zeikus, J.G. Gas metabolism evidence in support of the juxtaposition of hydrogen-producing and methanogenic bacteria in sewage sludge and lake sediments. Appl. Environ. Microbiol. 1985, 50, 595–601. [Google Scholar] [CrossRef] [Green Version]
  127. Thiele, J.H.; Zeikus, J.G. Control of interspecies electron flow during anaerobic digestion: Role of floc formation in syntrophic methanogenesis. Appl. Environ. Microbiol. 1998, 54, 10–19. [Google Scholar] [CrossRef] [PubMed] [Green Version]
  128. Tokura, M.K.; Ushida, K.; Miyazaki, K.; Kojima, Y. Methanogens associated with rumen ciliates. FEMS Microbiol. Ecol. 1997, 22, 137–143. [Google Scholar] [CrossRef]
  129. Chaucheyras-Durand, F.; Masseglia, S.; Fonty, G.; Forano, E. Influence of the composition of the cellulolytic flora on the development of hydrogenotrophic microorganisms, hydrogen utilization, and methane production in the rumen of gnotobiotically reared lambs. Appl. Environ. Microbiol. 2010, 76, 7931–7937. [Google Scholar] [CrossRef] [PubMed] [Green Version]
  130. Latham, M.J.; Wolin, M.J. Fermentation of cellulose by Ruminococcus flavefaciens in the presence and absence of Methanobacterium ruminantium. Appl. Environ. Microbiol. 1977, 34, 297–301. [Google Scholar] [CrossRef] [PubMed] [Green Version]
  131. Miller, T.L.; Wolin, M.J. Formation of hydrogen and formate by Ruminococcus albus. J. Bacteriol. 1973, 116, 836–846. [Google Scholar] [CrossRef] [Green Version]
  132. Wolin, M.J.; Miller, T.L.; Stewart, C.S. Microbe-microbe interactions. In The Rumen Microbial Ecosystem; Hobson, P.N., Stewart, C.S., Eds.; Springer: Dordrecht, The Netherlands; London, UK, 1997; pp. 467–491. [Google Scholar]
  133. Kim, S.H.; Mamuad, L.L.; Choi, Y.J.; Sung, H.G.; Cho, K.K.; Lee, S.S. Effects of reductive acetogenic bacteria and lauric acid on in vivo ruminal fermentation, microbial populations, and methane mitigation in Hanwoo steers in South Korea. J. Anim. Sci. 2018, 96, 4360–4367. [Google Scholar] [CrossRef]
  134. Ley, R.E.; Bäckhed, F.; Turnbaugh, P.; Lozupone, C.A.; Knight, R.D.; Gordon, J.I. Obesity alters gut microbial ecology. Proc. Natl. Acad. Sci. USA 2005, 102, 11070–11075. [Google Scholar] [CrossRef] [Green Version]
  135. Ley, R.E.; Peterson, D.A.; Gordon, J.I. Ecological and evolutionary forces shaping microbial diversity in the human intestine. Cell 2006, 124, 837–848. [Google Scholar] [CrossRef] [PubMed] [Green Version]
  136. Guo, X.; Xia, X.; Tang, R.; Zhou, J.; Zhao, H.; Wang, K. Development of a real-time PCR method for Firmicutes and Bacteroidetes in feces and its application to quantify intestinal population of obese and lean pigs. Lett. Appl. Microbiol. 2008, 47, 367–373. [Google Scholar] [CrossRef] [PubMed]
  137. Henderson, G.; Cox, F.; Ganesh, S.; Jonker, A.; Young, W.; Janssen, P.H. Rumen microbial community composition varies with diet and host, but a core microbiome is found across a wide geographical range. Sci. Rep. 2015, 5, 14567. [Google Scholar] [CrossRef] [PubMed]
  138. Min, B.R.; Castleberry, L.; Allen, H.; Parker, D.; Waldrop, H.; Brauer, D.; Willis, W. Associative effect of wet distillers’ grains plus solubles and tannin-rich peanut skin supplementation on in vitro rumen fermentation, greenhouse gas emissions, and microbiome changes. J. Anim. Sci. 2019, 97, 4668–4681. [Google Scholar] [CrossRef] [PubMed]
  139. Min, B.R.; Gurung, N.; Shange, R.; Solaiman, S. Potential role of rumen microbiota in altering average daily gain and feed efficiency in meat goats fed simple and mixed pastures using bacterial tag-encoded FLX amplicon pyrosequencing. J. Anim. Sci. 2019, 97, 3523–3534. [Google Scholar] [CrossRef]
  140. Matthews, C.; Crispie, F.; Lewis, E.; Reid, M.; O’Toole, P.W. Cotter The rumen microbiome: A crucial consideration when optimising milk and meat prodction and nitrogen utilisation efficiency. Gut Microbes 2019, 10, 115–132. [Google Scholar] [CrossRef] [PubMed]
  141. Bird, S.H.; Hegarty, R.S.; Woodgate, R. Persistence of defaunation effects on digestion and methane production in ewes. Aust. J. Exp. Agric. 2008, 48, 152–155. [Google Scholar] [CrossRef]
  142. Stewart, C.S.; Flint, H.J.; Bryant, M.P. The rumen bacteria. In The Rumen Microbial Ecosystem; Hobson, P.N., Stewart, C.S., Eds.; Springer: Dordrecht, The Netherlands; London, UK, 1997; pp. 10–72. [Google Scholar]
  143. Ungerfeld, E.M. Shifts in metabolic hydrogen sinks in the methanogenesis-inhibited ruminal fermentation: A meta-analysis. Front. Microbiol. 2015, 6, 10–17. [Google Scholar] [CrossRef]
  144. Hungate, R.E. Hydrogen as an intermediate in rumen fermentation. Arch. Microbiol. 1967, 59, 158–164. [Google Scholar] [CrossRef]
  145. Colucci, P.E.; MacLeod, G.K.; Grovum, W.L.; McMillan, I.; Barney, D.J. Digesta kinetics in sheep and cattle fed diets with different forage to concentrate ratios at high and low intakes. J. Dairy Sci. 1990, 73, 2143–2156. [Google Scholar] [CrossRef]
  146. Gill, F.L.; Dewhurst, R.J.; Evershed, R.P.; McGeough, E.; O’Kiely, P.; Pancost, R.D.; Bull, I.D. Analysis of archaeal ether lipids in bovine feces. Anim. Feed Sci. Technol. 2011, 66, 87–92. [Google Scholar] [CrossRef]
  147. Goopy, J.P.; Donaldson, A.; Hegarty, R.; Vercoe, P.E.; Haynes, F.; Barnett, M.; Oddy, V.; Hutton, V. Low-methane yield sheep have smaller rumens and shorter rumen retention time. Br. J. Nutr. 2014, 111, 578–585. [Google Scholar] [CrossRef] [Green Version]
  148. Pinares-Patino, C.S.; Uylatt, M.J.; Lassey, K.R.; Barry, T.N.; Holmes, C.W. Rumen function and digestion parameters associated with differences between sheep in methane emissions when fed chaffed lucerne hay. J. Agric. Sci. 2003, 140, 205–214. [Google Scholar] [CrossRef] [Green Version]
  149. Leahy, S.W.; Kelly, R.; Ronimus, N.; Wedlock, E.; Altermann, A.; Attwood, G.T. Genome sequencing of rumen bacteria and archaea and its application to methane mitigation strategies. Animal 2013, 7, 235–243. [Google Scholar] [CrossRef] [Green Version]
  150. Chen, S.; Cheng, H.; Wyckoff, K.N.; He, Q. Linkages of Firmicutes and Bacteroidetes populations to methanogenic process performance. J. Int. Micro. Biotech. 2017, 43, 771–781. [Google Scholar] [CrossRef] [PubMed]
  151. Tapio, I.; Snelling, T.J.; Strozzi, F.; Wallace, R.J. The ruminal microbiome associated with methane emissions from ruminant livestock. J. Anim. Sci. Biotechnol. 2017, 8, 1–11. [Google Scholar] [CrossRef]
  152. Shi, W.; Moon, C.D.; Leahy, S.C.; Kang, D.; Foula, J.; Kittelmann, S.; Fan, C.; Deutsch, S.; Gagic, D.; Seedorf, H.; et al. Methane yield phenotypes linked to differential gene expression in the sheep rumen microbiome. Genome Res. 2014, 24, 1517–1525. [Google Scholar] [CrossRef] [PubMed] [Green Version]
  153. McDonnell, R.P.; Hart, J.K.; Boland, T.M.; Kelly, A.K.; McGee, M.; Kenny, D.A. Effect of divergence in phenotypic residual feed intake on methane emissions, ruminal fermentation, and apparent whole-tract digestibility of beef heifers across three contrasting diets. J. Anim. Sci. 2016, 94, 1179–1193. [Google Scholar] [CrossRef] [PubMed] [Green Version]
  154. Zhou, M.; Hernandez-Sanabria, E.; Guan, L.L. Assessment of the microbial ecology of ruminal methanogens in cattle with different feed efficiencies. Appl. Environ. Microbiol. 2009, 75, 6524–6533. [Google Scholar] [CrossRef] [Green Version]
  155. Popova, M.; Martin, C.; Eugene, M.; Mialon, M.M.; Doreau, M.; Morgavi, D.P. Effect of fibre- and starch-rich finishing diets on methanogenic Archaea diversity and activity in the rumen of feedlot bulls. Anim. Feed Sci. Technol. 2011, 166–167, 113–121. [Google Scholar] [CrossRef] [Green Version]
  156. Morgavi, D.P.; Jouany, J.P.; Martin, C. Changes in methane emission and rumen fermentation parameters induced by defaunation in sheep. Aust. J. Exp. Agric. 2008, 48, 69–72. [Google Scholar] [CrossRef]
  157. Kumar, S.; Puniya, A.K.; Puniya, M.; Daga, R.; Sirohi, S.K.; Singh, K.; Griffith, G.W. Factors affecting rumen methanogens and methane mitigation strategies. World J. Microbiol. Biotechnol. 2009, 25, 1557–1566. [Google Scholar] [CrossRef]
  158. Newbold, C.J.; Fuent, G.; Belanche, A.; Ramos-Morales, E.; McEwan, N.R. The role of ciliate protozoa in the rumen. Front. Microbiol. 2015, 6, 1–14. [Google Scholar] [CrossRef] [PubMed] [Green Version]
  159. Finlay, B.J.; Esteban, G.; Clarke, K.J.; Williams, A.G.; Embley, T.; Hirt, R.P. Some rumen ciliates have endosymbiotic methanogens. FEMS Microbiol. Lett. 1994, 117, 157–162. [Google Scholar] [CrossRef] [PubMed]
  160. Stumm, C.K.; Gijzen, H.J.; Vogels, G.D. Association of methanogenic bacteria with ovine rumen ciliates. Br. J. Nutr. 1982, 47, 95–99. [Google Scholar] [CrossRef] [Green Version]
  161. Hegarty, R.S. Reducing rumen methane emissions through the elimination of rumen protozoa. Aust. J. Agric. Res. 1999, 50, 1321–1327. [Google Scholar] [CrossRef]
  162. Jouany, J.P.; Ushida, K. The role of protozoa in feed digestion. Asian-Aust. J. Anim. Sci. 1998, 12, 113–128. [Google Scholar] [CrossRef]
  163. Machmuller, A.; Soliva, C.R.; Kreuzer, M. Effect of coconut oil and defaunation treatment on methanogenesis in sheep. Reprod. Nutr. Dev. 2003, 43, 41–55. [Google Scholar] [CrossRef] [Green Version]
  164. Hegarty, R.S.; Bird, S.H.; Vanselow, B.A.; Woodgate, R. Effects of the absence of protozoa from birth or from weaning on the growth and methane production of lambs. Br. J. Nutr. 2008, 100, 1220–1227. [Google Scholar] [CrossRef] [Green Version]
  165. Eugène, M.; Archimède, H.; Sauvant, D. Quantitative meta-analysis on the effects of defaunation of the rumen on growth, intake and digestion in ruminants. Livest. Prod. Sci. 2004, 85, 81–97. [Google Scholar] [CrossRef]
  166. Morgavi, D.P.; Martin, C.; Jouany, J.P.; Ranilla, M.J. Rumen protozoa and methanogenesis: Not a simple cause-effect relationship. Br. J. Nutr. 2012, 107, 388–397. [Google Scholar] [CrossRef] [Green Version]
  167. Morgavi, D.P.; Forano, E.; Martin, C.; Newbold, C.J. Microbial ecosystem and methanogenesis in ruminants. Animal 2010, 4, 1024–1036. [Google Scholar] [CrossRef] [Green Version]
  168. Morgavi, D.P.; Rahahao-Paris, E.; Popova, M.; Boccard, J. Rumen microbial communities influence metabolic phenotypes in lambs. Front. Microbiol. 2015, 6, 1–13. [Google Scholar] [CrossRef] [Green Version]
Figure 1. Effects of dry matter intake (DMI) and gross energy intake (GEI) on average daily methane emission (g CH4/d) in dairy (a,c) and beef cattle (b,d). Source: Adapted from Table 2, Table 3, Table 4, Table 5, Table 6 and Table 8. It shows the regression plots with 95% prediction and confidence limits for mean and individual predicted values of the dependent variable methane production (CH4ⅈ). Selected studies of methane (CH4) emissions associated with dry matter intake (DMI, kg/d) and gross energy intake (GEI, %).
Animals 12 00948 g001
Figure 2. The effects of dry matter intake (DMI) on milk production (a) and average daily gain (ADG); (b) in dairy and beef cattle. Source: Adapted from Table 2, Table 3, Table 4, Table 5, Table 6 and Table 8. It shows the regression plots with 95% prediction and confidence limits for mean and individual predicted values of the dependent variables of milk production and ADG.
Animals 12 00948 g002
Figure 3. The effect of milk production (a) and average daily gain (ADG); (b) on methane (CH4) emissions in dairy and beef cattle fed grain-based (c,e); feedlot or dairy TMR diets) and forage-based (d,f); grazing or silage supplementation) diets, respectively. Source: Adapted from Table 2 and Table 4. It shows the regression plots with 95% prediction and confidence limits for mean and individual predicted values of the dependent variable CH4ⅈ.
Animals 12 00948 g003aAnimals 12 00948 g003b
Figure 4. The effect of methane (CH4 g/d) emissions per unit of energy-corrected milk (g/kg ECM) in dairy cattle. It shows the regression plots with 95% prediction and confidence limits for mean and individual predicted values of the dependent variable. Source: Adapted from Table 6.
Animals 12 00948 g004
Figure 5. Relationship between methane (CH4) production and volatile fatty acids (VFA) and acetate/propionate (A/P) ratio in dairy and beef cattle. It shows the regression plots with 95% prediction and confidence limits for mean and individual predicted values of the dependent variable. Source: [14,26,27,28,29,31,33,34,35,41,44,45,46,49,50,51,52,53,54,55,56,57,58,61,62,63,64,65,66,67,69,70,71].
Animals 12 00948 g005aAnimals 12 00948 g005b
Figure 6. Organic matter (OM) degradation and methanogenesis pathways in the rumen under anaerobic conditions. Source: [14,17,27,32,34,42,44,45,48,52,53,55,56,59,60,65,67,71,72]. VFA = volatile fatty acids.
Animals 12 00948 g006
Table 1. Typical composition of rumen gases.
ItemAverage Percentage (%)
Hydrogen (H2)0.2
Oxygen (O2)0.5
Nitrogen (N2)7.0
Methane (CH4)20–30
Carbon dioxide (CO2)45–75
Nitrous oxide (N2O)minor
Hydrogen sulfate (H2S)minor
Source: [4,5].
Table 2. Enteric methane (CH4) emissions and milk yield (MY) from dairy cattle.
BreedMethodDietNo. of AnimalsBWDMIMilk Yield (MY)CH4Ref
kg/dkg/dg/dg/kg DMIg/kg MYg/kg ECM% GEI
Holstein–FriesianSF6PRG15-1519.0360.524.526.5--[22]
PRG + WC15 16.519.8353.621.526--
HolsteinSF62 kg corn + grazing 11057714.519.62872015.414.1-[23]
4 kg corn + grazing1055214.222.427319.312.912.5-
6 kg corn + grazing1056515.525.927217.711.211.4-
8 kg corn + grazing1057015.426.527718.110.811.1-
HolsteinSF60% WC8-15.617.6332.621.715.3-6.8[24]
15% WC8-17.617.9364.620.917.4-6.6
30% WC8-18.619.3344.218.618.5-5.8
60% WC8-20.520.4371.618.120.5-5.6
HolsteinSF61000 kg DM/ha 22349516.922.22861713-5.4[25]
2200 kg DM/ha 2350715.421.528618.713.6-6.3
1000 kg DM/ha 2350014.61827819.216.4-6.4
2200 kg DM/ha2349414.61732022.319.9-7.4
HolsteinRC0% COC-oil 38-22.937.146421.112.5-6.42[26]
1.3% COC-oil8-21.437.544921.311.9-6.35
2.7% COC-oil8-17.933.729117.48.6-5.19
3.3% COC-oil8-16.232.425316.77.8-4.94
HolsteinSF6Corn 4853722.232.144620.3-14.86.12[27]
Wheat853721.132.330014.3-10.84.28
Single-rolled barley853722.631.351822.9-16.66.98
Double-rolled barley853722.730.653323.4-17.87.15
HolsteinSF6CON10-25.731.952020.215.8--[28]
Monensin 510-25.732.853420.815.4--
Control10-23.3 43320.215.2--
Monensin10-22.7 43820.815.3--
Control10-20.0 4292013.2--
Monensin10-20.2 43520.213--
Control10-20.932.546622.516.5--
Monensin10-20.033.347023.716.2--
HolsteinSF6Low-corn 61058217.717.5534619.621--[29]
High-corn1058221.522.7239917.817.7--
HolsteinSF6Corn 7863520.721.152425.5-247.6[30]
Wheat863521.323.863729.9-24.49.1
Corn + oil863521.726.152324.1-21.37
Wheat + oil863521.824.956926.2-25.87.7
HolsteinRC0% DGGS 8470024.232.649520.615.6-6.09[31]
10% DGGS470124.635.149020.114.2-5.8
20% DGGS469724.435.847719.713.6-5.61
30% DGGS469825.336.647518.913.2-5.23
HolsteinRCBarley control 91661618.726.629316.317.412.44.9[32]
Sunflower seeds1662319.526.726414.617.911.74.3
Flaxseed166191926.824113.412.210.53.9
Canola seed1661920.12726513.78.111.44
HolsteinSF6Corn silage-based 10867219.823418.121.1-19.36.7[33]
Corn + CLS867219.521.5369.418.9-16.45.7
Corn + ELS867216.720.8258.115.5-14.84.8
Corn + LSO867214.718.9149.210.2-9.33
HolsteinRCCON 1110-16.428.936222.112.8-6.2[34]
Feed additives10-15.926.132520.512.7-5.7
Control6-2032-- --
Feed additives6-19.833.2-- --
HolsteinRC47 Forage: 53 Conc 12854620.738.853825.914--[14]
54 forage: 46 Conc854621.038.459728.215.9--
61 forage: 39 Conc854620.236.958629.116.1--
68 Forage: 32 Conc854620.236.964831.917.8--
JerseySF6Grasses948015.620.532520.714.914.2-[35]
Legumes948016.52227817.414.713.1-
Forbes94801722.934820.214.713.1-
HolsteinRCLow13-intake 17-15.825.130819.712.311.15.7[36]
Low-intake 27-15.722.635322.616.1146.6
Low-intake 37-1622.135722.216.315.16.6
Low-intake 47-14.520.934524.316.814.36.9
High-intake 17-16.829.532119.311.110.35.5
High-intake 27-16.427.635421.412.911.96.4
High-intake 37-16.928.536521.712.812.66.4
High-intake 47-16.22836422.813.213.16.6
HolsteinRCGrass silage6132.517.822.01365.520.617.615.815.86[37]
Sainfoin silage6132.518.724.08360.819.415.514.365.71
JerseySF6CON1138511.29.0332329.135.528.8-[38]
4 kg Conc1138912.81436728.925.121.2-
8 kg Conc1138815.617.737825.121.117.6-
HolsteinGFHigh-CS 141067725.235.641016.11.7--[39]
RCHigh-CS + NDF1067724.133.346118.914.2--
High-GS1066519.5304602415.6--
High-GS + NDF10661192846024.116.4--
High-CS469321.732.949521.815.6--
High-CS + NDF468820.530.747223.715.8--
High-GS466418.429.546225.515.4--
High-GS + NDF46761727.141824.216.3--
HolsteinRCCON6626.521.830.5416.819.2--5.7[40]
Yucca6629.62231415.419--5.63
Quillaja6625.821.230.3384.918.5--5.48
SF6Control6626.521.830.5325.316.1--4.76
Yucca 46629.621.53135917--5.03
Quillaja 46625.822.130.333915.4--4.57
HolsteinRCCorn silage (CS) 154643.420.336.159829.516.5--[41]
CS + linseed oil4643.421.237.458027.415.5--
Grass silage (GS)4643.419.235.756729.516.1--
GS + linseed oil4643.419.735.455328.115.7--
HolsteinRCGrazing734118.419.0630916.716.2--[42]
Monensin736518.019.513061715.7--
HolsteinSF6Control12614.622.627.240017.814.8-5.4[43]
Almond hull10614.622.624.543019.117.7-5.8
Citrus pulp10614.621.026.14141916.6-6
HolsteinRCCS 16, 49.3%860820.32737818.614.4-5.67[44]
AS, 26.8%860820.927.33961914.8-5.92
WS, 20%860820.928.23961914.4-5.78
Hay-based, 25.3%860823.429.341317.814.2-5.59
HolsteinRCControl966021.314.853921.314.8-6.44[45]
Ground Feba bean966020.31553320.315-6.13
Rolled Feba bean96602115.25442115.2-6.33
HolsteinRCCON 17454119.227.846122.8--6.73[46]
Low- oregano454119.429.845522--6.49
Medium- oregano454119.929.946422.2--6.56
High- oregano454119.22845122.2--6.56
HolsteinRCCON471221.724.150223.4--6.87[46]
Low- oregano471220.923.248723.4--6.89
Medium- oregano471221.823.352023.6--6.92
High- oregano471221.323.248523--6.76
HolsteinGFCON10-22.528.252523.5---[47]
3-NOP + hay10-21.326.738018.1---
3-NOP + Conc10-22.32840318.6---
Control10-23.431.349421.5---
3-NOP + hay10-23.63148620.7---
3-NOP + Conc10-23.532.848220.8---
Control10-20.92546421.8---
3-NOP + hay10-21.222.742720.2---
3-NOP + Conc10-22.425.246421.2---
JerseyGFCON 184-18.219.8362.619.9---[48]
CON + yeast4-18.620.8364.219.6---
NO34-17.219.6303.217.6---
NO3+ yeast4-16.619.3301.618.2---
Holstein/RCCON 194508.119.126.3421.622.3---[49]
Jersey DGGS4513.420.127.5421.921.4---
DGGS+ corn oil4513.22028.3384.719.9---
DGGS+ CaS4510.719.627.6381.419.6---
No. of Observation 127
BW = body weight; COC = coconut; CON = control; Conc = concentrate; DGGS = dried distillers’ grains solubles; DMI = dry matter intake; ECM= energy-corrected milk; GEI = gross energy intake; GF= GreenFeed system (C-Lock, ND); MF = milk fat; MP = milk protein; MS = milk solid; MY = milk yield; N = number of animals; RC: open-circuit respiration chamber; PRG = perennial rye grass; Ref = reference; SF6 = sulfur hexafluoride; WC = white clover; 3-nitrooxypropanol (3-NOP). 1 The effect of concentrate (Conc) feed level (2.0, 4.0, 6.0, and 8.0 kg/cow per day; fresh basis) on enteric CH4 emissions from cows grazing perennial ryegrass-based swards; 2 1000 kg of dry matter (DM)/ha (low herbage mass, LHM) or 2200 kg of DM/ha (high herbage mass, HHM); 3 Diets differed in concentrations of coconut (COC) oil: 0.0 (control) or 1.3, 2.7, or 3.3% COC, DM basis; 4 Offered 1 of 4 diets: corn diet of 10.0 kg of DM/d of single-rolled corn grain, 1.8 kg of DM/d of canola meal, 0.2 kg of DM/d of minerals, and 11.0 kg of DM/d of chopped alfalfa hay; a wheat diet (WHT) similar to the corn diet but with the corn replaced by single-rolled wheat; a barley diet (SRB) similar to the corn diet but with the corn replaced by single-rolled barley; and a barley diet (DRB) similar to the corn diet but with the corn replaced by double-rolled barley; 5 Monencin = 471 mg/cow/d on top-dressed on 4 kg (DM)/d of rolled barley grain offered in a feed trough twice daily at milking times; 6 The two levels of concentrate supplementation (1 vs. 6 kg/animal daily) were randomly allocated within blocks, giving 12 animals per treatment; 7 The corn diet included 8.0 kg of DM/d of crushed corn grain, the wheat diet (WHT) included 8.0 kg of DM/d of crushed wheat grain, the corn plus fat diet (CPF) included 8.0 kg of DM/d of crushed corn grain and 0.80 kg/d of canola oil, and the wheat plus fat diet (WPF) included 8.0 kg of DM/d of crushed wheat grain and 0.80 kg/d of canola oil; 8 The dietary treatments were: (1) 0% dried distillers’ grains solubles (DDGS), (2) 10% DDGS, (3) 20% DDGS, and (4) 30% DDGS, on a DM basi; 9 The dietary treatments were: (1) a commercial source of calcium salts of long-chain fatty acids (CTL), (2) crushed sunflower seeds (SS), (3) crushed flaxseed (FS), and (4) crushed canola seed (CS). The oilseeds added 3.1 to 4.2% fat to the diet (DM basis); 10 A control diet (CON) based on corn silage (59%) and concentrate (35%), and the same diet supplemented with whole crude linseed (CLS), extruded linseed (ELS), or linseed oil (LSO) at the same fatty acids (FA) level (5% of dietary DM); 11 The mixture of feed additives contained lauric acid, myristic acid, linseed oil, and calcium fumarate. These additives were included at 0.4, 1.2, 1.5, and 0.7% of dietary DM, respectively; 12 Concentrate:forage ratio: 47:53, 54:46, 61:39, and 68:32, DM basis. Forage consisted of alfalfa silage and corn silage in a 1:1 ratio; 13 Diets contained grass silage, corn silage, and a compound feed meal was 70:10:20% on a DM basis, respectively. Treatments consisted of 4 grass silage qualities prepared from a grass harvested from leafy through the late heading stage and offered to dairy cows; 14 High corn silage (CS) versus high grass silage (GS), without or with added neutral detergent fiber (NDF); 15 Diets contained 500 g of forage/kg of DM containing corn silage (CS) and grass silage (GS) in proportions (DM basis) of either 75:25 or 25:75 for high CS or high GS diets, respectively. Extruded linseed supplement (275 g/kg ether extract, DM basis) was included in treatment diets at 50 g/kg of DM.; 16 Corn silage (CS), alfalfa silage (AS), wheat silage (WS), and a typical hay-based diet (alfalfa/Italian ryegrass hays) were used; 17 Experiment 1 used low essential oil (EO) oregano (0.12% EO of oregano DM) and evaluated a control (C) diet with no oregano and 3 oregano diets with 18 (low; L), 36 (medium; M), and 53 g of oregano DM/kg of dietary DM (high; H). Experiment 2 used high EO oregano (4.21% EO of oregano DM) with 0, 7, 14, and 21 g of oregano DM/kg of dietary DM for C, L, M, and H, respectively. Oregano was added to the diets by substituting grass/clover silage on a DM basis; 18 Diets containing either urea or 1.5% NO3− (DM basis; isonitrogenous to control) and without or with Saccharomyces cerevisiae (Alltech Inc.); 19 Treatments were composed of control (CON) diet, which did not contain reduced-fat distiller’s grain and solubles (DDGS), and treatment diets containing 20% (dry matter basis) DDGS (DG), 20% DDGS with 1.38% (dry matter basis) added corn oil (CO), and 20% DDGS with 0.93% (DM basis) added calcium sulfate (CaS); Source: [14,22,23,24,25,26,27,28,29,30,31,32,33,34,35,36,37,38,39,40,41,42,43,44,45,46,47,48,49].
Table 3. The ordinary least squares regression (OLS) estimates of milk production (a) and dry matter intake (DMI) impacts on methane production (CH4) in dairy and beef cattle production, and dairy and beef cattle fed grain-based and forage-based diets.
Model 1Model 2Model 3Model 4Model 5Model 6
Dairy CattleBeef CattleDairy Cattle; Grain-BasedDairy Cattle; Forage-BasedBeef Cattle; Grain-BasedBeef Cattle; Forage-Based
Variable CH4 ProductionCH4 ProductionCH4 ProductionCH4 ProductionCH4 ProductionCH4 Production
Milk Production 9.82-3.146.54--
(p < 0.001) (p = 0.12)(p < 0.01)
ADG-117.33--151.26143
(p < 0.01) (p < 0.01)(p < 0.01)
Intercept 142.6938.34327.0922.9111.2949.01
R-Square 37.15%18.90%4.17%11.08%38.03%40.04%
Number of obs.1153658551817
Parameters222222
MSE5418.66705.89523.67675.22491.34216.6
Note: Obs. = observations. ADG = average daily gain; CH4 = methane; MSE = mean squared errors.
Table 4. Enteric methane (CH4) emissions and animal performance from beef cattle.
ItemMethodExperimental DietNo. of Animal Initial BWADG kg/dDMI kg/dCH4Ref
Breedg/dg/kg DMIg/kg ADG% GEI
Hereford + SimmentalSF678% AL + 22% MB16511.2-11.4378.833.23-7.1[50]
(heifers) 100% MB16 -9.741142.37-9.5
Brahman heifersRCAG grass 16353-3.5811331.5-1.9[51]
RG grass6364-7.0725736.3500.42.07
Grain + AL6380-7.3116021.9127.31.23
Holstein steersRCForage-based 28311.6-7.4166.222.64-6.47[52]
Proteolytic enzyme8311.6-7.55164.422.11-6.32
Monensin8311.6-7.71159.620.7-5.91
Sunflower oil8311.6-6.9112918.81-5.08
Holstein steersRCForage-based 38311.6-7.1826725.05-7.13[52]
Fumaric acid8311.6-6.6925026-7.4
Levucell yeast8311.6-6.7124326.43-7.53
Procreatin yeast8311.6-7.4627224.32-6.93
CrossbreedSF6New breed-grazing202750.6926.4921332.80.324-[53]
(Charolais × Zebu) Cross line-grazing 4132870.626.36----
Old-breed-grazing132820.5476.06194320.337
CrossbreedGFNew breed-feedlot 3791.4410.2517817.360.1495.19[53]
(Charolais × Zebu) Cross-breed-Feedlot 3831.3210.42----
Old breed-Feedlot 3621.239.1115617.120.1245.07
CrossbreedRCTMR 5403570.1876.218730.40.52 [54]
Crossbreed steersSF6CON 6252920.7167.01151.5220.21-[55]
CT + high forage252930.7337.27156.421.70.21-
HT + high forage252920.7157.5215520.70.22-
Angus heifers and steersSF6CON 7122550.815.6898.718.820.395.61[56]
1% CT DM122540.825.7299.118.510.395.9
2% CT DM122550.765.6799.718.790.395.45
Nellore steersSF6CON 894191.158.8814717.10.354.81[57]
Palm oil94040.364.866.89.550.163.59
Linseed oil94160.857.162.812.50.153.05
Protected fat94340.997.5711815.90.274.5
Whole soybean94340.846.4763.912.70.153.07
Nellore BullsSF6High-starch + CG 99239.450.897.7117.7415.360.4923.37[58]
High-starch - no CG9259.111.037.69127.6317.140.4934.38
Low-starch + CG9257.550.927.45114.6115.450.4453.39
Low-starch + no CG9246.660.977.85120.4815.440.4883.49
Crossbreed steersSF6CS (09/13)125301.2810.8830129.40.5688.4[59]
CS (09/28)125311.3511.9530425.80.5827.7
Corn silage (10/09)125311.211.1330127.70.568.1
CS (10/23)125311.2911.0828426.20.537.3
Crossbreed steersSF6WS-1185390.8210.319530.10.5478[60]
WS-2185391.0411.631527.50.5848.24
WS-3185381.10312322280.5988.52
WS-4185381.04310.7273250.5076.79
GS184390.9298.931235.60.7119.72
Conc185371.33510.418015.30.3353.71[61]
CrossbreedSF6CON123381.447.88137.817.90.4083.9
(Charolais x Limousin) Whole soybean123381.266.3210315.20.3043.7
Refined soy oil123381.557.5283.911.20.2482.3
Cross breedSF6CON124741.088.67334.438.80.2437.9[62]
Charolais x Limousin) Refined coconut oil124741.248.81271.631.10.1686.1
Copra meal124741.28.66284.633.20.1926.7
Holstein steers/heifersRCSteer 10101750.714.0496.423.82.1-[63]
Heifer101760.723.9190.523.21.88-
Crossbreed beef heifersRCCON 118388.5-9.0522825.30.0657.8[64]
CDDGS8388.5-8.5718421.50.0556.6
WDDGS8388.5-8.1319123.90.0617.3
WDGGS + corn oil8 -8.4217421.10.0546.3
Holstein heifersRCCON (Grass hay + Conc; 50:50%) 124656.3-12.4308.6250.0387.2[65]
(non-lactating) CON + 4% LO4656.3-12.3238.119.40.02965.8
CON + 3% calcium nitrate 4656.3-12.3252.720.70.0315.6
CON + 4% LO + 3% nitrate4656.3-12.2206.8170.0264.8
Beef cattleSF6Grazing 1 cow/ha12526.2-11.3372.726.2-8.4[66]
(Cannulated Angus) Grazing 2.5 cow/ha12529.5-15181.511.3-3.7
Grazing 1 cow/ha12550.7-15.1258.616.1-5
Grazing 2.5 cow/ha12558.6-14.9143.610.8-3.2
Grazing 1 cow/ha12563.9-14.3185.716.8-3.1
Grazing 2.5 cow/ha12559.4-15.3158.710.7-3.3
Grazing 1 cow/ha12578.3-17.9176.19.6-5.3
Grazing 2.5 cow/ha12570.8-17.7275.114.8-4.8
Angus heifersRCCON122550.815.6898.718.82-5.61[17]
1% CT122540.825.7299.118.51-5.9
2% CT122550.765.6799.718.9-5.45
Limousin cross heifersSF6Low-forage mass15346-6.512019.30.1355.6[67]
High-forage mass15346-6.4412221.10.1636.1
Holstein growing heifersRCHigh-CS 134454-9.2922022.3--[68]
High-CS + LO4454-9.4619720.4--
High-GS4448-7.9420327--
High-GS + LO4447-7.8920126.2--
High-CS4361-7.0318426.1--
High-CS + LO4364-7.1619327--
High-GS 4361-7.2820828.5--
High-GS + LO4365-7.4219226--
No. of observations 82
AL = alfalfa (Medicago sativa); BW = body weight; CON = Control; Conc = concentrate; CS = corn silage; CT = condensed tannins; DGGS = Dried distillers’ grains solubles; DMI = dry matter intake; CG= crude glycerin; GEI = gross energy intake; GF = GreenFeed system (C-Lock, ND); GS= grass silage; HT = hydrolysable tannins; LO = linseed oil; MB = meadow bromegrass (Bromus biebersteinii); N = number of animal; RC: open-circuit respiration chamber; PRG = perennial rye grass; Ref = reference; SF6 = sulfur hexafluoride; TMR = total mixed ration; WC = white clover; WS= wheat silage; 1 Angleton grass (AG), Rhodes grass (RG), alfalfa (AL), and a high-grain diet; 2 Proteolitic enzyme (1 mL/kg DM), Monensin (33 mg/kg DM), and sunflower oil (400 g/d); 3 Treatments were control (no additive), procreatin-yeast (4 g/d), Levucell SC yeast (1 g/d), and fumaric acid (80 g/d); 4 Canchim steers from three different lines (5/8 Charolais x 3/8 Zebu) were used: old, new, and their cross; 5 TMR diet including lucerne and oaten hay chaff; 6 A basal diet of alfalfa, barley silages (50:50; dry matter [DM] basis) and supplemented with hydrolyzable tannins (HT) extract (chestnut) or a combination (50:50) of HT and condensed tannins (CT) extracts (quebracho CT); 7 Three treatments at 0, 1, and 2% of dietary DM as CT extracts; 8 Without fat (WF), palm oil (PO), linseed oil (LO), protected fat (PF), and whole soybeans (WS); 9 Starch-based supplementation level combined with crude glycerin (CG); 10 TMR diet with grass silage and concentrates (0.45 and 0.55, DM basis, respectively); 11 Control diet contained 55% whole crop barley silage, 35% barley grain, 5% canola meal, and 5% vitamin and mineral supplement. Three dried distillers’ grains solubles (DDGS) diets were formulated by replacing barley grain and canola meal (40% of the dietary DM) with corn-based DDGS (CDDGS), wheat-based WDDGS, or WDDGS plus corn oil (WDDGS + oil). For the WDDGS+ oil treatment, corn oil was added to WDDGS in a ratio of 6:94 to achieve the same fat level as in CDDGS; 12 Control (1) (CON; 50% natural grassland hay and 50% concentrate), (2) CON with 4% linseed oil (LIN), (3) CON with 3% calcium nitrate (NIT), and (4) CON with 4% linseed oil plus 3% calcium nitrate (LIN + NIT); 13 TMR diet with forage containing high corn silage (CS) or high grass silage (GS) and concentrates in proportions (forage: concentrate, DM basis) of either 75:25 (experiment 1) or 60:40 (experiment 2), respectively; Source: [17,50,51,52,53,54,55,56,57,58,59,60,61,62,63,64,65,66,67,68].
Table 5. The ordinary least squares regression (OLS) estimates of dry matter intake (DMI) impacts on milk production and on average daily gain (ADG) in dairy and beef cattle production, respectively.
Model 1Model 2
Dairy CattleBeef Cattle
Variable Milk ProductionADG
DMI1.310.09
(p < 0.001)(p < 0.01)
Intercept 1.342.44
R-Square 44.44%50.17%
Number of observations11838
Parameters22
MSE19.9580.0368
DMI = dry matter intake; ADG = average daily gain; MSE = mean squared errors.
Table 6. The ordinary least squares regression (OLS) estimates of methane (CH4 g/d) emissions per unit of energy-corrected milk (g/kg ECM) on methane production (CH4ⅈ) in dairy cattle.
Model 1
VariableDairy Cattle
Methane (CH4) Production
ECM9.82
(p < 0.001)
Intercept 138.95
R-Square 45.98%
Number of observations40
Parameters2
MSE5570.2
ECM = energy-corrected milk (g/kg ECM); MSE = mean squared errors.
Table 7. The ordinary least squares regression (OLS) estimates of propionate, acetate, and acetate/propionate (A/P) impacts on methane (CH4) production in dairy and beef cattle.
Model 1Model 2Model 3Model 4Model 5Model 6
Dairy CattleBeef CattleDairy CattleBeef CattleDairy CattleBeef Cattle
Variable CH4 Production (DMI)CH4 Production (DMI)CH4 Production (DMI)CH4 Production (DMI)CH4 ProductionCH4 Production
Propionate %−0.55 ***−0.4 **
(p < 0.001)(p < 0.02)
Acetate % 0.87 ***0.48 ***
(p < 0.001)(p < 0.01)
A/P ratio 0.28 ***0.09 **
(p < 0.001)(p < 0.01)
Intercept 32.0632.434.087.3115.515.01
R-Square 21.41%21.35%27.63%10.35%45.07%14.52%
No. of Obs402639263726
Parameters222222
MSE8.842817.3997.294919.8334.873618.911
Note: A/P ratio = acetate/propionate ratio; DMI = dry matter intake; Methane = CH4; p-values in parentheses *** p < 0.001, ** p < 0.01. No. of Obs. = number of observations; MSE = mean squared errors.
Table 8. The ordinary least squares regression (OLS) estimates of animal performance impact on methane production (CH4) in dairy and beef cattle production.
Model 1Model 2Model 3Model 4
Dairy CattleBeef CattleDairy CattleBeef Cattle
Variable CH4 ProductionCH4 ProductionCH4 ProductionCH4 Production
DMI18.5318.93--
(p < 0.001)(p < 0.001)
GEI--62.240.93
(p < 0.001)(p < 0.001)
Intercept 42.3722.3327.7647.16
R-Square 44.42%36.61%49.92%74.10%
No. of Obs121747234
Parameters2222
MSE5113.54425.84418.12286.8
Note: Obs. = observations; DMI = dry matter intake; DEI = gross energy intake; MSE = mean squared errors.
Publisher’s Note: MDPI stays neutral with regard to jurisdictional claims in published maps and institutional affiliations.