
All-You-Can-Eat: Influence of Proximity to Maize Gardens on the Wild Diet and the Forest Activities of the Sebitoli Chimpanzee Community in Kibale National Park

 , , ,
, , ,
Simple Summary
Abstract
1. Introduction
2. Materials and Methods
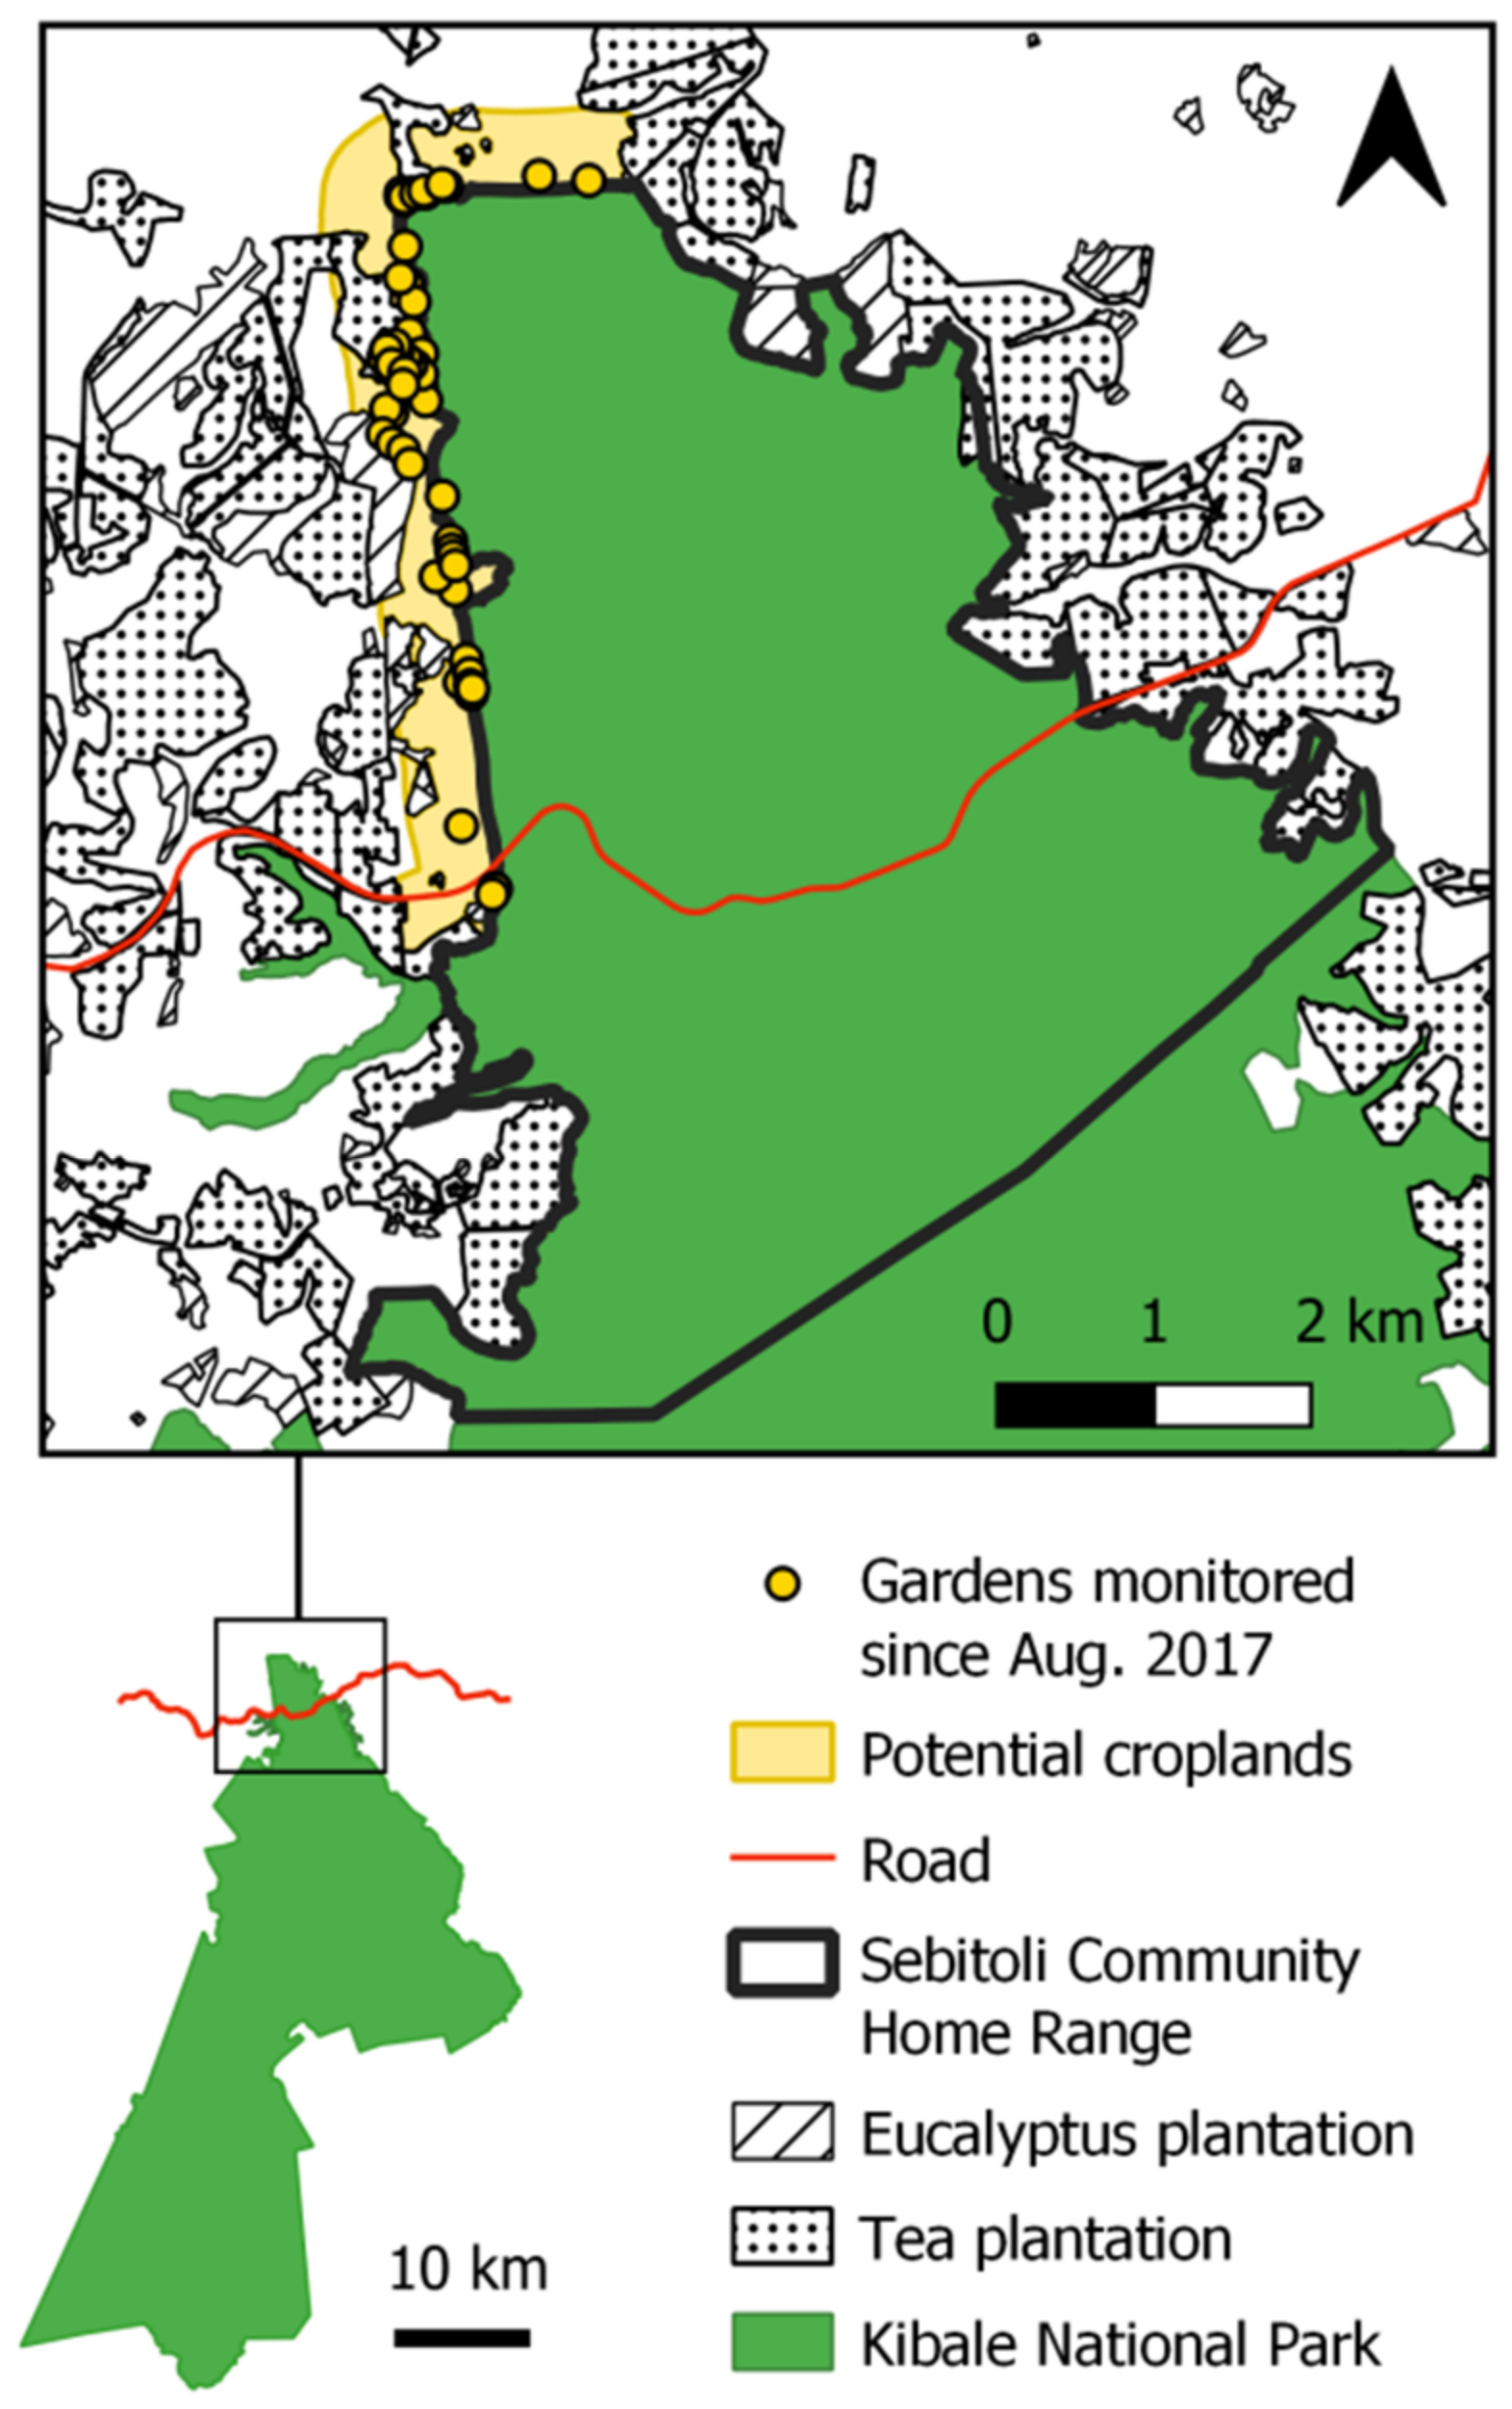
2.1. Study Site
2.2. Sebitoli Chimpanzee Community
2.3. Wild Fruit Availability
2.4. Maize Availability
2.5. Monitoring of Individuals
2.6. Energy Expenditures
2.6.1. Daily Traveled Distance and Traveled Energy
2.6.2. Moving in Trees
2.6.3. Other Activities
2.7. Uphill Grade Approximation
2.8. Energy Gains
2.9. Statistical Analysis
2.10. Ethical Note
3. Results
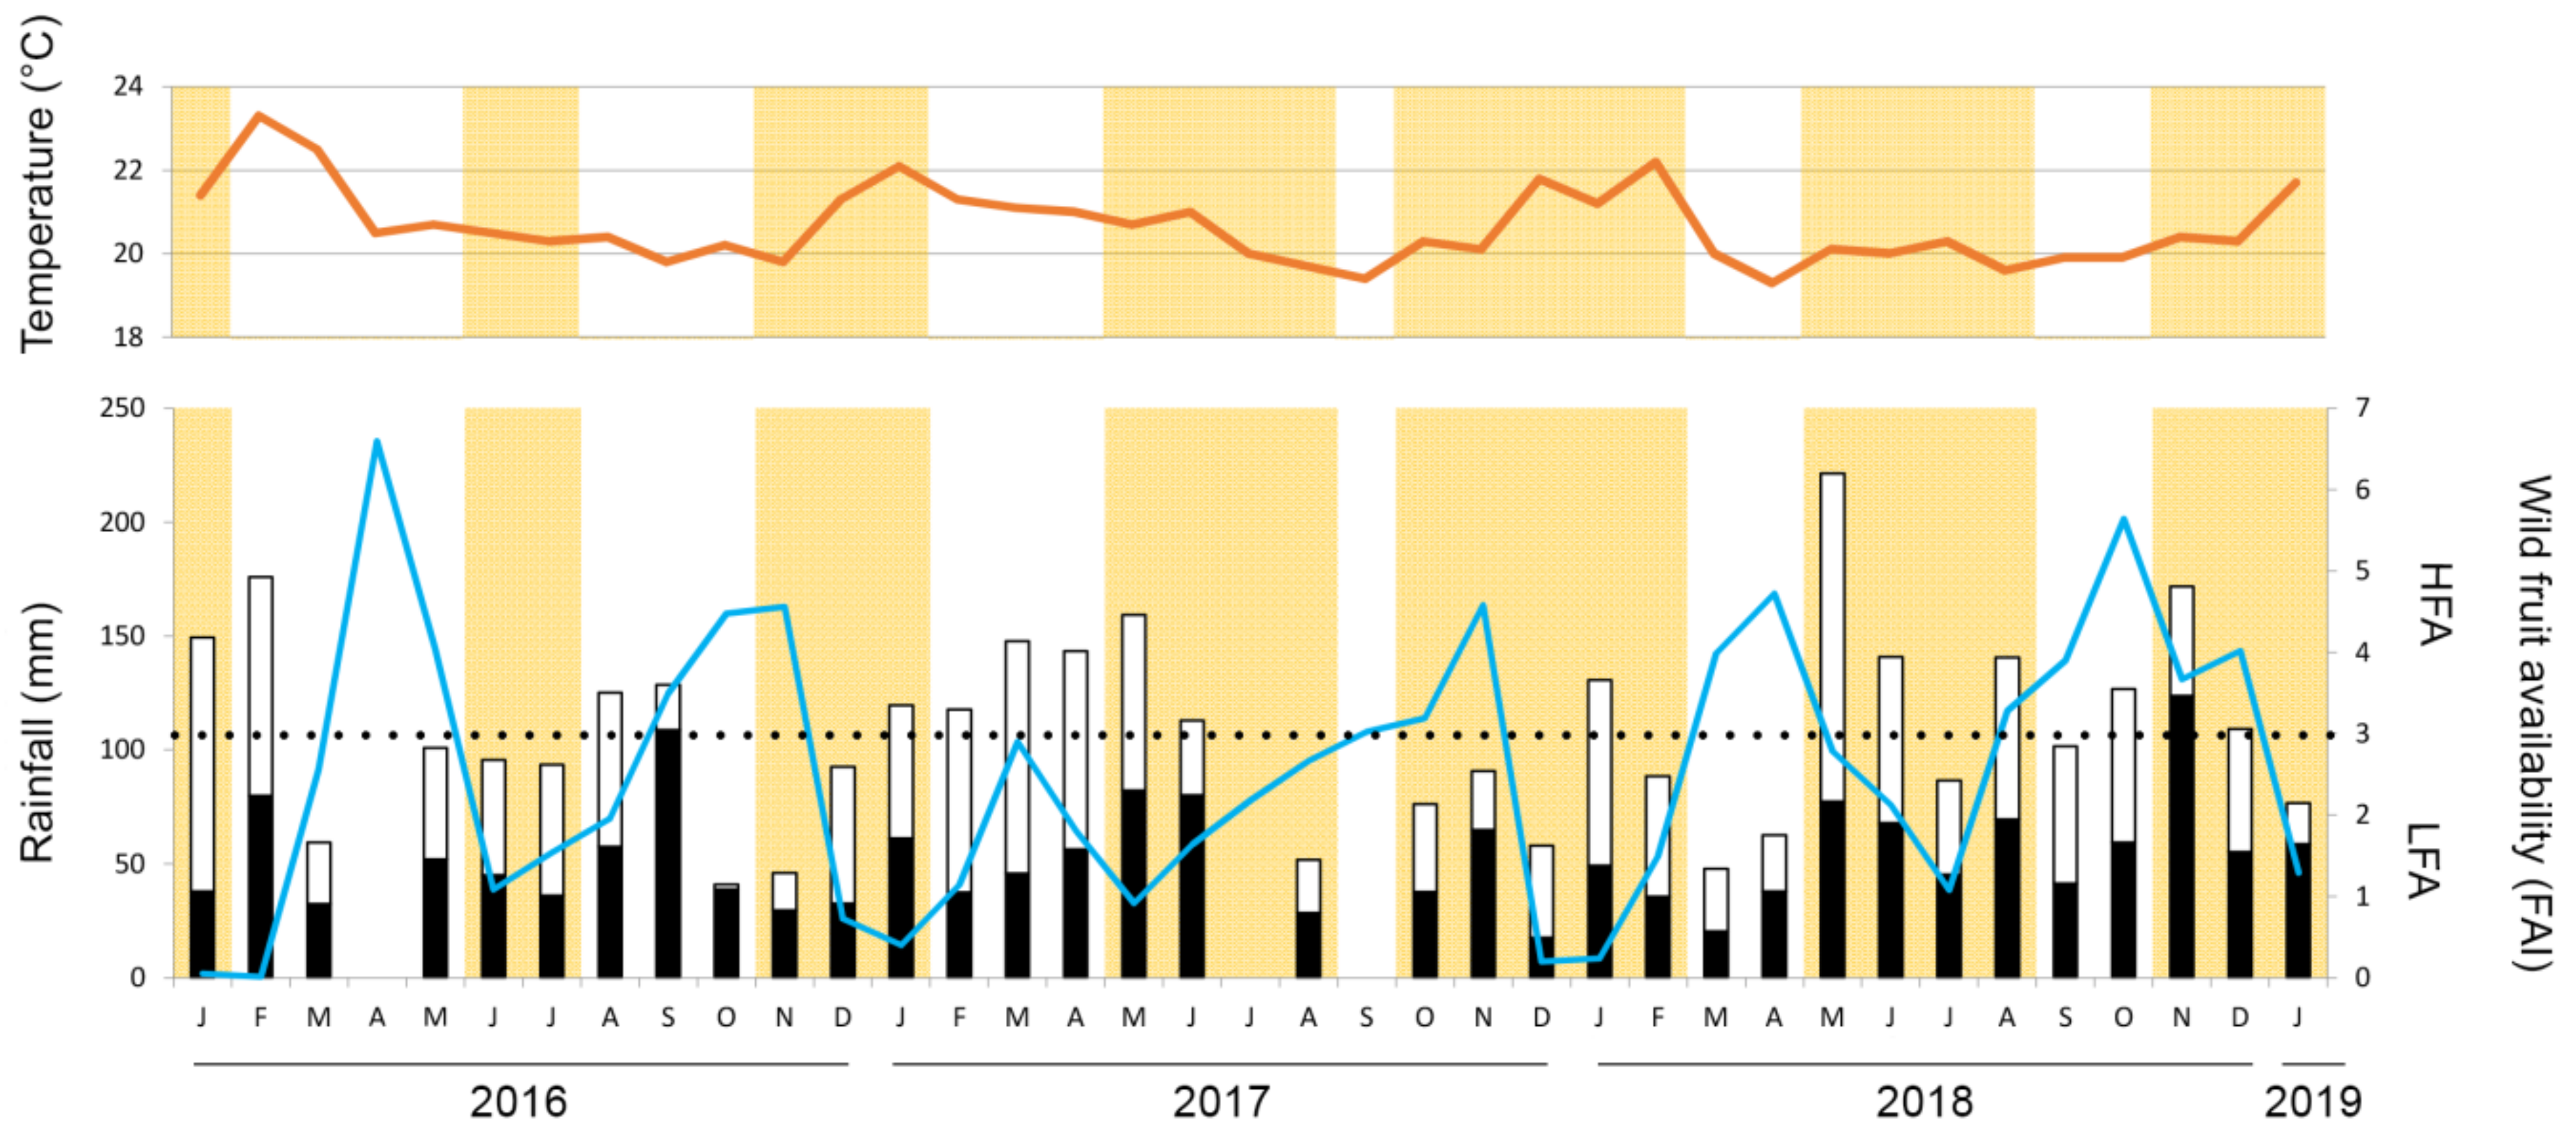
3.1. Maize and Wild Fruit Availability
3.2. Focal Nest-To-Nest Distribution
3.3. Diet Composition
3.4. Energy Intakes
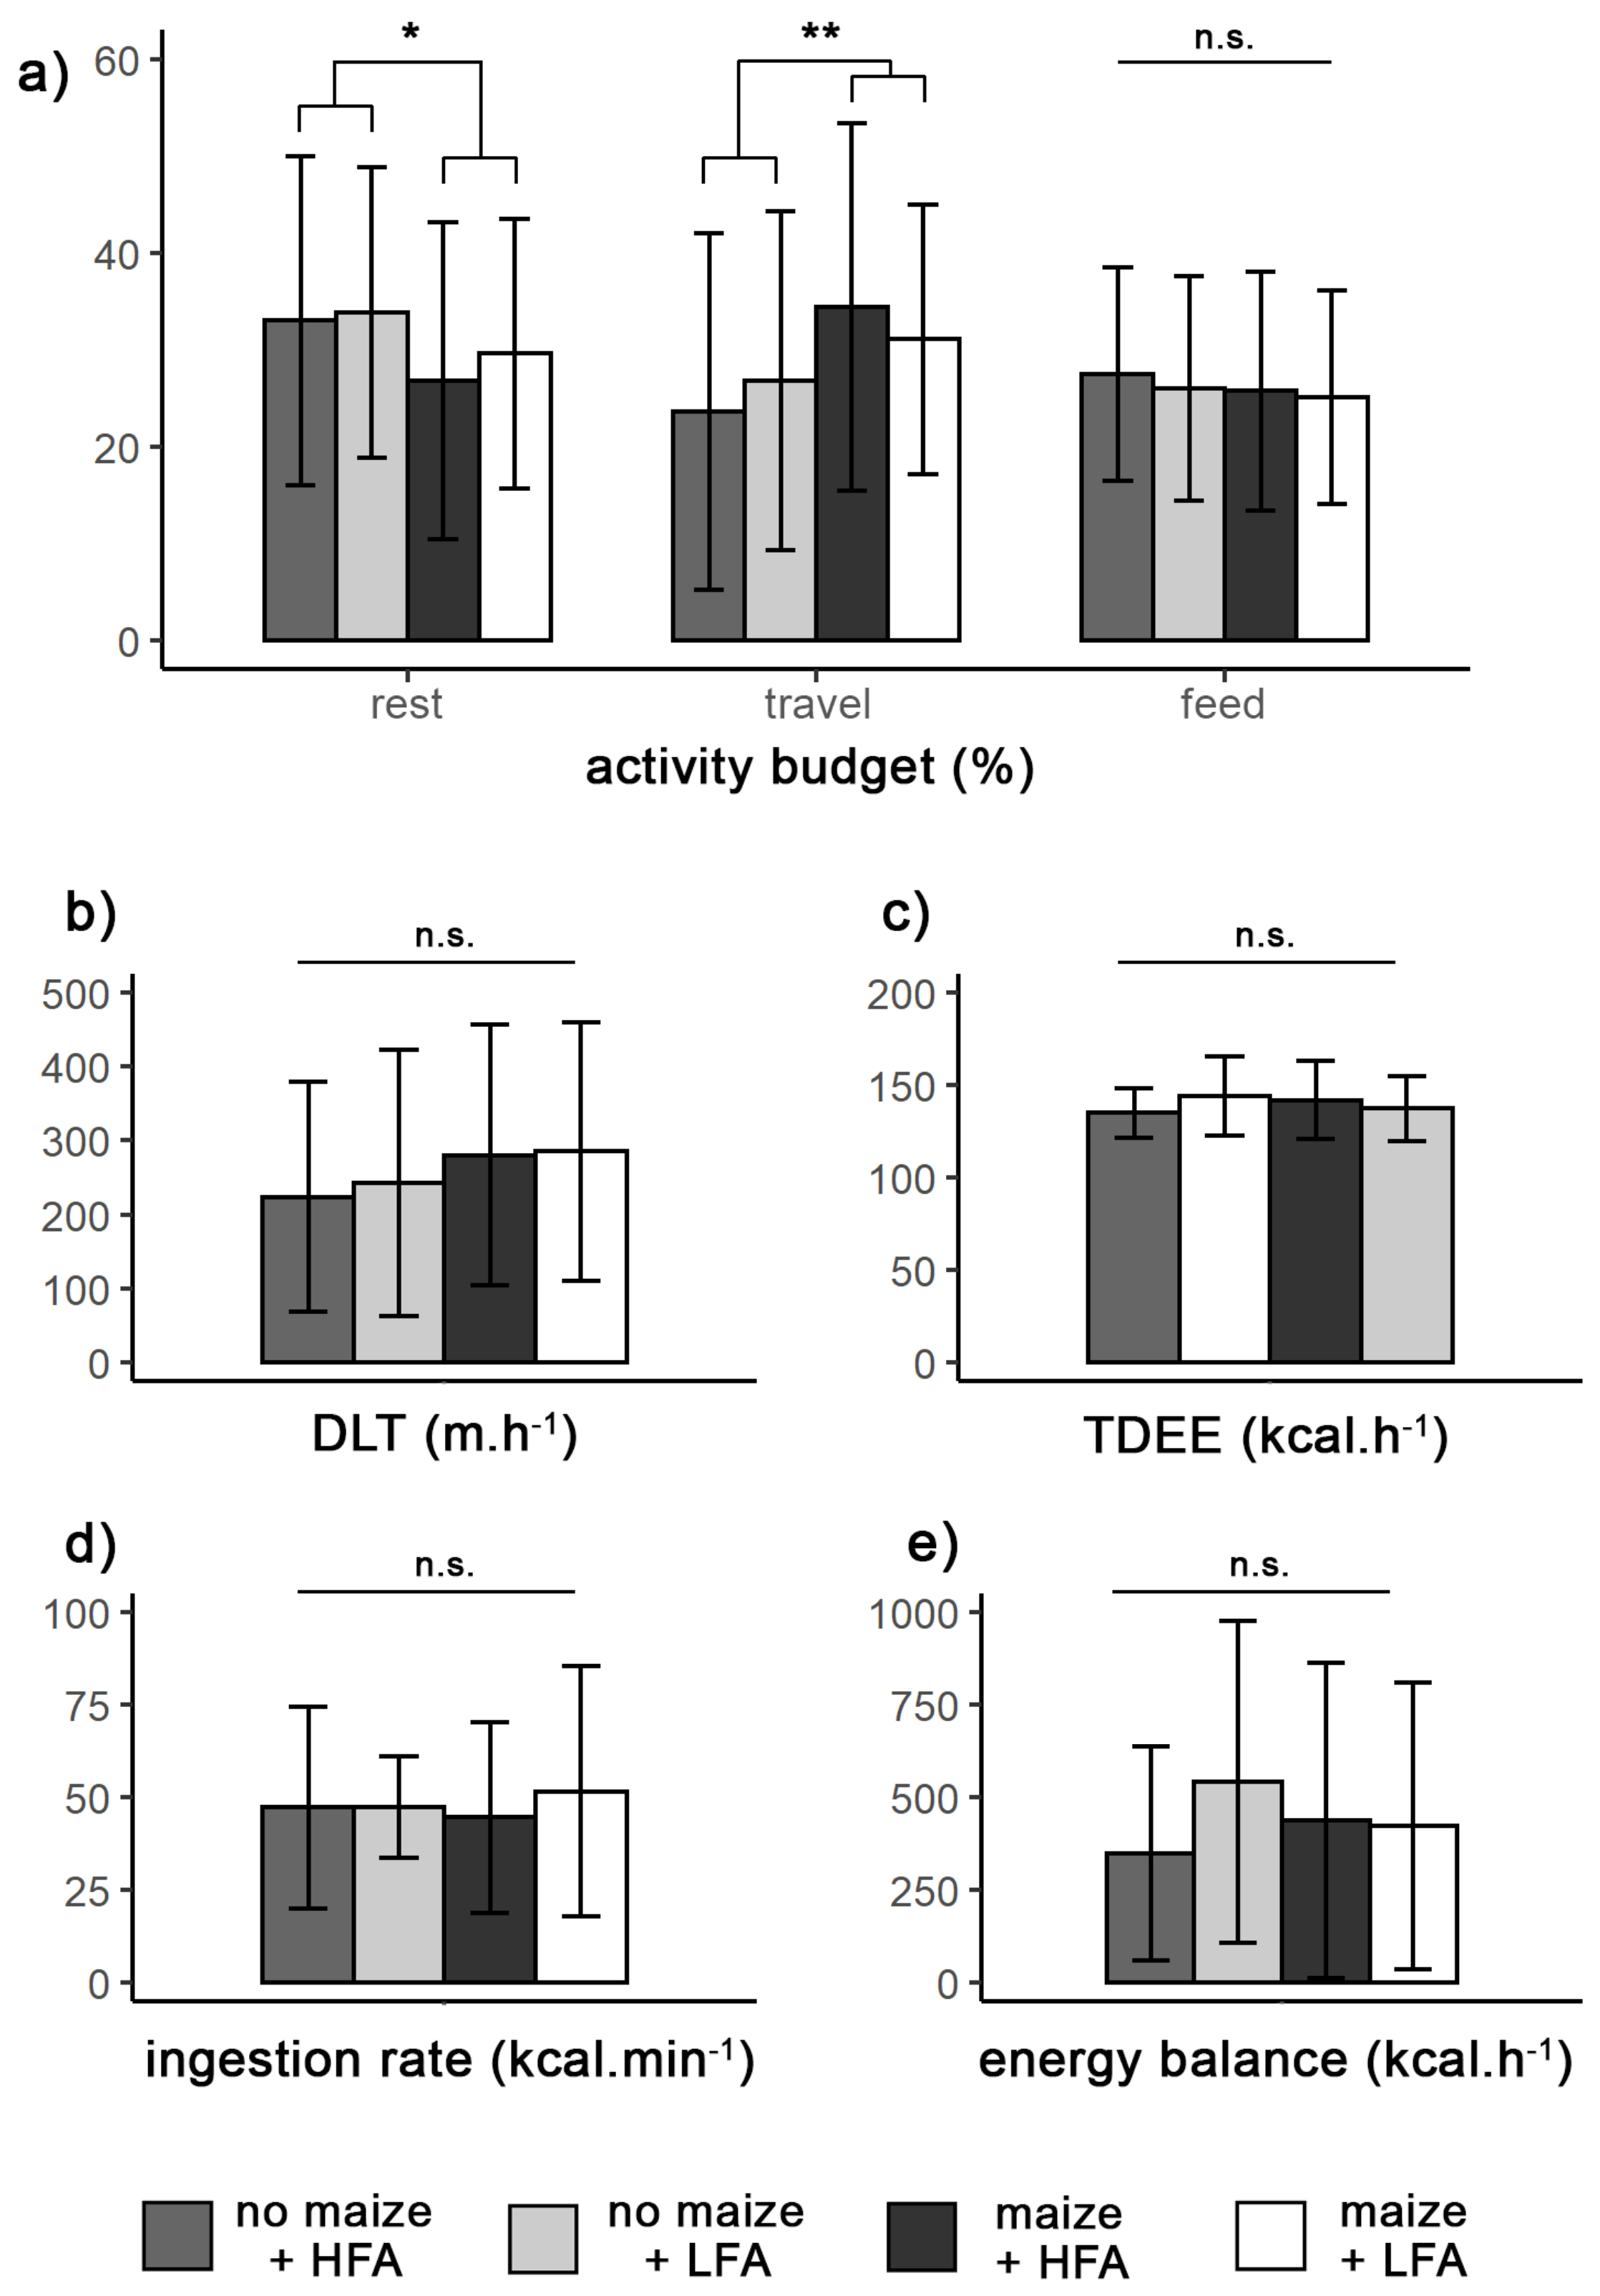
3.5. Activity Budgets, Daily Paths, and Energy Expenditures
3.6. Energy Balance
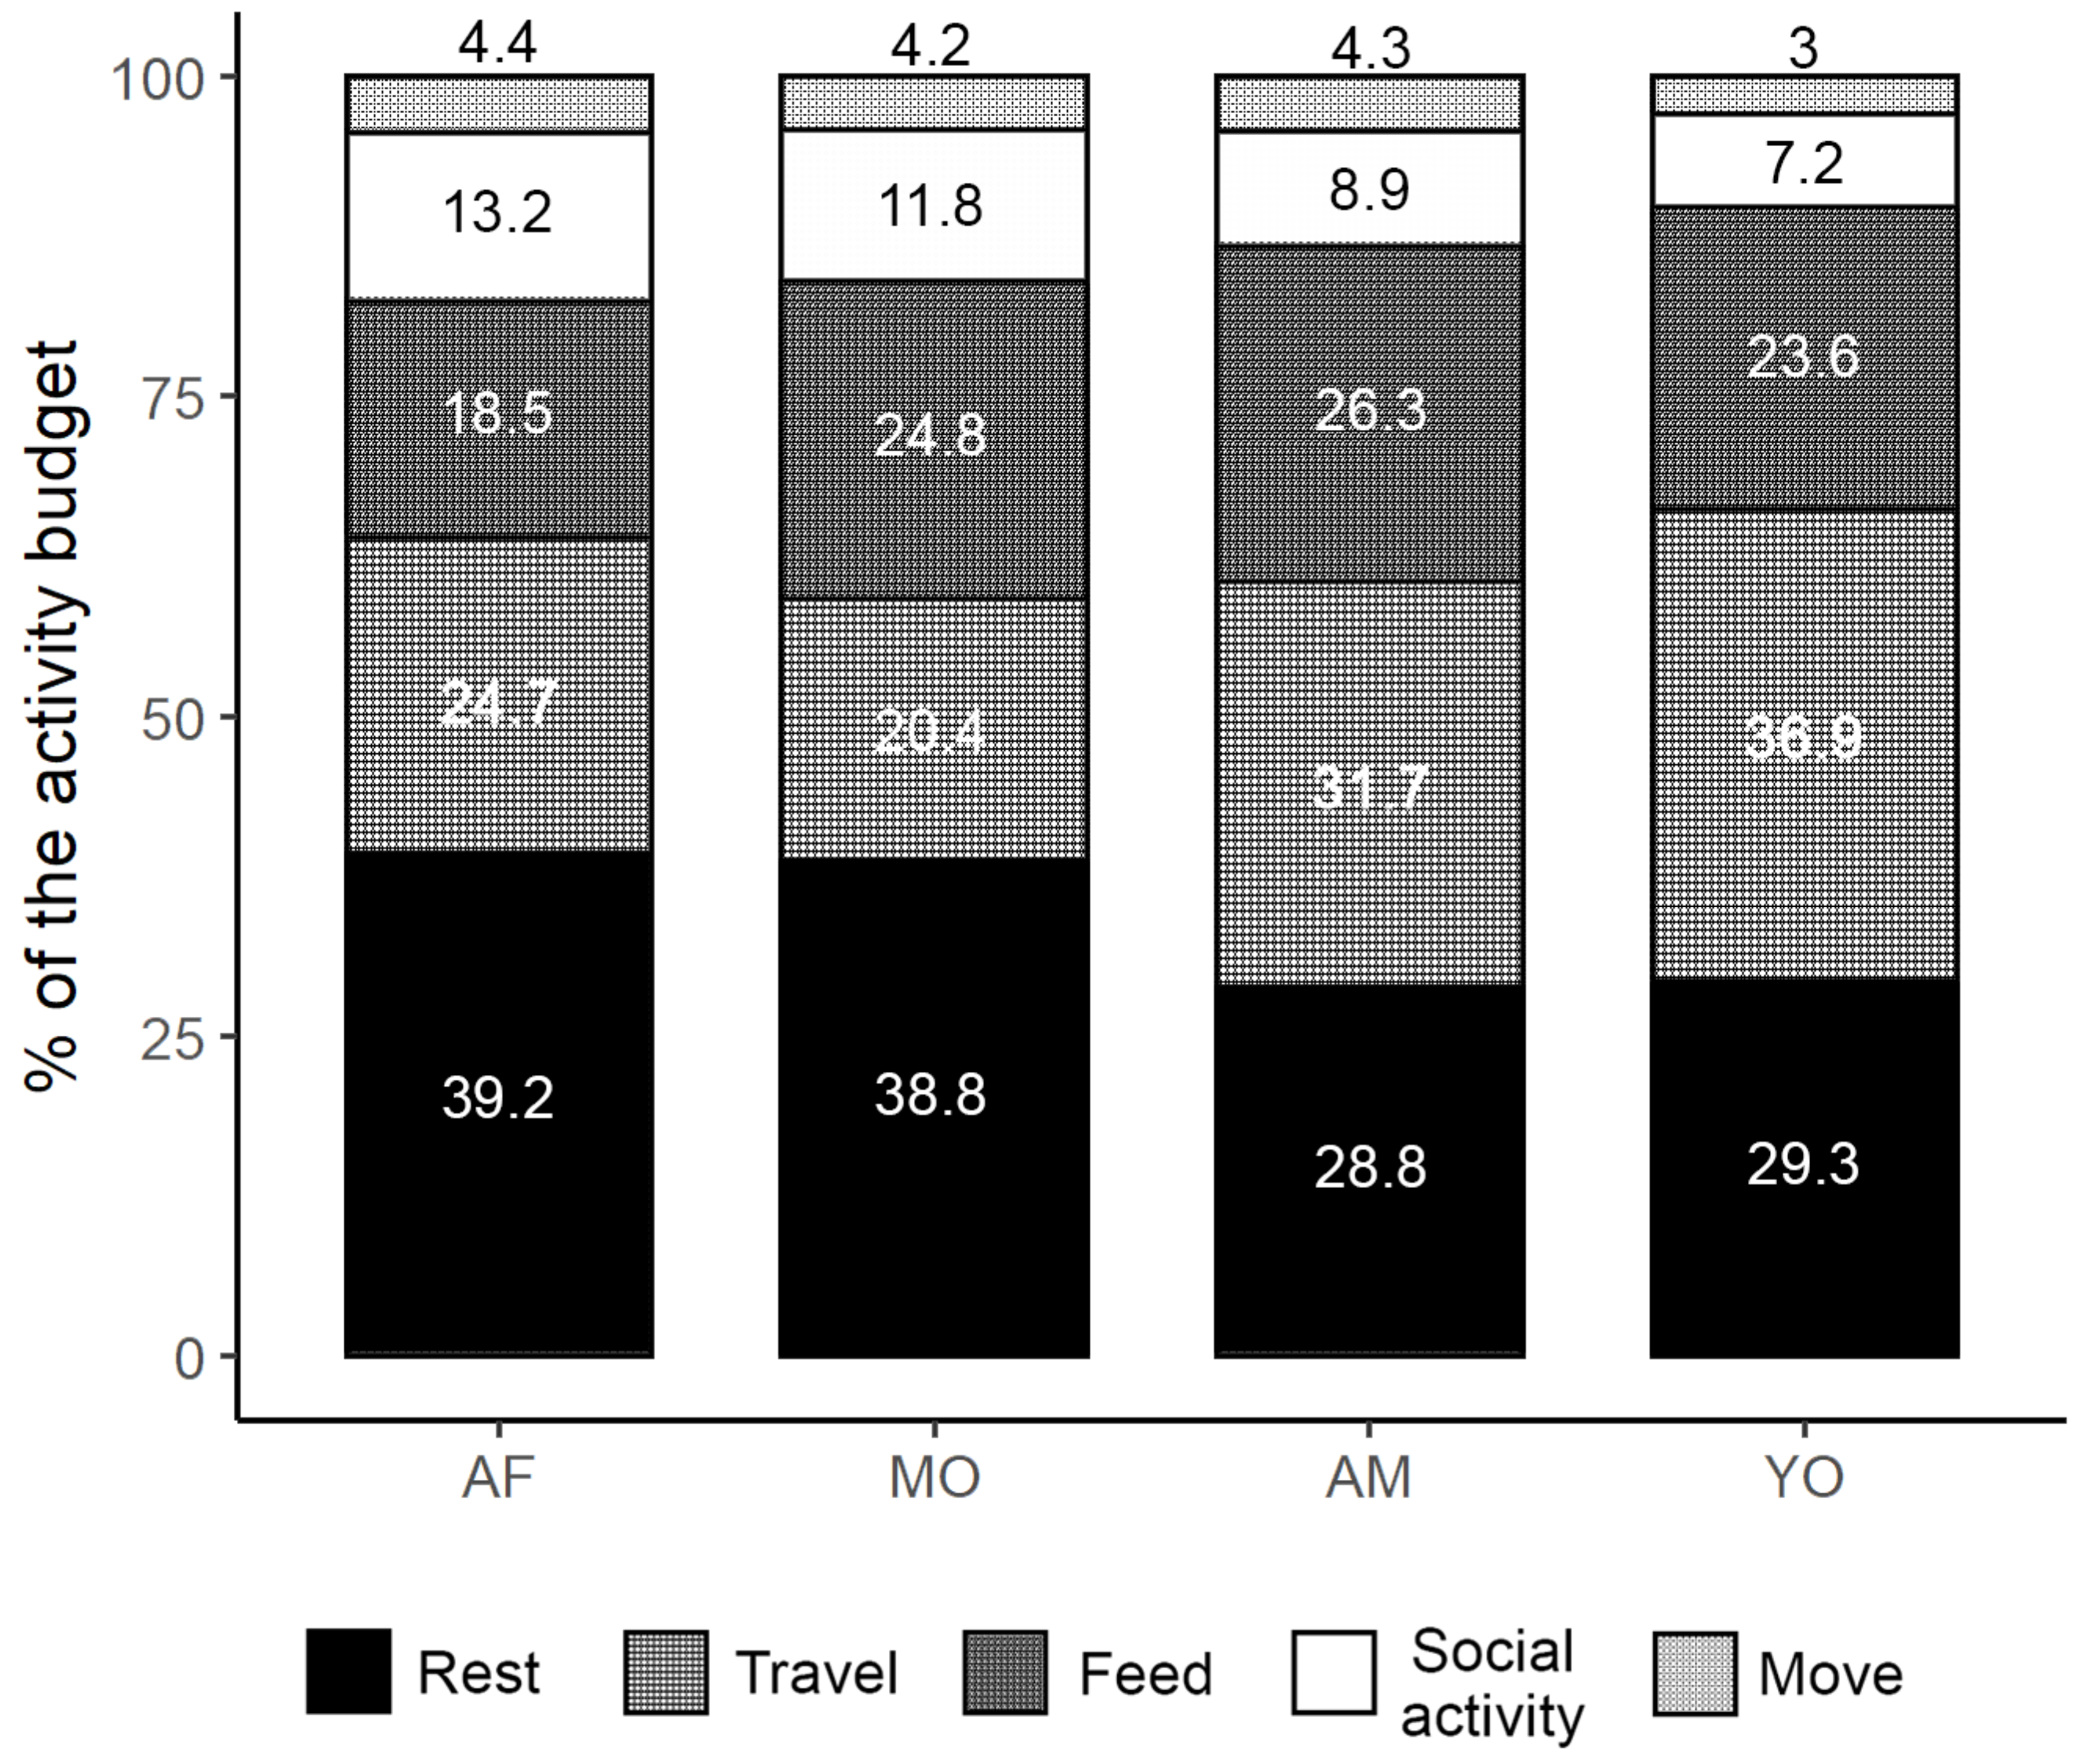
3.7. Age-Class Contribution to the Community Energy Balance
3.8. Approximation of Uphill Expenditures
4. Discussion
4.1. Distance Traveled and Activity Budget
4.2. The Sebitoli Area: A High-Quality Fruit Habitat
4.3. Maize: The Opportunistic Consumption of an Extra Food
4.4. A Preliminary Study about An Energy-Balance Proxy
4.5. Uphill Expenditure Approximation
4.6. Health Consequences and Conservation Issues
5. Conclusions
Supplementary Materials
Author Contributions
Funding
Institutional Review Board Statement
Informed Consent Statement
Data Availability Statement
Acknowledgments
Conflicts of Interest
References
- Smith-Gill, S.J. Cytophysiological Basis of Disruptive Pigmentary Patterns in the Leopard FrogRana Pipiens. II. Wild Type and Mutant Cell-Specific Patterns. J. Morphol. 1975, 146, 35–54. [Google Scholar] [CrossRef] [PubMed]
- Hubbell, S.P. Tree Dispersion, Abundance, and Diversity in a Tropical Dry Forest: That Tropical Trees Are Clumped, Not Spaced, Alters Conceptions of the Organization and Dynamics. Science 1979, 203, 1299–1309. [Google Scholar] [CrossRef] [PubMed]
- Hladik, C.M. Ecology, Diet, and Social Patterns in Old World and New World Primates. In Socioecology and Psychology of Primates; Tuttle, R.H., Ed.; De Gruyter Mouton: Berlin, Germany, 1975. [Google Scholar]
- Chapman, C.A.; Wrangham, R.W.; Chapman, L.J.; Kennard, D.K.; Zanne, A.E. Fruit and Flower Phenology at Two Sites in Kibale National Park, Uganda. J. Trop. Ecol. 1999, 15, 189–211. [Google Scholar] [CrossRef]
- Janmaat, K.R.L.; Ban, S.D.; Boesch, C. Chimpanzees Use Long-Term Spatial Memory to Monitor Large Fruit Trees and Remember Feeding Experiences across Seasons. Anim. Behav. 2013, 86, 1183–1205. [Google Scholar] [CrossRef]
- Trapanese, C.; Meunier, H.; Masi, S. What, Where and When: Spatial Foraging Decisions in Primates: Spatial Foraging Decisions in Primates. Biol. Rev. 2019, 94, 483–502. [Google Scholar] [CrossRef]
- Lambert, J.E.; Garber, P.A. Evolutionary and Ecological Implications of Primate Seed Dispersal. Am. J. Primatol. 1998, 45, 9–28. [Google Scholar] [CrossRef]
- Stoner, K.E.; Riba-Hernández, P.; Vulinec, K.; Lambert, J.E. The Role of Mammals in Creating and Modifying Seedshadows in Tropical Forests and Some Possible Consequences of Their Elimination. Biotropica 2007, 39, 316–327. [Google Scholar] [CrossRef]
- Malenky, R.K.; Wrangham, R.W. A Quantitative Comparison of Terrestrial Herbaceous Food Consumption by Pan paniscus in the Lomako Forest, Zaire, and Pan troglodytes in the Kibale Forest, Uganda. Am. J. Primatol. 1994, 32, 1–12. [Google Scholar] [CrossRef]
- Chapman, C.A.; Chapman, L.J.; Wrangham, R.W. Ecological Constraints on Group Size: An Analysis of Spider Monkey and Chimpanzee Subgroups. Behav. Ecol. Sociobiol. 1995, 36, 59–70. [Google Scholar] [CrossRef]
- Wrangham, R.W. Why Are Male Chimpanzees More Gregarious than Mothers? A Scramble Competition Hypothesis. In Primate Males—Causes and Consequences of Variation in Group Composition; Cambridge University Press: Cambridge, UK, 2000; pp. 248–258. [Google Scholar]
- Chancellor, R.L.; Rundus, A.S.; Nyandwi, S. The Influence of Seasonal Variation on Chimpanzee (Pan troglodytes schweinfurthii) Fallback Food Consumption, Nest Group Size, and Habitat Use in Gishwati, a Montane Rain Forest Fragment in Rwanda. Int. J. Primatol. 2012, 33, 115–133. [Google Scholar] [CrossRef]
- Marshall, A.J.; Wrangham, R.W. Evolutionary Consequences of Fallback Foods. Int. J. Primatol. 2007, 28, 1219–1235. [Google Scholar] [CrossRef]
- Knott, C.D. Changes in Orangutan Caloric Intake, Energy Balance, and Ketones in Response to Fluctuating Fruit Availability. Int. J. Primatol. 1998, 19, 1061–1079. [Google Scholar] [CrossRef]
- Stevenson, P.R.; Quinones, M.J.; Ahumada, J.A. Influence of Fruit Availability on Ecological Overlap among Four Neotropical Primates at Tinigua National Park, Colombia1. Biotropica 2000, 32, 533–544. [Google Scholar] [CrossRef]
- Doran, D. Influence of Seasonality on Activity Patterns, Feeding Behavior, Ranging, and Grouping Patterns in Taï Chimpanzees. Int. J. Primatol. 1997, 18, 183–206. [Google Scholar] [CrossRef]
- Dunn, J.C.; Cristóbal-Azkarate, J.; Veà, J.J. Differences in Diet and Activity Pattern between Two Groups of Alouatta Palliata Associated with the Availability of Big Trees and Fruit of Top Food Taxa. Am. J. Primatol. 2009, 71, 654–662. [Google Scholar] [CrossRef]
- Key, C.; Ross, C. Sex Differences in Energy Expenditure in Non–Human Primates. Proc. R. Soc. Lond. B Biol. Sci. 1999, 266, 2479–2485. [Google Scholar] [CrossRef]
- Wright, E.; Robbins, A.M.; Robbins, M.M. Dominance Rank Differences in the Energy Intake and Expenditure of Female Bwindi Mountain Gorillas. Behav. Ecol. Sociobiol. 2014, 68, 957–970. [Google Scholar] [CrossRef]
- Thompson, M.E.; Machanda, Z.P.; Fox, S.A.; Sabbi, K.H.; Otali, E.; Thompson González, N.; Muller, M.N.; Wrangham, R.W. Evaluating the Impact of Physical Frailty during Ageing in Wild Chimpanzees (Pan troglodytes schweinfurthii). Philos. Trans. R. Soc. B Biol. Sci. 2020, 375, 20190607. [Google Scholar] [CrossRef]
- Estrada, A. Socioeconomic Contexts of Primate Conservation: Population, Poverty, Global Economic Demands, and Sustainable Land Use: Social Contexts of Primate Conservation. Am. J. Primatol. 2013, 75, 30–45. [Google Scholar] [CrossRef]
- Estrada, A.; Garber, P.A.; Rylands, A.B.; Roos, C.; Fernandez-Duque, E.; Di Fiore, A.; Nekaris, K.A.-I.; Nijman, V.; Heymann, E.W.; Lambert, J.E.; et al. Impending Extinction Crisis of the World’s Primates: Why Primates Matter. Sci. Adv. 2017, 3, e1600946. [Google Scholar] [CrossRef]
- Rijksen, H.D.; Meijaard, E. Our Vanishing Relative. The Status of Wild Orangutans at the Close of the Twentieth Century; Tropenbos: Ede, The Netherlands, 1999. [Google Scholar]
- Hockings, K.; Humley, T. Best Practice Guidelines for the Prevention and Mitigation of Conflict between Humans and Great Apes; International Union for Conservation of Nature: Gland, Switzerland, 2009. [Google Scholar] [CrossRef]
- Great Apes Survival Partnership; International Union for Conservation of Nature. Report to the CITES Standing Committee on the Status of Great Apes; United Nations Environment Programme Great Apes Survival Partnership: Nairobi, Kenya, 2018; p. 34. [Google Scholar]
- Carvalho, J.S.; Graham, B.; Bocksberger, G.; Maisels, F.; Williamson, E.A.; Wich, S.; Sop, T.; Amarasekaran, B.; Barca, B.; Barrie, A.; et al. Predicting Range Shifts of African Apes under Global Change Scenarios. Divers. Distrib. 2021, 27, 1663–1679. [Google Scholar] [CrossRef]
- International Union for Conservation of Nature. The IUCN Red List of Threatened Species. 2021. Available online: https://www.iucnredlist.org/ (accessed on 20 June 2021).
- Thompson, M.E.; Sabbi, K.H. Evolutionary Demography of the Great Apes; 2019. Available online: https://osf.io/r9pz7/ (accessed on 20 June 2021).
- Galdikas, B.M.F.; Wood, J.W. Birth Spacing Patterns in Humans and Apes. Am. J. Phys. Anthropol. 1990, 83, 185–191. [Google Scholar] [CrossRef] [PubMed]
- Hockings, K.J.; Anderson, J.R.; Matsuzawa, T. Use of Wild and Cultivated Foods by Chimpanzees at Bossou, Republic of Guinea: Feeding Dynamics in a Human-Influenced Environment. Am. J. Primatol. 2009, 71, 636–646. [Google Scholar] [CrossRef] [PubMed]
- McLennan, M.R.; Ganzhorn, J.U. Nutritional Characteristics of Wild and Cultivated Foods for Chimpanzees (Pan troglodytes) in Agricultural Landscapes. Int. J. Primatol. 2017, 38, 122–150. [Google Scholar] [CrossRef]
- Hill, C.M. People, Crops and Primates: A Conflict of Interests. In Commensalism and Conflict: The Human–Primate Interface; American Society of Primatologists: Denver, CO, USA, 2005; pp. 40–59. [Google Scholar]
- Hockings, K.J.; Humle, T.; Anderson, J.R.; Biro, D.; Sousa, C.; Ohashi, G.; Matsuzawa, T. Chimpanzees Share Forbidden Fruit. PLoS ONE 2007, 2, e886. [Google Scholar] [CrossRef] [PubMed]
- Carlitz, E.H.D.; Miller, R.; Kirschbaum, C.; Gao, W.; Hänni, D.C.; van Schaik, C.P. Measuring Hair Cortisol Concentrations to Assess the Effect of Anthropogenic Impacts on Wild Chimpanzees (Pan troglodytes). PLoS ONE 2016, 11, e0151870. [Google Scholar] [CrossRef] [PubMed]
- Naughton-Treves, L. Farming the Forest Edge: Vulnerable Places and People around Kibale National Park, Uganda. Geogr. Rev. 1997, 87, 27. [Google Scholar] [CrossRef]
- Osborn, F.V.; Hill, C.M. Techniques to Reduce Crop Loss: Human and Technical Dimensions in Africa. In People and Wildlife; Woodroffe, R., Thirgood, S., Rabinowitz, A., Eds.; Cambridge University Press: Cambridge, UK, 2005; pp. 72–85. [Google Scholar] [CrossRef]
- Hockings, K.J.; Anderson, J.R.; Matsuzawa, T. Socioecological Adaptations by Chimpanzees, Pan troglodytes verus, Inhabiting an Anthropogenically Impacted Habitat. Anim. Behav. 2012, 83, 801–810. [Google Scholar] [CrossRef]
- Campbell-Smith, G.; Campbell-Smith, M.; Singleton, I.; Linkie, M. Raiders of the Lost Bark: Orangutan Foraging Strategies in a Degraded Landscape. PLoS ONE 2011, 6, e20962. [Google Scholar] [CrossRef]
- Saj, T.; Sicotte, P.; Paterson, J.D. Influence of Human Food Consumption on the Time Budget of Vervets. Int. J. Primatol. 1999, 20, 977–994. [Google Scholar] [CrossRef]
- Cancelliere, E.C.; Chapman, C.A.; Twinomugisha, D.; Rothman, J.M. The Nutritional Value of Feeding on Crops: Diets of Vervet Monkeys in a Humanized Landscape. Afr. J. Ecol. 2018, 56, 160–167. [Google Scholar] [CrossRef]
- Dhawale, A.K.; Kumar, M.A.; Sinha, A. Changing Ecologies, Shifting Behaviours: Behavioural Responses of a Rainforest Primate, the Lion-Tailed Macaque Macaca silenus, to a Matrix of Anthropogenic Habitats in Southern India. PLoS ONE 2020, 15, e0238695. [Google Scholar] [CrossRef]
- Altmann, J.; Muruthi, P. Differences in Daily Life between Semiprovisioned and Wild-Feeding Baboons. Am. J. Primatol. 1988, 15, 213–221. [Google Scholar] [CrossRef]
- Krief, S.; Cibot, M.; Bortolamiol, S.; Seguya, A.; Krief, J.-M.; Masi, S. Wild Chimpanzees on the Edge: Nocturnal Activities in Croplands. PLoS ONE 2014, 9, e109925. [Google Scholar] [CrossRef]
- Plumptre, A.J.; Hart, J.A.; Hicks, T.C.; Nixon, S.; Piel, A.K.; Pintea, L. Pan Troglodytes Ssp. Schweinfurthii. The IUCN Red List of Threatened Species. 2016. [Google Scholar] [CrossRef]
- Kalbitzer, U.; Chapman, C.A. Primate Responses to Changing Environments in the Anthropocene. In Primate Life Histories, Sex Roles, and Adaptability; Kalbitzer, U., Jack, K.M., Eds.; Springer International Publishing: Cham, Switzerland, 2018; pp. 283–310. [Google Scholar] [CrossRef]
- Hill, C.M. Primate Crop Feeding Behavior, Crop Protection, and Conservation. Int. J. Primatol. 2017, 38, 385–400. [Google Scholar] [CrossRef]
- McLennan, M.R.; Spagnoletti, N.; Hockings, K.J. The Implications of Primate Behavioral Flexibility for Sustainable Human–Primate Coexistence in Anthropogenic Habitats. Int. J. Primatol. 2017, 38, 105–121. [Google Scholar] [CrossRef]
- McLennan, M.R.; Hyeroba, D.; Asiimwe, C.; Reynolds, V.; Wallis, J. Chimpanzees in Mantraps: Lethal Crop Protection and Conservation in Uganda. Oryx 2012, 46, 598–603. [Google Scholar] [CrossRef]
- Cibot, M.; Roux, S.L.; Rohen, J.; McLennan, M.R. Death of a Trapped Chimpanzee: Survival and Conservation of Great Apes in Unprotected Agricultural Areas of Uganda. Afr. Primates 2019, 13, 47–56. [Google Scholar]
- Fedigan, L.M. Ethical Issues Faced by Field Primatologists: Asking the Relevant Questions. Am. J. Primatol. 2010, 72, 754–771. [Google Scholar] [CrossRef]
- Cunningham, E.P.; Unwin, S.; Setchell, J.M. Darting Primates in the Field: A Review of Reporting Trends and a Survey of Practices and Their Effect on the Primates Involved. Int. J. Primatol. 2015, 36, 911–932. [Google Scholar] [CrossRef]
- Behringer, V.; Deschner, T. Non-Invasive Monitoring of Physiological Markers in Primates. Horm. Behav. 2017, 91, 3–18. [Google Scholar] [CrossRef] [PubMed]
- Pontzer, H.; Wrangham, R.W. Climbing and the Daily Energy Cost of Locomotion in Wild Chimpanzees: Implications for Hominoid Locomotor Evolution. J. Hum. Evol. 2004, 46, 315–333. [Google Scholar] [CrossRef] [PubMed]
- N’guessan, A.K.; Ortmann, S.; Boesch, C. Daily Energy Balance and Protein Gain Among Pan troglodytes verus in the Taï National Park, Côte d’Ivoire. Int. J. Primatol. 2009, 30, 481–496. [Google Scholar] [CrossRef]
- Bortolamiol, S.; Cohen, M.; Jiguet, F.; Pennec, F.; Seguya, A.; Krief, S. Chimpanzee Non-Avoidance of Hyper-Proximity to Humans. J. Wildl. Manag. 2016, 80, 924–934. [Google Scholar] [CrossRef]
- Naughton-Treves, L.; Treves, A.; Chapman, C.; Wrangham, R. Temporal Patterns of Crop-Raiding by Primates: Linking Food Availability in Croplands and Adjacent Forest. J. Appl. Ecol. 1998, 35, 596–606. [Google Scholar] [CrossRef]
- Plumptre, A.J.; Williamson, E.A.; Rose, R.; Nangendo, G.; Didier, K.; Hart, J.; Mulindahabi, F. Eastern Chimpanzee (Pan troglodytes schweinfurthii): Status Survey and Conservation Action Plan 2010–2020; International Union for Conservation of Nature: Gland, Switzerland, 2010. [Google Scholar]
- Hartter, J.N. Landscape Change around Kibale National Park, Uganda: Impacts on Land Cover, Land Use, and Livelihoods. Ph.D. Thesis, University of Florida, Gainesville, FL, USA, 2007. [Google Scholar]
- Struhsaker, T.T. Ecology of an African Rain Forest: Logging in Kibale and the Conflict between Conservation and Exploitation; University Press of Florida: Gainesville, FL, USA, 1997. [Google Scholar]
- Bortolamiol, S.; Cohen, M.; Potts, K.; Pennec, F.; Rwaburindore, P.; Kasenene, J.; Seguya, A.; Vignaud, Q.; Krief, S. Suitable Habitats for Endangered Frugivorous Mammals: Small-Scale Comparison, Regeneration Forest and Chimpanzee Density in Kibale National Park, Uganda. PLoS ONE 2014, 9, e102177. [Google Scholar] [CrossRef]
- Stampone, M.D.; Hartter, J.N.; Chapman, C.A.; Ryan, S.J. Trends and Variability in Localized Precipitation Around Kibale National Park, Uganda, Africa. Res. J. Environ. Earth Sci. 2011, 11, 14–23. [Google Scholar]
- Bortolamiol, S.; Krief, S.; Jiguet, F.; Palibrk, M.; Rwaburindore, P.; Kasenene, J.; Seguya, A.; Cohen, M. Analyse Spatiale Des Facteurs Influençant La Répartition Des Chimpanzés à Sebitoli, Parc National de Kibale. Cart. Géomat. 2013, 217, 21–36. [Google Scholar]
- Krief, S.; Iglesias-González, A.; Appenzeller, B.M.R.; Okimat, J.P.; Fini, J.-B.; Demeneix, B.; Vaslin-Reimann, S.; Lardy-Fontan, S.; Guma, N.; Spirhanzlova, P. Road Impact in a Protected Area with Rich Biodiversity: The Case of the Sebitoli Road in Kibale National Park, Uganda. Environ. Sci. Pollut. Res. 2020, 27, 27914–27925. [Google Scholar] [CrossRef]
- Pontzer, H.; Wrangham, R.W. Ontogeny of Ranging in Wild Chimpanzees. Int. J. Primatol. 2006, 27, 295–309. [Google Scholar] [CrossRef]
- Cibot, M.; Krief, S.; Philippon, J.; Couchoud, P.; Seguya, A.; Pouydebat, E. Feeding Consequences of Hand and Foot Disability in Wild Adult Chimpanzees (Pan troglodytes schweinfurthii). Int. J. Primatol. 2016, 37, 479–494. [Google Scholar] [CrossRef]
- Nissen, H.W.; Yerkes, R.M. Reproduction in the Chimpanzee: Report on Forty-Nine Births. Anat. Rec. 1943, 86, 567–578. [Google Scholar] [CrossRef]
- Wallis, J. A Survey of Reproductive Parameters in the Free-Ranging Chimpanzees of Gombe National Park. Reproduction 1997, 109, 297–307. [Google Scholar] [CrossRef]
- Hasegawa, T.; Hiraiwa-Hasegawa, M. Opportunistic and Restrictive Matings among Wild Chimpanzees in the Mahale Mountains, Tanzania. J. Ethol. 1983, 1, 75–85. [Google Scholar] [CrossRef]
- Thompson, M.E. Reproductive Ecology of Female Chimpanzees: Chimpanzee Reproductive Ecology. Am. J. Primatol. 2013, 75, 222–237. [Google Scholar] [CrossRef]
- Potts, K.B.; Chapman, C.A.; Lwanga, J.S. Floristic Heterogeneity between Forested Sites in Kibale National Park, Uganda: Insights into the Fine-Scale Determinants of Density in a Large-Bodied Frugivorous Primate. J. Anim. Ecol. 2009, 78, 1269–1277. [Google Scholar] [CrossRef]
- McLennan, M.R. Diet and Feeding Ecology of Chimpanzees (Pan troglodytes) in Bulindi, Uganda: Foraging Strategies at the Forest–Farm Interface. Int. J. Primatol. 2013, 34, 585–614. [Google Scholar] [CrossRef]
- Altmann, J. Observational Study of Behavior: Sampling Methods. Behaviour 1974, 49, 227–267. [Google Scholar] [CrossRef]
- Robert-McComb, J.J.; Carnero, E.Á.; Iglesias-Gutiérrez, E. Estimating Energy Requirements. In The Active Female: Health Issues Throughout the Lifespan; Robert-McComb, J.J., Norman, R.L., Zumwalt, M., Eds.; Springer: New York, NY, USA, 2014; pp. 411–449. [Google Scholar] [CrossRef]
- Kleiber, M. The Fire of Life. An Introduction to Animal Energetics; John Wiley and Sons: New York, NY, USA, 1961. [Google Scholar]
- Smith, R.J.; Jungers, W.L. Body Mass in Comparative Primatology. J. Hum. Evol. 1997, 32, 523–559. [Google Scholar] [CrossRef]
- Leonard, W.R.; Robertson, M.L. Comparative Primate Energetics and Hominid Evolution. Am. J. Phys. Anthropol. 1997, 102, 265–281. [Google Scholar] [CrossRef]
- Bergstrom, M.L.; Kalbitzer, U.; Campos, F.A.; Melin, A.D.; Emery Thompson, M.; Fedigan, L.M. Non-Invasive Estimation of the Costs of Feeding Competition in a Neotropical Primate. Horm. Behav. 2020, 118, 104632. [Google Scholar] [CrossRef] [PubMed]
- Taylor, C.R.; Heglund, N.C. Energetics and Mechanics of Terrestrial Locomotion. Annu. Rev. Physiol. 1982, 44, 97–107. [Google Scholar] [CrossRef] [PubMed]
- Hunt, K.D. Positional Behavior of Pan troglodytes in the Mahale Mountains and Gombe Stream National Parks, Tanzania. Am. J. Phys. Anthropol. 1992, 87, 83–105. [Google Scholar] [CrossRef]
- Morbeck, M.E.; Zihlman, A.L. Body Size and Proportions in Chimpanzees, with Special Reference to Pan troglodytes schweinfurthii from Gombe National Park, Tanzania. Primates 1989, 30, 369–382. [Google Scholar] [CrossRef]
- Mermier, C.M.; Robergs, R.A.; McMinn, S.M.; Heyward, V.H. Energy Expenditure and Physiological Responses during Indoor Rock Climbing. Br. J. Sports Med. 1997, 31, 224–228. [Google Scholar] [CrossRef]
- Bobbert, A.C. Energy Expenditure in Level and Grade Walking. J. Appl. Physiol. 1960, 15, 1015–1021. [Google Scholar] [CrossRef]
- Rothman, J.M.; Chapman, C.A.; Van Soest, P.J. Methods in Primate Nutritional Ecology: A User’s Guide. Int. J. Primatol. 2012, 33, 542–566. [Google Scholar] [CrossRef]
- Hendrick, E.L.; Shipley, L.A.; Hagerman, A.E.; Kelley, L.M. Fruit and Fibre: The Nutritional Value of Figs for a Small Tropical Ruminant, the Blue Duiker (Cephalophus monticola). Afr. J. Ecol. 2009, 47, 556–566. [Google Scholar] [CrossRef]
- Conklin, N.L.; Wrangham, R.W. The Value of Figs to a Hind-Gut Fermenting Frugivore: A Nutritional Analysis. Biochem. Syst. Ecol. 1994, 22, 137–151. [Google Scholar] [CrossRef]
- Conklin-Brittain, N.; Knott, C.; Wrangham, R.W. Energy Intake by Wild Chimpanzees and Orangutans: Methodological Considerations and a Preliminary Comparison. In Feeding Ecology in Apes and Other Primates: Ecological, Physical, and Behavioral Aspects; Cambridge University Press: Cambridge, UK, 2006; pp. 445–471. [Google Scholar]
- Houle, A.; Wrangham, R.W. Contest Competition for Fruit and Space among Wild Chimpanzees in Relation to the Vertical Stratification of Metabolizable Energy. Anim. Behav. 2021, 175, 231–246. [Google Scholar] [CrossRef]
- Potts, K.B.; Baken, E.; Ortmann, S.; Watts, D.P.; Wrangham, R.W. Variability in Population Density Is Paralleled by Large Differences in Foraging Efficiency in Chimpanzees (Pan troglodytes). Int. J. Primatol. 2015, 36, 1101–1119. [Google Scholar] [CrossRef]
- Israel, G.D. Determining Sample Size; University of Florida: Gainesville, FL, USA, 1992. [Google Scholar]
- Kwak, S.G.; Kim, J.H. Central Limit Theorem: The Cornerstone of Modern Statistics. Korean J. Anesthesiol. 2017, 70, 144–156. [Google Scholar] [CrossRef]
- Scheiner, S.M.; Gurevitch, J. Design and Analysis of Ecological Experiments; Oxford University Press: New York, NY, USA, 2001. [Google Scholar]
- Wilcox, R.R. Introduction to Robust Estimation and Hypothesis Testing (Statistical Modeling and Decision Science), 3rd ed.; Academic Press: Boston, MA, USA, 2012. [Google Scholar]
- Mair, P.; Wilcox, R. Robust Statistical Methods Using WRS2. Behav. Res. Methods 2020, 52, 464–488. [Google Scholar] [CrossRef]
- Mair, P.; Wilcox, R.; Patil, I.; Mair, M.P. Package ‘WRS2’. 2021. Available online: https://cran.fhcrc.org/web/packages/WRS2/WRS2.pdf (accessed on 20 June 2021).
- R Core Team. R Foundation for Statistical Computing; R: A Language and Environment for Statistical Computing: Vienna, Austria, 2017. [Google Scholar]
- Lehmann, J.; Boesch, C. To Fission or to Fusion: Effects of Community Size on Wild Chimpanzee (Pan troglodytes verus) Social Organisation. Behav. Ecol. Sociobiol. 2004, 56, 207–216. [Google Scholar] [CrossRef]
- Bates, L.A.; Byrne, R.W. Sex Differences in the Movement Patterns of Free-Ranging Chimpanzees (Pan troglodytes schweinfurthii): Foraging and Border Checking. Behav. Ecol. Sociobiol. 2009, 64, 247–255. [Google Scholar] [CrossRef]
- Murray, C.M.; Lonsdorf, E.V.; Eberly, L.E.; Pusey, A.E. Reproductive Energetics in Free-Living Female Chimpanzees (Pan troglodytes schweinfurthii). Behav. Ecol. 2009, 20, 1211–1216. [Google Scholar] [CrossRef]
- Matsumoto-Oda, A.; Oda, R. Changes in the Activity Budget of Cycling Female Chimpanzees. Am. J. Primatol. 1999, 46, 157–166. [Google Scholar] [CrossRef]
- Maurice, M.E.; Gildas, O.A.F.; Ekale, B.N.; Fawoh, J.J. The Activity Budget of Adult Chimpanzees (Pan troglodytes troglodytes) and Environmental Conditions in Mefou Primate Sanctuary, Centre Region, Cameroon. Asian J. Res. Zool. 2020, 13–25. [Google Scholar] [CrossRef]
- Matsumoto-Oda, A. Behavioral Seasonality in Mahale Chimpanzees. Primates 2002, 43, 103–117. [Google Scholar] [CrossRef]
- Potts, K.B.; Watts, D.P.; Wrangham, R.W. Comparative Feeding Ecology of Two Communities of Chimpanzees (Pan troglodytes) in Kibale National Park, Uganda. Int. J. Primatol. 2011, 32, 669–690. [Google Scholar] [CrossRef]
- Houle, A.; Conklin-Brittain, N.L.; Wrangham, R.W. Vertical Stratification of the Nutritional Value of Fruit: Macronutrients and Condensed Tannins: Intratree Variations in Macronutrients. Am. J. Primatol. 2014, 76, 1207–1232. [Google Scholar] [CrossRef] [PubMed]
- Conklin-Brittain, N.L.; Wrangham, R.W.; Hunt, K.D. Dietary Response of Chimpanzees and Cercopithecines to Seasonal Variation in Fruit Abundance. II. Macronutrients. Int. J. Primatol. 1998, 19, 971–998. [Google Scholar] [CrossRef]
- Furuichi, T.; Hashimoto, C.; Tashiro, Y. Fruit Availability and Habitat Use by Chimpanzees in the Kalinzu Forest, Uganda: Examination of Fallback Foods. Int. J. Primatol. 2001, 22, 929–945. [Google Scholar] [CrossRef]
- Watts, D.P.; Potts, K.B.; Lwanga, J.S.; Mitani, J.C. Diet of Chimpanzees (Pan troglodytes schweinfurthii) at Ngogo, Kibale National Park, Uganda, 2. Temporal Variation and Fallback Foods: Chimpanzee Diet Variation at Ngogo. Am. J. Primatol. 2012, 74, 130–144. [Google Scholar] [CrossRef]
- Naughton-Treves, L. Predicting Patterns of Crop Damage by Wildlife around Kibale National Park, Uganda. Conserv. Biol. 1998, 12, 156–168. [Google Scholar] [CrossRef]
- Bryson-Morrison, N.; Beer, A.; Gaspard Soumah, A.; Matsuzawa, T.; Humle, T. The Macronutrient Composition of Wild and Cultivated Plant Foods of West African Chimpanzees (Pan troglodytes verus) Inhabiting an Anthropogenic Landscape. Am. J. Primatol. 2020, 82, e23102. [Google Scholar] [CrossRef]
- Feedipedia. Ear Maize. Available online: https://www.feedipedia.org/node/713 (accessed on 20 June 2021).
- Bodnár, K.; Mousavi, S.M.N.; Nagy, J. Evaluation of Dry Matter Accumulation of Maize (Zea mays L.) Hybrids. Acta Agrar. Debreceniensis 2018, 74, 35–41. [Google Scholar] [CrossRef]
- Wilson, M.L.; Hauser, M.D.; Wrangham, R.W. Chimpanzees (Pan troglodytes) Modify Grouping and Vocal Behaviour in Response to Location-Specific Risk. Behaviour 2007, 144, 1621–1653. [Google Scholar] [CrossRef]
- Tarnaud, L.; Garcia, C.; Krief, S.; Simmen, B. Apports nutritionnels, dépense et bilan énergétiques chez l’homme et les primates non-humains: Aspects méthodologiques1. Rev. Primatol. 2010, 2. [Google Scholar] [CrossRef]
- Pontzer, H. Energy Expenditure in Humans and Other Primates: A New Synthesis. Annu. Rev. Anthropol. 2015, 44, 169–187. [Google Scholar] [CrossRef]
- Kaiyala, K.J.; Ramsay, D.S. Direct Animal Calorimetry, the Underused Gold Standard for Quantifying the Fire of Life. Comp. Biochem. Physiol. Part A Mol. Integr. Physiol. 2011, 158, 252–264. [Google Scholar] [CrossRef]
- Hoogwerf, B.J.; Goetz, C. Urinary C-Peptide: A Simple Measure of Integrated Insulin Production with Emphasis on the Effects of Body Size, Diet, and Corticosteroids*. J. Clin. Endocrinol. Metab. 1983, 56, 60–67. [Google Scholar] [CrossRef]
- Sherry, D.S.; Ellison, P.T. Potential Applications of Urinary C-Peptide of Insulin for Comparative Energetics Research. Am. J. Phys. Anthropol. 2007, 133, 771–778. [Google Scholar] [CrossRef]
- Valé, P.D.; Béné, J.-C.K.; N’Guessan, A.K.; Crockford, C.; Deschner, T.; Koné, I.; Girard-Buttoz, C.; Wittig, R.M. Energetic Management in Wild Chimpanzees (Pan troglodytes verus) in Taï National Park, Côte d’Ivoire. Behav. Ecol. Sociobiol. 2021, 75, 1. [Google Scholar] [CrossRef]
- Higham, J.P.; Girard-Buttoz, C.; Engelhardt, A.; Heistermann, M. Urinary C-Peptide of Insulin as a Non-Invasive Marker of Nutritional Status: Some Practicalities. PLoS ONE 2011, 6, e22398. [Google Scholar] [CrossRef]
- Minetti, A.E.; Moia, C.; Roi, G.S.; Susta, D.; Ferretti, G. Energy Cost of Walking and Running at Extreme Uphill and Downhill Slopes. J. Appl. Physiol. 2002, 93, 1039–1046. [Google Scholar] [CrossRef]
- Campbell, M.J.; Dennison, P.E.; Butler, B.W.; Page, W.G. Using Crowdsourced Fitness Tracker Data to Model the Relationship between Slope and Travel Rates. Appl. Geogr. 2019, 106, 93–107. [Google Scholar] [CrossRef]
- Hill, L.; Swain, D.; Hill, E. Energy Balance during Backpacking. Int. J. Sports Med. 2008, 29, 883–887. [Google Scholar] [CrossRef] [PubMed][Green Version]
- Looney, D.P.; Santee, W.R.; Hansen, E.O.; Bonventre, P.J.; Chalmers, C.R.; Potter, A.W. Estimating Energy Expenditure during Level, Uphill, and Downhill Walking. Med. Sci. Sports Exerc. 2019, 51, 1954–1960. [Google Scholar] [CrossRef]
- Richmond, P.W.; Potter, A.W.; Santee, W.R. Terrain Factors for Predicting Walking and Load Carriage Energy Costs: Review and Refinement. J. Sport Hum. Perform. 2015, 3, 1–26. [Google Scholar] [CrossRef]
- Schmitt, C.A.; Rich, A.M.; Parke, S.-A.R.; Blaszczyk, M.B.; Cramer, J.D.; Freimer, N.B.; Grobler, J.P.; Turner, T.R. Anthropogenic Food Enhancement Alters the Timing of Maturational Landmarks among Wild Savanna Monkeys (Chlorocebus pygerythrus). bioRxiv 2020. [Google Scholar] [CrossRef]
- Leith, D.A.; Mpofu, B.S.; van Velden, J.L.; Reed, C.C.; van Boom, K.M.; Breed, D.; Kohn, T.A. Are Cape Peninsula Baboons Raiding Their Way to Obesity and Type II Diabetes?—A Comparative Study. Comp. Biochem. Physiol. Part A Mol. Integr. Physiol. 2020, 250, 110794. [Google Scholar] [CrossRef] [PubMed]
- Krief, S.; Berny, P.; Gumisiriza, F.; Gross, R.; Demeneix, B.; Fini, J.B.; Chapman, C.A.; Chapman, L.J.; Seguya, A.; Wasswa, J. Agricultural Expansion as Risk to Endangered Wildlife: Pesticide Exposure in Wild Chimpanzees and Baboons Displaying Facial Dysplasia. Sci. Total Environ. 2017, 598, 647–656. [Google Scholar] [CrossRef]
- Spirhanzlova, P.; Fini, J.-B.; Demeneix, B.; Lardy-Fontan, S.; Vaslin-Reimann, S.; Lalere, B.; Guma, N.; Tindall, A.; Krief, S. Composition and Endocrine Effects of Water Collected in the Kibale National Park in Uganda. Environ. Pollut. 2019, 251, 460–468. [Google Scholar] [CrossRef]
- Wrangham, R.W.; Chapman, C.A.; Chapman, L.J. Seed Dispersal by Forest Chimpanzees in Uganda. J. Trop. Ecol. 1994, 10, 355–368. [Google Scholar] [CrossRef]
- Bakker, J.P.; Poschlod, P.; Strykstra, R.J.; Bekker, R.M.; Thompson, K. Seed Banks and Seed Dispersal: Important Topics in Restoration Ecology. Acta Bot. Neerl. 1996, 45, 461–490. [Google Scholar] [CrossRef]
- Ordaz-Németh, I.; Sop, T.; Amarasekaran, B.; Bachmann, M.; Boesch, C.; Brncic, T.; Caillaud, D.; Campbell, G.; Carvalho, J.; Chancellor, R.; et al. Range-wide Indicators of African Great Ape Density Distribution. Am. J. Primatol. 2021, 83, e23338. [Google Scholar] [CrossRef]


| Category | Code | Description |
|---|---|---|
| Feeding | F | Ingestion of a food item (including wadging) |
| Resting | R | Prolonged motionless and inactive state, sit or laid down |
| Traveling | T | Locomotion on the ground from one point to another (excluding displaying and chasing) |
| Moving in trees | M | Locomotion in a tree, vertically or horizontally (including to forage or socialize) |
| Social activities | SA | Interaction with another individual or self-grooming |
| High social activities | HSA | Interaction involving locomotion or important body movements (copulating, displaying, chasing, playing) |
| Low social activities | LSA | Motionless interaction (including grooming, self-grooming, vocalizing, etc.) |
| Species | Part | Kibale National Park | |||||||
|---|---|---|---|---|---|---|---|---|---|
| SBL 1 | KNP 2 | KWRA.1 3 | KWRA.2 4 | KWRA.3 5 | NGO 6 | Bulindi 7 | |||
| N | X (SD) | ||||||||
| Aphania senegalensis | RF | 3 | 4.23 (0.07) | - | - | - | - | - | - |
| Cordia abyssinica | RF | 2 | 4.42 (0.55) | - | - | - | 3.28 | - | - |
| Ficus sansibarica | RF | 3 | 4.75 (0.68) | 4.64 | 2.20 | 3.05 | 3.28 | 2.96 | 3.36 |
| Ficus saussureana | RF | 5 | 4.60 (0.38) | 4.47 | - | - | - | - | - |
| Ficus exasperata | RF | 2 | 4.23 (0.16) | 5.03 | - | 2.90 | - | - | 3.45 |
| URF | 1 | 5.10 (-) | - | 1.90 | 2.99 | - | - | - | |
| Ficus mucoso | RF | 2 | 4.53 (0.08) | - | 2.40 | - | - | 2.83 | 3.56 |
| Ficus natalensis | RF | 6 | 4.49 (0.05) | 4.37 | 1.30 | - | 2.93 | - | 3.23 |
| URF | - | 4.49 * | - | - | - | 2.56 | - | - | |
| Ficus sur | RF | 24 | 4.53 (0.69) | 4.53 | - | 2.55 | 3.13 | 2.60 | 3.41 |
| URF | 5 | 4.41 (0.38) | - | - | - | 2.80 | - | - | |
| Mimusops bagshawei | RF | - | 4.50 * | - | - | 2.93 | 3.03 | 2.89 | - |
| URF | 2 | 4.50 (0.09) | - | - | - | 2.78 | - | - | |
| All | Maize | No Maize | |||||
|---|---|---|---|---|---|---|---|
| HFA | LFA | na | HFA | LFA | na | ||
| All | 206 | 31 | 51 | 10 | 48 | 63 | 3 |
| 80% * | 112 | 30 | 29 | - | 14 | 33 | 6 |
| Response Variable | Dependent Variable | Q Statistics | p-Value |
|---|---|---|---|
| Ingestion rate | Maize | 0.002 | 0.965 |
| FAI | 2.011 | 0.163 | |
| Maize * FAI | 0.059 | 0.810 | |
| Daily length traveled (DLT) | Maize | 2.310 | 0.133 |
| FAI | 0.015 | 0.902 | |
| Maize * FAI | 0.002 | 0.968 | |
| Energy expenditure (TDEE) | Maize | 0.032 | 0.860 |
| FAI | 0.580 | 0.449 | |
| Maize * FAI | 3.974 | 0.050 | |
| Energy balance | Maize | 0.005 | 0.943 |
| FAI | 1.075 | 0.305 | |
| Maize * FAI | 0.549 | 0.462 |
| Two-Way MANOVA | Pillai’s Trace | F | n df | df | p-Value | |
|---|---|---|---|---|---|---|
| Response Variable | Dependent Variable | |||||
| Feed, rest, travel | Maize | 0.043 | 2.799 | 3 | 187 | 0.041 * |
| FAI | 0.005 | 0.307 | 3 | 187 | 0.820 | |
| Maize * FAI | 0.014 | 0.863 | 3 | 187 | 0.461 | |
| Two-Way ANOVA (post hoc test) | SS | F | n df | df | p-Value | |
| Response Variable | Dependent Variable | |||||
| Feed | Maize | 66.3 | 0.500 | 1 | 189 | 0.480 |
| FAI | 44.8 | 0.338 | 1 | 189 | 0.562 | |
| Maize * FAI | 8.5 | 0.050 | 1 | 189 | 0.800 | |
| Rest | Maize | 1232 | 5.238 | 1 | 189 | 0.023 * |
| FAI | 185 | 0.786 | 1 | 189 | 0.376 | |
| Maize * FAI | 47 | 0.202 | 1 | 189 | 0.654 | |
| Travel | Maize | 2278 | 7.934 | 1 | 189 | 0.005 ** |
| FAI | 18 | 0.028 | 1 | 189 | 0.562 | |
| Maize * FAI | 473 | 1.649 | 1 | 189 | 0.800 | |
| Sex-Age Class | All | 80% * | ||||||||
|---|---|---|---|---|---|---|---|---|---|---|
| Ni | NFNN | DLT (m·h−1) | TDEE (kcal·h−1) | % Frugivory | Ni | NFNN | Ingestion Rate (kcal·min−1) | Energy Balance (kcal·h−1) | ||
| X (SD) | X (SD) | X (SD) | X (SD) | X (SD) | ||||||
| Females | AF | 3 | 9 | 175 (102) | 114 (5.4) | 85.1 (23.7) | 3 | 6 | 48.1 (20.1) | 314.3 (252.6) |
| MO | 5 | 36 | 155 (140) | 169 (20.6) | 85.5 (20.3) | 5 | 21 | 49.3 (15.9) | 479.1 (425.6) | |
| Males | AM | 9 | 147 | 299 (172) | 135 (10.6) | 84.1 (21.8) | 8 | 77 | 47.4 (27.9) | 460.3 (418) |
| YO | 3 | 14 | 241 (144) | 133 (8.9) | 79.6 (29.5) | 3 | 8 | 45.5 (18.7) | 426.1 (289.6) | |
| All | 20 | 206 | 264 (172) | 140 (19) | 84 (22.1) | 19 | 112 | 47.7 (24.9) | 453.5 (402.1) | |
| Hypothesis: Opportunistic Maize Consumption by Chimpanzees | |||||||
|---|---|---|---|---|---|---|---|
| Maize | Wild Fruits | Rest | Travel/Daily Paths | Wild Frugivory and Intakes | Energy Expenditures | ||
| 1 | High/low | + | − | − | − | ||
| 0 | High/low | − | + | + | + | ||
| Results: Opportunistic Maize Consumption by Chimpanzees | |||||||
| Maize | Wild Fruits | Rest (%) | Travel (%) | Daily Paths (m·h−1) | Wild Frugivory (%) | Wild Intake (kcal·min−1) | Energy Expenditure (kcal·h−1) |
| 1 | High/low * | 28.5 | 32.6 | 282.7 | 84.2 | 48.0 | 139.6 |
| ˄ | ˅ | = | = | = | = | ||
| 0 | High/low ** | 34.2 | 26.2 | 241.5 | 83.9 | 47.3 | 139.8 |
Publisher’s Note: MDPI stays neutral with regard to jurisdictional claims in published maps and institutional affiliations. |
© 2022 by the authors. Licensee MDPI, Basel, Switzerland. This article is an open access article distributed under the terms and conditions of the Creative Commons Attribution (CC BY) license (https://creativecommons.org/licenses/by/4.0/).
Share and Cite
Couturier, C.; Bortolamiol, S.; Ortmann, S.; Okimat, J.-P.; Asalu, E.; Krief, S. All-You-Can-Eat: Influence of Proximity to Maize Gardens on the Wild Diet and the Forest Activities of the Sebitoli Chimpanzee Community in Kibale National Park. Animals 2022, 12, 806. https://doi.org/10.3390/ani12070806
Couturier C, Bortolamiol S, Ortmann S, Okimat J-P, Asalu E, Krief S. All-You-Can-Eat: Influence of Proximity to Maize Gardens on the Wild Diet and the Forest Activities of the Sebitoli Chimpanzee Community in Kibale National Park. Animals. 2022; 12(7):806. https://doi.org/10.3390/ani12070806
Chicago/Turabian StyleCouturier, Chloé, Sarah Bortolamiol, Sylvia Ortmann, John-Paul Okimat, Edward Asalu, and Sabrina Krief. 2022. "All-You-Can-Eat: Influence of Proximity to Maize Gardens on the Wild Diet and the Forest Activities of the Sebitoli Chimpanzee Community in Kibale National Park" Animals 12, no. 7: 806. https://doi.org/10.3390/ani12070806
APA StyleCouturier, C., Bortolamiol, S., Ortmann, S., Okimat, J.-P., Asalu, E., & Krief, S. (2022). All-You-Can-Eat: Influence of Proximity to Maize Gardens on the Wild Diet and the Forest Activities of the Sebitoli Chimpanzee Community in Kibale National Park. Animals, 12(7), 806. https://doi.org/10.3390/ani12070806