
In Vitro Production of Neutrophils Extracellular Traps Is Affected by the Lactational Stage of Dairy Cows

 ,
,  , and
, and 
Abstract
:Simple Summary
Abstract
1. Introduction
2. Materials and Methods
2.1. Reagents and Materials
2.2. Ethical Approval and Sample Size Calculation
2.3. Experiment 1: Effect of the Lactational Stage on Circulating PMN Production of NETs and ROS
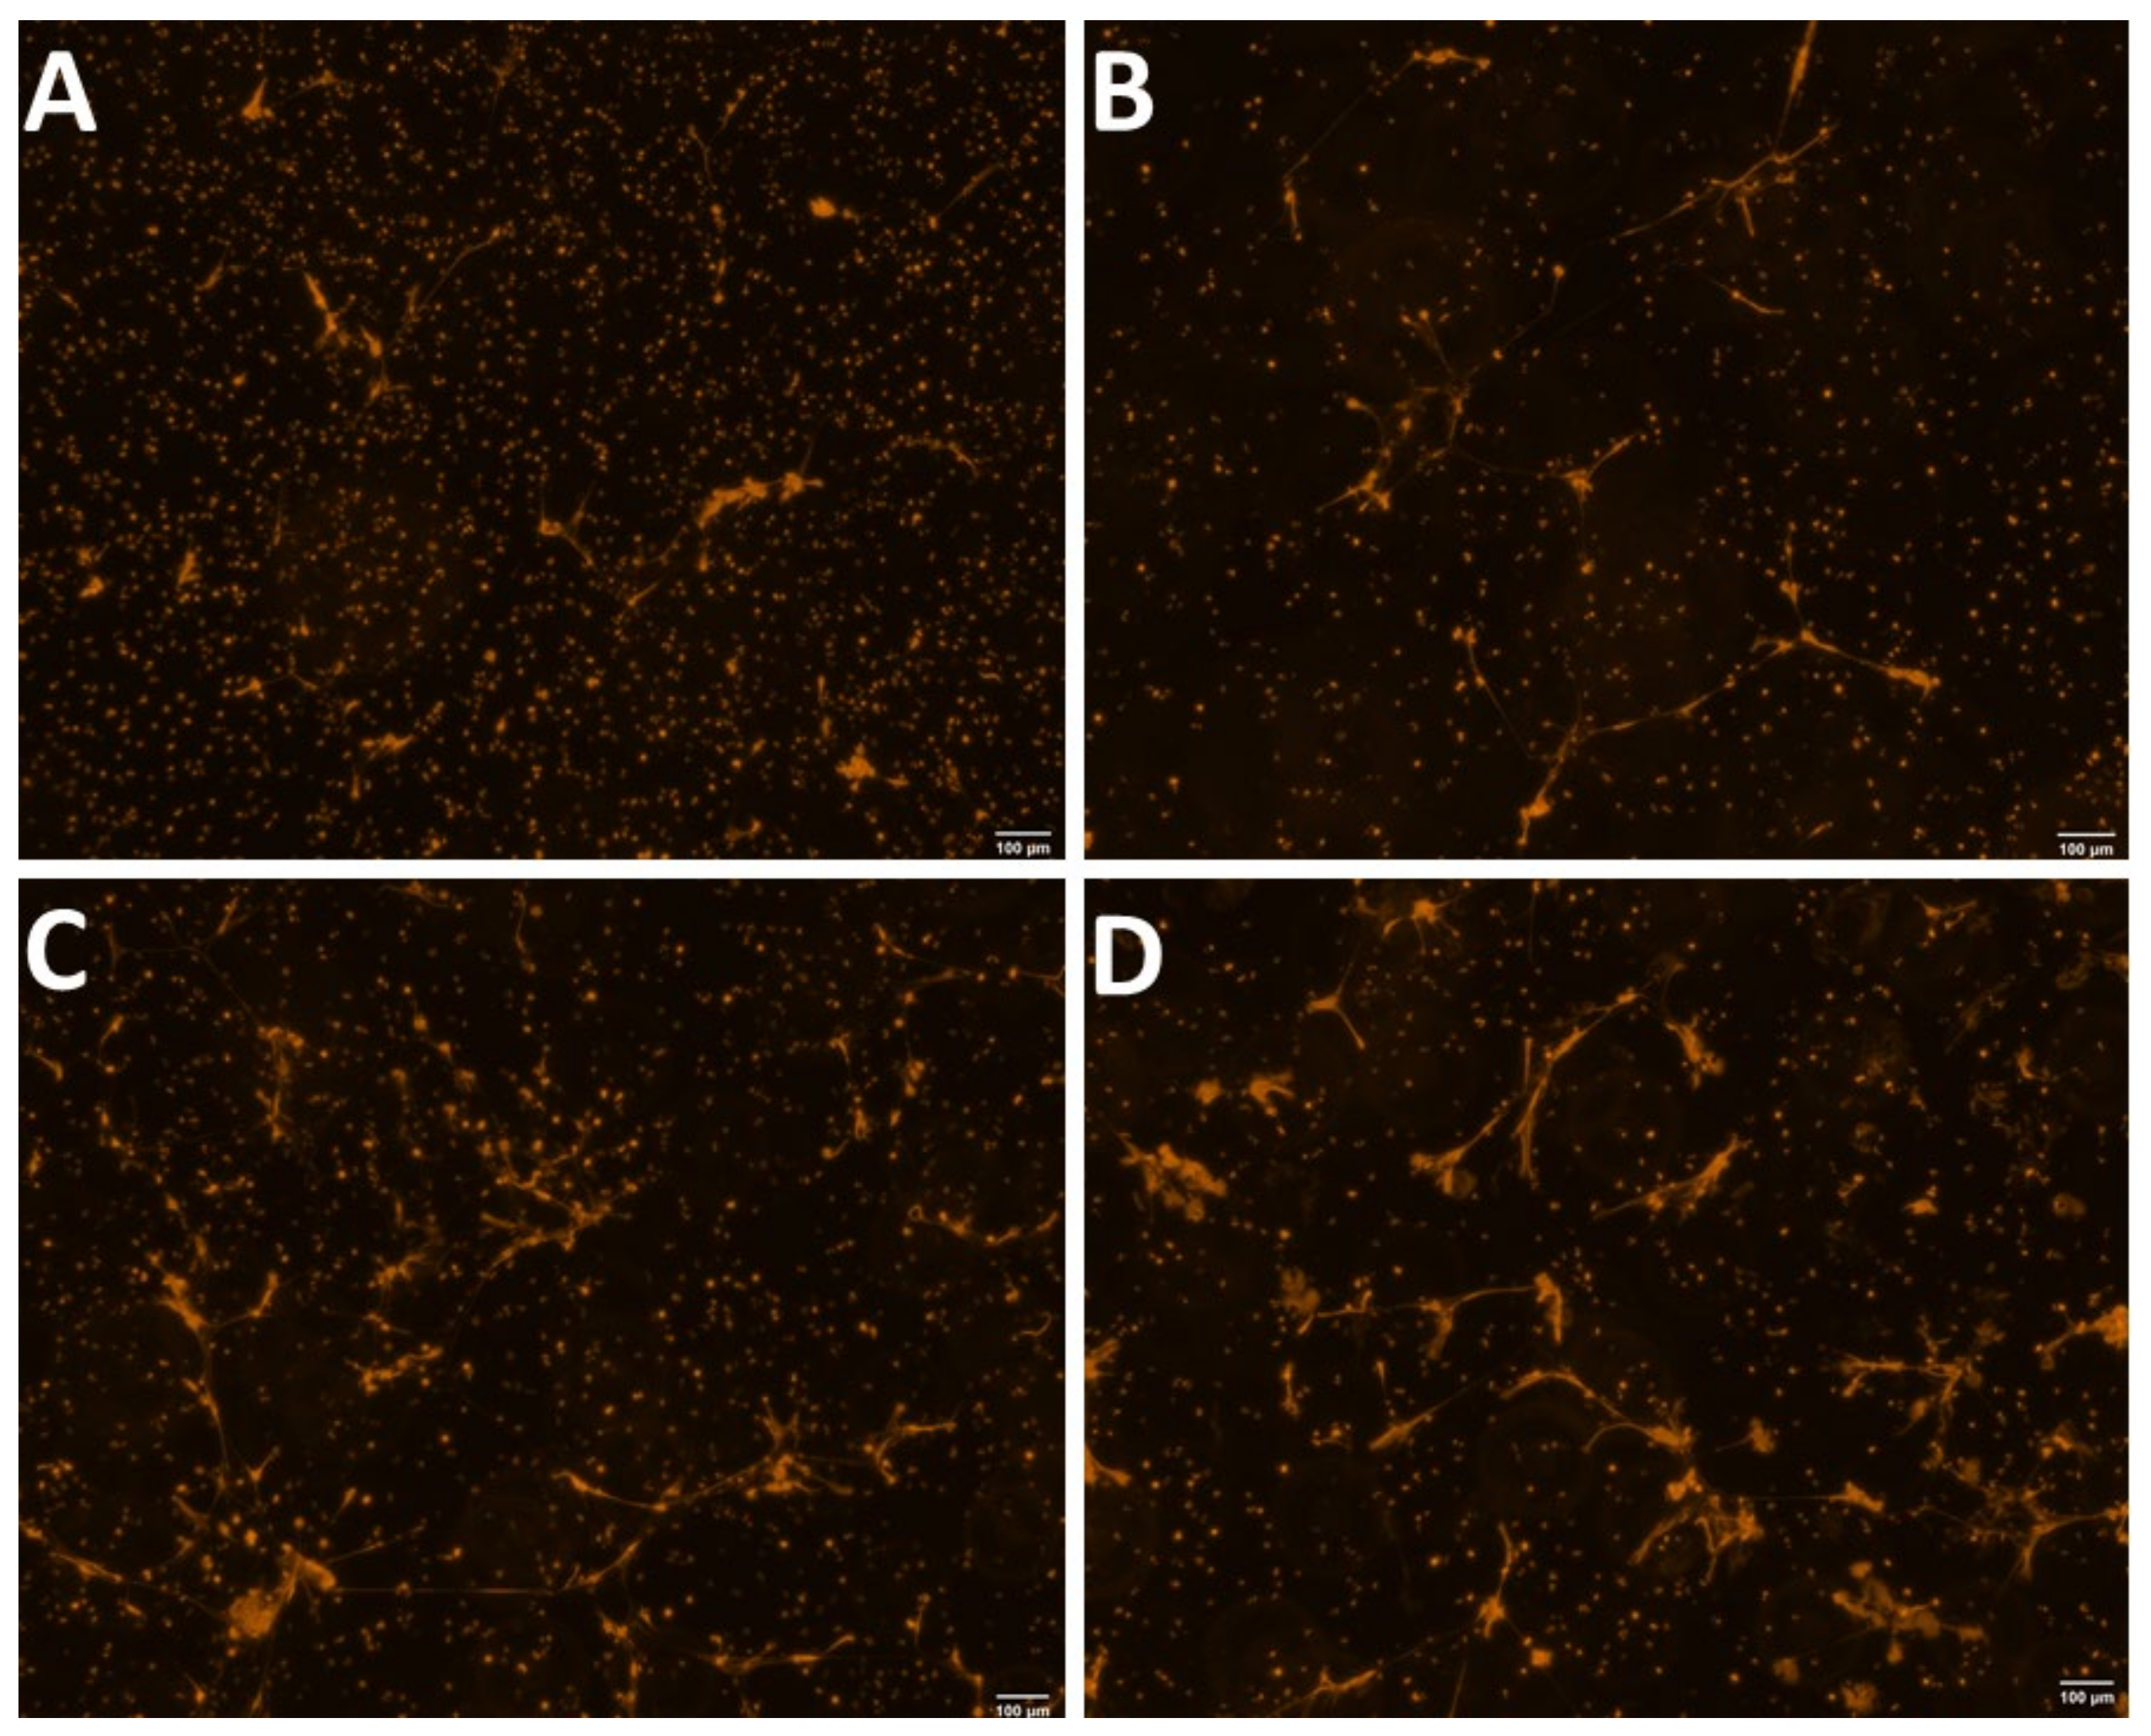
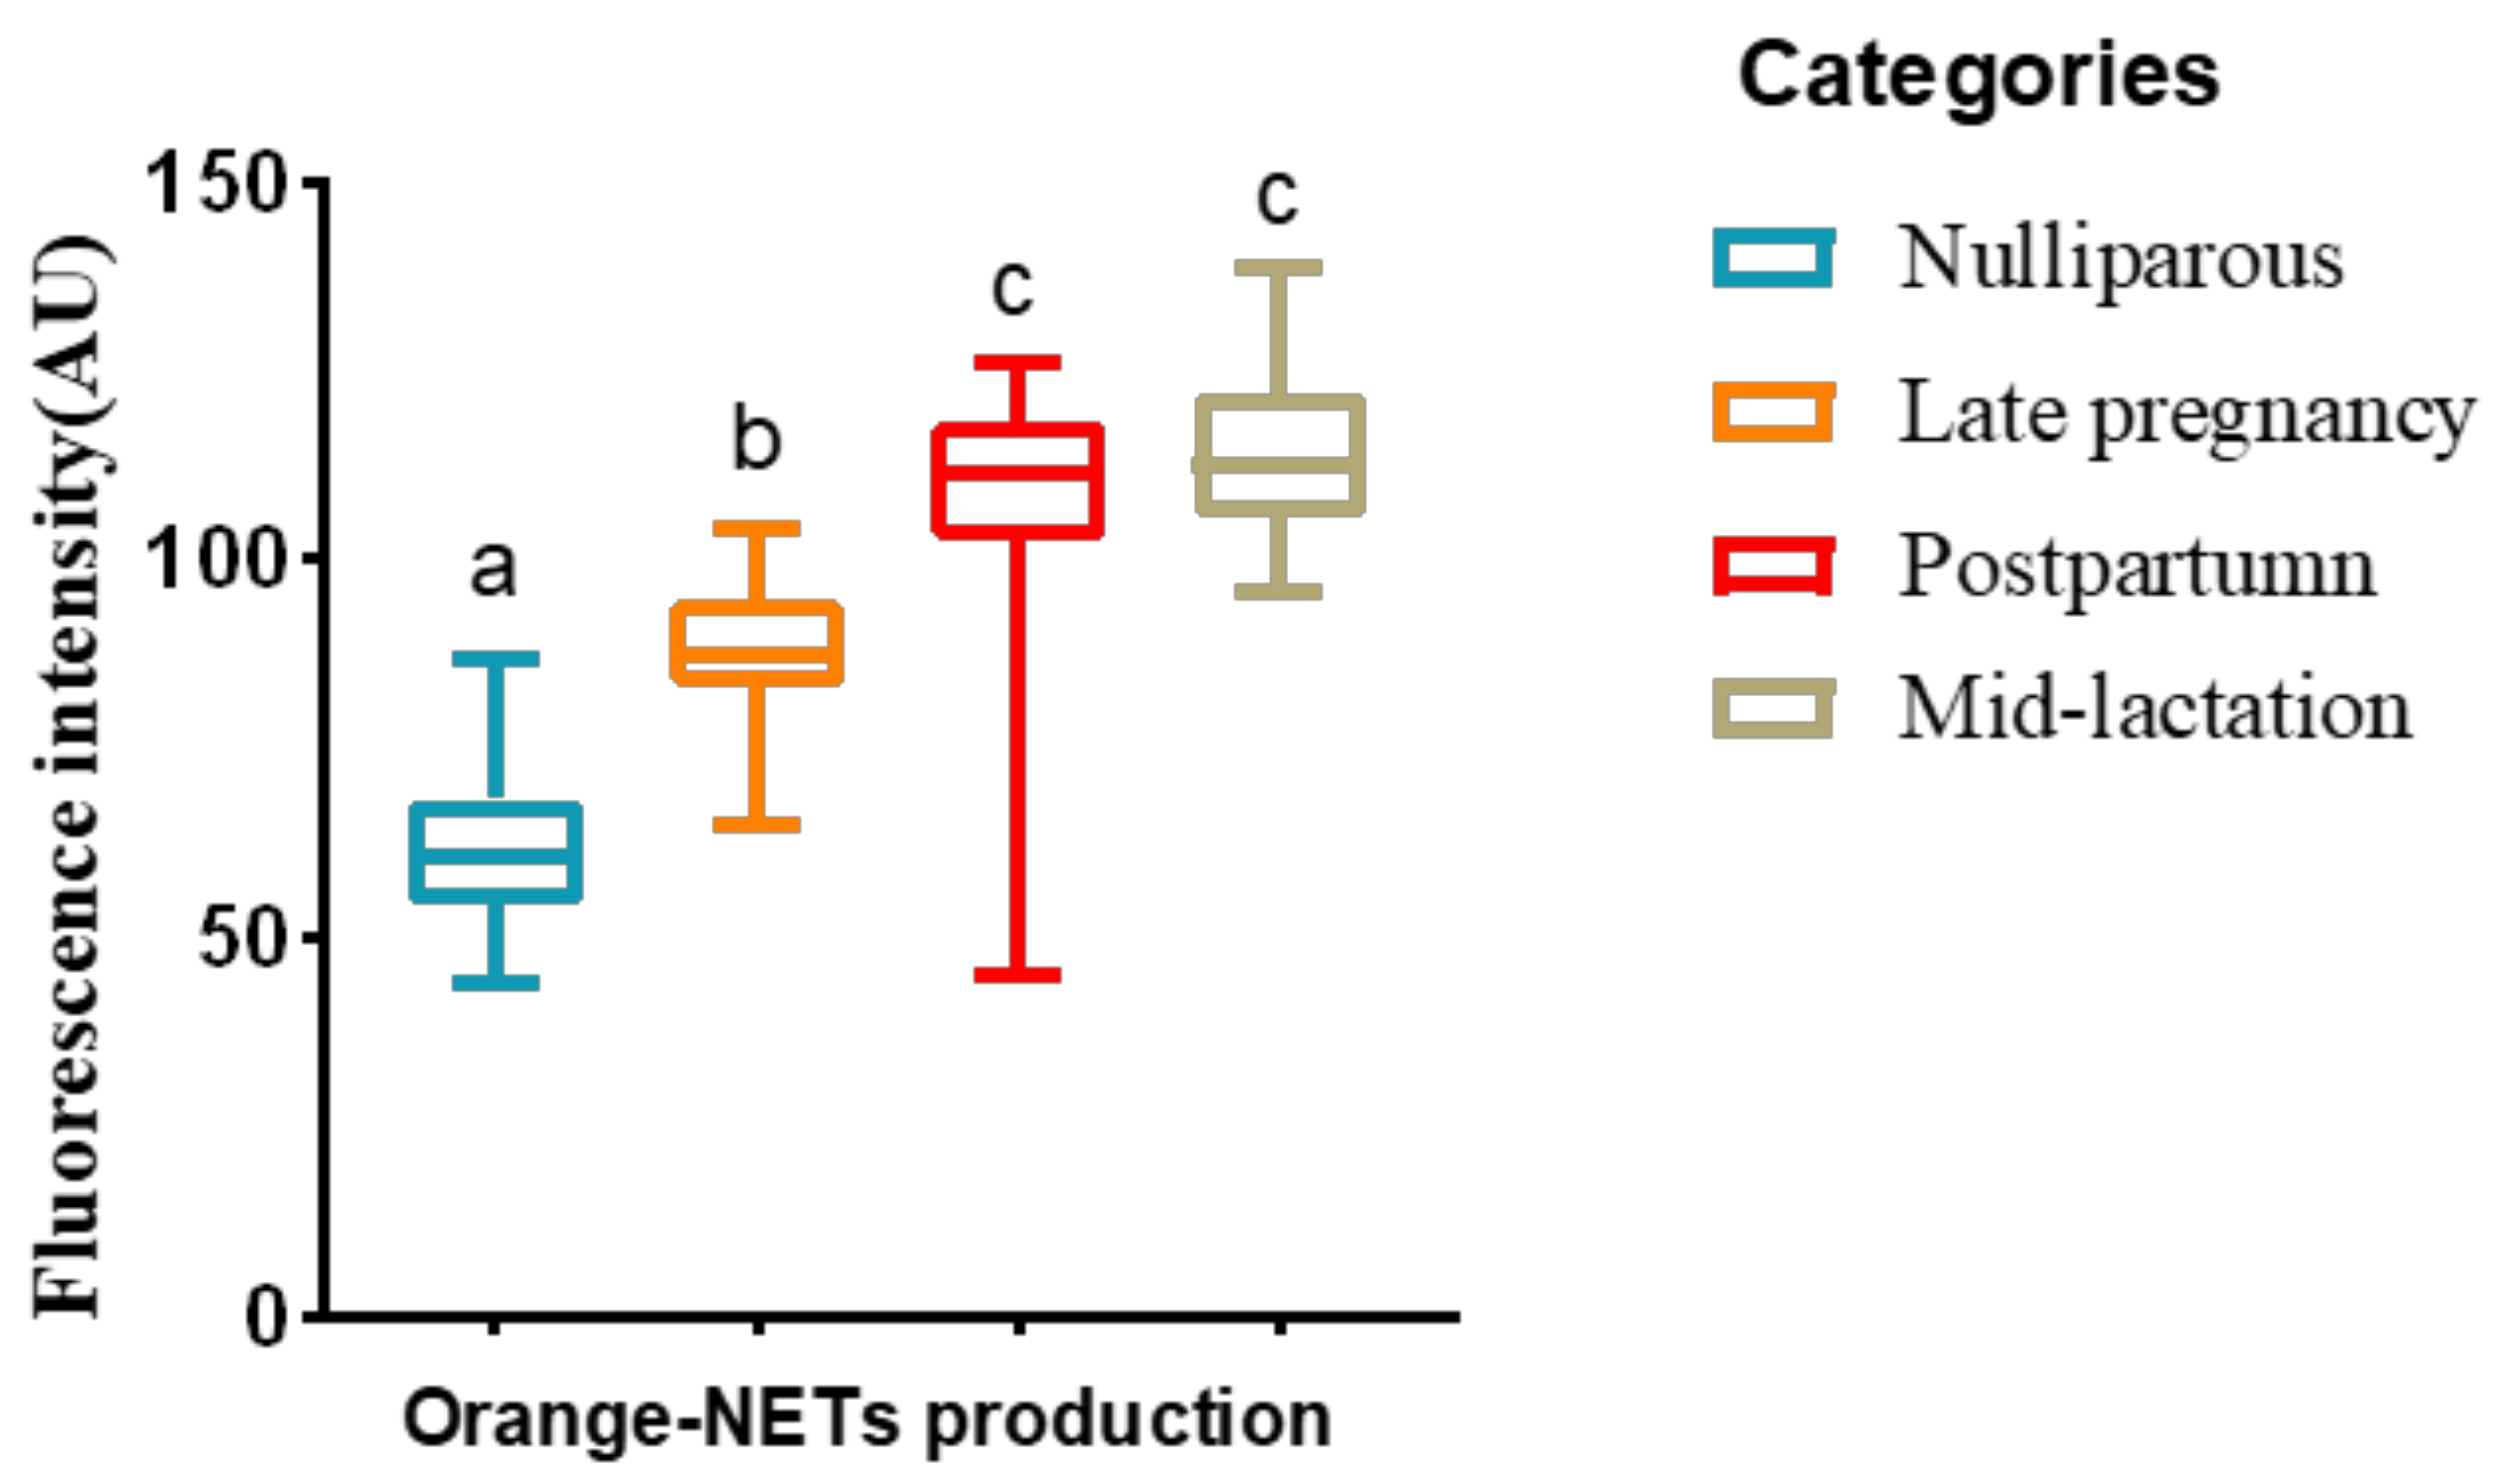
2.3.1. Morphological Observation and Quantification of NETs
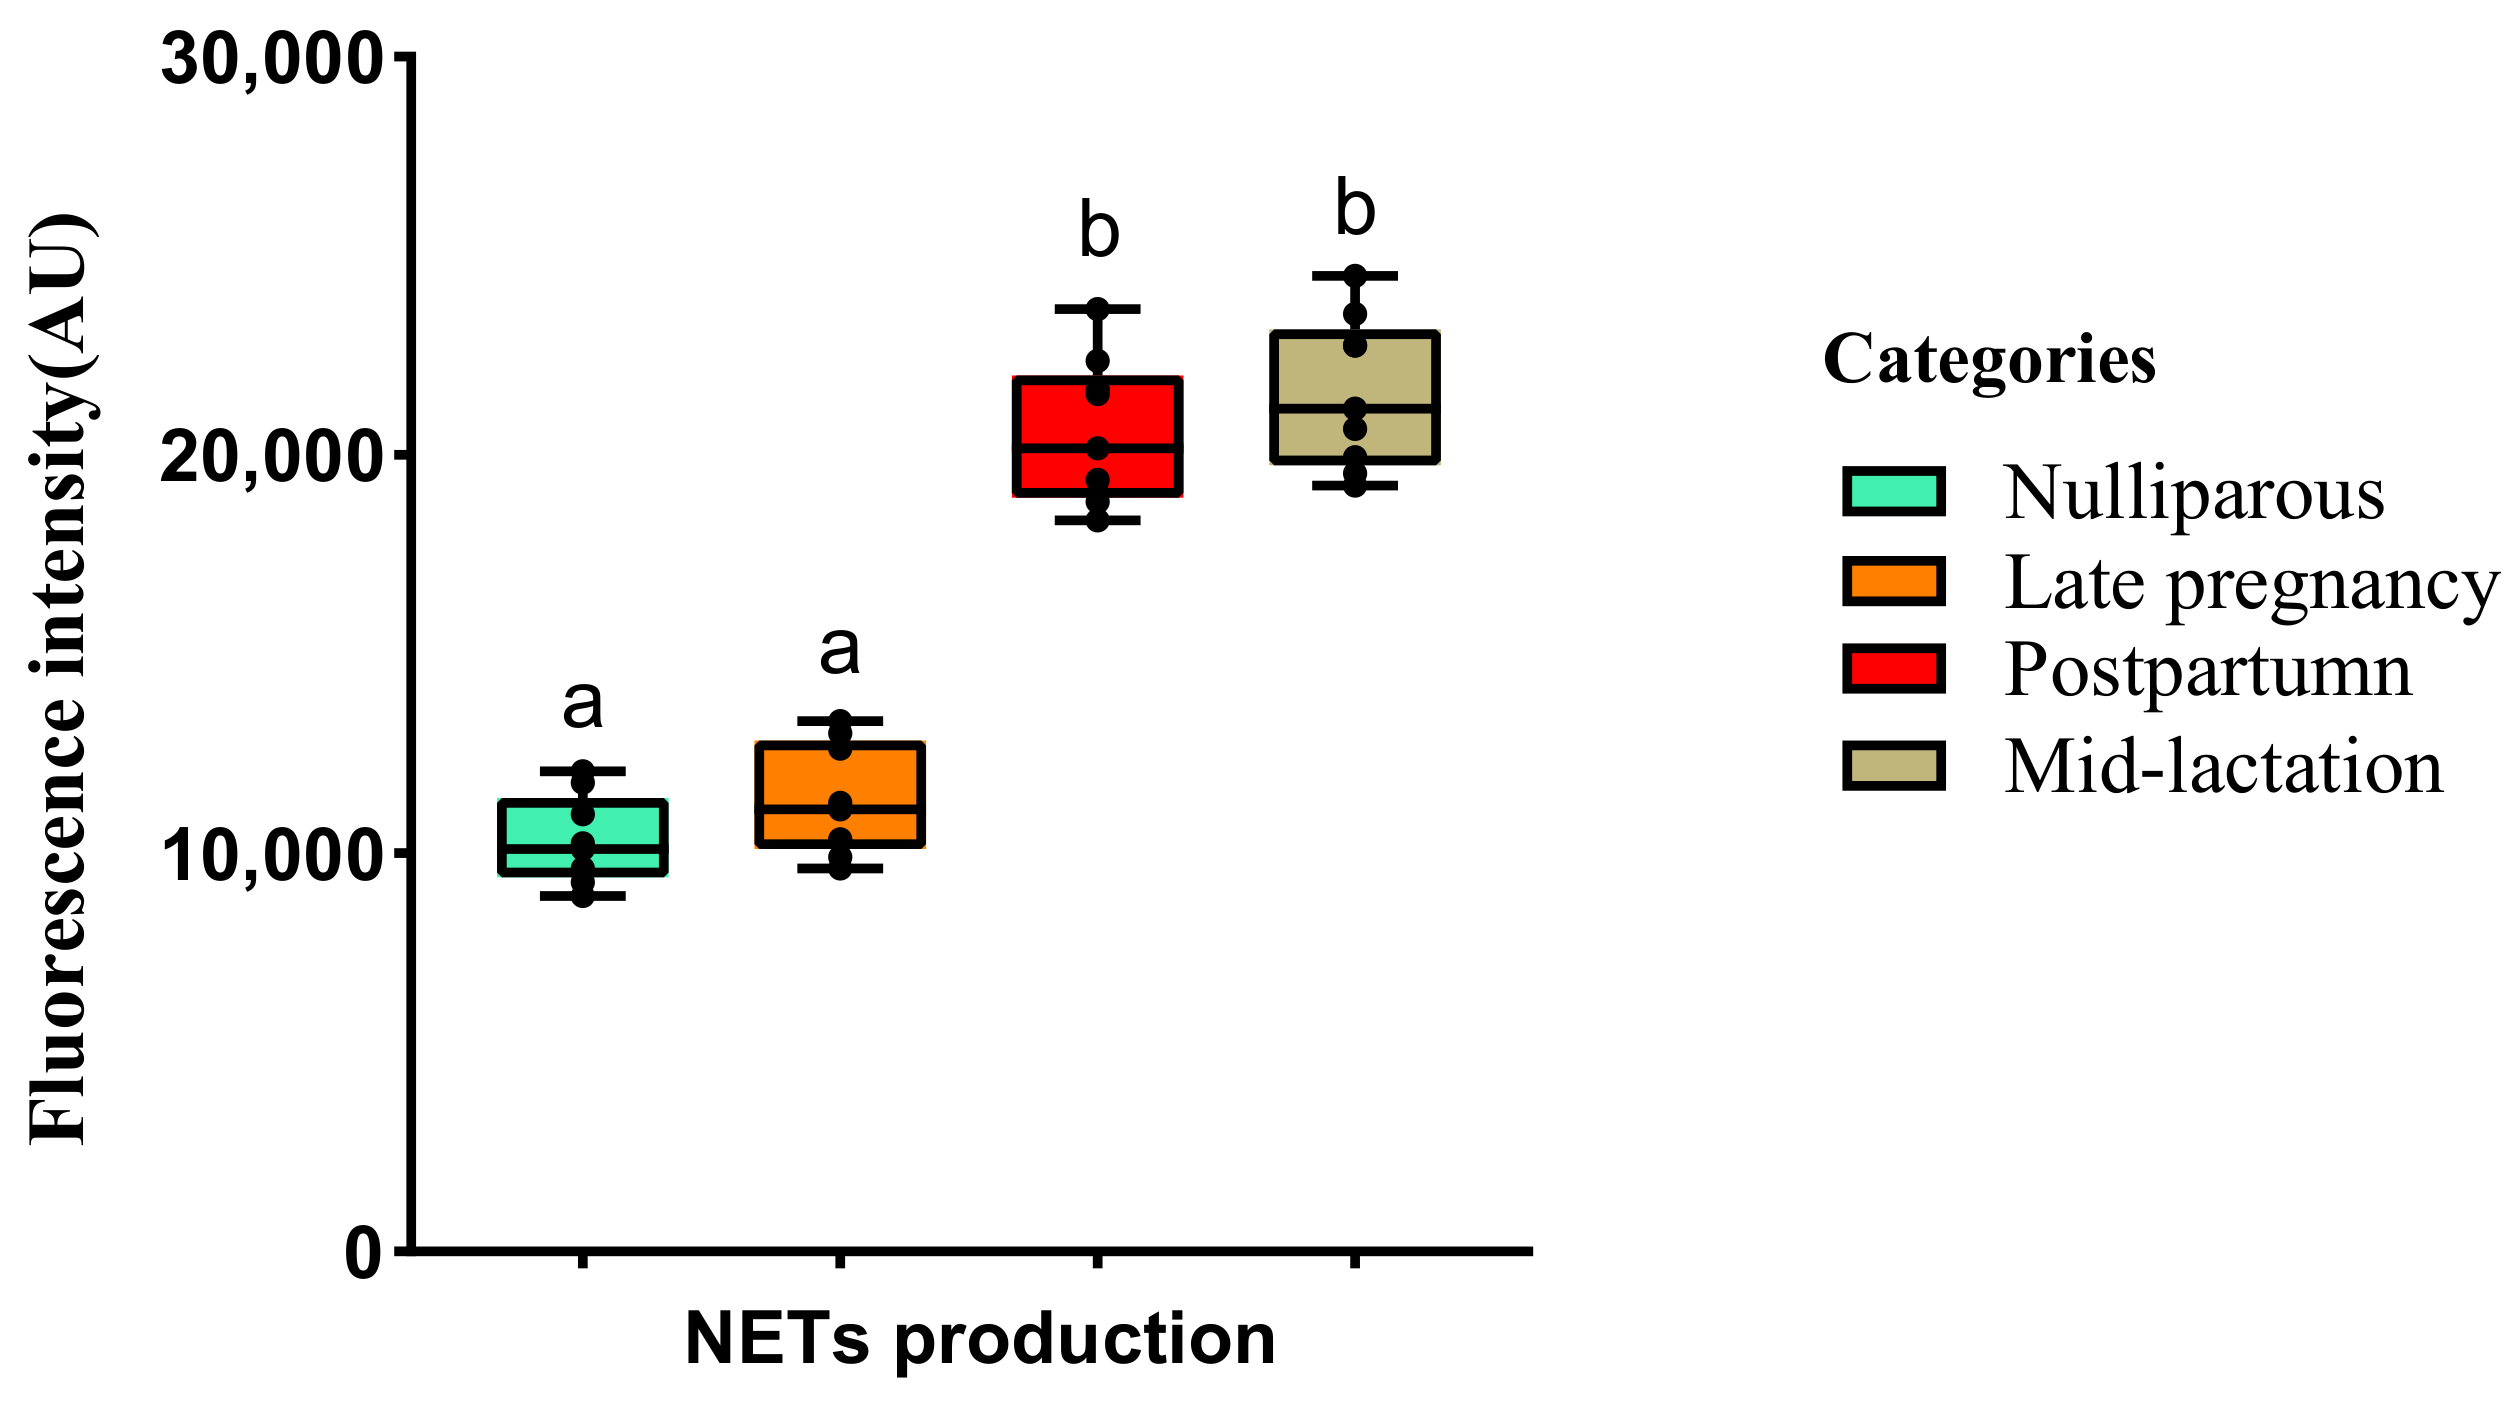
2.3.2. dsDNA Quantification of NETs
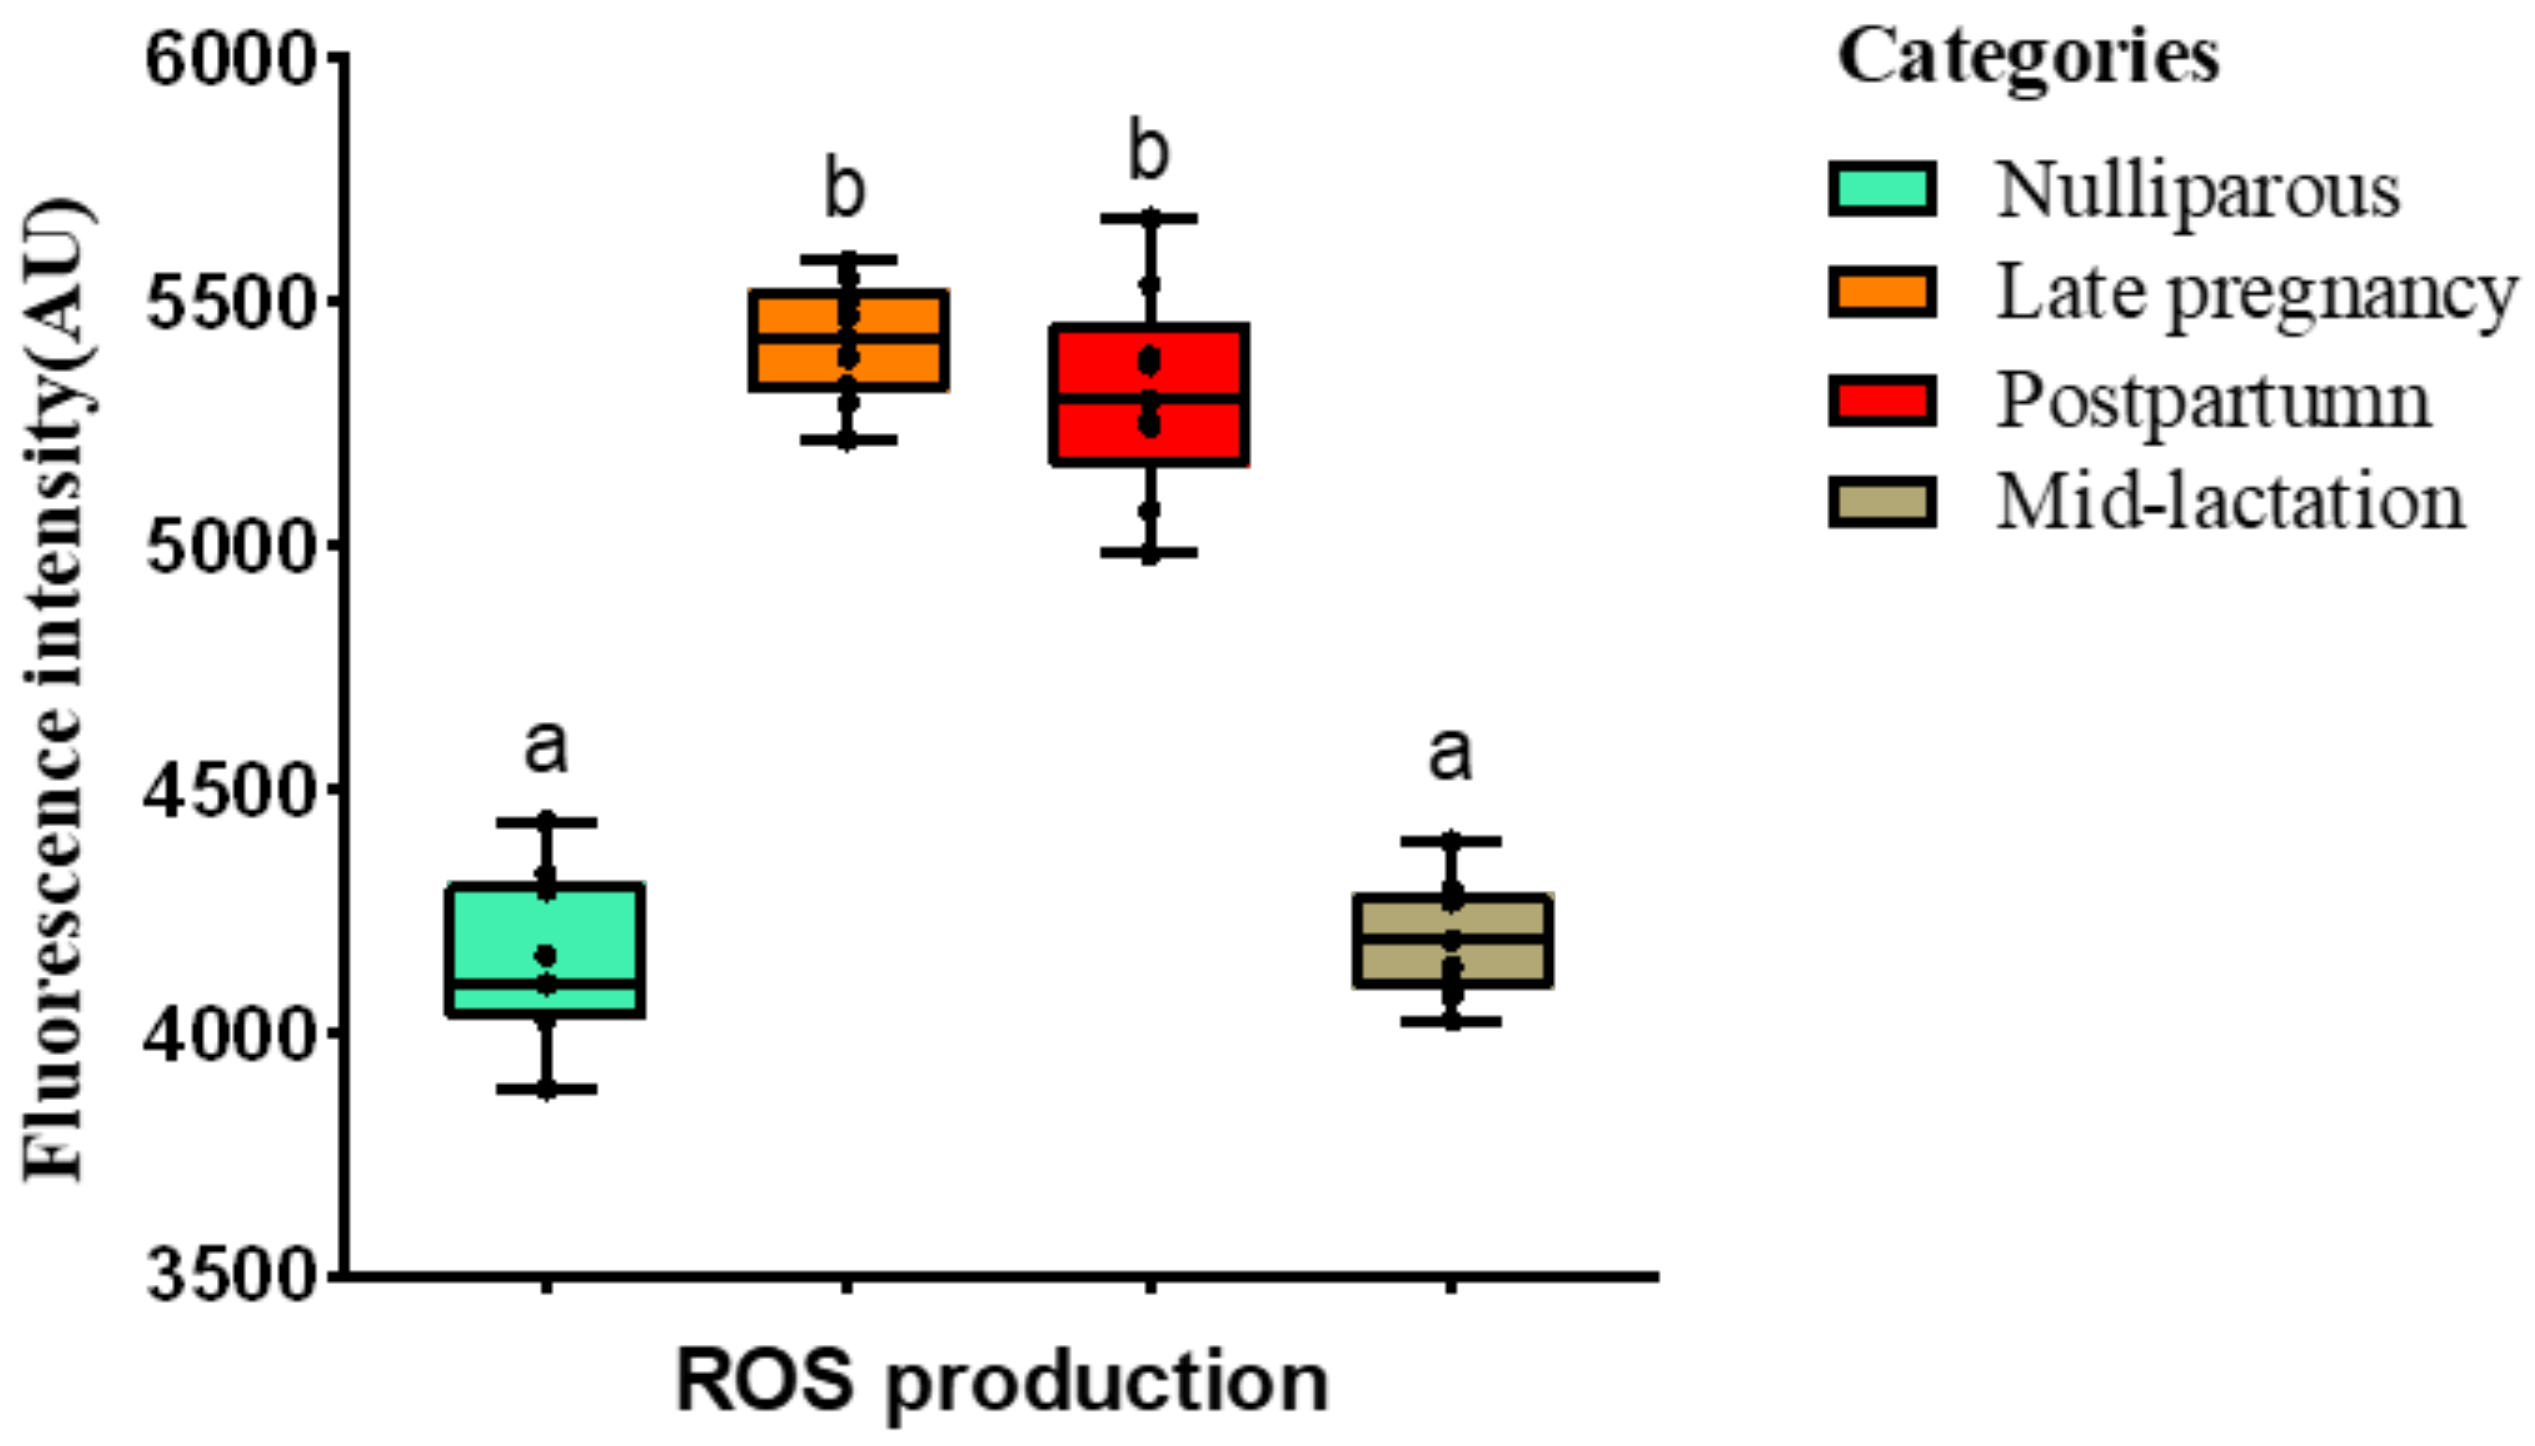
2.3.3. Detection of ROS
2.4. Experiment 2: Validation of a Model to Simulate the In Vitro Production of NETs and ROS by Circulating PMN
2.5. Statistical Analysis
3. Results
3.1. Experiment 1: Effect of the Lactational Stage on Circulating PMN Production of NETs and ROS
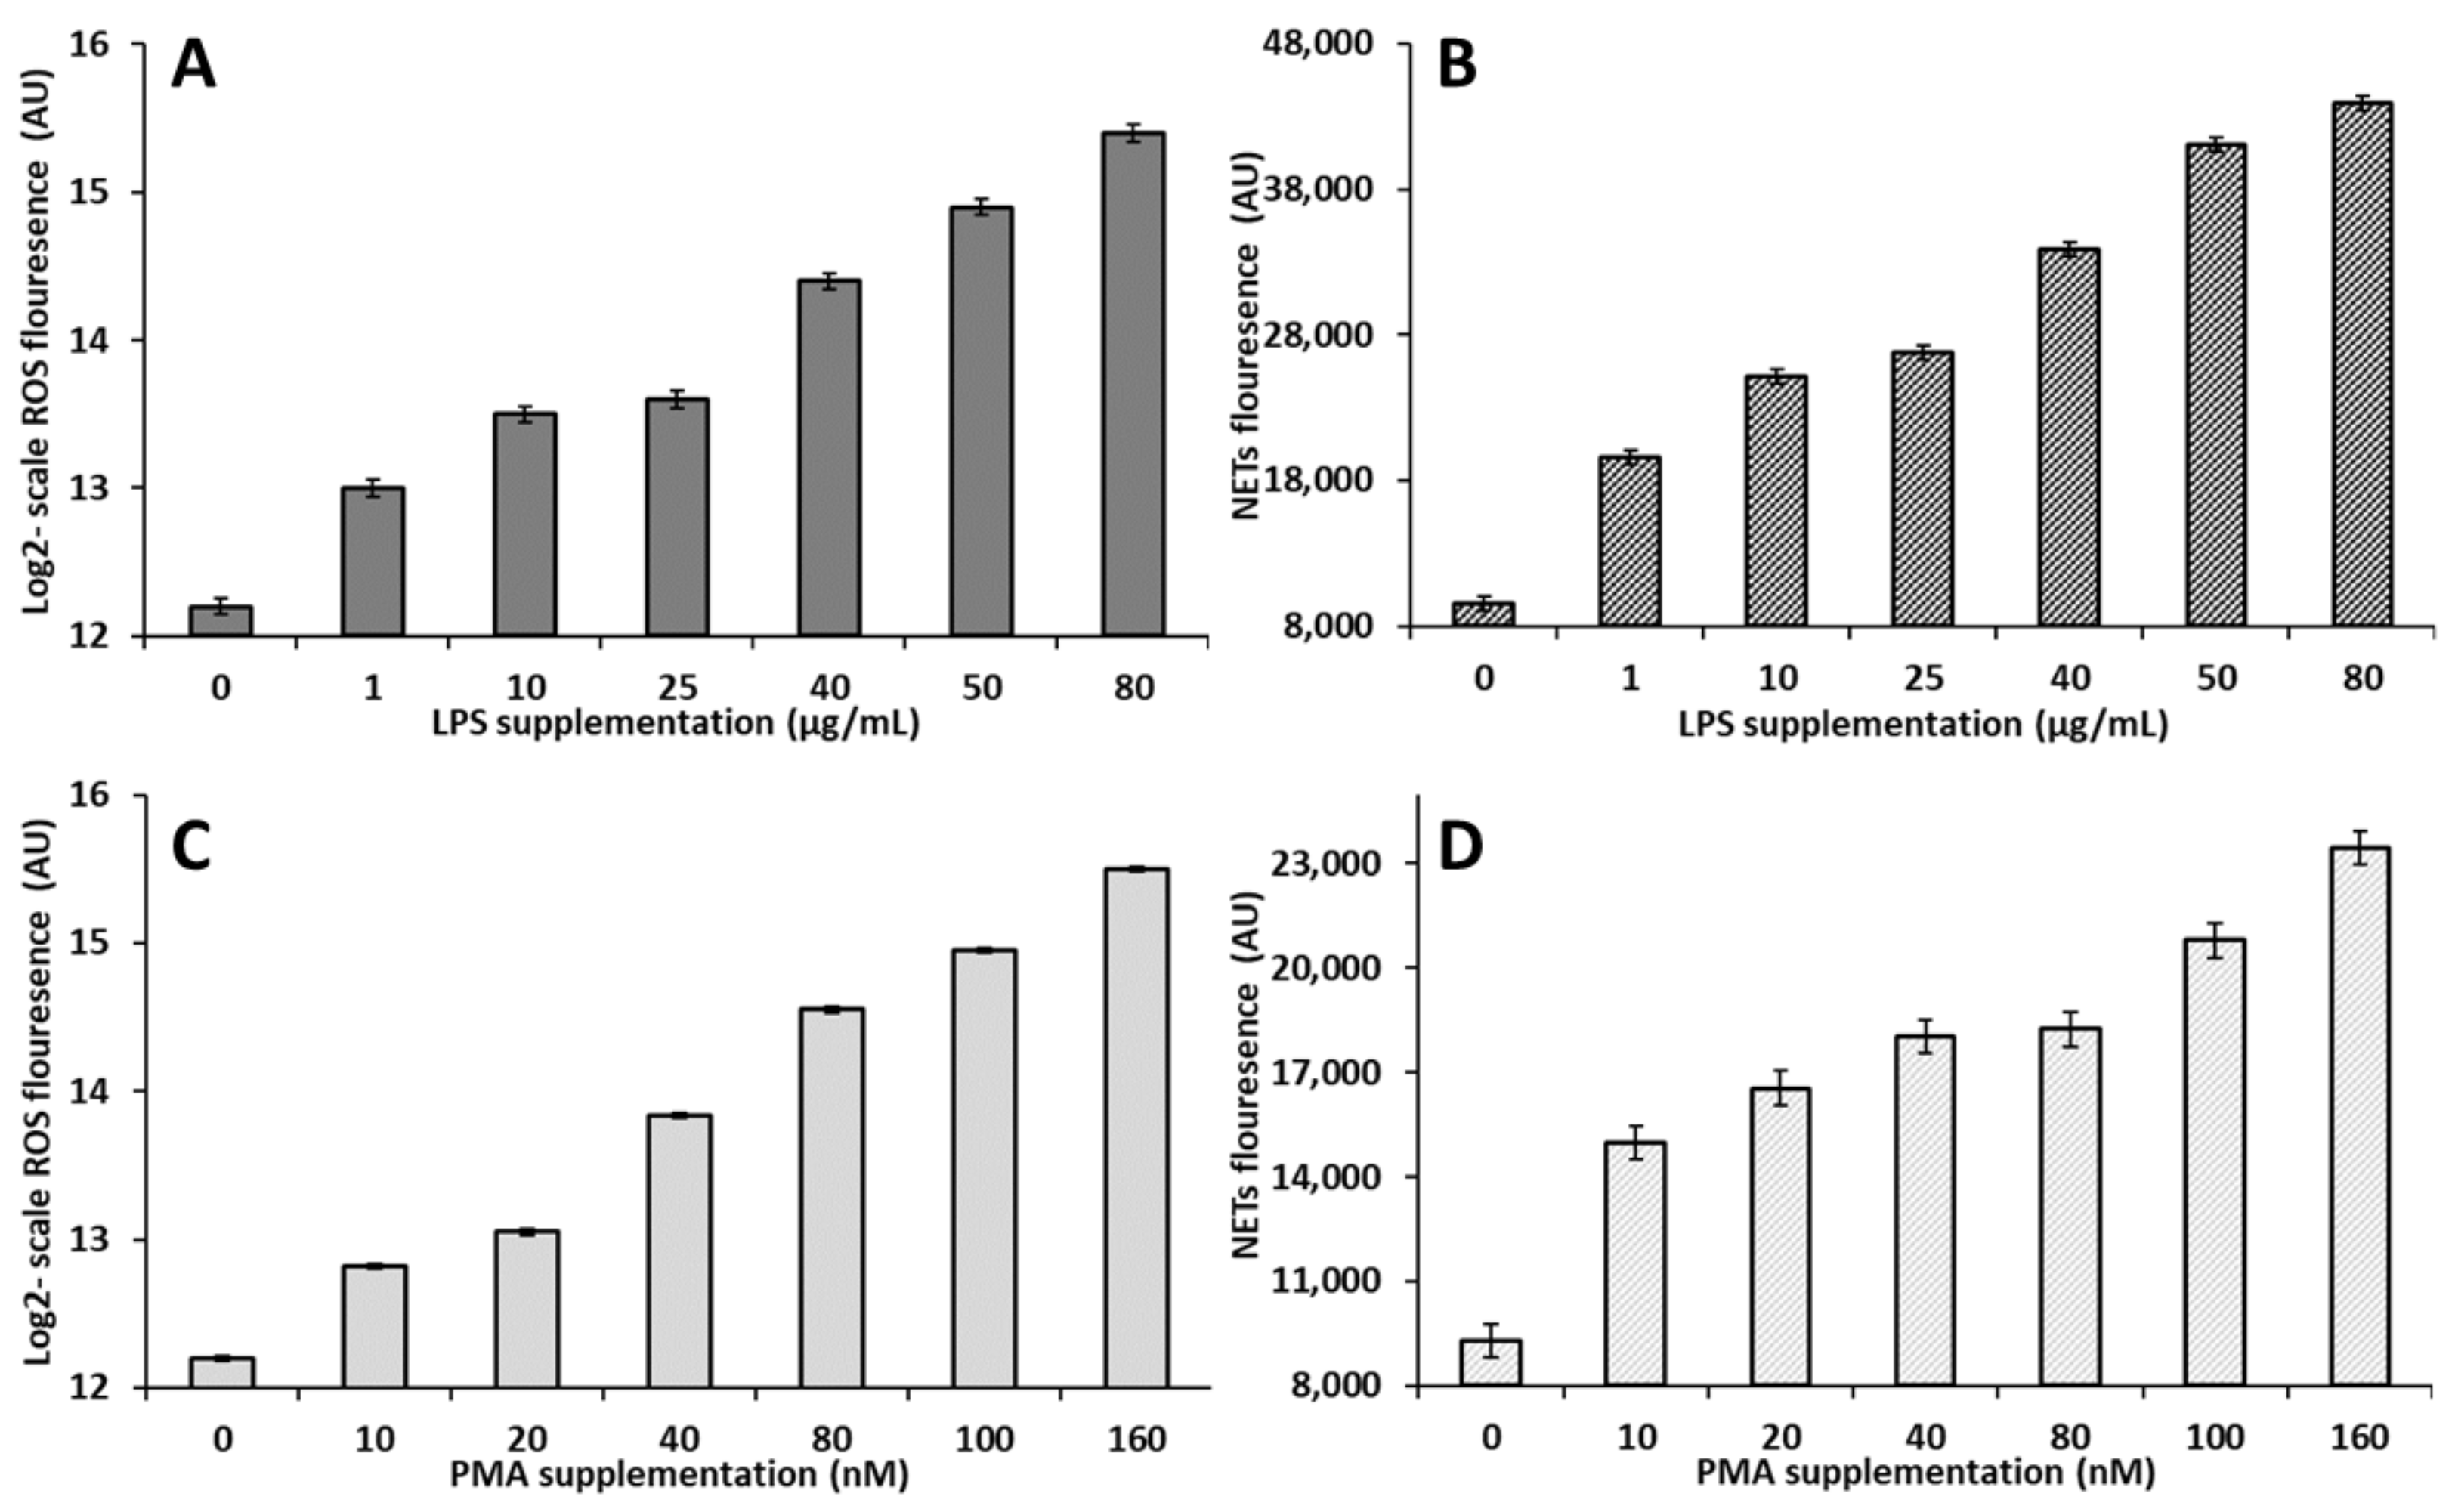
3.2. Experiment 2: Validation of a Model to Simulate the In Vitro Production of NETs and ROS by Circulating PMN
4. Discussion
5. Conclusions
Author Contributions
Funding
Institutional Review Board Statement
Data Availability Statement
Acknowledgments
Conflicts of Interest
References
- Bradford, B.J.; Swartz, T.H. Review: Following the smoke signals: Inflammatory signaling in metabolic homeostasis and homeorhesis in dairy cattle. Animal 2020, 14, s144–s154. [Google Scholar] [CrossRef] [PubMed] [Green Version]
- Sordillo, L.M.; Raphael, W. Significance of Metabolic Stress, Lipid Mobilization, and Inflammation on Transition Cow Disorders. Vet. Clin. North. Am. Food. Anim. Pract. 2013, 29, 267–278. [Google Scholar] [CrossRef] [PubMed]
- Pascottini, O.B.; Leroy, J.; Opsomer, G. Metabolic Stress in the Transition Period of Dairy Cows: Focusing on the Prepartum Period. Animals 2020, 10, 1419. [Google Scholar] [CrossRef] [PubMed]
- Dubuc, J.; Duffield, T.F.; Leslie, K.E.; Walton, J.S.; LeBlanc, S.J. Risk factors for postpartum uterine diseases in dairy cows. J. Dairy. Sci. 2010, 93, 5764–5771. [Google Scholar] [CrossRef] [PubMed]
- Vanacker, N.; Girard, C.L.; Blouin, R.; Lacasse, P. Effects of feed restriction and supplementary folic acid and vitamin B (12) on immune cell functions and blood cell populations in dairy cows. Animal 2020, 14, 339–345. [Google Scholar] [CrossRef] [PubMed]
- Esposito, G.; Raffrenato, E.; Lukamba, S.D.; Adnane, M.; Irons, P.C.; Cormican, P.; Tasara, T.; Chapwanya, A. Characterization of metabolic and inflammatory profiles of transition dairy cows fed an energy-restricted diet. J. Anim. Sci. 2020, 98, skz391. [Google Scholar] [CrossRef]
- Borregaard, N. Neutrophils, from Marrow to Microbes. Immunity 2010, 33, 657–670. [Google Scholar] [CrossRef] [Green Version]
- McCarthy, M.M.; Yasui, T.; Felippe, M.J.B.; Overton, T.R. Associations between the degree of early lactation inflammation and performance, metabolism, and immune function in dairy cows. J. Dairy. Sci. 2016, 99, 680–700. [Google Scholar] [CrossRef] [Green Version]
- Pascottini, O.B.; LeBlanc, S.J. Modulation of immune function in the bovine uterus peripartum. Theriogenology 2020, 150, 193–200. [Google Scholar] [CrossRef]
- Brinkmann, V.; Reichard, U.; Goosmann, C.; Fauler, B.; Uhlemann, Y.; Weiss, D.S.; Weinrauch, Y.; Zychlinsky, A. Neutrophil extracellular traps kill bacteria. Science 2004, 303, 1532–1535. [Google Scholar] [CrossRef]
- Xie, L.; Ma, Y.; Opsomer, G.; Pascottini, O.B.; Guan, Y.; Dong, Q. Neutrophil extracellular traps in cattle health and disease. Res. Vet. Sci. 2021, 139, 4–10. [Google Scholar] [CrossRef] [PubMed]
- Li, T.; Zhang, Z.; Li, X.; Dong, G.; Zhang, M.; Xu, Z.; Yang, J. Neutrophil Extracellular Traps: Signaling Properties and Disease Relevance. Mediators. Inflamm. 2020, 2020, 9254087. [Google Scholar] [CrossRef] [PubMed]
- Wei, Z.; Wang, J.; Wang, Y.; Wang, C.; Liu, X.; Han, Z.; Fu, Y.; Yang, Z. Effects of Neutrophil Extracellular Traps on Bovine Mammary Epithelial Cells in vitro. Front. Immunol. 2019, 10, 1003. [Google Scholar] [CrossRef] [PubMed] [Green Version]
- Worku, M.; Rehrah, D.; Ismail, H.D.; Asiamah, E.; Adjei-Fremah, S. A Review of the Neutrophil Extracellular Traps (NETs) from Cow, Sheep and Goat Models. Int. J. Mol. Sci. 2021, 22, 8046. [Google Scholar] [CrossRef] [PubMed]
- Sacks, D.; Baxter, B.; Campbell, B.C.V.; Carpenter, J.S.; Cognard, C.; Dippel, D.; Eesa, M.; Fischer, U.; Hausegger, K.; Hirsch, J.A.; et al. Multisociety Consensus Quality Improvement Revised Consensus Statement for Endovascular Therapy of Acute Ischemic Stroke. Int. J. Stroke 2018, 13, 612–632. [Google Scholar] [CrossRef] [Green Version]
- Seifi, H.A.; Leblanc, S.J.; Leslie, K.E.; Duffield, T.F. Metabolic predictors of post-partum disease and culling risk in dairy cattle. Vet. J. 2011, 188, 216–220. [Google Scholar] [CrossRef]
- Gupta, A.K.; Giaglis, S.; Hasler, P.; Hahn, S. Efficient neutrophil extracellular trap induction requires mobilization of both intracellular and extracellular calcium pools and is modulated by cyclosporine A. PLoS ONE 2014, 9, e97088. [Google Scholar] [CrossRef] [Green Version]
- Jensen, E.C. Quantitative analysis of histological staining and fluorescence using Image. J. Anat. Rec. 2013, 296, 378–381. [Google Scholar] [CrossRef]
- Zhao, Z.; Liu, X.; Shi, S.; Li, H.; Gao, F.; Zhong, X.; Wang, Y. Exogenous hydrogen sulfide protects from endothelial cell damage, platelet activation, and neutrophils extracellular traps formation in hyperhomocysteinemia rats. Exp. Cell. Res. 2018, 370, 434–443. [Google Scholar] [CrossRef]
- Revelo, X.S.; Waldron, M.R. In vitro effects of Escherichia coli lipopolysaccharide on the function and gene expression of neutrophils isolated from the blood of dairy cows. J. Dairy. Sci. 2012, 95, 2422–2441. [Google Scholar] [CrossRef]
- Bornhöfft, K.F.; Rebl, A.; Gallagher, M.E.; Viergutz, T.; Zlatina, K.; Reid, C.; Galuska, S.P. Sialylated Cervical Mucins Inhibit the Activation of Neutrophils to Form Neutrophil Extracellular Traps in Bovine in vitro Model. Front. Immunol. 2019, 10, 2478. [Google Scholar] [CrossRef] [PubMed] [Green Version]
- Alarcón, P.; Manosalva, C.; Quiroga, J.; Belmar, I.; Álvarez, K.; Díaz, G.; Taubert, A.; Hermosilla, C.; Carretta, M.D.; Burgos, R.A.; et al. Oleic and Linoleic Acids Induce the Release of Neutrophil Extracellular Traps via Pannexin 1-Dependent ATP Release and P2X1 Receptor Activation. Front. Vet. Sci. 2020, 7, 260. [Google Scholar] [CrossRef] [PubMed]
- Ster, C.; Loiselle, M.C.; Lacasse, P. Effect of postcalving serum nonesterified fatty acids concentration on the functionality of bovine immune cells. J. Dairy. Sci. 2012, 95, 708–717. [Google Scholar] [CrossRef]
- LeBlanc, S.J. Review: Relationships between metabolism and neutrophil function in dairy cows in the peripartum period. Animal 2020, 14, s44–s54. [Google Scholar] [CrossRef] [PubMed] [Green Version]
- Yazlık, M.O.; Çolakoğlu, H.E.; Pekcan, M.; Kaya, U.; Küplülü, Ş.; Kaçar, C.; Polat, M.; Vural, M.R. Effects of injectable trace element and vitamin supplementation during the gestational, peri-parturient, or early lactational periods on neutrophil functions and pregnancy rate in dairy cows. Anim. Reprod. Sci. 2021, 225, 106686. [Google Scholar] [CrossRef] [PubMed]
- Atan, P.; Yıldız, K. Comparison of Picogreen and Sytox Orange Stains in Quantitative Analysis of Extracellular Trap Formed against Toxoplasma gondii in Polymorphonuclear Leukocytes from Sheep. Turk. Parazitol. Derg. 2018, 42, 240–244. [Google Scholar] [CrossRef]
- Cai, T.Q.; Weston, P.G.; Lund, L.A.; Brodie, B.; McKenna, D.J.; Wagner, W.C. Association between neutrophil functions and periparturient disorders in cows. Am. J. Vet. Res. 1994, 55, 934–943. [Google Scholar]
- Kehrli, M.E., Jr.; Nonnecke, B.J.; Roth, J.A. Alterations in bovine neutrophil function during the periparturient period. Am. J. Vet. Res. 1989, 50, 207–214. [Google Scholar]
- Mehrzad, J.; Dosogne, H.; Meyer, E.; Heyneman, R.; Burvenich, C. Respiratory burst activity of blood and milk neutrophils in dairy cows during different stages of lactation. J. Dairy. Res. 2001, 68, 399–415. [Google Scholar] [CrossRef]
- Mehrzad, J.; Duchateau, L.; Burvenich, C. Phagocytic and bactericidal activity of blood and milk-resident neutrophils against Staphylococcus aureus in primiparous and multiparous cows during early lactation. Vet. Microbiol. 2009, 134, 106–112. [Google Scholar] [CrossRef]
- Lee, J.Y.; Sohn, K.H.; Rhee, S.H.; Hwang, D. Saturated Fatty Acids, but Not Unsaturated Fatty Acids, Induce the Expression of Cyclooxygenase-2 Mediated through Toll-like Receptor 4. J. Biol. Chem. 2001, 276, 16683–16689. [Google Scholar] [CrossRef] [PubMed] [Green Version]
- Hoppenbrouwers, T.; Autar, A.S.A.; Sultan, A.R.; Abraham, T.E.; van Cappellen, W.A.; Houtsmuller, A.B.; van Wamel, W.J.B.; van Beusekom, H.M.M.; van Neck, J.W.; de Maat, M.P.M. In vitro induction of NETosis: Comprehensive live imaging comparison and systematic review. PLoS ONE 2017, 12, e0176472. [Google Scholar] [CrossRef] [PubMed] [Green Version]
- Garrett, W.S.; Onderdonk, A.B. Bacteroides, Prevotella, Porphyromonas, and Fusobacterium Species (and Other Medically Important Anaerobic Gram-Negative Bacilli). In Mandell, Douglas, and Bennett’s Principles and Practice of Infectious Diseases, 8th ed.; Bennett, J.E., Dolin, R., Blaser, M.J., Eds.; W.B. Saunders: Philadelphia, PA, USA, 2015; Volume 2, pp. 2773–2780. [Google Scholar]
- Petretto, A.; Bruschi, M.; Pratesi, F.; Croia, C.; Candiano, G.; Ghiggeri, G.; Migliorini, P. Neutrophil extracellular traps (NET) induced by different stimuli: A comparative proteomic analysis. PLoS ONE 2019, 14, e0218946. [Google Scholar] [CrossRef] [PubMed]
Publisher’s Note: MDPI stays neutral with regard to jurisdictional claims in published maps and institutional affiliations. |
© 2022 by the authors. Licensee MDPI, Basel, Switzerland. This article is an open access article distributed under the terms and conditions of the Creative Commons Attribution (CC BY) license (https://creativecommons.org/licenses/by/4.0/).
Share and Cite
Xie, L.; Pascottini, O.B.; Zhi, J.; Yang, H.; Opsomer, G.; Dong, Q. In Vitro Production of Neutrophils Extracellular Traps Is Affected by the Lactational Stage of Dairy Cows. Animals 2022, 12, 564. https://doi.org/10.3390/ani12050564
Xie L, Pascottini OB, Zhi J, Yang H, Opsomer G, Dong Q. In Vitro Production of Neutrophils Extracellular Traps Is Affected by the Lactational Stage of Dairy Cows. Animals. 2022; 12(5):564. https://doi.org/10.3390/ani12050564
Chicago/Turabian StyleXie, Lei, Osvaldo Bogado Pascottini, Jianbo Zhi, Hongzhen Yang, Geert Opsomer, and Qiang Dong. 2022. "In Vitro Production of Neutrophils Extracellular Traps Is Affected by the Lactational Stage of Dairy Cows" Animals 12, no. 5: 564. https://doi.org/10.3390/ani12050564
APA StyleXie, L., Pascottini, O. B., Zhi, J., Yang, H., Opsomer, G., & Dong, Q. (2022). In Vitro Production of Neutrophils Extracellular Traps Is Affected by the Lactational Stage of Dairy Cows. Animals, 12(5), 564. https://doi.org/10.3390/ani12050564