Article

Genetic Diversity of Creole Sheep Managed by Indigenous Communities of the Central Region of Veracruz, Mexico

by
Ruth Guadalupe Castillo-Rodríguez
1,
Obdulia Lourdes Segura-León
2,
Martha Hernández-Rodríguez
2,
Ricardo Serna-Lagunes
3,
Josafhat Salinas-Ruiz
1 and
Juan Salazar-Ortiz
1,*
1
Maestría en Innovación Agroalimentaria Sustentable, Colegio de Posgraduados, Campus Córdoba, Veracruz 94953, Mexico
2
Colegio de Posgraduados, Campus Montecillo, Texcoco 56230, Mexico
3
Facultad de Ciencias Biológicas y Agropecuarias, Región Orizaba-Córdoba, Universidad Veracruzana, Veracruz 94945, Mexico
*
Author to whom correspondence should be addressed.
Animals 2022, 12(4), 456; https://doi.org/10.3390/ani12040456
Submission received: 6 December 2021 / Revised: 17 December 2021 / Accepted: 30 December 2021 / Published: 13 February 2022
(This article belongs to the Special Issue Phenotypic and Genotypic Characterization of Farm Animals)

Abstract

:

Simple Summary

The genetic diversity in three populations of creole sheep managed by indigenous communities of the central region of Veracruz, Mexico, is reported from blood samples of 90 sheep, taken from the herds of indigenous families in the municipalities of Tehuipango, Astacinga, and Tlaquilpa, Veracruz, Mexico. The genomic DNA of the sheep was evaluated using four microsatellites amplified by PCR and visualized on polyacrylamide gels. The four microsatellites were polymorphic, observed heterozygosity was lower than the expected level, and the indices of endogamy indicated a slight diminution of homozygotes and the variation was hosted at the individual level. The evaluated sheep present a genetic diversity that is conserved across endogamic crosses, for which reason the design of a plan of protection and use of these sheep populations would permit their sustainable management.

Abstract

In the indigenous communities of central Veracruz, herds of creole sheep have been established and managed through traditional practices of crossing, but their genetic characteristics have never been examined in order to evaluate their state of endogamy, and to help the management programs to protect this genetic resource. The objective of the present study was to characterize the genetic diversity of three populations of creole sheep managed by indigenous communities in the central region of Veracruz, Mexico. Indigenous family producers of creole sheep were located and blood samples taken from 90 individual sheep from the municipalities of Tehuipango, Astacinga and Tlaquilpa, Veracruz. In the laboratory, the genomic DNA was extracted and genetic diversity characterized using four microsatellites (ILSTS11, ILSTS5, SRCRSP9 and OarFCB128) amplified by PCR and visualized on polyacrylamide gels. The four microsatellites were highly informative (PIC = 85%) and presented values of 0.6 to 0.81 of heterozygosity, with an average number of 16 alleles. According to the Hardy–Weinberg equilibrium model, three of the loci were not significant (p < 0.05), presumably this means that they do not deviate significantly from H–W predictions and there was slight genetic differentiation (FST = 0.025), along with a slight decrease in homozygotes (FIS = −0.021). According to the analysis of variance, 99% of the total variation was hosted at the individual level. It is concluded that the three creole sheep populations still present genetic diversity at the four loci and non-random pairings have occurred.

1. Introduction

Livestock production was introduced to Mexico during the colonial period and has become a socioeconomically productive activity [1]. Ovine livestock are managed in a wide range of productive systems for meat, dairy products, skins, and other derivatives [2]. The eastern state of Veracruz is the third largest producer of ovine livestock, and is organized into three production districts, north, center, and south, with subsistence production (42%), commercial subsistence (21%), and commercial (37%) systems [3]. The most common breeds of sheep in these districts are crosses derived from Pelibuey, Black Belly, and Dorper sheep, as well as creole breeds [4].
The creole sheep breeds are those populations that have adapted to the rural and cultural environments in which the herds are managed but still present certain traits of the original breeds introduced to Mexico during the colonial period [5]. Among the individual creole sheep, it is possible to observe a wide range of morphotypes arising from the innate genetic variability of the sheep and the diversity of climatic and geographic conditions of each rural region in which they are managed [6]. However, few studies have explored the extent of the genetic diversity of the creole sheep morphotypes that are observed in the rural regions of Mexico [7].
Study and diagnosis of the genetic diversity of creole sheep are necessary in order to determine the status of the genetic variability of the populations [8], take measures to avoid genetic depression of the sheep populations that make them vulnerable to biotic and abiotic factors [9], improve the response to changes in their environment [10], and develop plans and strategies for genetic conservation and improvement [11]. There is also interest in the study of genetic diversity as a basis for the development and use of ovine production systems that could strengthen the food sovereignty of indigenous communities [12]. In this sense, the objective of this study was to characterize the genetic diversity of three populations of creole sheep from the localities of Tehuipango, Astacinga, and Tlaquilpa, in central Veracruz, Mexico, using molecular marker type microsatellites.

2. Materials and Methods

2.1. Characteristics of Populations of Sheep Evaluated and Blood Sample Collection

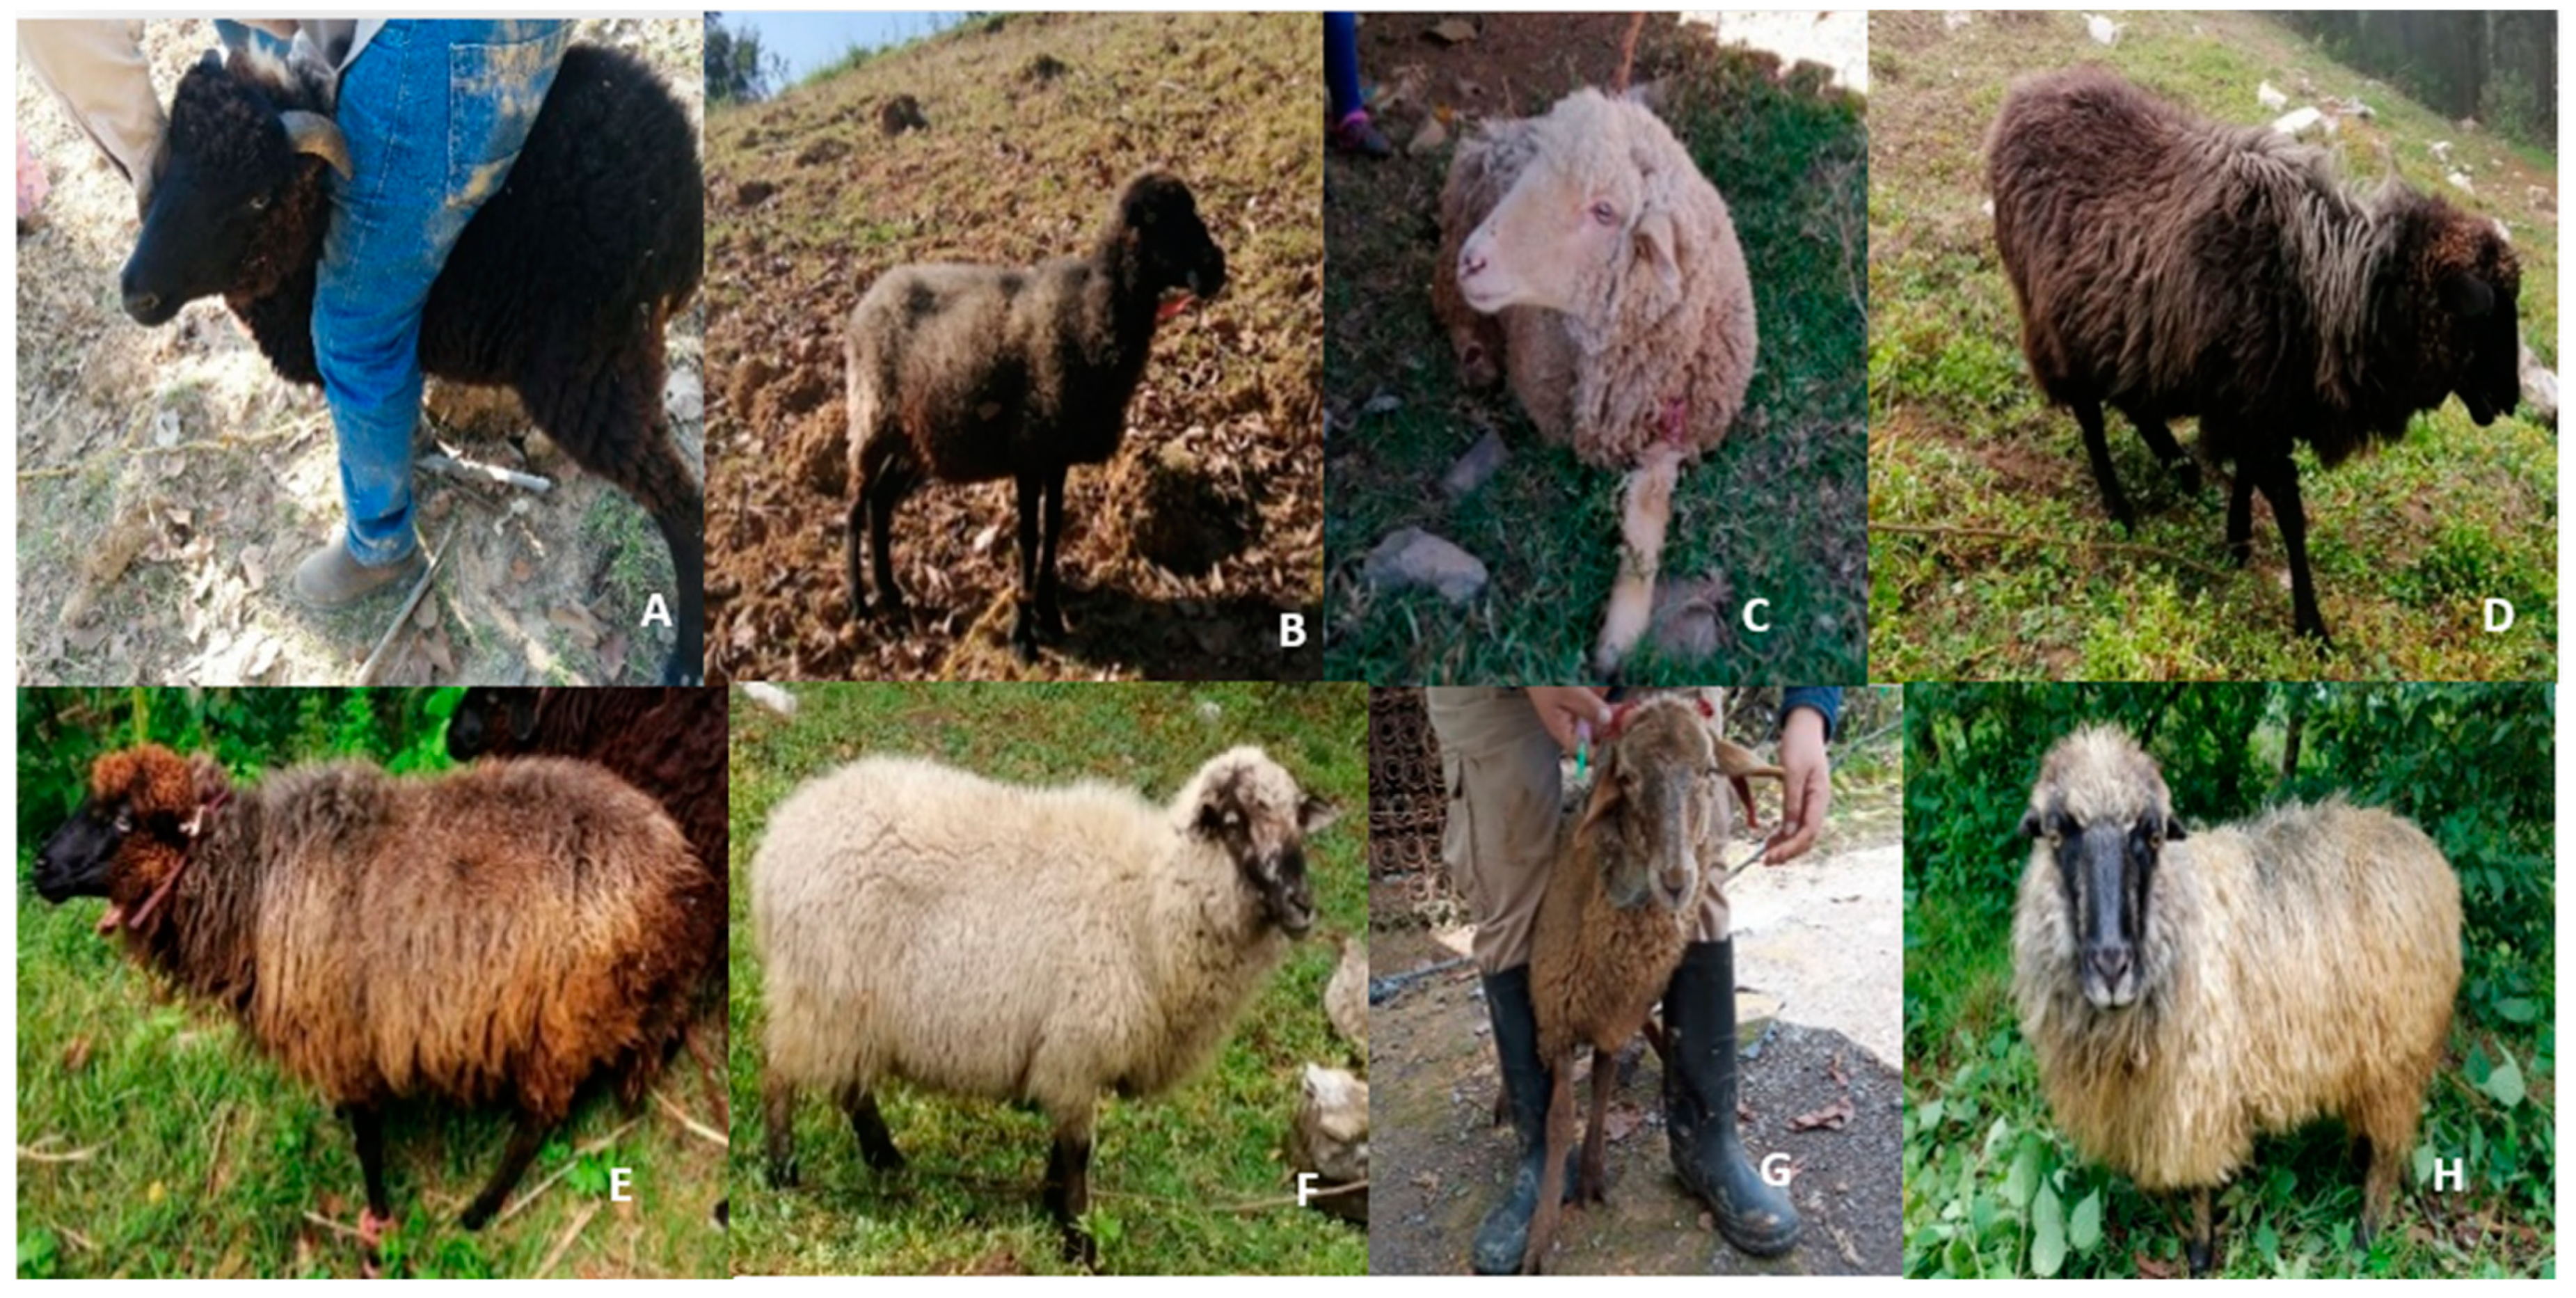
The populations of sheep (n = 90 sheep) under study were found in the municipalities of Tehuipango (population 1, n = 33 sheep, 11 males and 22 females), Astacinga (population 2, n = 21 sheep, 4 males and 17 females) and Tlaquilpa (population 3, n = 36 sheep, 11 males and 25 females), located in the central region of Veracruz, Mexico (Figure 1). The creole sheep specimens presented a background and a mixture of phenotypic characters associated with the breeds Churra, Laza, Castellana, Canaria, and Manchega (Figure 2). The indigenous families that managed the sheep herds were located and permission sought to take blood samples from their animals. The blood sampling process followed the normal ethics of animal management [13] and 3 to 4 mL of whole blood were extracted by puncture of the jugular vein using the B-D Vacutainer Plus equipment with EDTA (Becton-Dickinson & Company; Nueva Jersey, EU) [14]. The animals were treated in accordance with the ethical standards and technical specifications of the Official Mexican Standard and technical specifications for the production and humane treatment in the mobilization of animals (NOM-051-ZOO-1995) and use of laboratory animals (NOM-062-ZOO-1999).

2.2. DNA Extraction and PCR

DNA was extracted from each blood sample using the Wizard® Genomic DNA Purification Kit (Promega, Madison, WI, EU). Genotyping of each individual was conducted with the following four microsatellite type molecular markers: OarFCB128, SRCRSP9, ILSTS5, and ILSTS11 (Table 1). These microsatellites were chosen from the panel of markers recommended by the FAO (2011), based on their polymorphic information content (PIC) value. Amplification of the microsatellites was conducted by PCR in a final reaction volume of 20 µL comprising the following components: 40 ng of DNA, buffer 1×, 0.1 µM of each primer, 1.5 mM of MgCl2, 0.16 mM of each dNTP, 0.6 U of Taq polymerase (Promega, Madison, WI, EU) and PCR-grade water to reach the final reaction volume. The program of amplification for ILSTS11 and ILSTS5 consisted of an initial denaturation step at 94 °C for 2 min, followed by 30 cycles of 94 °C for 60 s, 53 °C for 60 s, 72 °C for 60 s, and a final extension step of 72 °C for 5 min. For SRCRSP9 and OarFCB128, the program followed the same steps, with the exception of the annealing temperatures, which were 50 °C and 56 °C, respectively. Amplification of each microsatellite was verified in 1.5% agarose gel.

2.3. Electrophoresis of the Microsatellites

To determine the size in bp of the product of each amplification, electrophoresis was conducted in non-denaturing polyacrylamide gels and using 3 µl of each reaction per well in gels prepared with 19:1 acrylamide:bisacrylamide [20] in the MGV-216-33 vertical electrophoresis system (CBS Scientific®, California, USA), with the following parameters: migration at 250 V for 1.5 h, running buffer TBE 1X (0.09 M Tris-borate, 2 mM EDTA pH 8.0), and 25 ng of 20 bp molecular weight marker (Sigma-Aldrich) placed every 10 samples. Each fragment was detected using silver staining [21]. Each gel was documented in the format *.TIFF in a MiniBis Pro16 mm transilluminator (Bio Imaging Systems®, Jerusalem, Israel). The weight of each band in bp was determined with the software GelAnalyzer version 19.1 in order to construct the matrix of molecular data.

2.4. Analysis of Genetic Data

The Hardy–Weinberg Equilibrium (HWE) of each marker was evaluated using a Chi-squared test, and the markers were also examined in order to qualify their polymorphism and obtain the parameters of population diversity [22]. These parameters were: allelic frequencies at 5% reliability, number of alleles per locus (Na), effective number of alleles (Ne), expected (He) and observed (Ho) heterozygosity and indices of fixation F (FIS, FIT and FST) as well as analysis of molecular variance (AMOVA), which were processed with the software packages GenAlEx V.6.503 [22] and PowerMaker V.3.25 [23]. The software DarWin V. 6.0 [24] was used to construct a tree of genetic relationships based on the mean Euclidean distances between pairs of sheep populations.

3. Results

This study found significant deviations from the HWE in some of the loci studied, and suggested non-random pairings in the populations of creole sheep. ILSTS11 locus was the only one in the HWE loci/marker or similar between only and in the three populations, while the rest of the microsatellite loci were found to be in HWE in only one of the three populations: locus ILSTS5 was found in equilibrium for population 1 (Astacinga) and the loci OarFCB128 and SRCRSP9 were found in equilibrium in population 2 (Tehuipango) (Table 2). The four microsatellites (OarFCB128, SRCRSP9, ILSTS5, and ILSTS11) were polymorphic since more than one allele is present among all of the loci analyzed within a population. The polymorphism values of the four genotyped microsatellites were thus found to be 0.83, 0.88, 0.84, and 0.85 for ILSTS11, ILSTS5, SRCRSP9, and OarFCB128, respectively, and selection of these loci for genotyping the three populations of sheep was therefore highly informative.
The allelic frequencies per microsatellite (Table 3) as the locus ILSTS11 presented 15 different alleles in the three populations, ILSTS5 locus presented 20 different alleles, SRCRSP9 locus presented 13, and OarFCB128 locus presented 12 different alleles. Minimum and maximum size of the alleles ranged from 260 to 294 bp for ILSTS11, 186 to 216 bp for ILSTS5, 108 to 130 bp for OarFCB128, and 90 to 200 bp for SRCRSP9.
Table 4 presents the statistics of genetic diversity of the loci in the three populations of creole sheep. This table lists the markers, frequency of the most common allele within the populations, number of genotypes, sample size, number of alleles observed, genetic diversity, heterozygosity, and PIC value.
The degree of genetic differentiation (FST) was 0.025 (ILSTS11), 0.011(ILSTS5), 0.029 (SRCRSP9), and 0.034 (OarFCB128) revealing that the sheep of the high mountains of central Veracruz present what is considered low genetic differentiation, suggesting minimal changes in the genetic structure of the population (Table 5). On the other hand, the coefficient of endogamy (FIS) for each locus was negative: −0.234 (ILSTS11), −0.150 (ILSTS5), −0.248 (SRCRSP9), and −0.221 (OarFCB128), all one can conclude is there is an excess of heterozygotes, indicating a greater incidence of non-random pairings among related individuals.
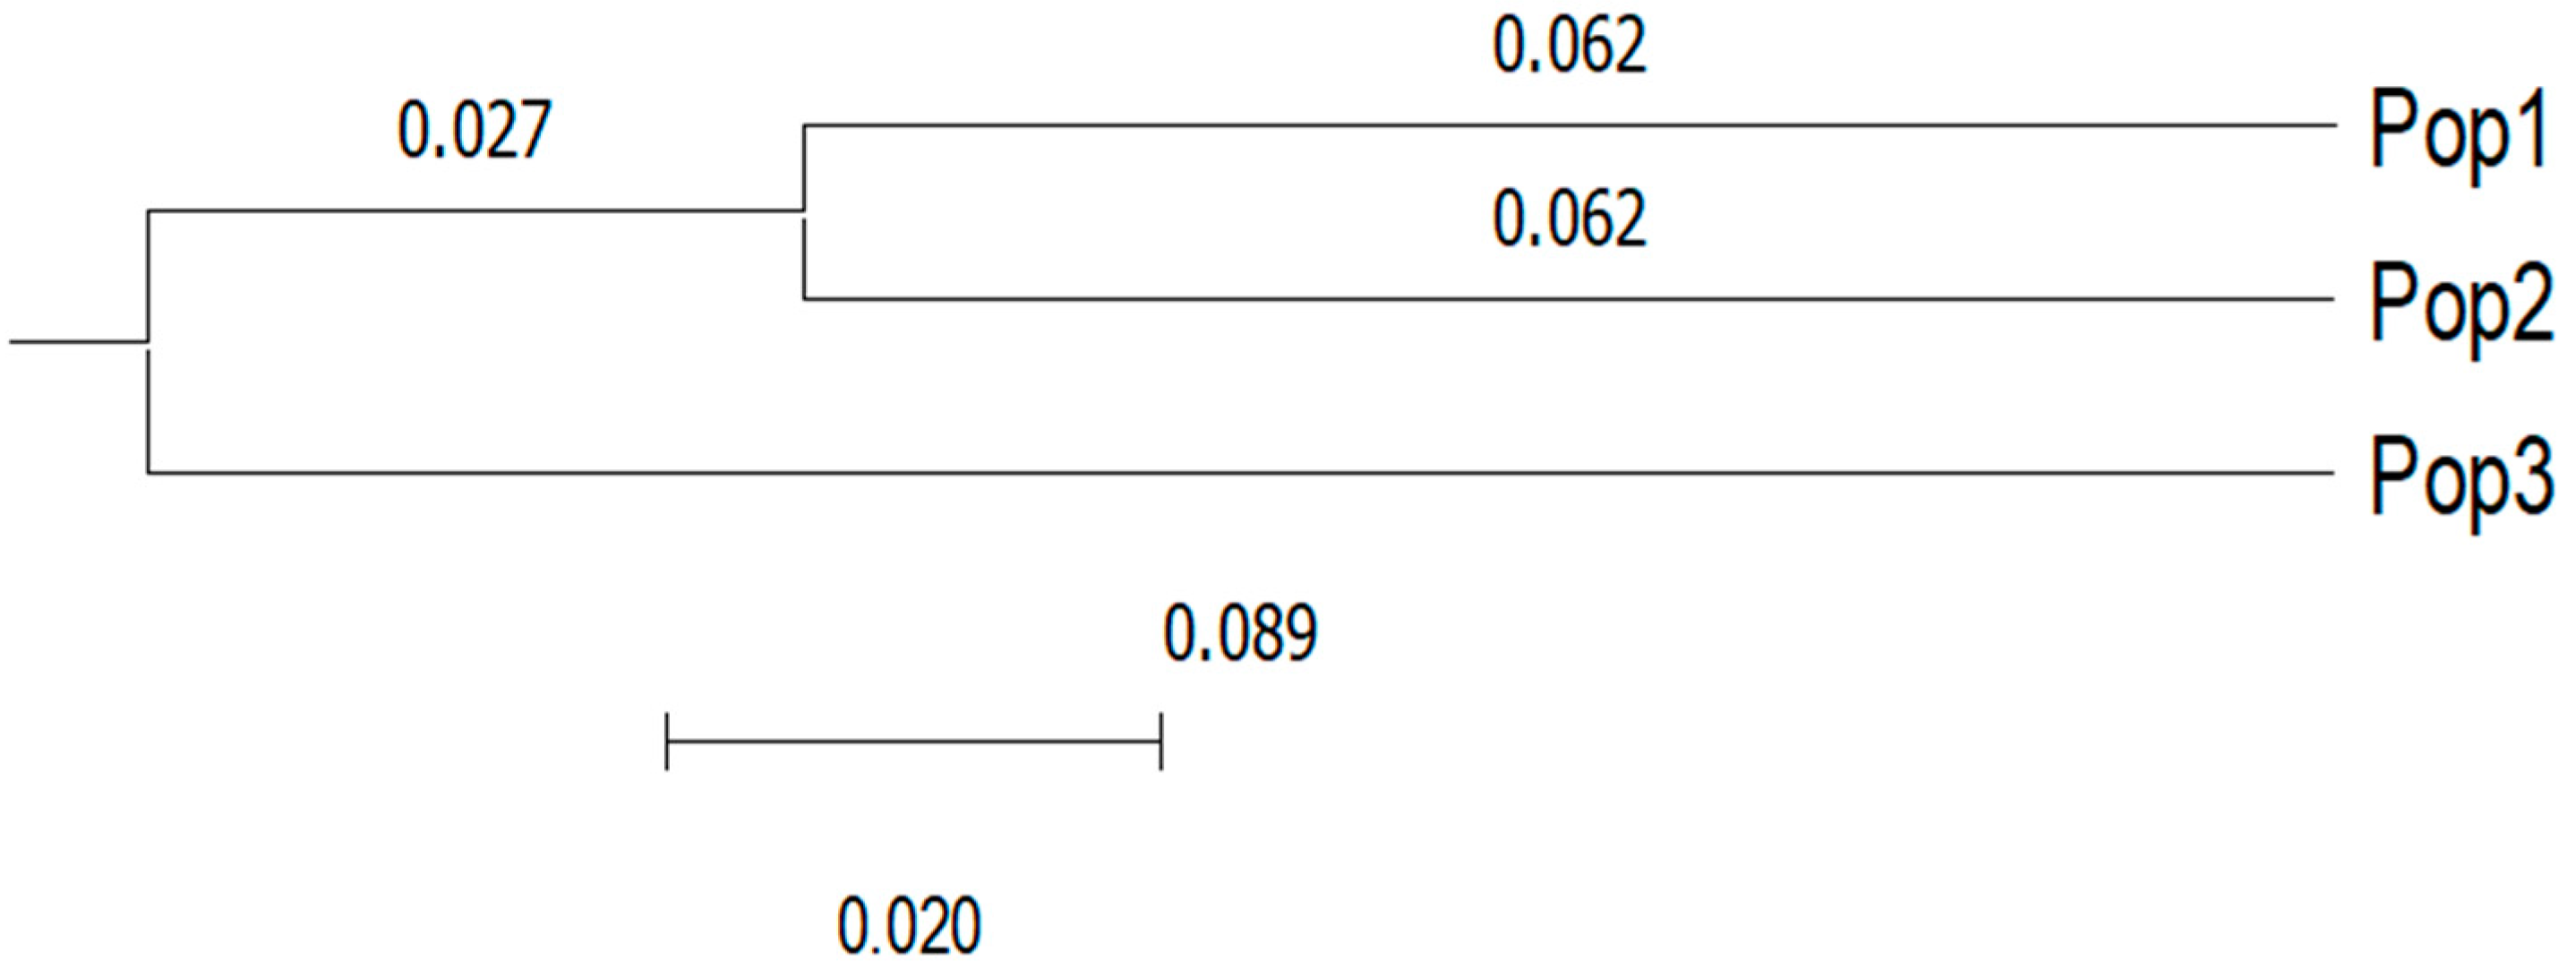
In this study, the phylogram showed that the Nei genetic distances ranged from 0.062 to 0.089, where two groups with similar genetic characteristics (27%) were identified. The first of these were grouped as population 1 (Astacinga) and population 2 (Tehuipango), indicating that these populations presented a high degree of genetic similarity, while the second group was represented by population 3 (Tlaquilpa), which was genetically differentiated from populations 1 and 2 (Figure 3).
Finally, the AMOVA showed that the greatest genetic variation was provided by the individuals of the population (99%), and that there was almost null variation (1%) among individuals of the different sheep populations evaluated (Figure 4).

4. Discussion

The HWE showed that the frequencies of the microsatellites evaluated in the three populations of sheep have not remained stable among generations, since these sheep originate from a population with a low number of founding individuals, or that experienced little random breeding. The lack of equilibrium detected in the loci could have been motivated, in part, by the need of indigenous producers for crossing with rams that present phenotypic characteristics of commercial value [25] or by the family selection typical among producers in the region. From this perspective of allelic frequencies, it is clear that genetic inheritance and variation in the creole sheep is beginning to be affected by at least one of the evolutionary forces, presenting a situation that endangers the genetic variability that has been produced through adaptation to the conditions of the high mountains of the central region of Veracruz and that, in terms of survival, disease resistance, regional identity, etc., has been fundamental for these sheep and their producers.

4.1. Polymorphism of the Loci

The four microsatellite loci evaluated in the creole sheep presented more than one allele [26]. The microsatellites evaluated in this study to genotype the three populations of sheep were highly informative, since the PIC values were > 0.50 [27]. Study of the loci represented a tool that, in addition to distinguishing individuals at the genetic level, was useful to determine the small population differentiation that was detected. With this, the informative value of the selected loci could be applied to other creole sheep populations that develop in indigenous production systems, in order to establish a pedigree that helps with decision making regarding genetic improvement and the conservation of animal germplasm.

4.2. Allelic Diversity and Number of Alleles

Studies of genetic diversity have reported values of allelic diversity and allele numbers similar to those found in this study. In a population of Nigerian sheep, alleles of 96 to 130 bp were recorded at the loci OarFCB128 [16]. In a study of genetic diversity and paternity in a population of goats, reported alleles of 119 to 200 bp for the microsatellite SRCRSP9 [17], on other study reported allele sizes of 262 to 292 bp for ILSTS11 and 107 to 133 bp for SRCRSP9 in a study of genetic characterization of sheep in Colombia [28]. In a study of zoometric and genetic characterization of sheep in Brazil using the microsatellites ILSTS11, ILSTS5, and SRCRSP9, reported sizes that ranged from 266 to 288 bp, 181 to 201 bp, and 99 to 135 bp, respectively [29]. In a study of genetic characterization of Colombian creole sheep, also used the microsatellites ILSTS11, ILSTS5, and SRCRSP9, obtaining allele size ranges of 262 to 292 bp, 176 to 214 bp, and 107 to 133 bp, respectively [30]. A study of genetic diversity and relationships of indigenous breeds of creole sheep in Pakistan using microsatellite loci, with ILSTS11 and OarFCB128 among the markers used, and reported allele size ranges of 300 to 382 bp and 106 to 136 bp, respectively [31].
The numbers of alleles observed per locus in this study exceeded those reported in a study of characterization of Colombian creole sheep, reported 11 different alleles for ILSTS11, 12 alleles for ILSTS5, and 12 alleles for OarFCB128 [28]. The values found in the present study also exceed those reported by [31], who identified just two alleles for the locus OarFCB128 and four for ILSTS11 in two different populations of creole sheep. The presence of 14 different alleles for ILSTS11, 16 for ILSTS5, and 10 for SRCRSP9 [28], and another study that reported lower allele numbers than those reported in this study, analyzed genetic polymorphism and bottlenecks in sheep of Balkhi [32]. In this case, the study reported the presence of only two different alleles for the markers ILSTS11 and ILSTS5, three alleles for the marker SRCRSP9, and four for the marker OarFCB128. In an evaluation of diversity and genetic differentiation in breeds of Portuguese thick-wooled sheep using microsatellite markers, included the markers ILSTS5 and ILSTS11, for which eight alleles were found [33]. For this reason, the number of alleles found in this study suggests that the creole sheep of Astacinga, Tehuipango, and Tlaquilpa present high allelic diversity, perhaps due to the constant flow of individuals among the herds.
Within genetic improvement programs, knowledge of the genetic diversity of creole sheep is the basis for reproductive and productive success in populations for sustainable management [34]. In the case of heterozygosity, which is considered one of the parameters of diversity that best represent variability within a population [35], the values were 0.60 (ILSTS11), 0.81(ILSTS5), 0.76 (SRCRSP9), and 0.77 (OarFCB128), with an average of 0.73. The heterozygosity of the individuals is associated with greater performance and adaptability on the part of the individuals of the populations [36]. In this context, when individuals present low heterozygosity, they have lower aptitudes and probabilities of survival in a given medium and of creating progeny, for which reason the value of this parameter is used as an indicator of endogamy within and among populations [37]. In this sense, the degree of heterozygosity in the sheep evaluated in this study suggests that, for the purpose of use, population heterozygosity could move in a manner directed towards the biocultural conditions of higher-yield management systems.
In this study, the FST index revealed that the creole sheep present low genetic differentiation, suggesting a genetic structure that is becoming unstable at population level [4]. This means that the evaluated animals are still genetically similar within each population, but there are already signs of apparent introgression. This result was supported by the low and negative value of the coefficient of endogamy (FIS) for the four microsatellites evaluated, indicating a decrease in homozygous individuals. In a study of genetic characterization of sheep in Colombia, reported FIS values higher than 0, which was attributed to the fact that the breeds could be inbred or subjected to human selection through management in order to acquire certain phenotypic characteristics [28]. The sheep populations studied revealed deficiency in heterozygosity and genetic variation individual, resulting from the reproductive tendency of these populations [32].
The results also identified two groups: the first of which included population 1 (Astacinga) and population 2 (Tehuipango), while the second consisted only of population 3 (Tlaquilpa). The group that included populations 1 and 2 showed that these populations have a high degree of genetic similarity, which can be attributed to the fact that the physical proximity of their regions has facilitated the occurrence of crossing between these populations. Finally, it is possible that the allelic variability of the creole sheep evaluated has been selected as a function of the indigenous group or family that manages the herd, which has produced the small genetic differentiation. The creole sheep populations should still maintain sections of genome that comprise a large part of their identity; however, given the limited number of loci examined, this situation remains to be demonstrated.

5. Conclusions

Genetic diversity, based on the genotyping of four microsatellite markers in three populations of creole sheep managed by indigenous communities in the central region of Veracruz, showed a large catalog of alleles. The results contribute to the genetic knowledge of these sheep required in order to control situations through reproductive management. For the purposes of survival, it is essential to protect and maintain these populations. Furthermore, for the purposes of use it is required to fix phenotypic characteristics such as wool production in the populations of Astacinga and Tehuipango; rams and ewes of these populations that express these desired phenotypic characteristics should be crossed. Moreover, if it is desired to increase the height of the cross, rams from Tlaquilpa can transfer this characteristic over a few generations, given the degree of endogamy presented by the populations.

Author Contributions

Conceptualization, R.G.C.-R. and J.S.-O.; methodology and software, R.G.C.-R. and M.H.-R.; validation, R.G.C.-R. and M.H.-R.; formal analysis, R.G.C.-R. and M.H.-R.; research, R.G.C.-R., M.H.-R. and J.S.-O.; resources, M.H.-R. and J.S.-O.; data curation, R.G.C.-R. and M.H.-R.; writing—original draft preparation, R.G.C.-R. and J.S.-O.; writing—review and editing, R.G.C.-R., M.H.-R., O.L.S.-L., R.S.-L. and J.S.-O.; visualization, J.S.-R. and O.L.S.-L.; supervision, J.S.-O. and M.H.-R.; R.S.-L. drew up the maps. All authors have read and agreed to the published version of the manuscript.

Funding

This research was financed by the National Council for Science and Technology through the scholarship granted to the first author of this paper.

Institutional Review Board Statement

The study was conducted according to the guidelines of the Declaration of Helsinki and approved by the Institutional Review Board of Colegio de Postgraduados (Reglamento para el uso y cuidado de animales destinados a la investigación y Comité de Bienestar Animal).

Informed Consent Statement

Not applicable.

Data Availability Statement

Not applicable.

Acknowledgments

We thank Colegio de Postgraduados, campus Córdoba and campus Montecillo, for financing the research.

Conflicts of Interest

The authors do not have any conflict of interests. The sponsors did not have any role in the study design; in the gathering, analysis or interpretation of data; in the writing of the manuscript; or in the decision to publish the results.

References

  1. Saucedo, P. Industria Ganadera. En Historia de la Ganadería en México; UNAM: Mexico City, Mexico, 1987; pp. 31–66. [Google Scholar]
  2. Pablo, D.N. Importancia Económica, Ambiental y Social de la Producción Ovina en el Área de Protección de Flora y Fauna Nevado de Toluca. Ph.D. Thesis, Universidad Autónoma Del Estado De México, Toluca de Lerdo, México, 2017. [Google Scholar]
  3. Secretaría de Agricultura, Ganadería, Desarrollo Rural, Pesca y Alimentación (SAGARPA). Programas SAGARPA 2017. 2009. Available online: http://www.gob.mx/sagarpa/acciones-y-programas/programas-sagarpa-2017 (accessed on 17 December 2021).
  4. Hernández, M.P.M. Dinámica Espacio-Temporal del Venado Cola Blanca (Odocoileus virgininanus) en Mexico. Master’s Thesis, Instituto Politécnico Nacional, Mexico City, México, 2010. [Google Scholar]
  5. Ulloa-Arvizu, R.; Gayosso-Vázquez, A.; Alonso-Morales, R.A. Origen genético del ovino criollo mexicano (Ovis aries) por el análisis del gen del Citocromo C Oxidasa subunidad I. Rev. Tec. Pecu. México 2009, 47, 323–328. [Google Scholar]
  6. Peña, S.; Lopez, G.; Martínez, R.; Abbiati, N.; Castagnasso, E.; Giovambattista, G.; Genero, E. Características zoométricas de ovinos criollos de cuatro regiones de la Argentina. Actas Iberoam. Conserv. Anim. 2013, 3, 174–181. [Google Scholar]
  7. Candelaria-Martínez, B.; Ramírez-Mella, M.; Flota-Bañuelos, C.; Dorantes-Jiménez, J. Recursos genéticos “criollos” de zonas rurales de Campeche, México. Agroproductividad 2016, 9, 29–32. [Google Scholar]
  8. Rimieri, P. Genetic diversity and genetic variability: Two different concepts associated with germplasm and plant genetic improvement. J. Basic Appl. Genet. 2017, 28, 7–13. [Google Scholar]
  9. Herrera, J.; Jordán, H.; Senra, A.F. Aspectos del manejo y alimentación de la reproductora ovina Pelibuey en Cuba. Rev. Cuba. Cienc. Agríc. 2010, 44, 211–219. [Google Scholar]
  10. Tamqmone, N.M. Pérdida de Diversidad Genética: Implicaciones para la Evolución y la Conservación de dos Especies de Ctenomys (Rodentia: Ctenomyidae) en Patagonia Norte. Available online: http://www.secheresse.info/spip.php?article95837 (accessed on 17 December 2021).
  11. Espinosa-García, J.A.; Quiroz-Valiente, J.; Moctezuma-López, G.; Oliva-Hernández, J.; Granados-Zurita, L.; Berumen-Alatorre, A.C. Prospección tecnológica y estrategias de innovación para producción ovina en Tabasco, México. Rev. Científica 2015, 15, 107–115. [Google Scholar]
  12. Mariscal, J.C.; Mathez-Stiefel, S.L. Fortaleciendo la soberanía alimentaria mediante la revalorización de saberes ecológicos locales: Experiencia en los Andes bolivianos. Etnobiología 2010, 8, 75–89. [Google Scholar]
  13. Cardozo de Martínez, C.A.; de Osorio, A.M. Etica en investigación con animales: Una actitud responsable y respetuosa del investigador con rigor y calidad científica. Rev. Latinoam. Bioética 2008, 8, 46–71. [Google Scholar]
  14. Burgos-Paz, W.; Rosero-Galindo, C.; Cárdenas-Henao, H.; Solarte-Portilla, C. Polimorfismos en la longitud de fragmentos amplificados (AFLP´s) a partir de muestras de sangre almacenadas en tarjetas FTA® para la especie Cavia porcellus Lin (Rodentia: Caviidae). Rev. Colomb. Cienc. Pecu. 2007, 20, 67–72. [Google Scholar]
  15. Food and Agriculture Organization. Molecular genetic characterization of animal genetic resources. In FAO Animal Production and Health Guidelines; Food and Agriculture Organization: Rome, Italy, 2011. [Google Scholar]
  16. Agaviezor, B.O.; Peters, S.O.; Adefenwa, M.A. Morphological DNA and microsatellite diversity of indigenous Nigerian sheep. J. Anim. Sci. Biotechnol. 2017, 3, 38. [Google Scholar] [CrossRef] [Green Version]
  17. Luna-González, A.; Hernández-Arteaga, S.; Sánchez-Garza, M.; López-Revilla, R.; Medina-Esparza, L.; Cruz-Vázquez, C. Microsatellite loci and paternity analysis in Nubia and Boer goats. Arch. Med. Vet. 2012, 44, 123–127. [Google Scholar] [CrossRef] [Green Version]
  18. Aguilar Martínez, C.U.; Espinoza Gutiérrez, B.; Segura Correa, J.C.; Berruecos Villalobos, J.M.; Valencia Méndez, J.; Roldán Roldán, A. Caracterización genética de la oveja Pelibuey de México usando marcadores microsatélites. Rev. Mex. Cienc. Pecu. 2021, 12, 36–57. [Google Scholar] [CrossRef]
  19. Cardoso, C.; Da Silva, E.C.; Pimentel, C.; Caetano, A.; Faco, O.; Paiva, S. Estimativa Inicial de Erros de Paternidade em um Programa de Melhoramento Genético de Caprinos Leiteiros. 2012. Available online: https://ainfo.cnptia.embrapa.br/digital/bitstream/item/163386/1/CNPC-2012-Estimativa.pdf (accessed on 17 December 2021).
  20. International Maize and Wheat Improvement Center (CIMMYT). Protocolos de Laboratorio: Laboratorio de Genética Molecular Aplicada, 3rd ed.; CIMMYT: El Batán, Mexico, 2006; 93p. [Google Scholar]
  21. Sanguinetti, C.; Dias, J.; Neto, E.; Simpson, A.J. Rapid silver staining and recovery of PCR products separated on polyacrylamide gels. Biotechniques 1994, 17, 914–921. [Google Scholar]
  22. Peakall, R.; Smouse, P.E. GenAlex 6: Genetic analysis in Excel. Population genetic software for teaching and research. Mol. Ecol. Notes 2006, 6, 288–295. [Google Scholar]
  23. Liu, K.; Muse, S. PowerMaker: An integrated analysis environment for genetic maker analysis. Bioinformatics 2005, 21, 2128–2129. [Google Scholar] [CrossRef] [Green Version]
  24. Perrier, X.; Jacquemoud-Collet, J.P. DarWin Software. 2006. Available online: http://darwin.cirad.fr/ (accessed on 17 December 2021).
  25. Ortega, M.J.; Introducción al Mejoramiento Genético. Notas de Campus. 2017. Available online: https://hemeroteca.unad.edu.co/index.php/notas/article/view/1809 (accessed on 17 December 2021).
  26. Casado-Gonzalez, M.; Gonzalez-Duarte, R. Los Retos de la Genética en el Siglo XXI: Genética y Bioética; Edicions Universitat Barcelona: Barcelona, Spain, 1999. [Google Scholar]
  27. Botstein, D.; White, L.; Skolmick, H.; Davis, W. Construction of a genetic linkage map in man using restriction fragment length polymorphism. Am. J. Hum. Genet. 1980, 32, 314–331. [Google Scholar] [PubMed]
  28. Ocampo-Gallego, R.J. Caracterizacion Genética de Ovinos en Colombia por Medio de Markers Microsatelites. Master’s Thesis, Universidad de Antioquia, Medellín, Colombia, 2014. [Google Scholar]
  29. Da Silva, R.C. Caracterização Zoométrica e Genética de Ovinos Morada Nova. Ph.D. Thesis, Universidade Federal Da Paraíba, João Pessoa, Brazil, 2012. [Google Scholar]
  30. Ocampo, R.J.; Martinez, R.A.; Rocha, J.F.; Cardona, H. 2017 Genetic characterization of Colombian indigenous sheep. Rev. Colomb. Cienc. Pecu. 2017, 30, 116–125. [Google Scholar] [CrossRef]
  31. Hussain, T.; Musthafa, M.M.; Babar, M.E.; Shaheen, M.; Marikar, F.M. Molecular genetic diversity and relationship of indigenous sheep breeds of Pakistan based on nuclear microsatellite loci. Rev. Vet. 2019, 30, 54–58. [Google Scholar] [CrossRef]
  32. Ibrahim, M.; Ahmad, S.; Durrani, I.S.; Iqbal, A.; Munir, I.; Swati, Z.A. Genetic polymorphism and bottleneck analysis of Balkhi, Hashtnagri, and Michni sheep populations using microsatellite markers. Anim. Biotechnol. 2018, 29, 216–226. [Google Scholar] [CrossRef]
  33. Santos-Silva, F.; Ivo, R.S.; Sousa, M.C.O.; Carolino, M.I.; Ginja, C.; Gama, L.T. Assessing genetic diversity and differentiation in Portuguese coarse-wool sheep breeds with microsatellite markers. Small Rumin. Res. 2008, 78, 32–40. [Google Scholar] [CrossRef]
  34. Zhang, X.Y.; Zhou, M.L.; Zhang, X.H.; Wu, D.J. Study on population genetic structure of Liangshan semi-wool sheep using microsatellite markers. Pak. J. Biol. Sci. 2009, 11, 2423–2427. [Google Scholar] [CrossRef] [PubMed]
  35. Myles, S.; Tang, K.; Somel, M.E.H.M.E.T.; Green, R.E.; Kelso, J.; Stoneking, M. Identification and analysis of genomic regions with large between-population differentiation in humans. Ann. Hum. Genet. 2008, 72, 99–110. [Google Scholar] [CrossRef] [PubMed]
  36. Vega-Hernández, D.M.; Gutiérrez-Velázquez, M.V. Efectos de la actividad antropogénica sobre la estructura genética de ungulados silvestres. Órgano Difusión Científica Tecnológica Cent. Interdiscip. Investig. Desarro. Integral Reg. Unidad Durango 2015, 7, 60–63. [Google Scholar]
  37. Brommer, J.E.; Kekkonen, J.; Wikström, M. Using heterozygosity-fitness correlations to study inbreeding depression in an isolated population of white-tailed deer founded by few individuals. Ecol. Evol. 2015, 5, 357–367. [Google Scholar] [CrossRef] [PubMed]
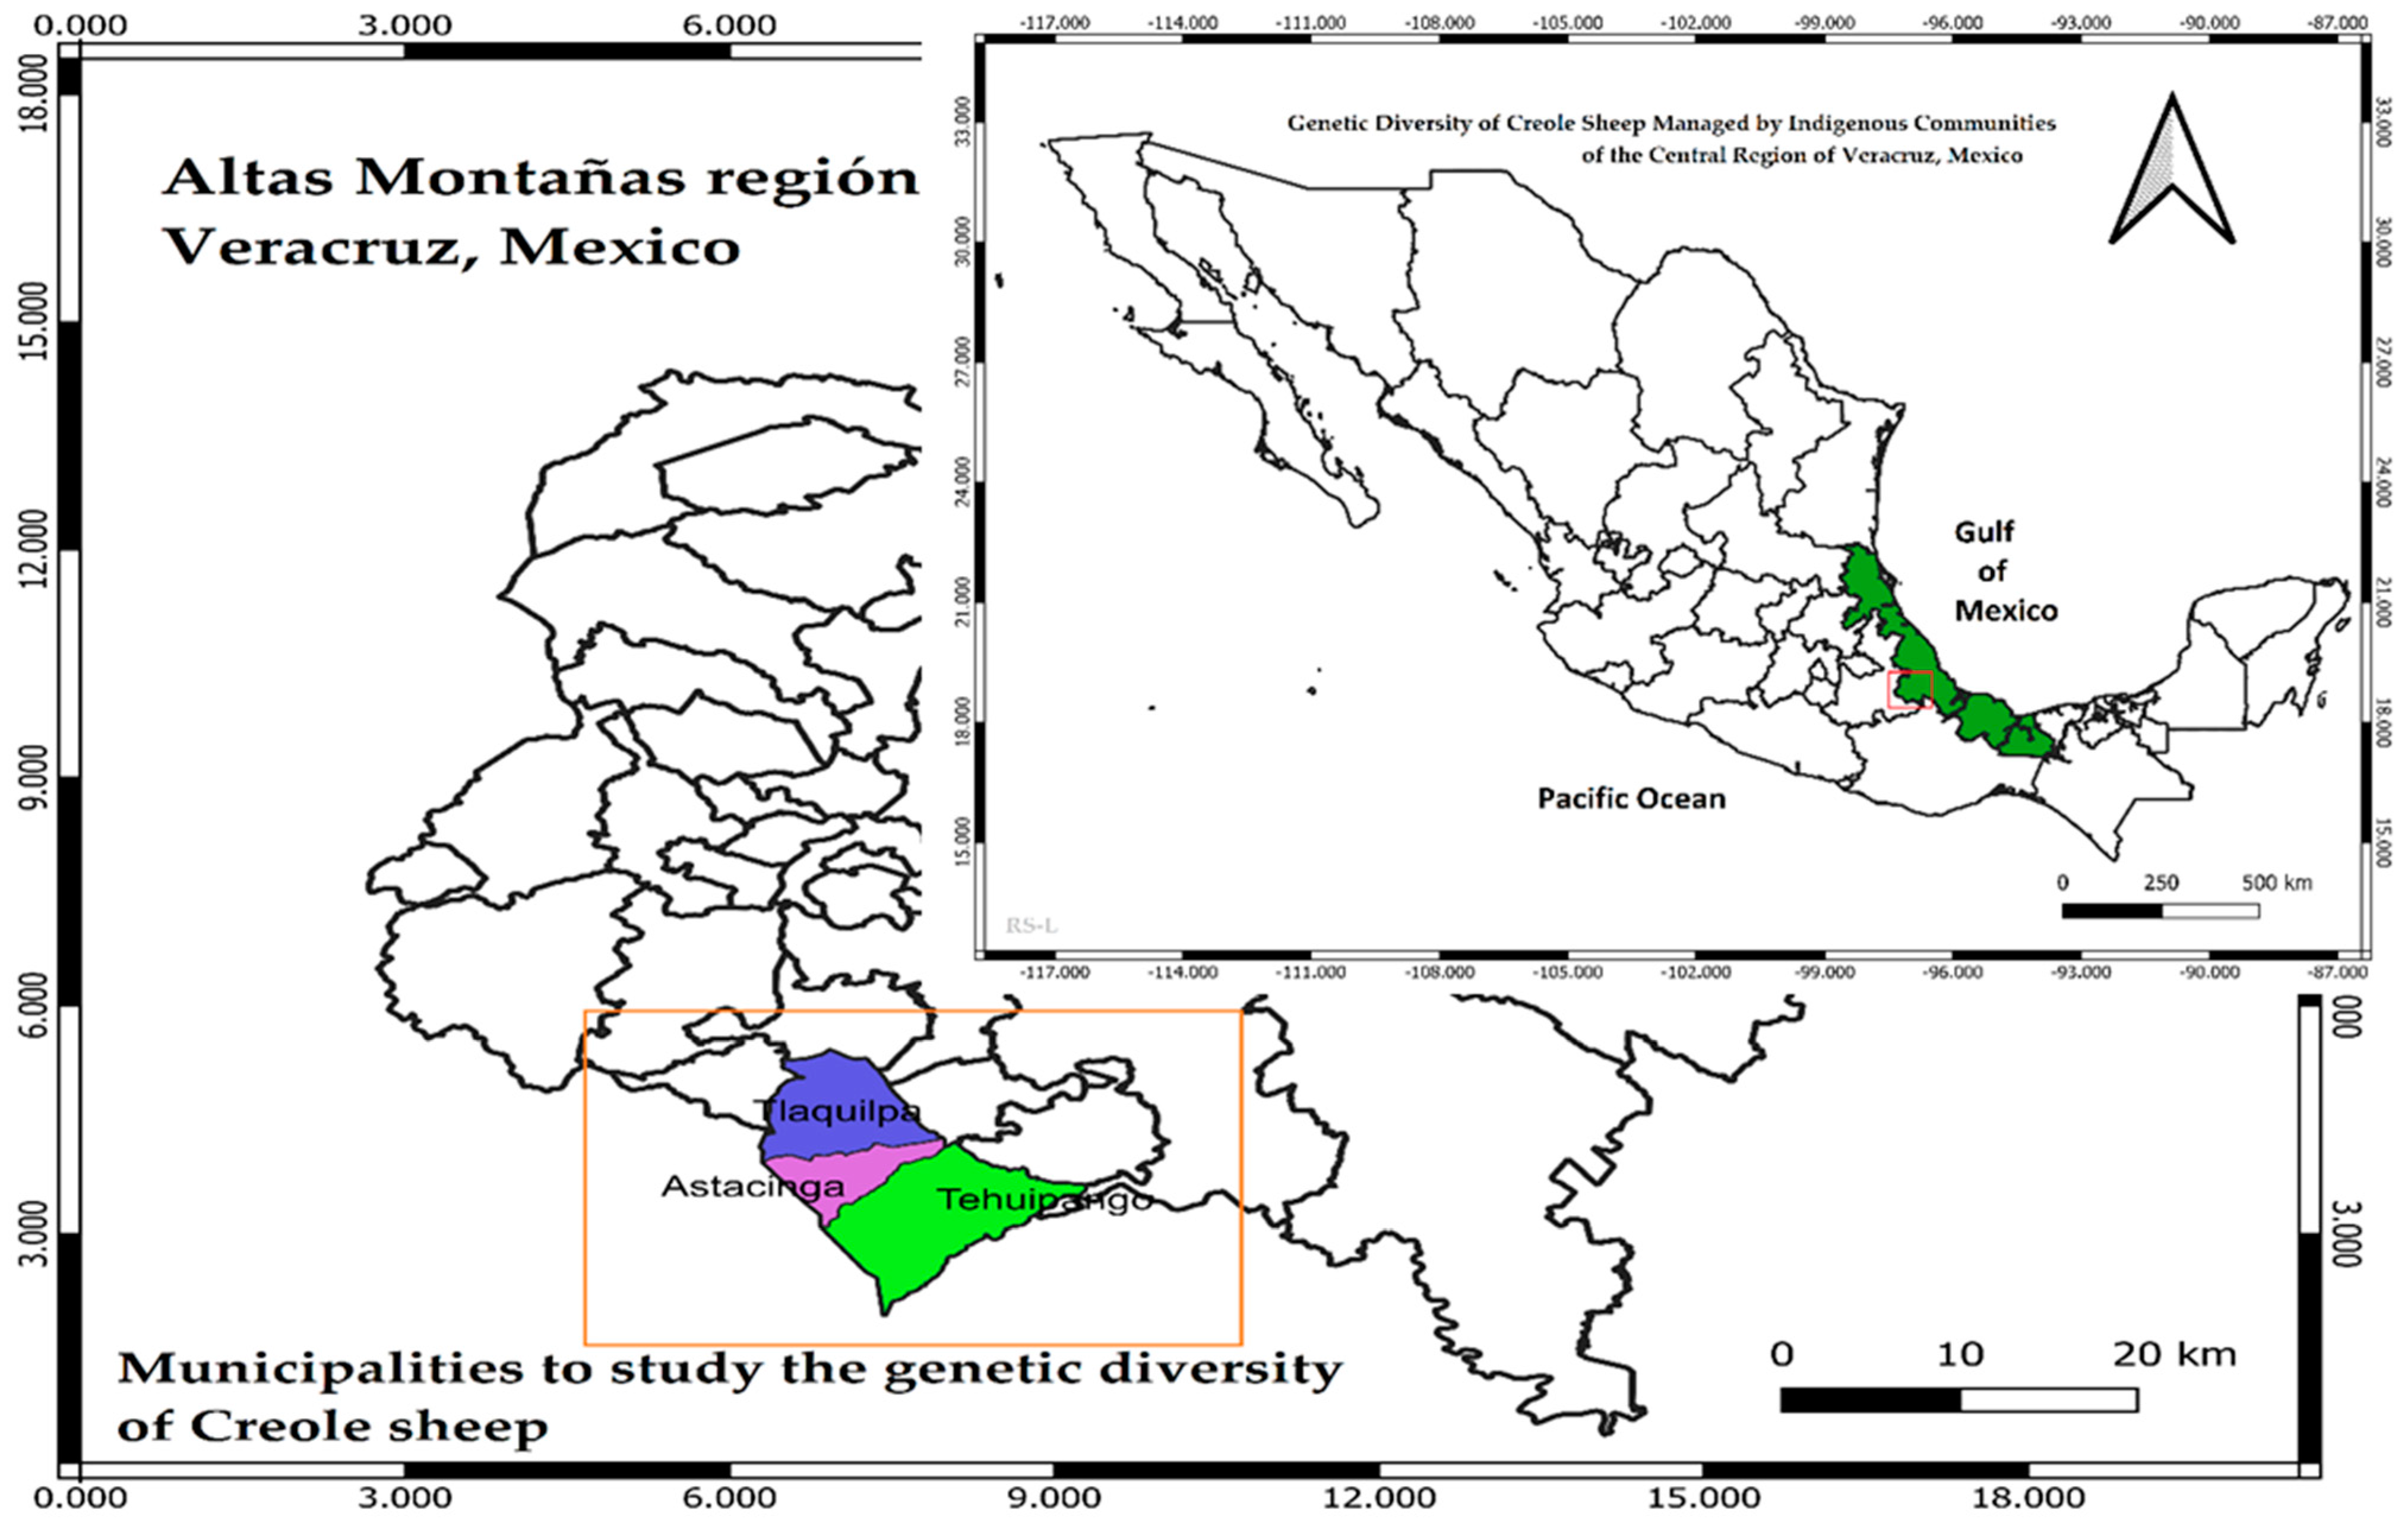
Figure 1. Localities of the sheep populations under study in the central region of Veracruz, Mexico. These populations are referred to as: population 1 (Astacinga), population 2 (Tehuipango), and population 3 (Tlaquilpa). Source: prepared by the coauthors with data collected from the field. Copyright permission.
Animals 12 00456 g001
Figure 2. Creole sheep sampled in the central region of Veracruz, Mexico: (A) creole black sheep, (B) creole black/white/brown sheep, (C) creole white sheep, (D) creole grey sheep, (E) creole brown/blackface sheep, (F) creole black/white/brown sheep morphotype two, (G) creole brown sheep, and (H) creole white/grey/black sheep.
Animals 12 00456 g002
Figure 3. Phylogenetic relationships of three populations of creole sheep in the central region of Veracruz, Mexico.
Animals 12 00456 g003
Figure 4. Partition of the genetic diversity among individuals, within individuals, and among populations of creole sheep using microsatellites.
Animals 12 00456 g004
Table 1. Primers used to describe the genetic diversity of creole sheep from central Veracruz, Mexico [15].
LocusSequence 5′–3′Size (bp)Source
OarFCB128-FATTAAAGCATCTTCTCTTTATTTCCTCGC96–136[16]
OarFCB128-RCAGCTGAGCAACTAAGACATACATGCG
SRCRSP9-FAGAGGATCTGGAAATGGAATC119–143[17]
SRCRSP9-RGCACTCTTTTCAGCCCTAATG
ILSTS5-FGGAAGCAATGAAATCTATAGCC174–221[18]
ILSTS5-RTGTTCTGTGAGTTTGTAAGC
ILSTS11-FGCTTGCTACATGGAAAGTGC256–294[19]
ILSTS11-RCTAAAATGCAGAGCCCTACC
Table 2. Test of Hardy–Weinberg equilibrium for four microsatellites examined in three populations of creole sheep in central Veracruz, Mexico.
PopulationLocusdfX2p-ValueSignificance
Pop1ILSTS113623.8330.940ns
Pop1ILSTS56669.6860.355ns
Pop1SRCRSP91026.0710.004**
Pop1OarFCB1282852.3080.004**
Pop2ILSTS113641.3820.247ns
Pop2ILSTS566148.9010.000***
Pop2SRCRSP94556.0120.126ns
Pop2OarFCB1283649.9650.061ns
Pop3ILSTS113641.3480.248ns
Pop3ILSTS54568.0330.015*
Pop3SRCRSP95588.0530.003**
Pop3OarFCB1282880.5000.000***
df = degree of freedom, X2 = Chi squared, ns = non-significant, * p < 0.05, ** p < 0.01, and *** p < 0.001. * Markers not found in HWE (p < 0.05).
Table 3. Allelic frequencies of the microsatellite markers studied in three populations of creole sheep in Veracruz, Mexico.
MarkerAllelePop 1Pop 2Pop 3
ILSTS112600.0000.0300.000
ILSTS112680.0480.0150.028
ILSTS112700.0480.0000.028
ILSTS112740.0240.0000.000
ILSTS112760.0480.0000.056
ILSTS112780.1900.1820.167
ILSTS112790.0000.0150.000
ILSTS112800.2620.3180.222
ILSTS112820.0000.0910.125
ILSTS112840.2140.1360.167
ILSTS112860.0000.0150.056
ILSTS112880.0240.0000.000
ILSTS112890.0000.0300.000
ILSTS112900.0240.0300.014
ILSTS112940.1190.1360.083
ILSTS51860.0480.0000.000
ILSTS51880.0000.0150.000
ILSTS51900.1430.0760.111
ILSTS51920.0000.0150.000
ILSTS51930.0000.0150.000
ILSTS51940.0240.0760.069
ILSTS51950.0000.0000.014
ILSTS51960.1430.1520.083
ILSTS51980.1190.0610.042
ILSTS52000.1670.2120.208
ILSTS52140.0240.0000.000
ILSTS52020.0000.0150.000
ILSTS52040.0240.0760.083
ILSTS52060.0240.0300.069
ILSTS52080.0240.0610.014
ILSTS52100.1190.1210.056
ILSTS52120.0480.0450.000
Table 4. Statistics of genetic diversity of three populations of creole sheep in central Veracruz, Mexico (n = 90).
MarkerFrequency of the Most Common AlleleNo. of GenotypesNo. of AllelesHeHoPIC
ILSTS110.2734160.850.600.83
ILSTS50.2033200.890.810.88
SRCRSP90.2129140.850.760.84
OarFCB1280.1721150.860.770.85
Average0.2229.2516.250.860.730.85
He= expected heterozygosity, Ho = observed heterozygosity, and PIC = polymorphic information content.
Table 5. Indices of genetic differentiation and of endogamy (F) for the microsatellites studied in populations of creole sheep in central Veracruz, Mexico.
LocusFISFITFST
ILSTS11−0.234−0.2030.025
ILSTS5−-0.150−0.1370.011
SRCRSP9−0.248−0.2120.029
OarFCB128−0.221−0.180.034
Mean−0.213−0.1830.025
Publisher’s Note: MDPI stays neutral with regard to jurisdictional claims in published maps and institutional affiliations.