
BUBR1 as a Prognostic Biomarker in Canine Oral Squamous Cell Carcinoma

 ,
,  ,
,  ,
,  ,
, 

 and
and 
Abstract
Simple Summary
Abstract
1. Introduction
2. Materials and Methods
2.1. Patients and Tissue Specimens
2.2. Immunohistochemistry Processing and Evaluation
2.3. Statistical Analysis
3. Results
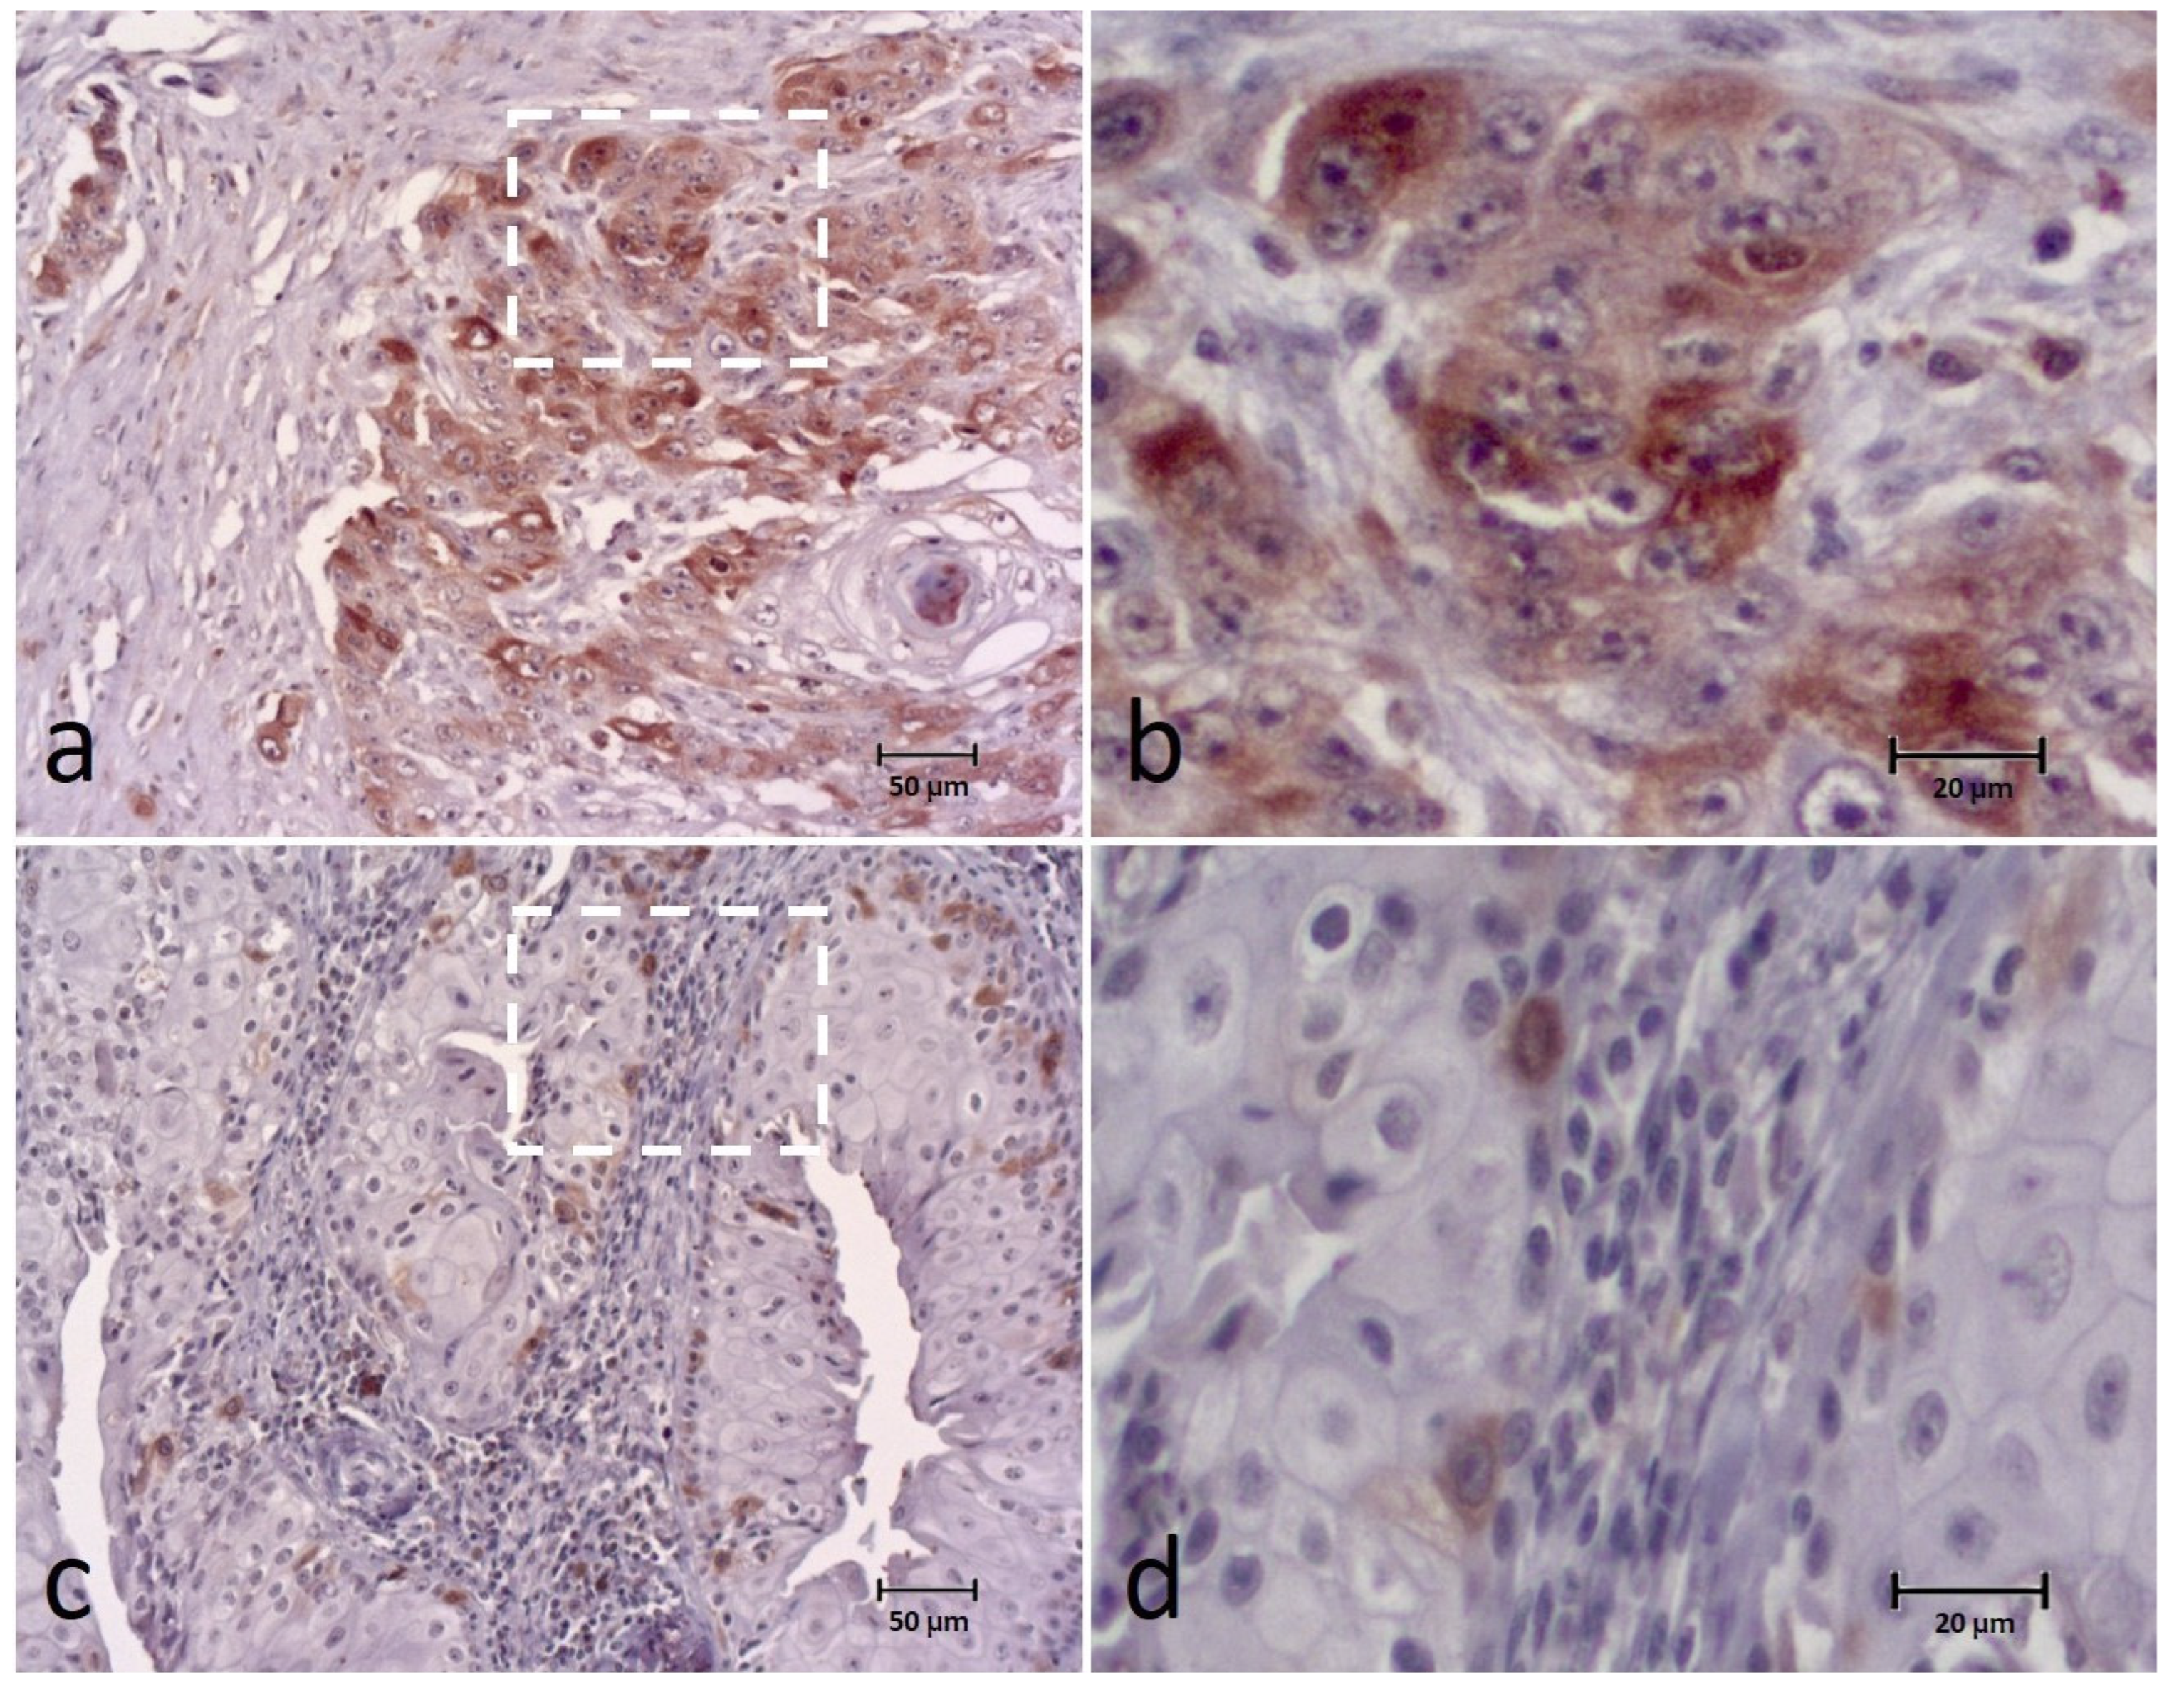
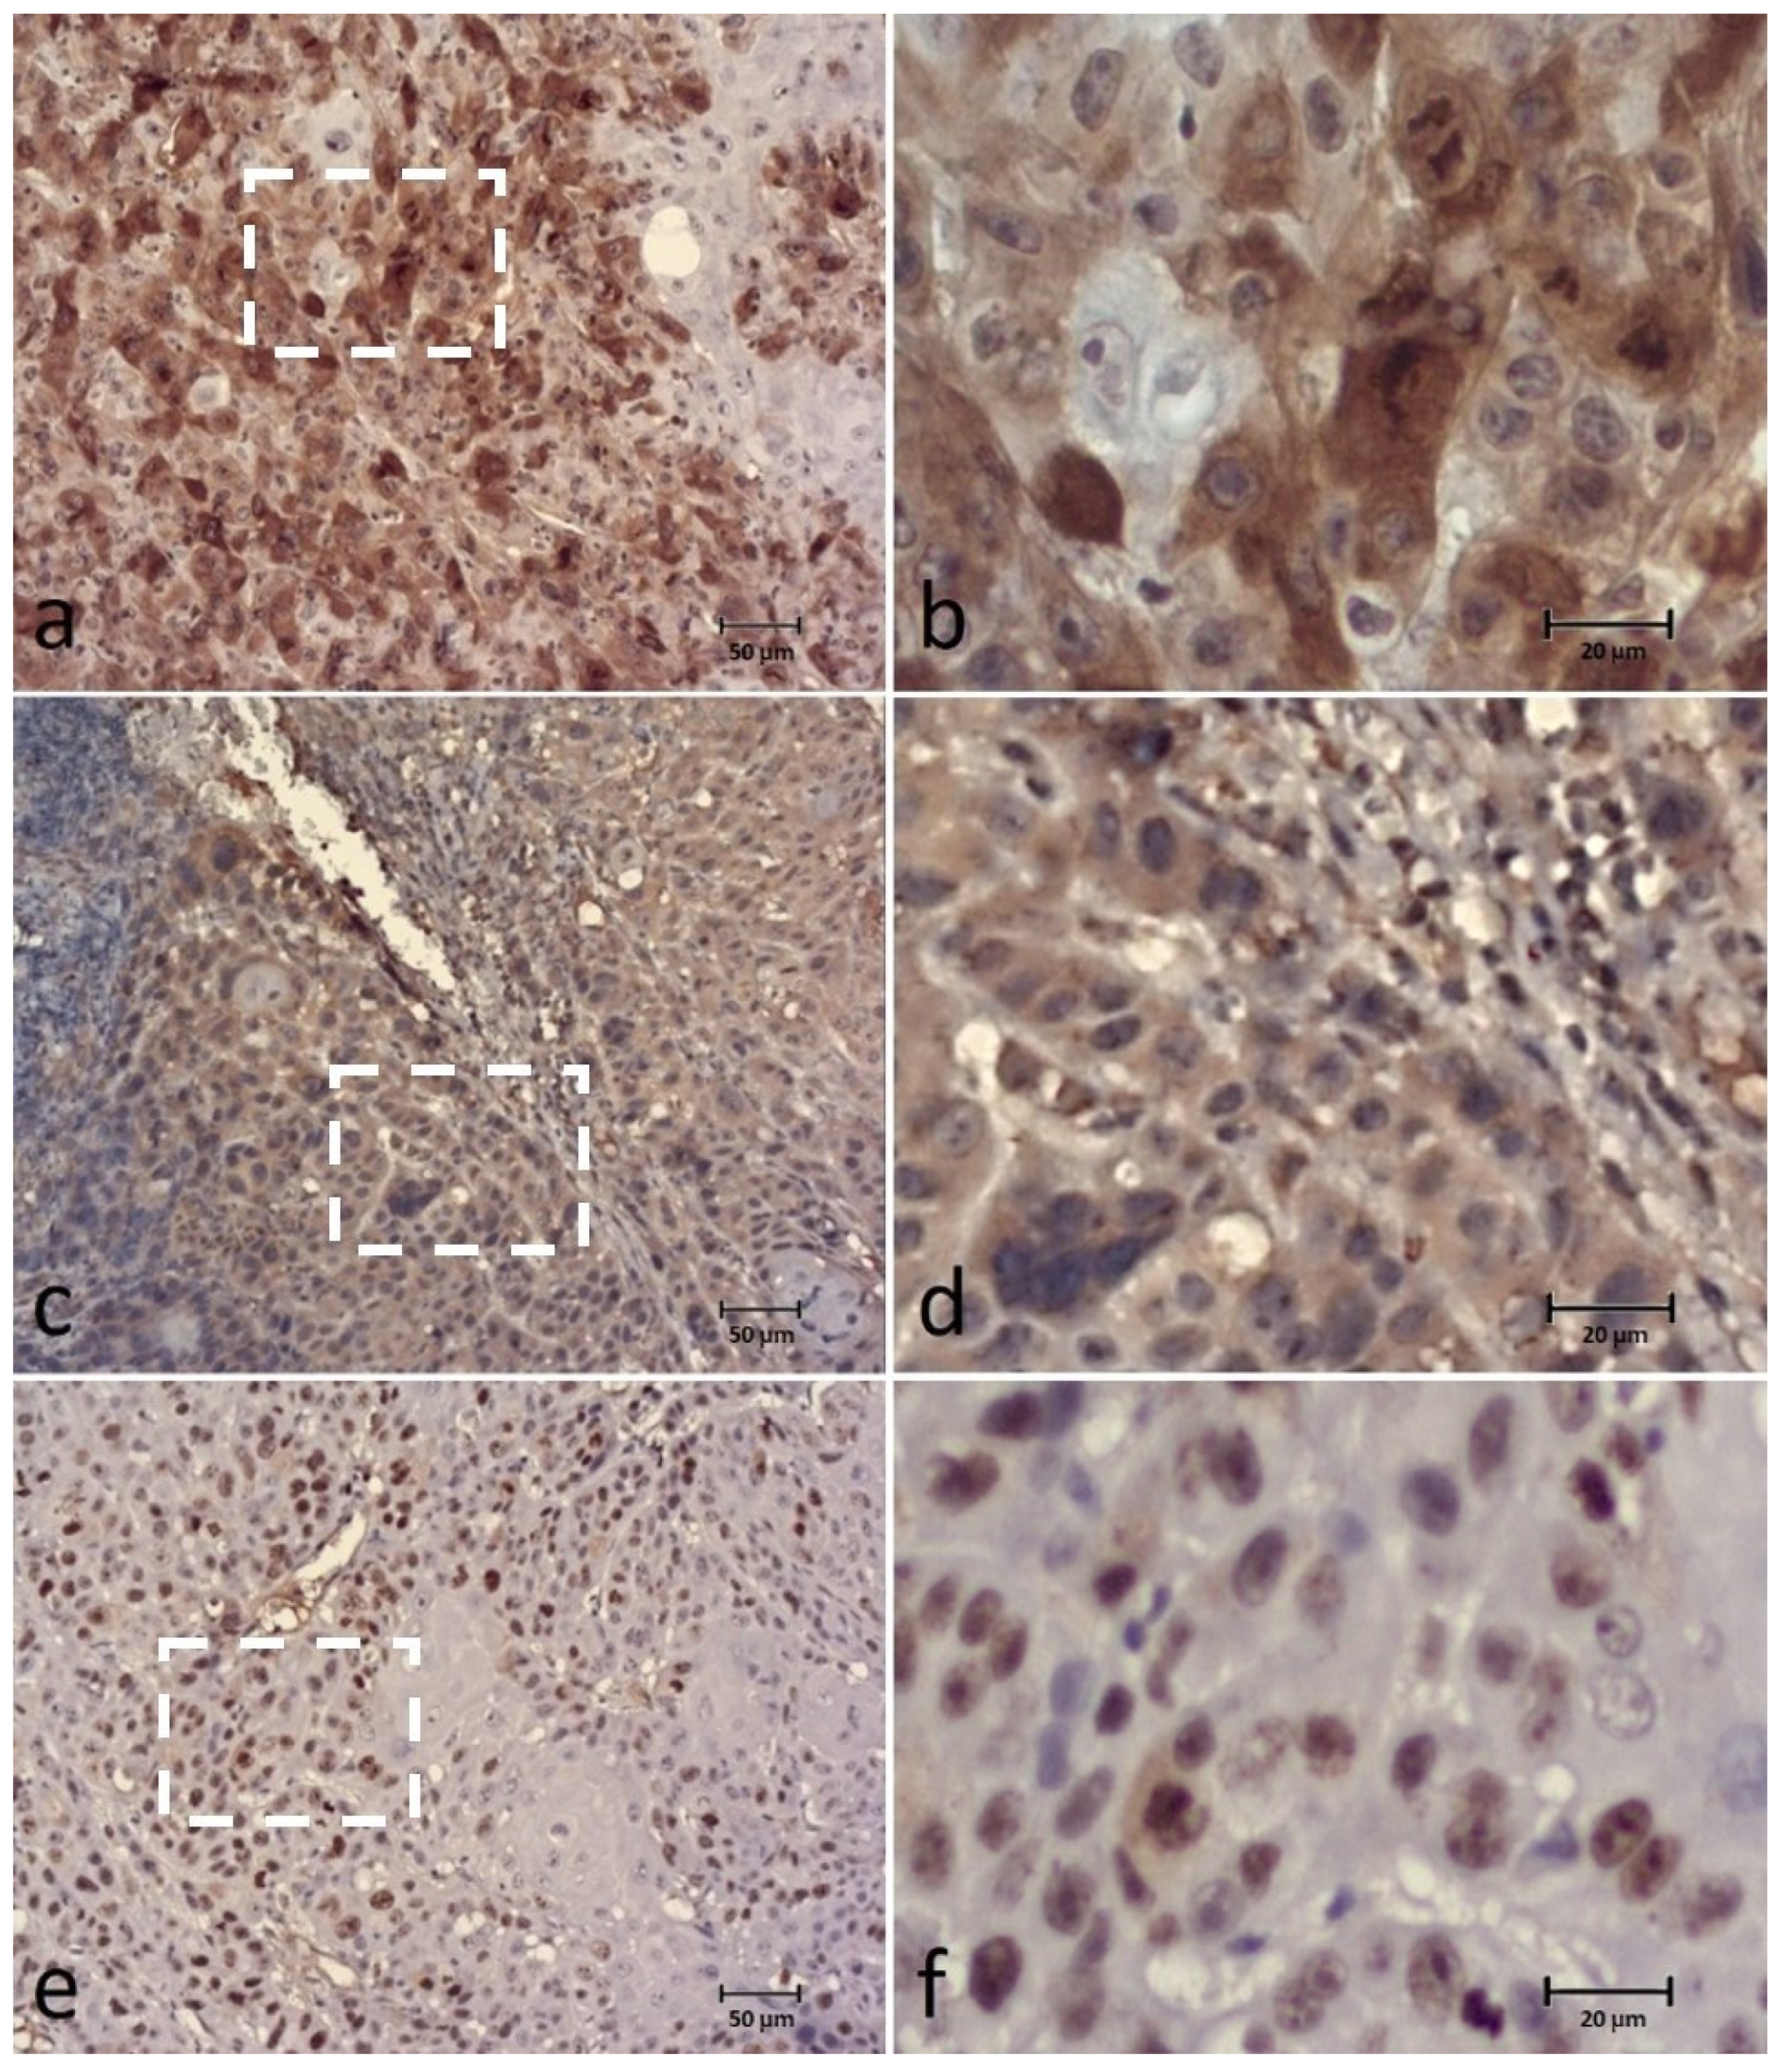
3.1. BUBR1
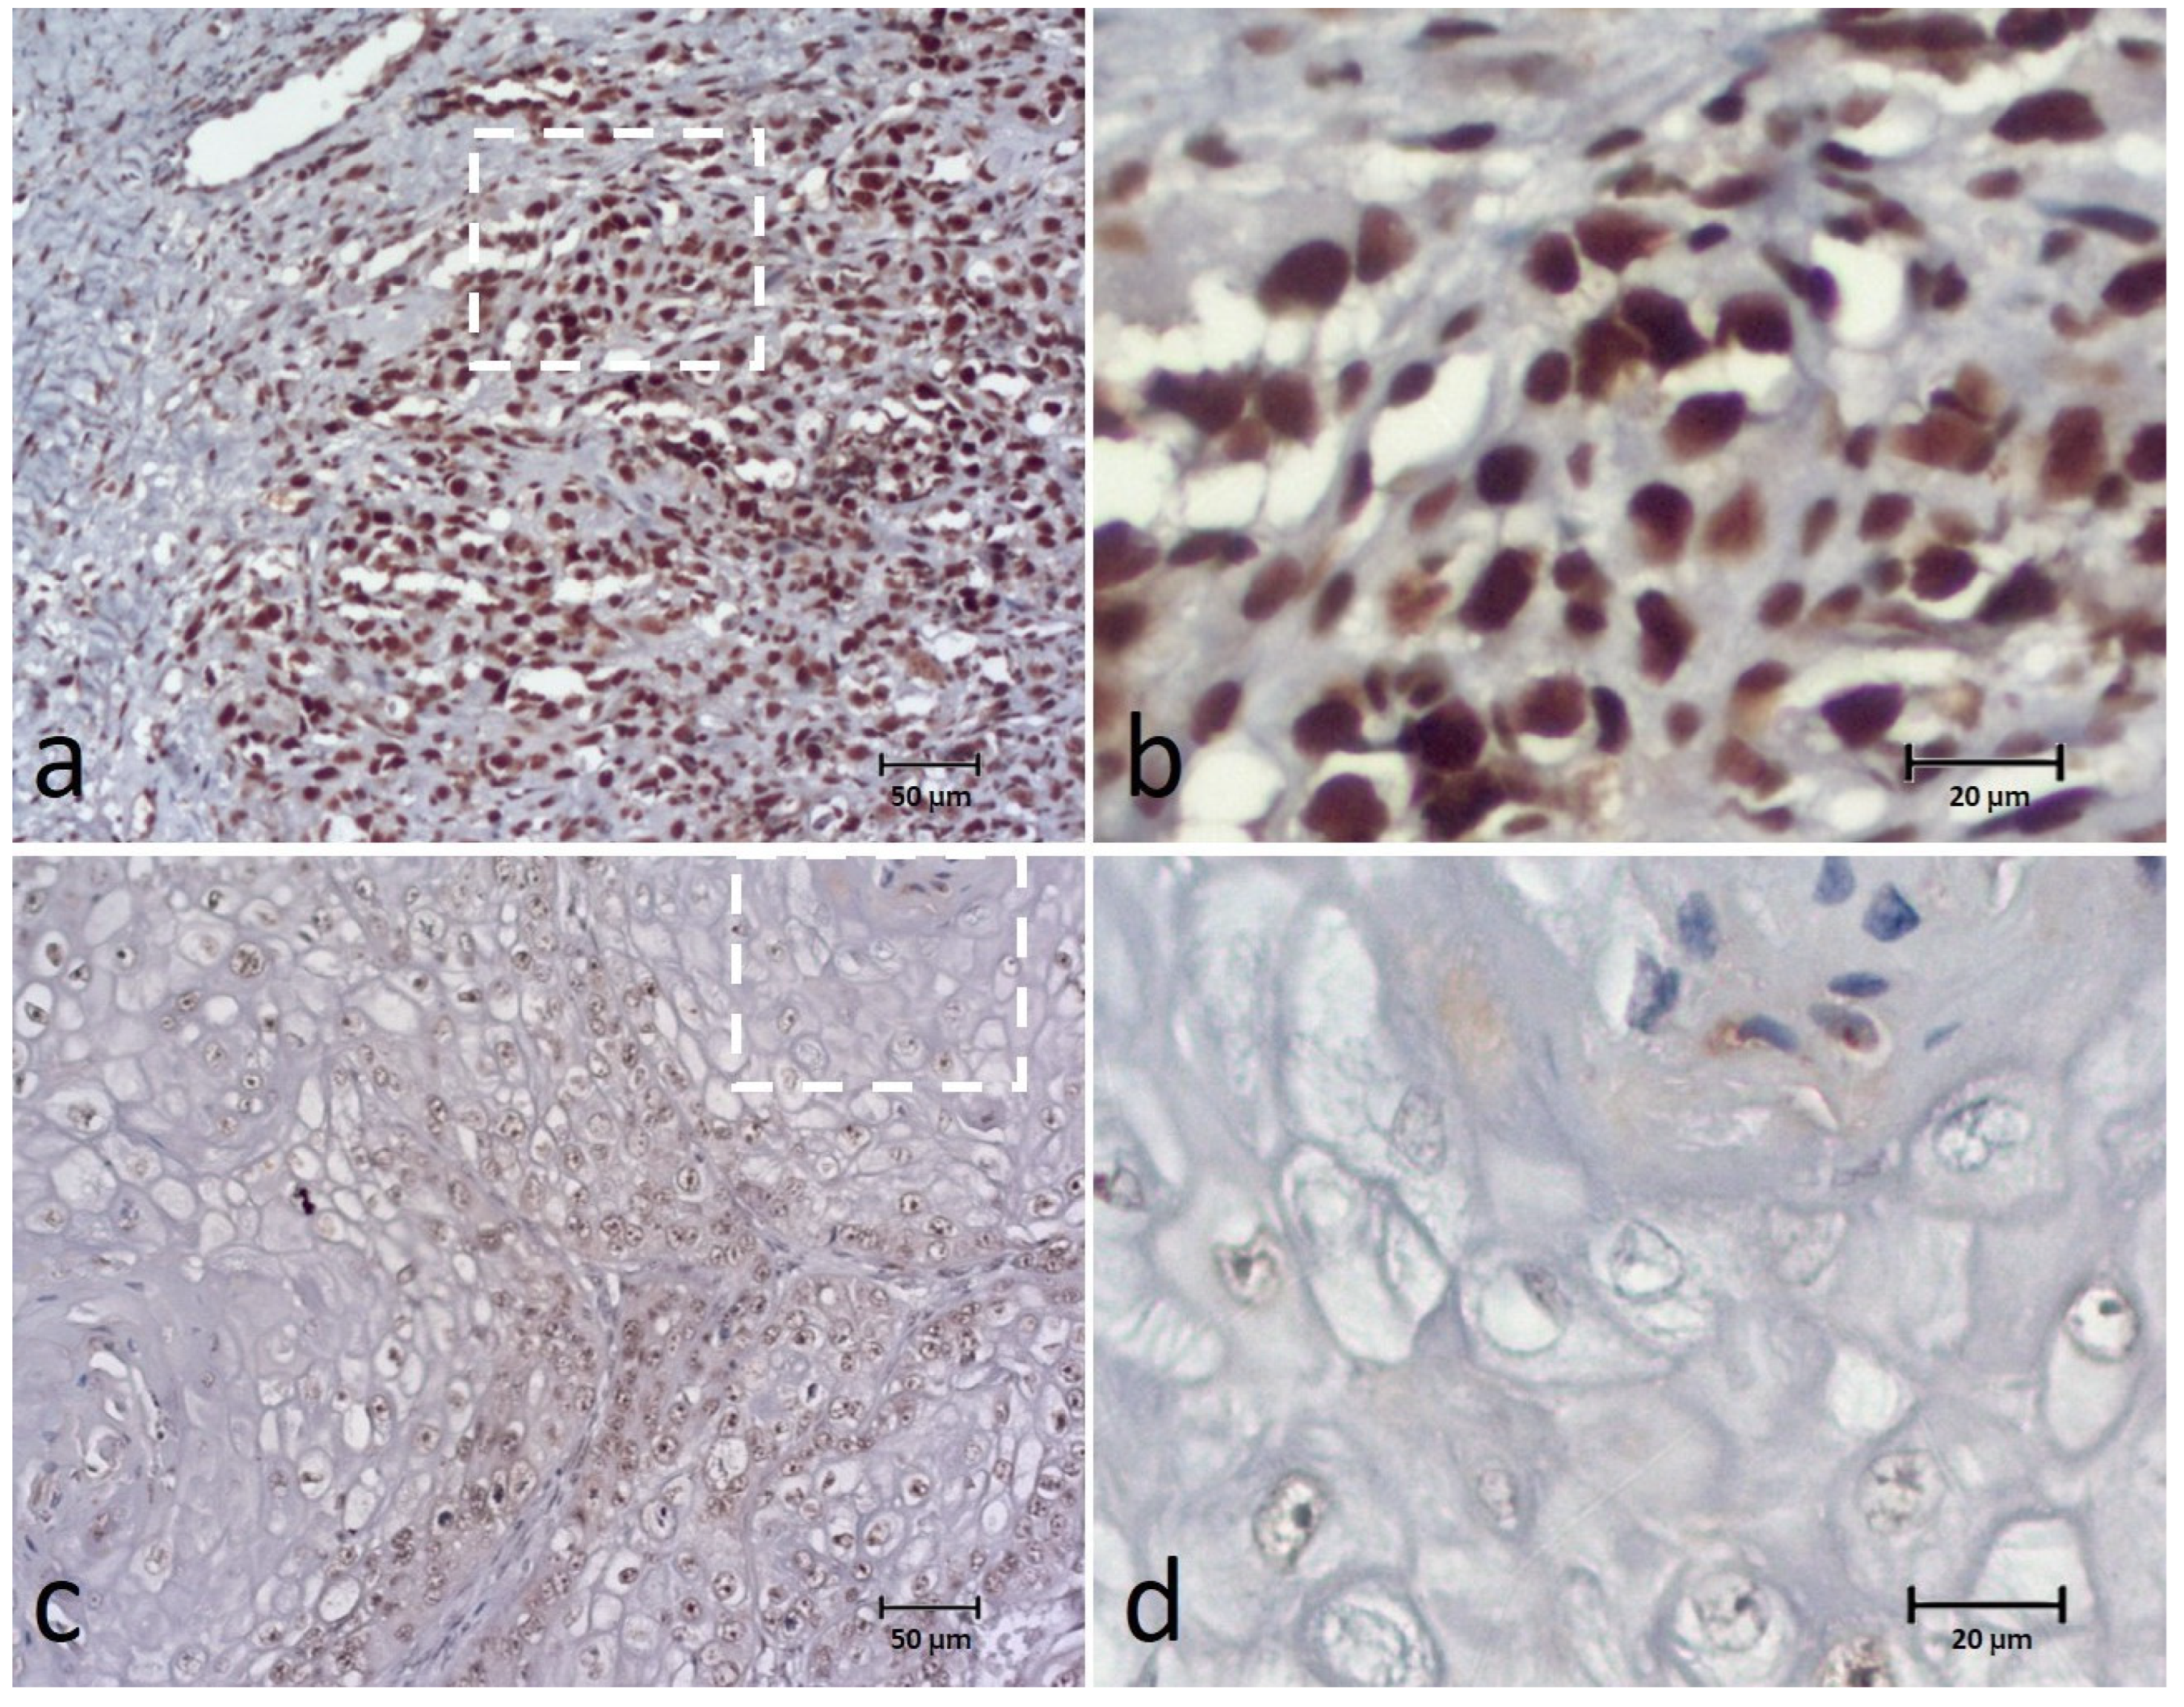
3.2. BUB3
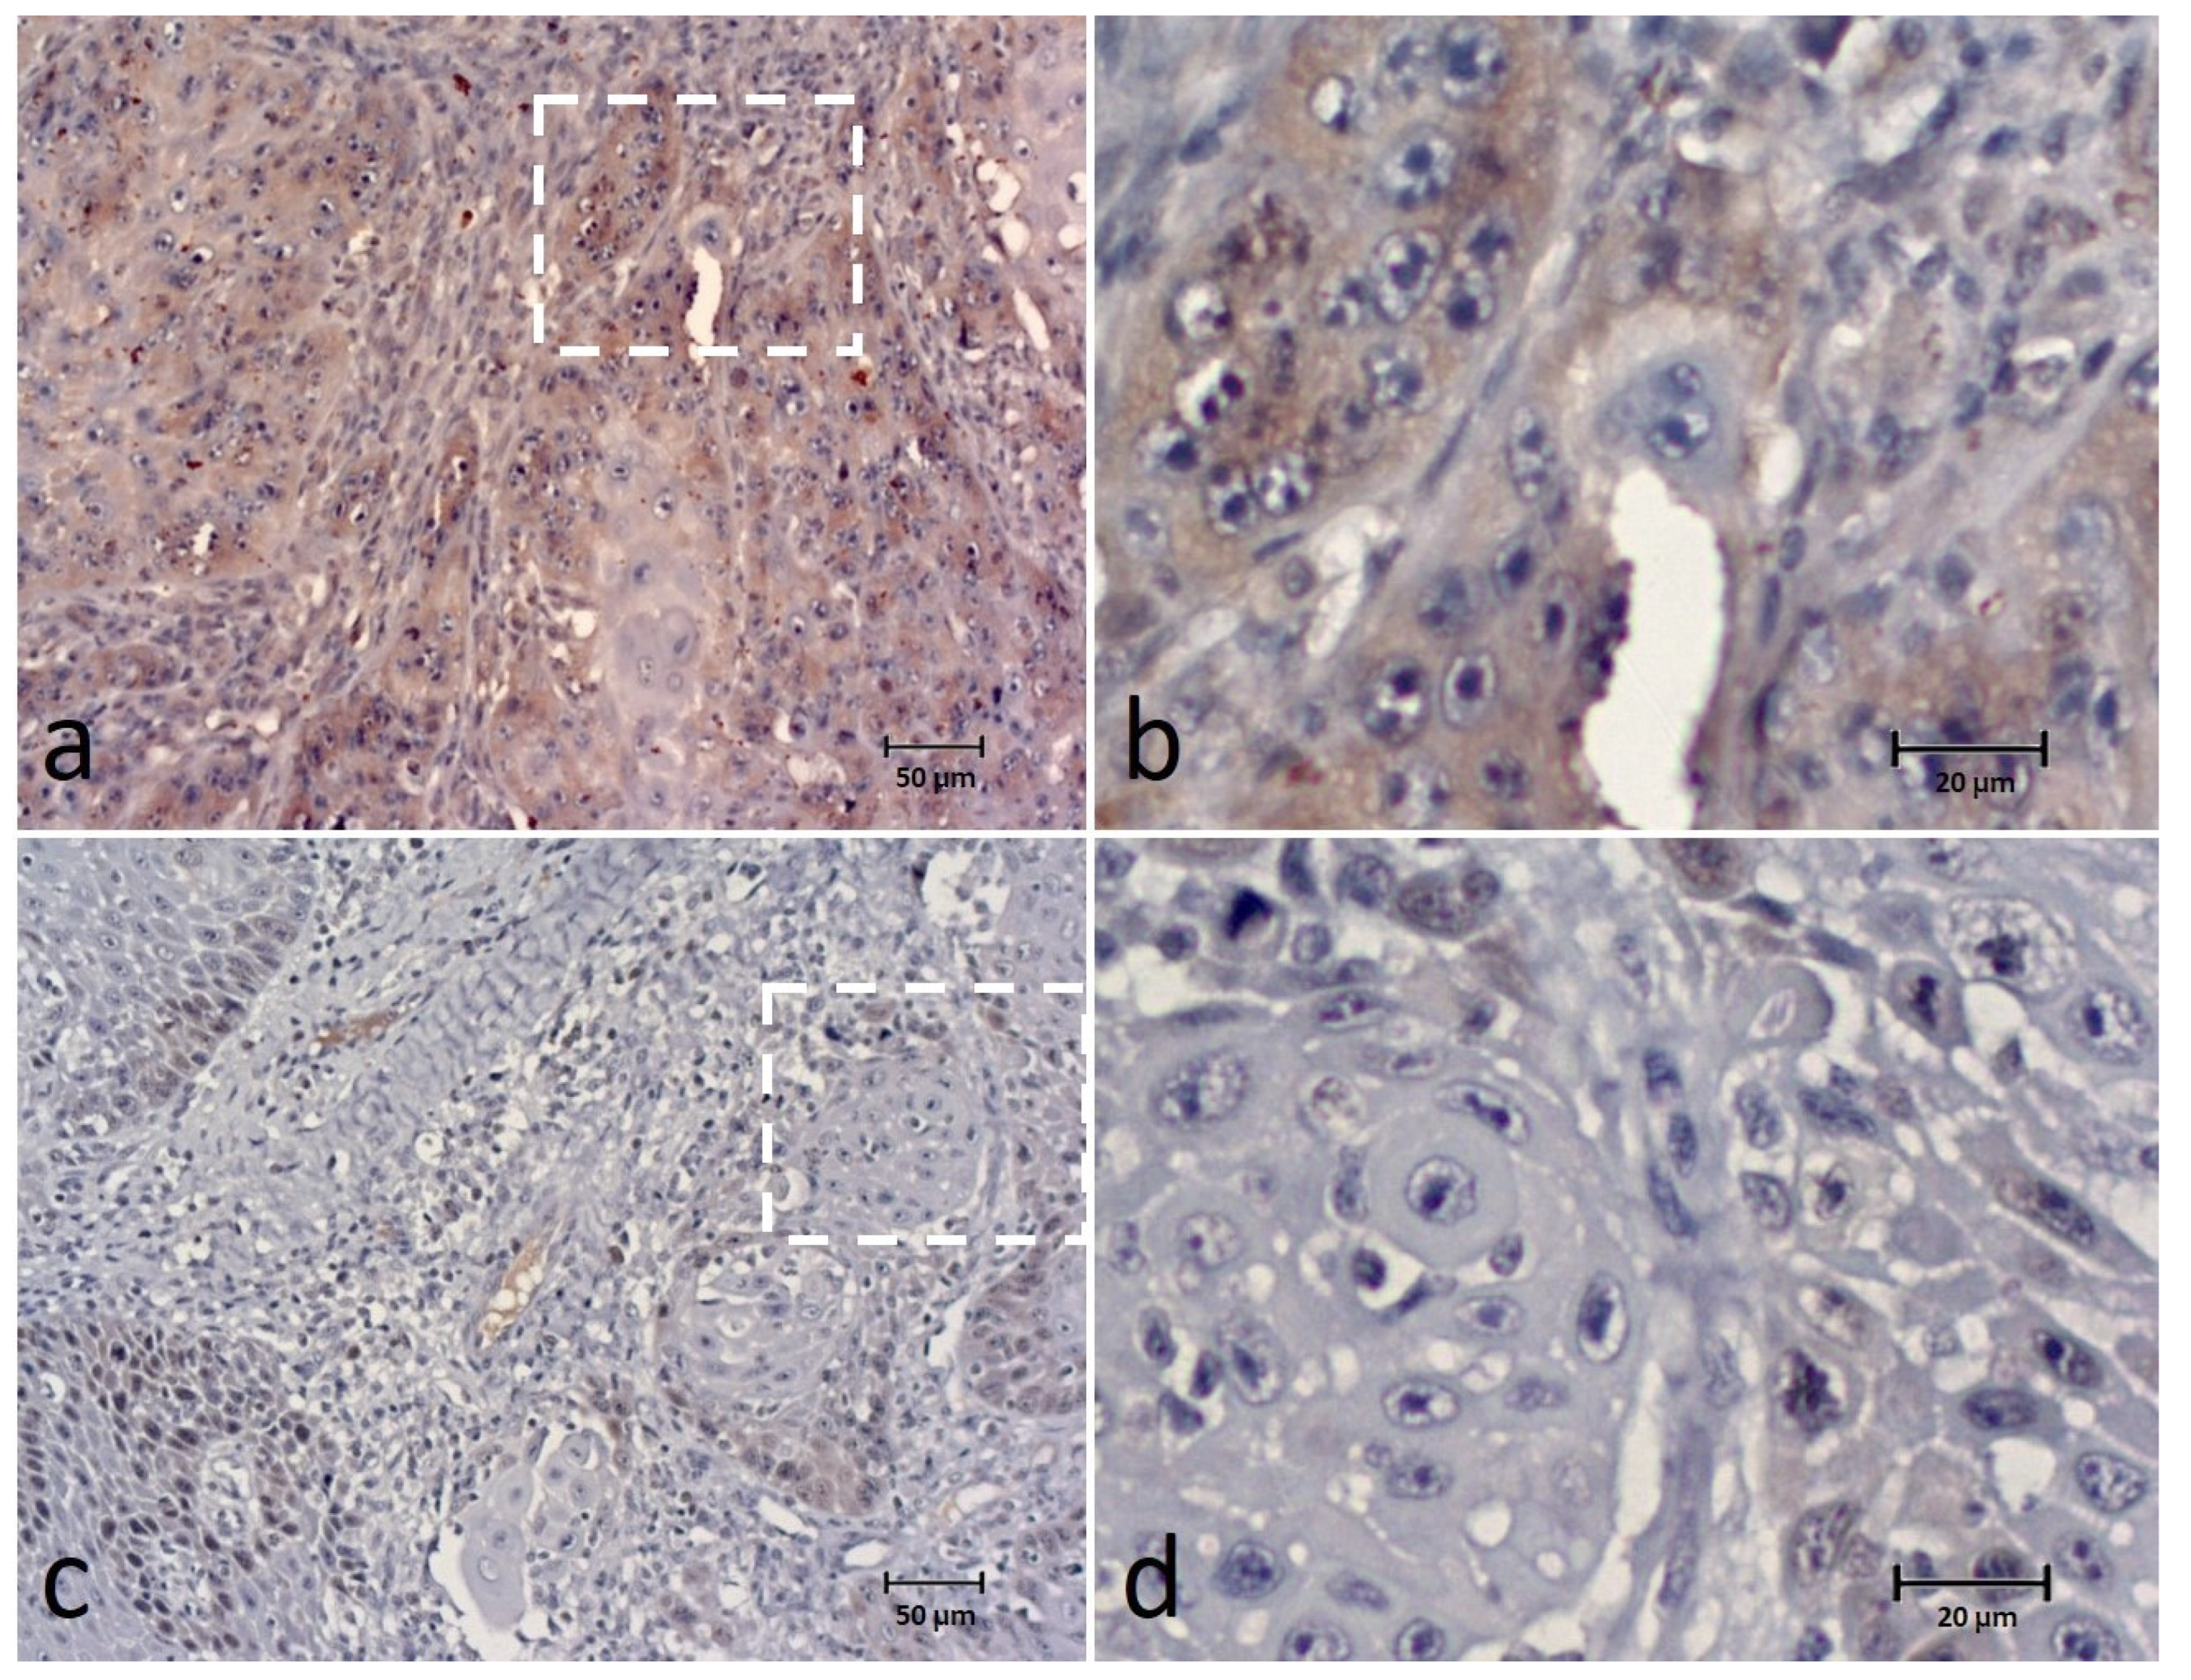
3.3. SPINDLY
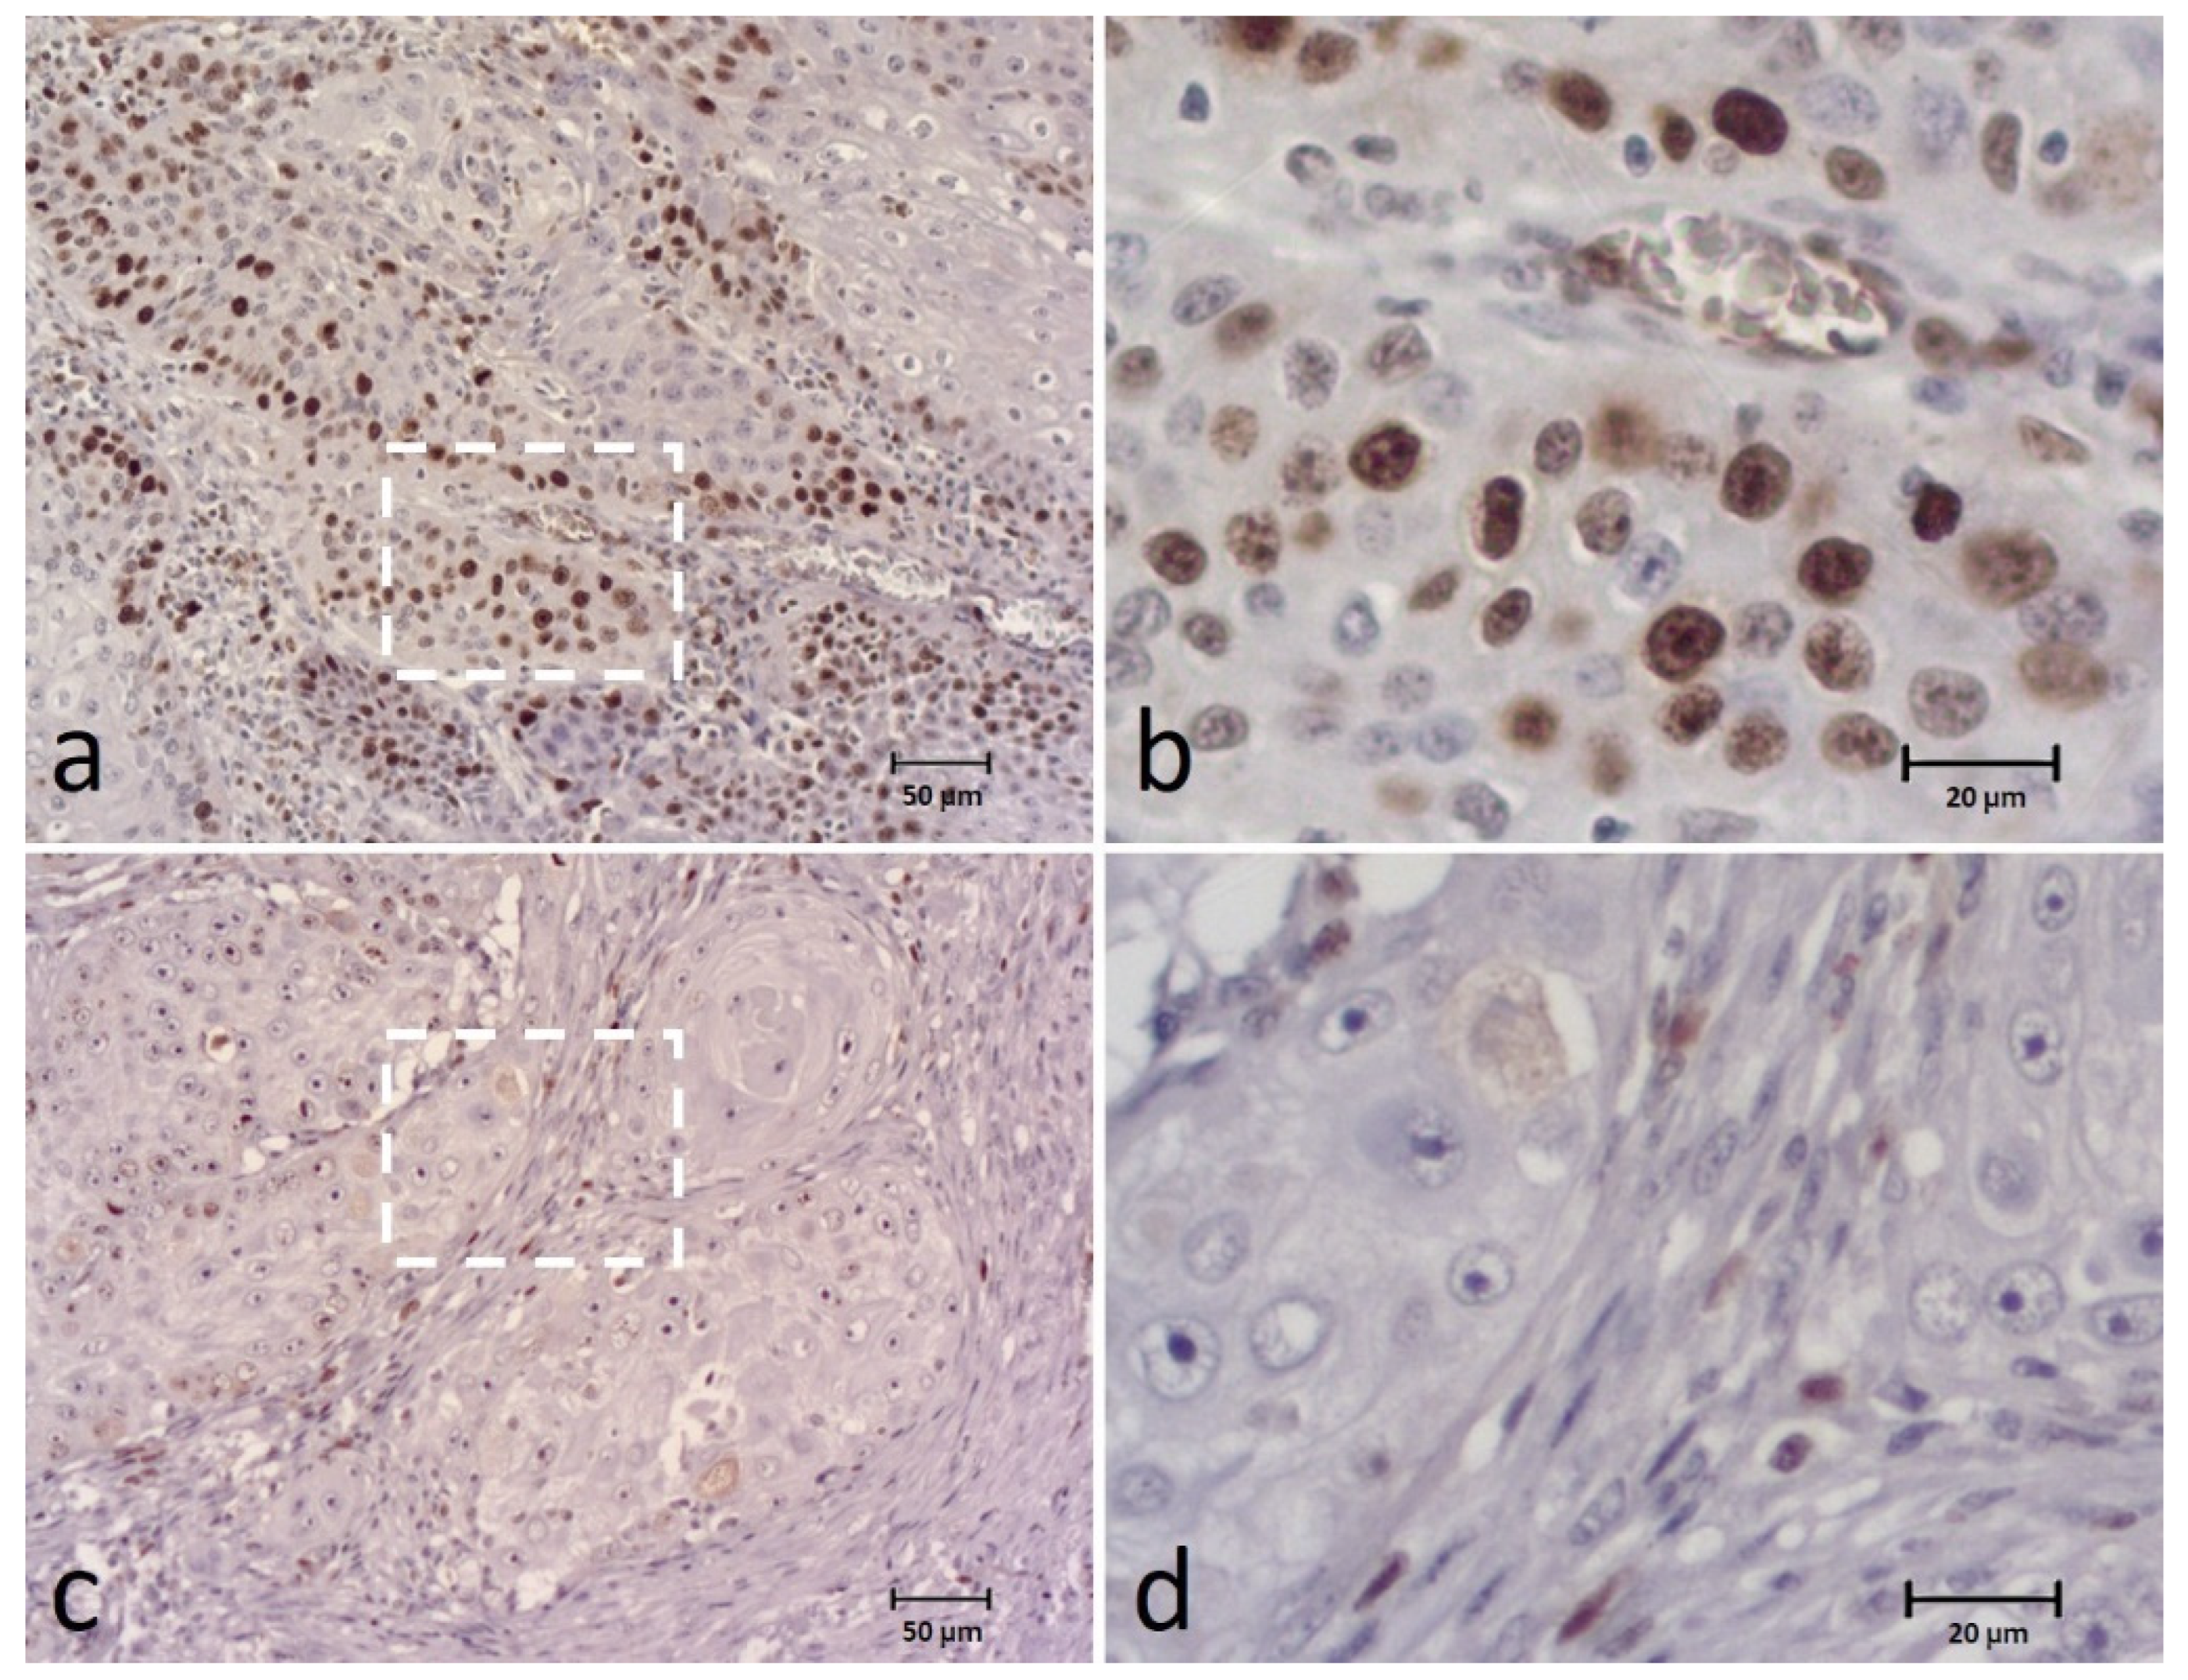
3.4. Ki-67
3.5. Associations between Biomarkers
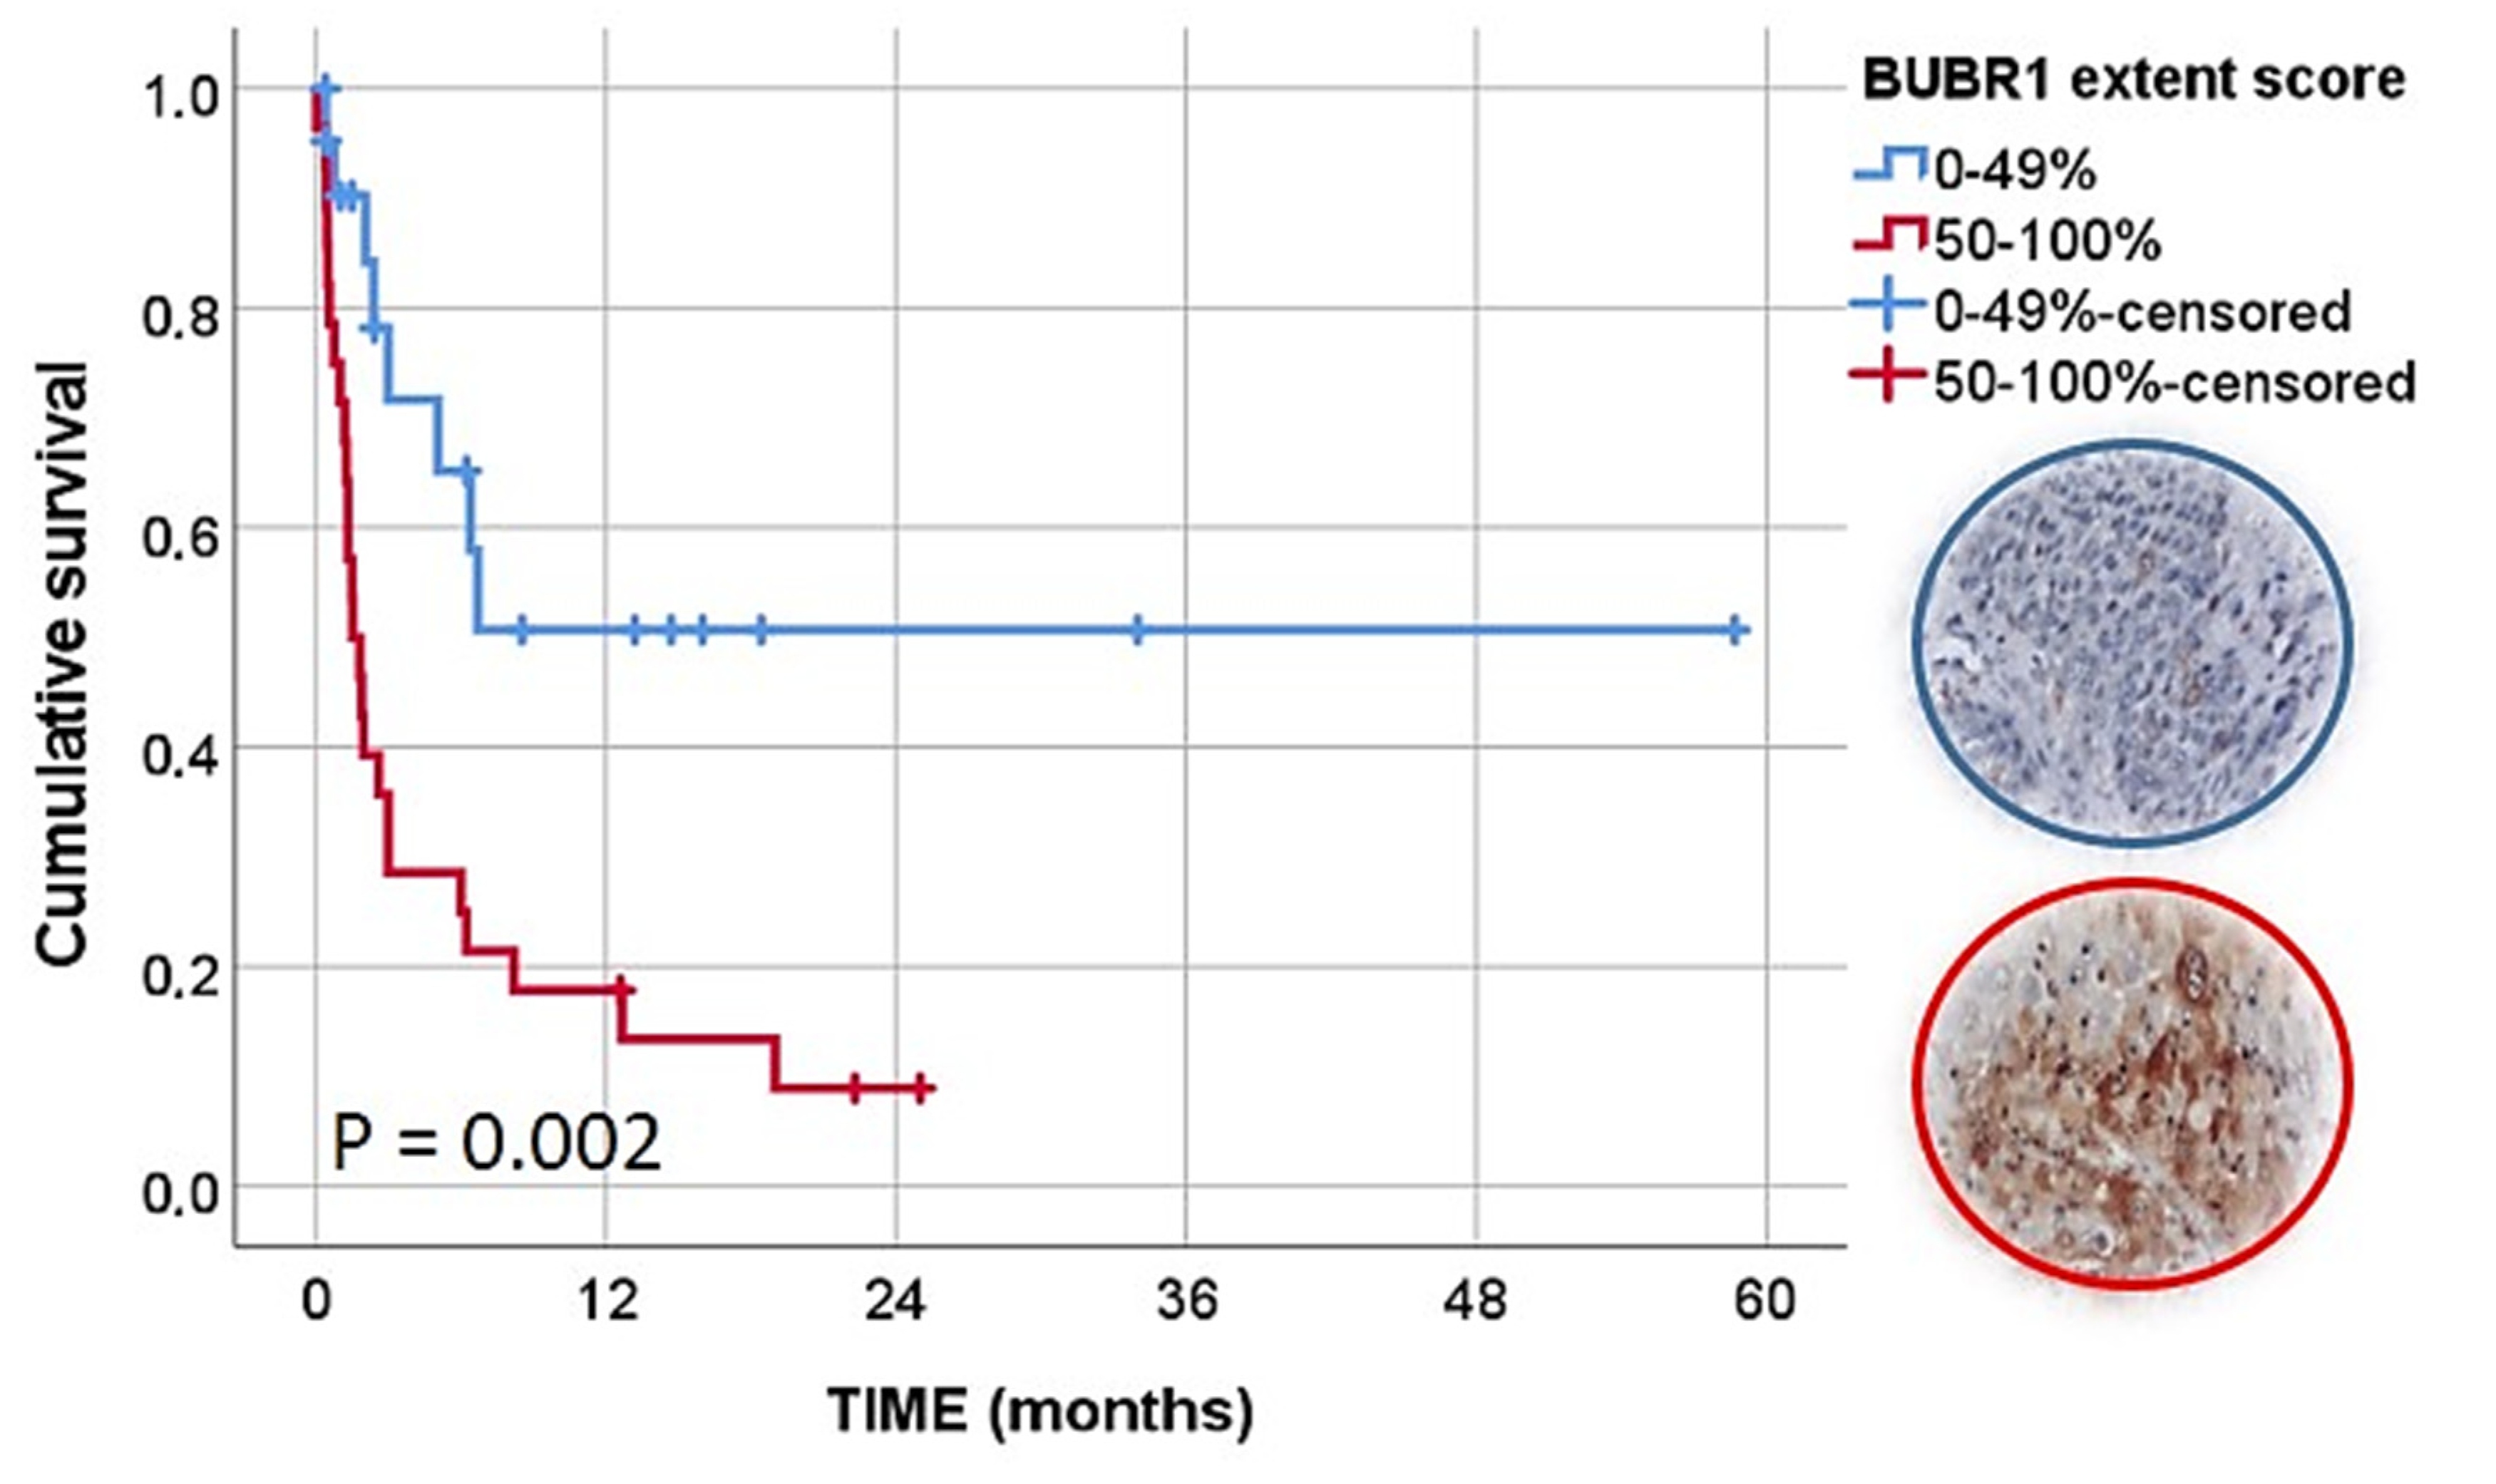
3.6. Clinical Outcome
4. Discussion
5. Conclusions
Supplementary Materials
Author Contributions
Funding
Institutional Review Board Statement
Informed Consent Statement
Data Availability Statement
Acknowledgments
Conflicts of Interest
References
- Vail, D.M.; Thamm, D.; Liptak, J. Withrow and MacEwen’s Small Animal Clinical Oncology—E-Book; Elsevier Health Sciences: Amsterdam, The Netherlands, 2019. [Google Scholar]
- Munday, J.S.; French, A.; Harvey, C.J. Molecular and immunohistochemical studies do not support a role for papillomaviruses in canine oral squamous cell carcinoma development. Vet. J. 2015, 204, 223–225. [Google Scholar] [CrossRef]
- Thaiwong, T.; Sledge, D.G.; Wise, A.G.; Olstad, K.; Maes, R.K.; Kiupel, M. Malignant transformation of canine oral papillomavirus (CPV1)-associated papillomas in dogs: An emerging concern? Papillomavirus Res. 2018, 6, 83–89. [Google Scholar] [CrossRef] [PubMed]
- Warnakulasuriya, S. Causes of oral cancer—An appraisal of controversies. Br. Dent. J. 2009, 207, 471–475. [Google Scholar] [CrossRef] [PubMed]
- Fulton, A.J.; Nemec, A.; Murphy, B.G.; Kass, P.H.; Verstraete, F.J.M. Risk factors associated with survival in dogs with nontonsillar oral squamous cell carcinoma 31 cases (1990–2010). J. Am. Vet. Med. Assoc. 2013, 243, 696–702. [Google Scholar] [CrossRef] [PubMed]
- Culp, W.T.; Ehrhart, N.; Withrow, S.J.; Rebhun, R.B.; Boston, S.; Buracco, P.; Reiter, A.M.; Schallberger, S.P.; Aldridge, C.F.; Kent, M.S.; et al. Results of surgical excision and evaluation of factors associated with survival time in dogs with lingual neoplasia: 97 cases (1995–2008). J. Am. Vet. Med. Assoc. 2013, 242, 1392–1397. [Google Scholar] [CrossRef] [PubMed]
- Mestrinho, L.A.; Faísca, P.; Peleteiro, M.C.; Niza, M.M. PCNA and grade in 13 canine oral squamous cell carcinomas: Association with prognosis. Vet. Comp. Oncol. 2017, 15, 18–24. [Google Scholar] [CrossRef] [PubMed]
- Monteiro, L.; Warnakulasuriya, S. Molecular and Signaling Pathways During Oral Carcinogenesis. In Textbook of Oral Cancer: Prevention, Diagnosis and Management; Warnakulasuriya, S., Greenspan, J.S., Eds.; Springer International Publishing: Cham, Switzerland, 2020; pp. 179–194. [Google Scholar] [CrossRef]
- Lengauer, C.; Kinzler, K.W.; Vogelstein, B. Genetic instabilities in human cancers. Nature 1998, 396, 643–649. [Google Scholar] [CrossRef]
- Bockmühl, U.; Petersen, I. DNA ploidy and chromosomal alterations in head and neck squamous cell carcinoma. Virchows Arch. 2002, 441, 541–550. [Google Scholar] [CrossRef]
- Teixeira, J.H.; Silva, P.; Faria, J.; Ferreira, I.; Duarte, P.; Delgado, M.L.; Queiros, O.; Moreira, R.; Barbosa, J.; Lopes, C.A.; et al. Clinicopathologic significance of BubR1 and Mad2 overexpression in oral cancer. Oral Dis. 2015, 21, 713–720. [Google Scholar] [CrossRef]
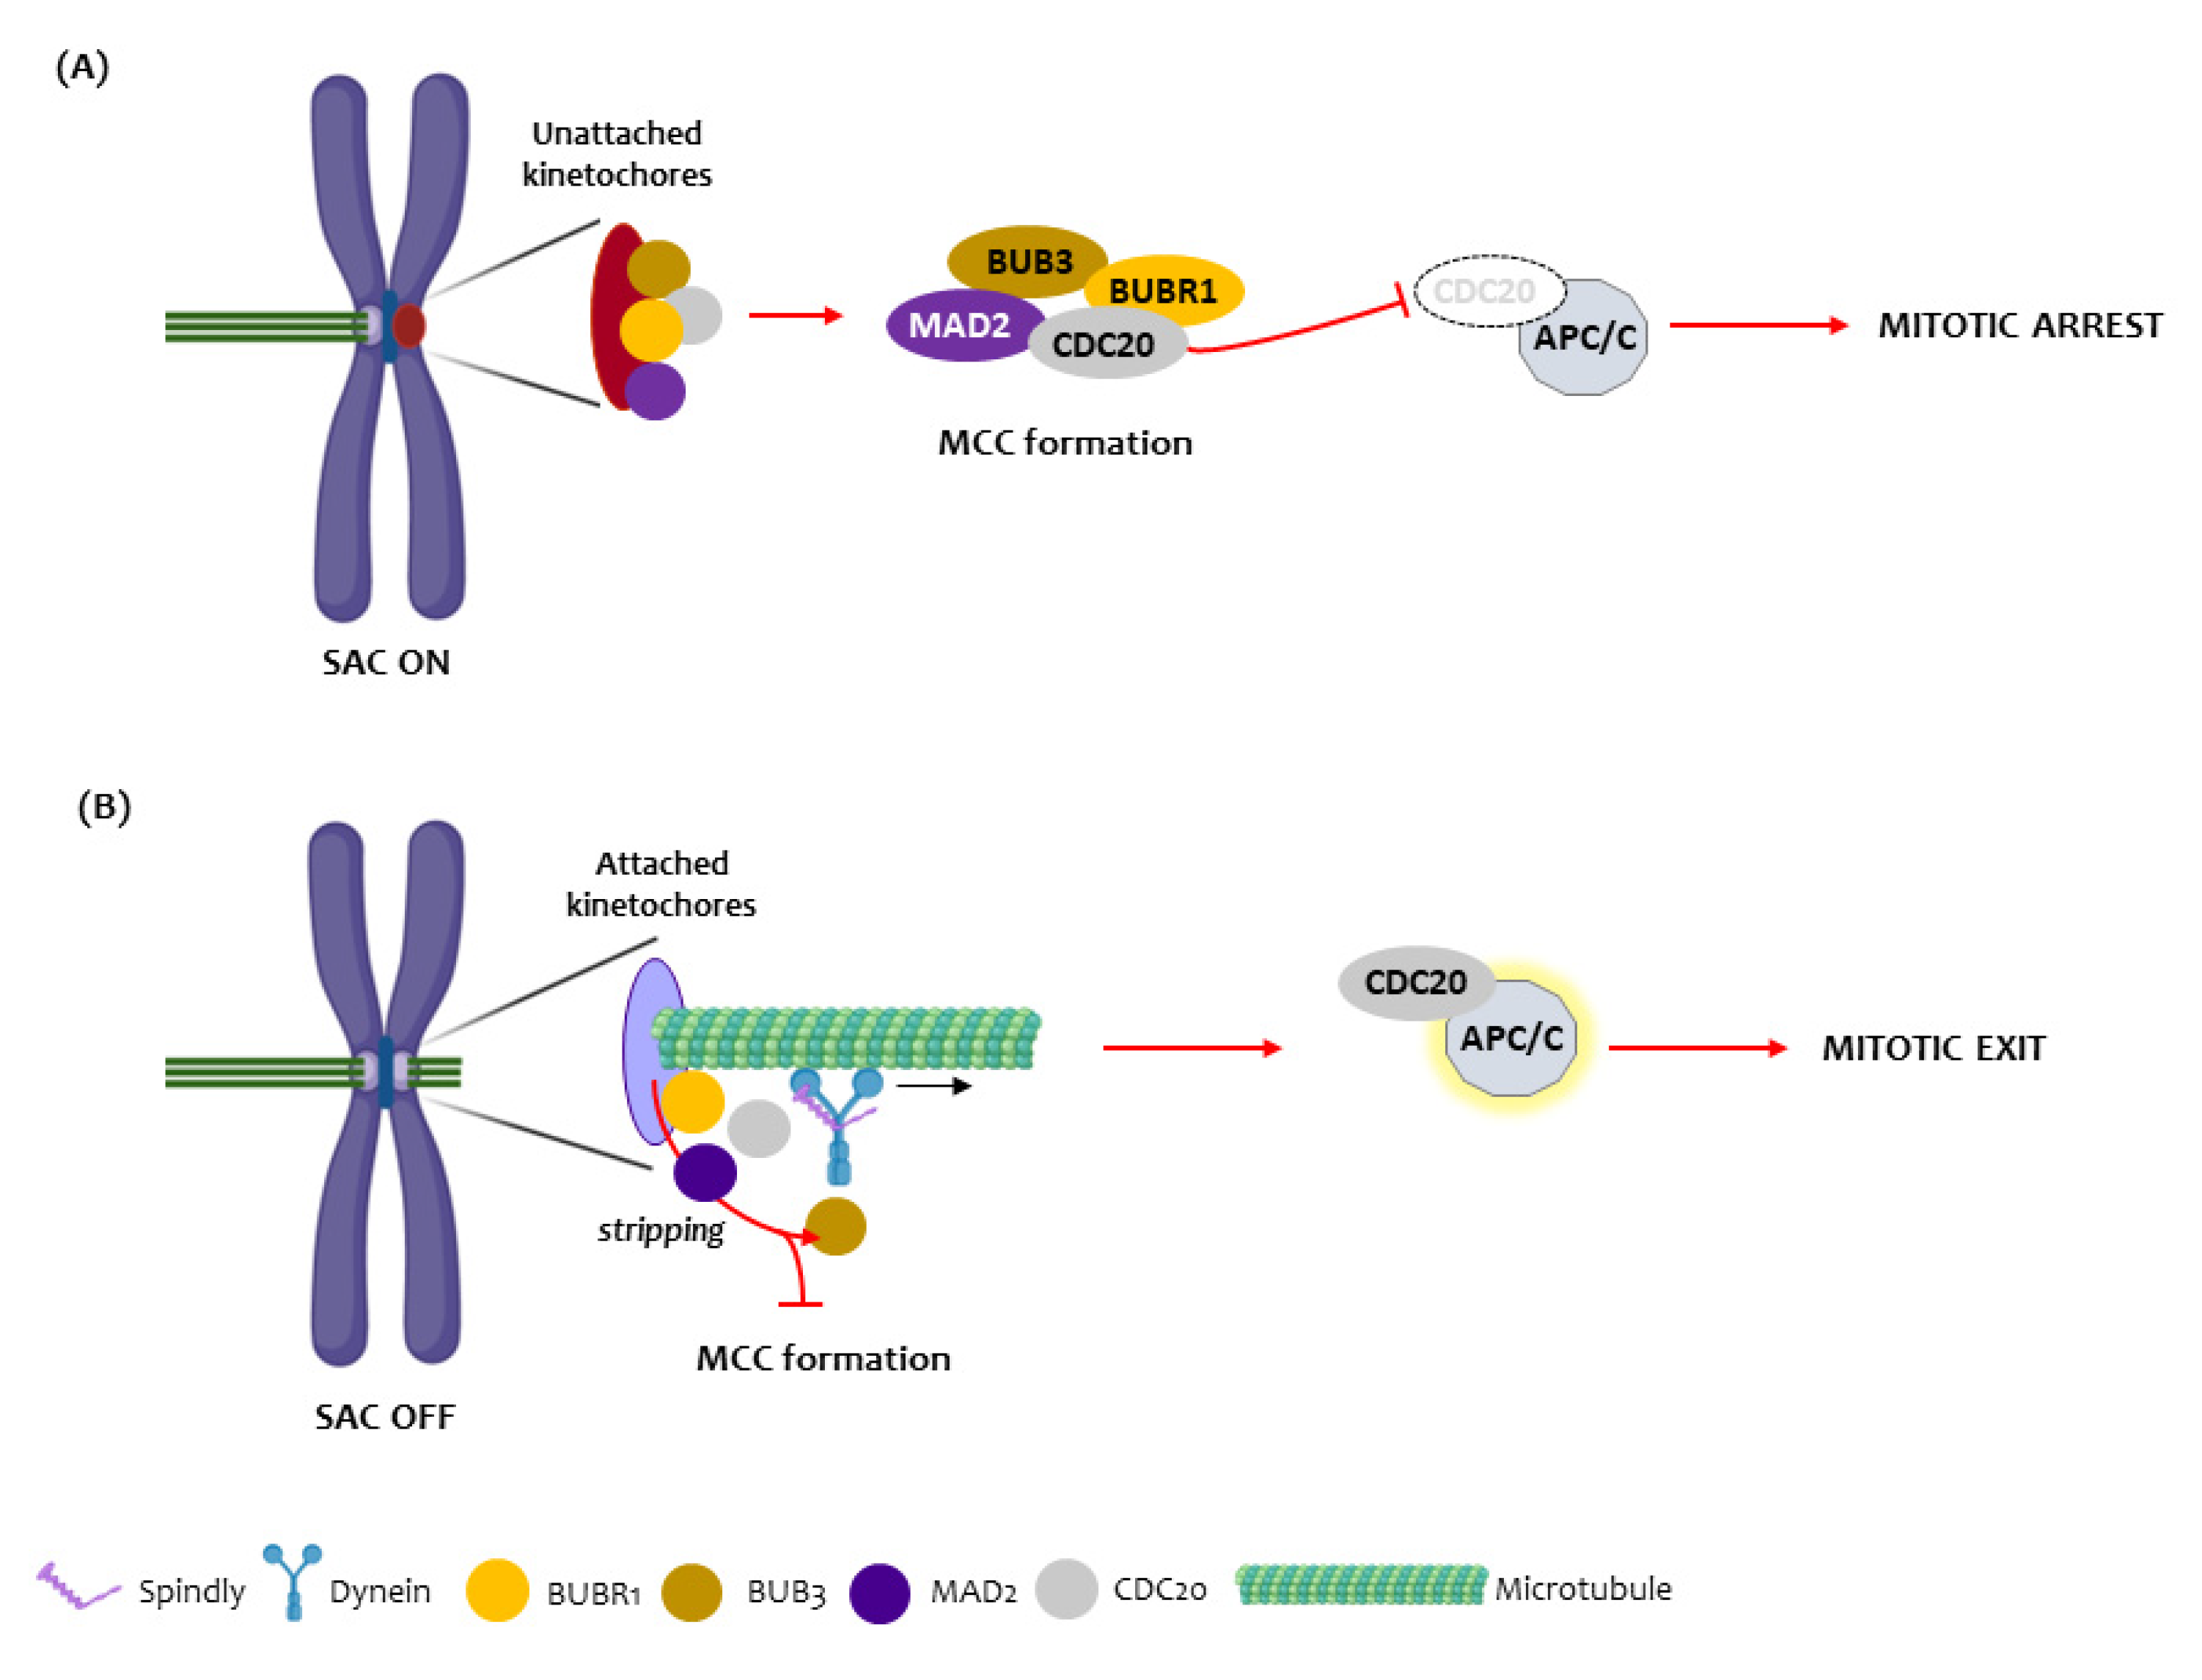
- Logarinho, E.; Bousbaa, H. Kinetochore-microtubule interactions “in check” by Bub1, Bub3 and BubR1: The dual task of attaching and signalling. Cell Cycle 2008, 7, 1763–1768. [Google Scholar] [CrossRef]
- Hanks, S.; Snape, K.; Rahman, N. BUB1B (budding uninhibited by benzimidazoles 1 homolog beta (yeast)). Atlas Genet. Cytogenet. Oncol. Haematol. 2012, 16, 518–520. [Google Scholar] [CrossRef]
- Teixeira, J.H.; Silva, P.M.; Reis, R.M.; Moura, I.M.; Marques, S.; Fonseca, J.; Monteiro, L.S.; Bousbaa, H. An overview of the spindle assembly checkpoint status in oral cancer. BioMed Res. Int. 2014, 2014, 145289. [Google Scholar] [CrossRef] [PubMed]
- Sudakin, V.; Chan, G.K.; Yen, T.J. Checkpoint inhibition of the APC/C in HeLa cells is mediated by a complex of BUBR1, BUB3, CDC20, and MAD2. J. Cell Biol. 2001, 154, 925–936. [Google Scholar] [CrossRef] [PubMed]
- Silva, P.M.A.; Delgado, M.L.; Ribeiro, N.; Florindo, C.; Tavares Á, A.; Ribeiro, D.; Lopes, C.; do Amaral, B.; Bousbaa, H.; Monteiro, L.S. Spindly and Bub3 expression in oral cancer: Prognostic and therapeutic implications. Oral Dis. 2019, 25, 1291–1301. [Google Scholar] [CrossRef] [PubMed]
- Silva, P.M.; Reis, R.M.; Bolanos-Garcia, V.M.; Florindo, C.; Tavares, A.; Bousbaa, H. Dynein-dependent transport of spindle assembly checkpoint proteins off kinetochores toward spindle poles. FEBS Lett. 2014, 588, 3265–3273. [Google Scholar] [CrossRef]
- Chan, Y.W.; Fava, L.L.; Uldschmid, A.; Schmitz, M.H.A.; Gerlich, D.W.; Nigg, E.A.; Santamaria, A. Mitotic control of kinetochore-associated dynein and spindle orientation by human Spindly. J. Cell Biol. 2009, 185, 859–874. [Google Scholar] [CrossRef]
- Silva, P.; Barbosa, J.; Nascimento, A.V.; Faria, J.; Reis, R.; Bousbaa, H. Monitoring the fidelity of mitotic chromosome segregation by the spindle assembly checkpoint. Cell Prolif. 2011, 44, 391–400. [Google Scholar] [CrossRef]
- Edge, S.B. AJCC Cancer Staging Manual, 8th ed.; Springer: New York, NY, USA, 2017. [Google Scholar]
- Munday, J.S.; Löhr, C.V.; Kiupel, M. Tumors of the Alimentary Tract. In Tumors in Domestic Animals; Wiley-Blackwell: New York, NY, USA, 2016; pp. 499–601. [Google Scholar] [CrossRef]
- Head, K.W. Histological Classification of Tumors of the Alimentary System of Domestic Animals; Armed Forces Institute of Pathology: Dhaka, Bangladesh, 2003. [Google Scholar]
- Anneroth, G.; Batsakis, J.; Luna, M. Review of the literature and a recommended system of malignancy grading in oral squamous cell carcinomas. Scand. J. Dent. Res. 1987, 95, 229–249. [Google Scholar] [CrossRef]
- Bryne, M.; Koppang, H.S.; Lilleng, R.; Stene, T.; Bang, G.; Dabelsteen, E. New malignancy grading is a better prognostic indicator than Broders’ grading in oral squamous cell carcinomas. J. Oral Pathol. Med. 1989, 18, 432–437. [Google Scholar] [CrossRef]
- Diogo, V.; Teixeira, J.; Silva, P.M.; Bousbaa, H. Spindle Assembly Checkpoint as a Potential Target in Colorectal Cancer: Current Status and Future Perspectives. Clin. Color. Cancer 2017, 16, 1–8. [Google Scholar] [CrossRef]
- Marques, S.; Fonseca, J.; Silva, P.M.; Bousbaa, H. Targeting the spindle assembly checkpoint for breast cancer treatment. Curr. Cancer Drug Targets 2015, 15, 272–281. [Google Scholar] [CrossRef] [PubMed]
- Hsieh, P.C.; Chen, Y.K.; Tsai, K.B.; Shieh, T.Y.; Chang, Y.Y.; Chang, J.G.; Wu, H.L.; Lin, S.F. Expression of BUBR1 in human oral potentially malignant disorders and squamous cell carcinoma. Oral Surg. Oral Med. Oral Pathol. Oral Radiol. Endodontology 2010, 109, 257–267. [Google Scholar] [CrossRef] [PubMed]
- Rizzardi, C.; Torelli, L.; Barresi, E.; Schneider, M.; Canzonieri, V.; Biasotto, M.; Di Lenarda, R.; Melato, M. BUBR1 expression in oral squamous cell carcinoma and its relationship to tumor stage and survival. Head Neck 2011, 33, 727–733. [Google Scholar] [CrossRef] [PubMed]
- Lira, R.C.; Miranda, F.A.; Guimarães, M.C.; Simões, R.T.; Donadi, E.A.; Soares, C.P.; Soares, E.G. BUBR1 expression in benign oral lesions and squamous cell carcinomas: Correlation with human papillomavirus. Oncol. Rep. 2010, 23, 1027–1036. [Google Scholar] [CrossRef]
- Choi, J.W.; Kim, Y.; Lee, J.H.; Kim, Y.S. High expression of spindle assembly checkpoint proteins CDC20 and MAD2 is associated with poor prognosis in urothelial bladder cancer. Virchows Arch. 2013, 463, 681–687. [Google Scholar] [CrossRef]
- Ando, K.; Kakeji, Y.; Kitao, H.; Iimori, M.; Zhao, Y.; Yoshida, R.; Oki, E.; Yoshinaga, K.; Matumoto, T.; Morita, M.; et al. High expression of BUBR1 is one of the factors for inducing DNA aneuploidy and progression in gastric cancer. Cancer Sci. 2010, 101, 639–645. [Google Scholar] [CrossRef]
- Cirak, Y.; Sarsik, B.; Cakar, B.; Sen, S.; Simsir, A.; Uslu, R. Predictive and prognostic values of Tau and BubR1 protein in prostate cancer and their relationship to the Gleason score. Med. Oncol. 2013, 30, 526. [Google Scholar] [CrossRef]
- Liu, A.W.; Cai, J.; Zhao, X.L.; Xu, A.M.; Fu, H.Q.; Nian, H.; Zhang, S.H. The clinicopathological significance of BUBR1 overexpression in hepatocellular carcinoma. J. Clin. Pathol. 2009, 62, 1003–1008. [Google Scholar] [CrossRef]
- Enjoji, M.; Iida, S.; Sugita, H.; Ishikawa, T.; Uetake, H.; Inokuchi, M.; Yamada, H.; Kojima, K.; Sugihara, K. BubR1 and AURKB overexpression are associated with a favorable prognosis in gastric cancer. Mol. Med. Rep. 2009, 2, 589–596. [Google Scholar] [CrossRef][Green Version]
- Monteiro, L.; Silva, P.; Delgado, L.; Amaral, B.; Garcês, F.; Salazar, F.; Pacheco, J.J.; Lopes, C.; Bousbaa, H.; Warnakulasuriya, S. Expression of spindle assembly checkpoint proteins BubR1 and Mad2 expression as potential biomarkers of malignant transformation of oral leukoplakia: An observational cohort study. Med. Oral Patol. Oral Y Cirugía Bucal 2021, 26, e719–e728. [Google Scholar] [CrossRef]


| Variables | N (%) | |
|---|---|---|
| Gender | Female | 28 (46.7%) |
| Male | 32 (53.3%) | |
| Age | <7 years old | 6 (10%) |
| ≥7 years old | 54 (90%) | |
| Breed (* n = 53) | Small | 10 (18.9%) |
| Medium | 5 (9.4%) | |
| Large | 12 (22.6%) | |
| UB | 26 (49.1%) | |
| Tumor location | Mouth (NOS) | 13 (21.7%) |
| Gingiva | 20 (33.3%) | |
| Tongue | 12 (20%) | |
| Oropharynx (including tonsils) | 8 (13.3%) | |
| Palate | 7 (11.7%) | |
| Histological type | Papillary SCC | 10 (16.7%) |
| Conventional SCC | 50 (83.3%) | |
| Anneroth’s histological grade | Well-differentiated | 19 (31.7%) |
| Moderately differentiated | 41 (68.3%) | |
| Poorly differentiated | 0 (0%) | |
| Bryne´s histological grade | Well-differentiated | 25 (41.7%) |
| Moderately differentiated | 33 (55%) | |
| Poorly differentiated | 2 (3.3%) | |
| Pattern of invasion | I—Pushing, well-delineated, infiltrating borders | 20 (33.3%) |
| II—Infiltrating, solid cords, bands and/or strands | 22 (36.7%) | |
| III—Small groups or cords of infiltrating cells | 15 (25%) | |
| IV—Marked and widespread cellular dissemination in small groups and/or in single cells | 3 (5%) | |
| Stage of invasion | I—Carcinoma in situ and/or questionable invasion | 0 |
| II—Distinct invasion, but involving lamina propria only | 39 (65%) | |
| III—Invasion below lamina propria adjacent to muscles, salivary gland tissues and periosteum | 20 (33.3%) | |
| IV—Extensive and deep invasion replacing most of the stromal tissue and infiltrating jaw bone | 1 (1.7%) | |
| Bone invasion | Absent | 50 (83.3%) |
| Present | 10 (16.7%) | |
| Vascular invasion | Absent | 56 (93.3%) |
| Present | 4 (6.7%) | |
| Tumor stage (* n = 50) | I + II | 19 (38%) |
| III + IV | 31 (62%) | |
| Treatment (* n = 50) | Surgery | 11 (22%) |
| Chemotherapy | 4 (8%) | |
| Palliative treatment/support | 35 (70%) | |
| Variables | BUBR1 | BUB3 | SPINDLY | Ki-67 | |||||
|---|---|---|---|---|---|---|---|---|---|
| Score | Extent | Intensity | Extent | Intensity | Extent | Intensity | Extent | Intensity | |
| BUBR1 | Extent | - | - | - | - | - | |||
| ρ | 0.071 | 0.290 | 0.506 | ||||||
| p-value | 0.601 | 0.032 | <0.001 | ||||||
| Intensity | - | - | - | - | - | ||||
| ρ | 0.182 | 0.452 | 0.182 | ||||||
| p-value | 0.180 | <0.001 | 0.180 | ||||||
| BUB3 | Extent | - | - | - | - | - | |||
| ρ | 0.071 | 0.089 | 0.225 | ||||||
| p-value | 0.601 | 0.526 | 0.102 | ||||||
| Intensity | - | - | - | - | - | ||||
| ρ | 0.182 | 0.180 | 0.138 | ||||||
| p-value | 0.180 | 0.196 | 0.320 | ||||||
| SPINDLY | Extent | - | - | - | - | - | |||
| ρ | 0.290 | 0.089 | 0.148 | ||||||
| p-value | 0.032 | 0.526 | 0.286 | ||||||
| Intensity | - | - | - | - | - | ||||
| ρ | 0.457 | 0.180 | 0.352 | ||||||
| p-value | <0.001 | 0.196 | 0.009 | ||||||
| Ki-67 | Extent | - | - | - | - | - | |||
| ρ | 0.506 | 0.225 | 0.148 | ||||||
| p-value | <0.001 | 0.102 | 0.286 | ||||||
| Intensity | - | - | - | - | - | ||||
| ρ | 0.182 | 0.138 | 0.352 | ||||||
| p-value | 0.180 | 0.320 | 0.009 | ||||||
| Factors † | Factors | N | Dead | CSS 1 Year * | CSS 2 Years * | CSS Mean CI 95% ** | p-Value |
|---|---|---|---|---|---|---|---|
| BUBR1 extent | 0–49% | 22 | 8 | 50.7 | 50.7 | 31.55 ± 7.02 (17.79–45.31) | 0.002 |
| 50–100% | 28 | 25 | 17.9 | 8.9 | 5.32 ± 1.45 (2.49–8.16) | ||
| BUBR1 intensity | Negative/weak/moderate | 22 | 12 | 32 | 32 | 20.9 ± 6.152 (8.850–32.97) | 0.422 |
| Strong | 28 | 20 | 29.2 | 15.6 | 9.001 ± 2.525 (4.06–13.96) | ||
| BUBR1 location | Cytoplasm | 26 | 15 | 41.8 | 33.4 | 22.35 ± 5.82 (10.94–33.77) | 0.213 |
| Cytoplasm + nucleus | 24 | 18 | 18.6 | 0.00 | 4.79 ± 0.97 (2.89–6.68) | ||
| BUBR1 distribution | Homogeneous | 12 | 9 | 27.9 | 00.0 | 7.24 ± 2.09 (3.139–11.34) | 0.972 |
| Periphery | 34 | 22 | 29.6 | 29.6 | 18.87 ± 4.66 (9.37–28.02) | ||
| Multifocal | 4 | 2 | 37.5 | 37.5 | 5.82 ± 3.37 (0–12.43) | ||
| Ki-67 extent | 0–49% | 35 | 19 | 38.5 | 38.5 | 24.00 ± 5.08 (14.05–33.95) | 0.06 |
| 50–100% | 14 | 13 | 15.5 | 0.00 | 4.81 ± 1.55 (1.77–7.84) | ||
| Ki-67 intensity | Negative/weak/moderate | 29 | 18 | 31.3 | 23.5 | 16.53 ± 52.78 (6.19–26.88) | 0.707 |
| Strong | 20 | 14 | 32.1 | 24.1 | 11.47 ± 3.135 (5.32–17.61) | ||
| Ki-67 distribution | Homogeneous | 4 | 3 | 0.00 | 0.00 | 1.13 ± 0.27 (0.60–1.67) | 0.08 |
| Periphery | 36 | 23 | 32.6 | 26.1 | 18.35 ± 4.63 (9.27–27.43) | ||
| Multifocal | 9 | 6 | 40.0 | 20.0 | 6.62 ± 1.87 (2.95–10.29) | ||
| BUB3 extent | Low (0–74%) | 16 | 13 | 13.9 | 13.9 | 6.432 ± 2.02 (2.47–10.40) | 0.800 |
| High (75–100%) | 33 | 20 | 38.2 | 21.8 | 16.67 ± 5.30 (6.28–27.07) | ||
| BUB3 intensity | Negative/weak/moderate | 31 | 19 | 30.7 | 30.7 | 19.61 ± 5.08 (9.64–29.58) | 0.546 |
| Strong | 18 | 14 | 26.5 | 9.9 | 7.27 ± 2.06 (3.23–11.32) | ||
| BUB3 distribution | Homogeneous | 44 | 29 | 31.2 | 22.2 | 16.31 ± 4.04 (8.37–24.24) | 0.181 |
| Periphery | 5 | 4 | 0.00 | 0.00 | 1.81 ± 0.52 (0.78–2.83) | ||
| BUB3 location | Cytoplasm + nucleus | 5 | 4 | 20.0 | 21.0 | 4.28 ± 2.36 (0.00–8.90) | 0.567 |
| Nucleus | 44 | 29 | 30.0 | 21.0 | 15.65 ± 4.01 (7.79–23.51) | ||
| SPINDLY extent | 0–49% | 23 | 16 | 22.0 | 22.0 | 14.52 ± 5.37 (4.00–25.03) | 0.294 |
| 50–100% | 26 | 16 | 34.6 | 27.7 | 12.26 ± 3.02 (6.33–18.20) | ||
| SPINDLY intensity | Negative/weak/moderate | 43 | 26 | 30.5 | 30.5 | 19.77 ± 4.33 (11.28–28.25) | 0.060 |
| Strong | 6 | 6 | 0.00 | 0.00 | 3.57 ± 2.04 (0.00–7.57) | ||
| SPINDLY distribution | Homogeneous | 12 | 9 | 15.3 | 0.00 | 5.15 ± 1.42 (2.37–7.94) | 0.535 |
| Periphery/Multifocal | 37 | 23 | 32.2 | 32.2 | 20.33 ± 4.63 (11.25–29.41) |
| Overall Survival | |||
|---|---|---|---|
| Variables | HR (95% CI) | p-Value | |
| Histological type | Papillary | 1 (reference category) | |
| Conventional | 0.365 (0.026–5.117) | 0.454 | |
| Treatment | Surgery | 1 (reference category) | 0.021 |
| Chemotherapy | 2.326 (0.364–14.864) | 0.372 | |
| Palliative or support | 6.214 (1.433–26.943) | 0.015 | |
| BUBR1 extent | 0, 1, 2+ | 1 (reference category) | |
| 3+, 4+ | 5.462 (1.455–20.502) | 0.012 | |
| Tumor stage | I + II | 1 (reference category) | |
| III + IV | 3.71 (0.909–15.135) | 0.068 | |
| Pattern of invasion | I | 1 (reference category) | 0.200 |
| II | 4.199 (0.863–20.416) | 0.075 | |
| III | 5.910 (1.160–30.118) | 0.033 | |
| IV | 6.587 (0.612–70.950) | 0.120 | |
| Stage of invasion | I | - | - |
| II | 1 (reference category) | 0.067 | |
| III | 2.192 (0.772–6.225) | 0.141 | |
| IV | 15.686 (1.272–193.435) | 0.032 | |
Publisher’s Note: MDPI stays neutral with regard to jurisdictional claims in published maps and institutional affiliations. |
© 2022 by the authors. Licensee MDPI, Basel, Switzerland. This article is an open access article distributed under the terms and conditions of the Creative Commons Attribution (CC BY) license (https://creativecommons.org/licenses/by/4.0/).
Share and Cite
Delgado, L.; Monteiro, L.; Silva, P.; Bousbaa, H.; Garcez, F.; Silva, J.; Brilhante-Simões, P.; Pires, I.; Prada, J. BUBR1 as a Prognostic Biomarker in Canine Oral Squamous Cell Carcinoma. Animals 2022, 12, 3082. https://doi.org/10.3390/ani12223082
Delgado L, Monteiro L, Silva P, Bousbaa H, Garcez F, Silva J, Brilhante-Simões P, Pires I, Prada J. BUBR1 as a Prognostic Biomarker in Canine Oral Squamous Cell Carcinoma. Animals. 2022; 12(22):3082. https://doi.org/10.3390/ani12223082
Chicago/Turabian StyleDelgado, Leonor, Luís Monteiro, Patrícia Silva, Hassan Bousbaa, Fernanda Garcez, João Silva, Paula Brilhante-Simões, Isabel Pires, and Justina Prada. 2022. "BUBR1 as a Prognostic Biomarker in Canine Oral Squamous Cell Carcinoma" Animals 12, no. 22: 3082. https://doi.org/10.3390/ani12223082
APA StyleDelgado, L., Monteiro, L., Silva, P., Bousbaa, H., Garcez, F., Silva, J., Brilhante-Simões, P., Pires, I., & Prada, J. (2022). BUBR1 as a Prognostic Biomarker in Canine Oral Squamous Cell Carcinoma. Animals, 12(22), 3082. https://doi.org/10.3390/ani12223082