

Age and Post-Prandial Variations on Selected Metabolites in Dairy Calves Fed Different Liquid Diets
 , and
, and
Abstract
Simple Summary
Abstract
1. Introduction
2. Materials and Methods
2.1. Animal, Experimental Design, and Treatments
2.2. Facilities, Intake, and Body Measurements
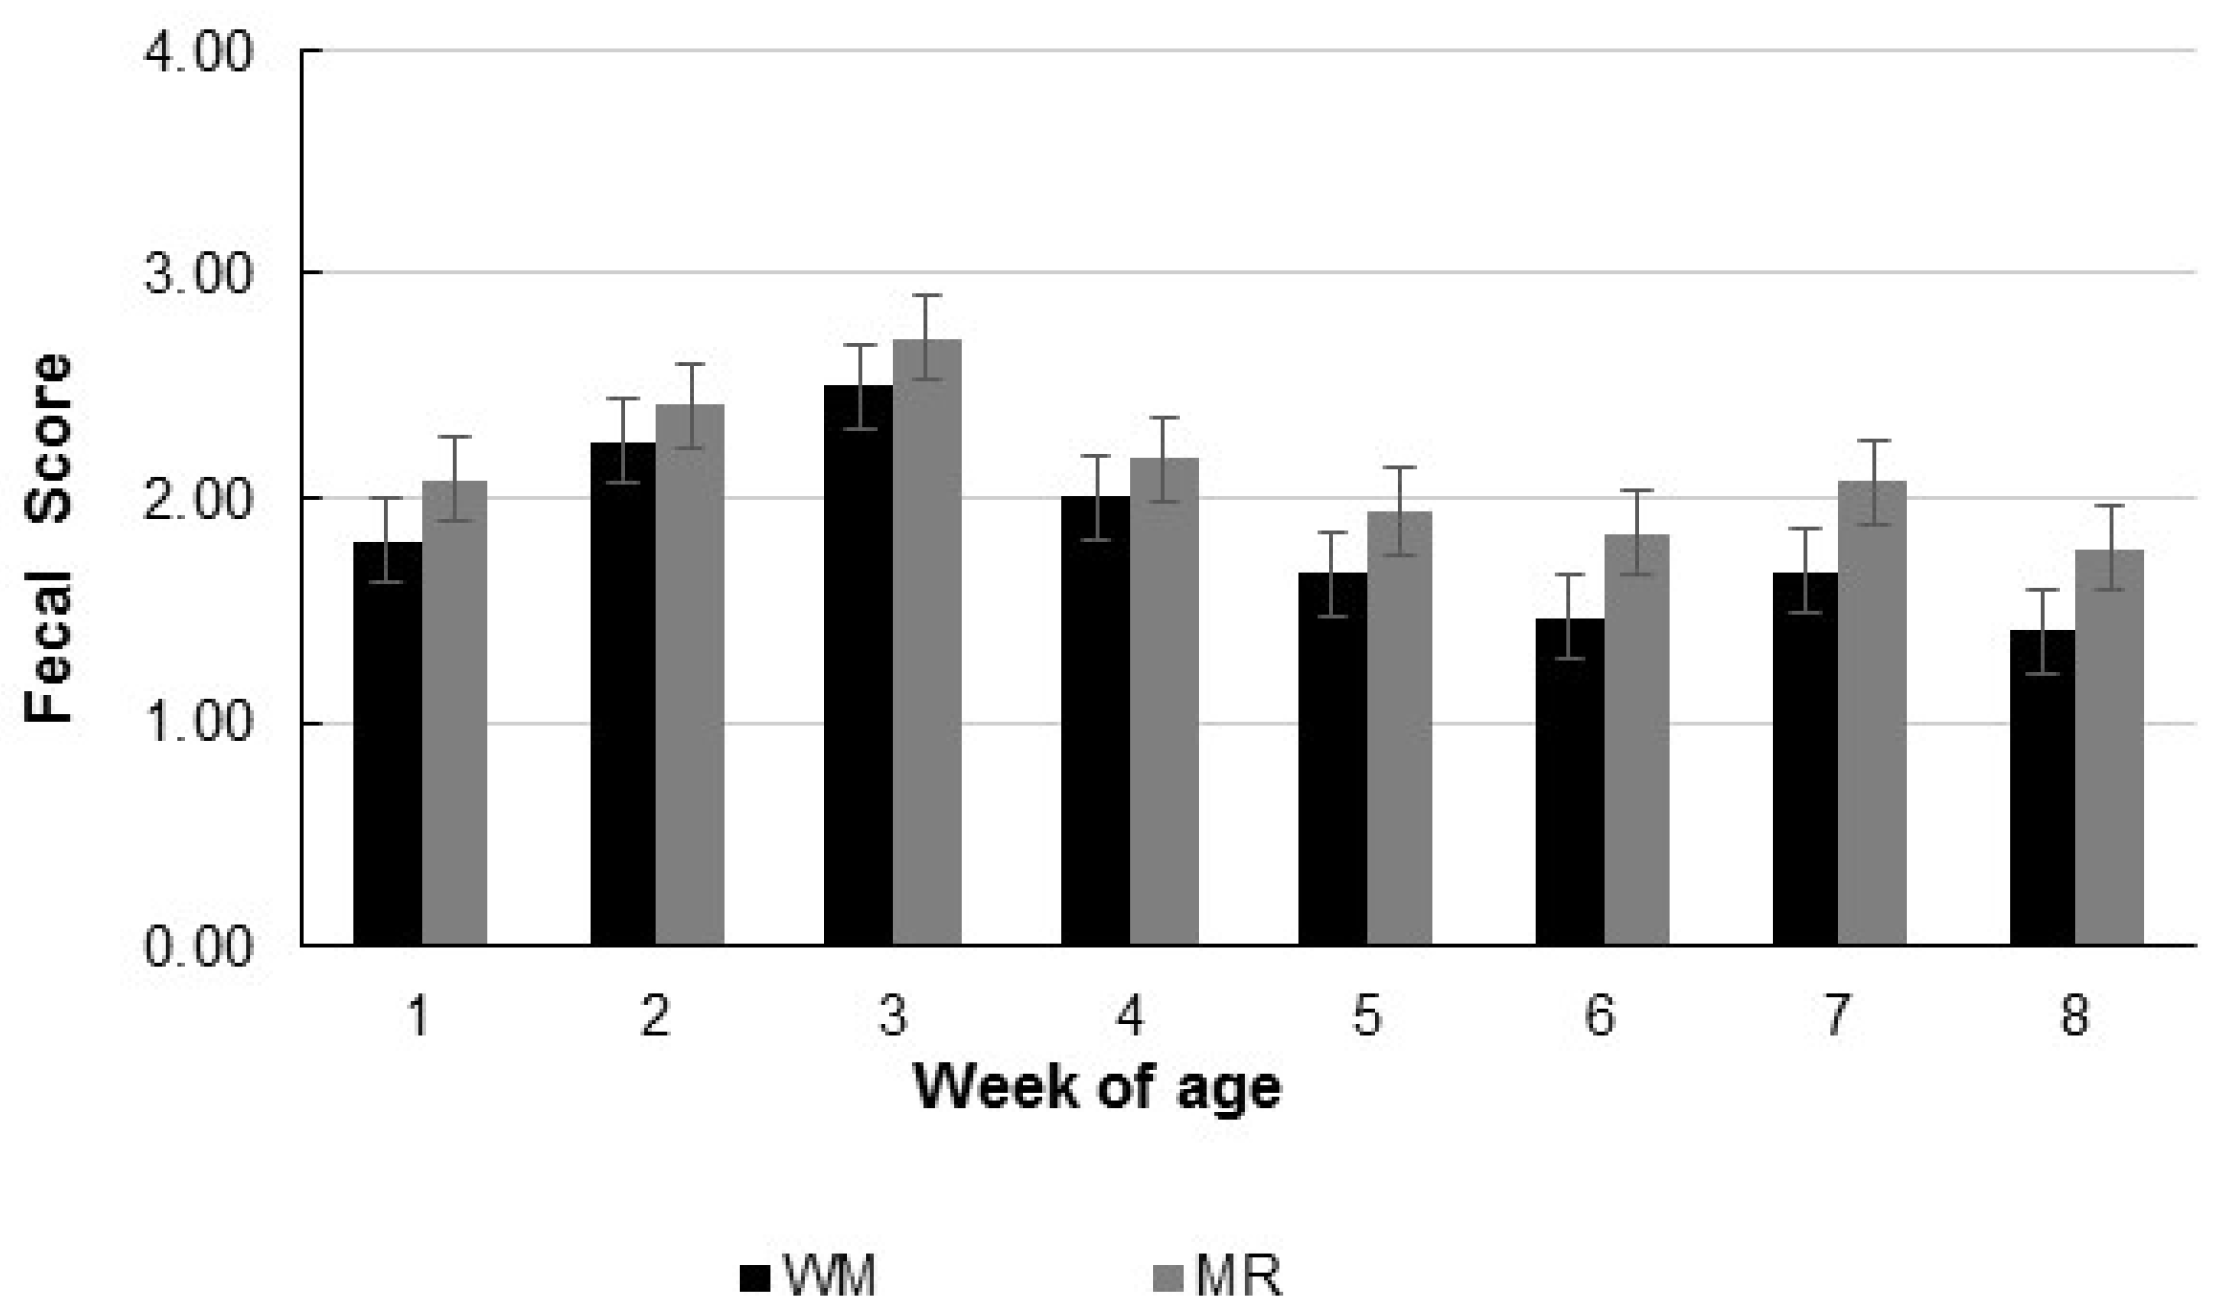
2.3. Fecal Score and Health
2.4. Sampling and Laboratory Analysis
2.5. Blood Parameters
2.6. Statistical Analyses
3. Results
4. Discussion
5. Conclusions
Author Contributions
Funding
Institutional Review Board Statement
Informed Consent Statement
Data Availability Statement
Acknowledgments
Conflicts of Interest
References
- Baldwin, R.L.L.; McLeod, K.R.R.; Klotz, J.L.L.; Heitmann, R.N.N. Rumen Development, Intestinal Growth and Hepatic Metabolism In The Pre- and Postweaning Ruminant. J. Dairy Sci. 2004, 87, E55–E65. [Google Scholar] [CrossRef]
- Khan, M.A.; Weary, D.M.; von Keyserlingk, M.A.G. Invited review: Effects of milk ration on solid feed intake, weaning, and performance in dairy heifers. J. Dairy Sci. 2011, 94, 1071–1081. [Google Scholar] [CrossRef] [PubMed]
- Nussio, C.M.B.; Santos, F.A.P.; Zopollatto, M.; Pires, A.V.; de Morais, J.B. Processamento de milho (floculado vs. laminado a vapor) e adição de monensina para bezerras leiteiras, pré e pós-desmama precoce. Rev. Bras. Zootec. 2003, 32, 229–239. [Google Scholar] [CrossRef][Green Version]
- Suarez-Mena, F.X.; Hu, W.; Dennis, T.S.; Hill, T.M.; Schlotterbeck, R.L. β-Hydroxybutyrate (BHB) and glucose concentrations in the blood of dairy calves as influenced by age, vaccination stress, weaning, and starter intake including evaluation of BHB and glucose markers of starter intake. J. Dairy Sci. 2017, 100, 2614–2624. [Google Scholar] [CrossRef] [PubMed]
- Govil, K.; Yadav, D.S.; Patil, A.K.; Nayak, S.; Baghel, R.P.S.; Yadav, P.K. Feeding management for early rumen development in calves. J. Entomol. Zool. Stud. 2017, 5, 1132–1139. [Google Scholar]
- Quigley, J.D.; Caldwell, L.A.; Sinks, G.D.; Heitmann, R.N. Changes in blood glucose, nonesterified fatty acids, and ketones in response to weaning and feed intake in young calves. J. Dairy Sci. 1991, 74, 250–257. [Google Scholar] [CrossRef]
- Deelen, S.M.; Leslie, K.E.; Steele, M.A.; Eckert, E.; Brown, H.E.; DeVries, T.J. Validation of a calf-side β-hydroxybutyrate test and its utility for estimation of starter intake in dairy calves around weaning. J. Dairy Sci. 2016, 99, 7624–7633. [Google Scholar] [CrossRef]
- Hasanabadi, M.; Mohri, M.; Seifi, H.A.; Heidarpour, M. Evaluation of the serum fructosamine concentrations in transition period and its relationship with serum proteins and energy characteristics in dairy cows. Comp. Clin. Path. 2019, 28, 725–730. [Google Scholar] [CrossRef]
- Senn, M.; Gross-Lüem, S.; Leuenberger, H.; Langhans, W. Meal patterns and meal-induced metabolic changes in calves fed milk ad lib. Physiol. Behav. 2000, 70, 189–195. [Google Scholar] [CrossRef]
- Megahed, A.A.; Hiew, M.W.H.; Constable, P.D. Clinical utility of plasma fructosamine concentration as a hypoglycemic biomarker during early lactation in dairy cattle. J. Vet. Intern. Med. 2018, 32, 846–852. [Google Scholar] [CrossRef]
- Nussio, C.M.B.; Huber, J.T.; Nussio, L.G. Decoquinate, lasalocid and monensin for starter feeds and the performance of Holstein calves to 20 weeks of age. Sci. Agric. 2002, 59, 421–426. [Google Scholar] [CrossRef]
- Ferreira, L.S.; Bittar, C.M.M. Performance and plasma metabolites of dairy calves fed starter containing sodium butyrate, calcium propionate or sodium monensin. Animal 2011, 5, 239–245. [Google Scholar] [CrossRef] [PubMed]
- Ferreira, L.S.; Bittar, C.M.M.; da Silva, J.T.; Soares, M.C.; Oltramari, C.E.; Nápoles, G.G.O.; de Paula, M.R. Desempenho e parâmetros sanguíneos de bezerros leiteiros que receberam sucedâneo lácteo ou silagem de colostro. Arq. Bras. Med. Veterinária E Zootec. 2013, 65, 1357–1366. [Google Scholar] [CrossRef][Green Version]
- da Santos, F.H.R.; De Paula, M.R.; Lezier, D.; da Silva, J.T.; dos Santos, G.; Bittar, C.M.M. Essential oils for dairy calves: Effects on performance, scours, rumen fermentation and intestinal fauna. Animal 2015, 9, 958–965. [Google Scholar] [CrossRef] [PubMed]
- Torrezan, T.M.; da Silva, J.T.; Miqueo, E.; Rocha, N.B.; Silva, F.L.M.; Baldassin, S.; Bittar, C.M.M.; da Silva, J.T. Desempenho de bezerros leiteiros recebendo probiótico contendo Bacillus subtilis e Bacillus licheniformis. Rev. Bras. Saúde e Produção Anim. 2016, 17, 508–519. [Google Scholar] [CrossRef]
- de Paula, M.R.; Oltramari, C.E.; da Silva, J.T.; Gallo, M.P.d.C.; Mourão, G.B.; Bittar, C.M.M. Intensive liquid feeding of dairy calves with a medium crude protein milk replacer: Effects on performance, rumen, and blood parameters. J. Dairy Sci. 2017, 100, 4448–4456. [Google Scholar] [CrossRef] [PubMed]
- Slanzon, G.S.; de Toledo, A.F.; da Silva, A.P.; Coelho, M.G.; da Silva, M.D.; Cezar, A.M.; Bittar, C.M.M. Red propolis as an additive for preweaned dairy calves: Effect on growth performance, health, and selected blood parameters. J. Dairy Sci. 2019, 102, 8952–8962. [Google Scholar] [CrossRef]
- Poczynek, M.; de Toledo, A.F.; da Silva, A.P.; Silva, M.D.; Oliveira, G.B.; Coelho, M.G.; Virgínio Júnior, G.F.; Polizel, D.M.; Costa, J.H.C.; Bittar, C.M.M. Partial corn replacement by soybean hull, or hay supplementation: Effects of increased NDF in diet on performance, metabolism and behavior of pre-weaned calves. Livest. Sci. 2020, 231, 103858. [Google Scholar] [CrossRef]
- da Silva, A.P.; de Toledo, A.F.; Cezar, A.M.; Coelho, M.G.; Virgínio Júnior, G.F.; Poczynek, M.; Silva, M.D.; Haines, D.M.; Campos, M.; Bittar, C.M.M. Passive transfer and neonatal health in dairy calves receiving maternal colostrum and/or a colostrum replacer. Livest. Sci. 2020, 240, 104158. [Google Scholar] [CrossRef]
- Coelho, M.G.; Silva, F.L.M.; Silva, M.D.; da Silva, A.P.; Cezar, A.M.; Slanzon, G.S.; Miqueo, E.; de Toledo, A.F.; Bittar, C.M.M.; De Toledo, A. Acidified milk for feeding dairy calves in tropical raising systems. J. Anim. Feed Sci. 2020, 29, 215–223. [Google Scholar] [CrossRef]
- Bittar, C.M.M.; da Silva, J.T.; Chester-Jones, H. Macronutrient and amino acids composition of milk replacers for dairy calves. Rev. Bras. Saúde e Produção Anim. 2018, 19, 47–57. [Google Scholar] [CrossRef]
- Jensen, A.L.; Petersen, M.B.; Houe, H. Determination of the fructosamine concentration in bovine serum samples. J. Vet. Med. Ser. A 1993, 40, 111–117. [Google Scholar] [CrossRef] [PubMed]
- Coppo, J.A. Evolution of fructosaminaemia and glucaemia during the growth of unweaned and early weaned half-bred zebu calves. Vet. Res. Commun. 2001, 25, 449–459. [Google Scholar] [CrossRef] [PubMed]
- Godden, S. Colostrum Management for Dairy Calves. Vet. Clin. N. Am. Food Anim. Pract. 2008, 24, 19–39. [Google Scholar] [CrossRef]
- Larson, L.L.; Owen, F.G.; Albright, J.L.; Appleman, R.D.; Lamb, R.C.; Muller, L.D. Guidelines toward more uniformity in measuring and reporting calf experimental data. J. Dairy Sci. 1977, 60, 989–991. [Google Scholar] [CrossRef]
- Van Soest, P.J.; Robertson, J.B.; Lewis, B.A. Methods for dietary fiber, neutral detergent fiber, and nonstarch polysaccharides in relation to animal nutrition. J. Dairy Sci. 1991, 74, 3583–3597. [Google Scholar] [CrossRef]
- Mertens, D.R. Creating a system for meeting the fiber requirements of dairy cows. J. Dairy Sci. 1997, 80, 1463–1481. [Google Scholar] [CrossRef]
- NASEM. Nutrient Requirements of Dairy Cattle; 8th revise; The National Academies Press: Washington, DC, USA, 2021. [Google Scholar]
- Blome, R.M.; Drackley, J.K.; McKeith, F.K.; Hutjens, M.F.; McCoy, G.C. Growth, nutrient utilization, and body composition of dairy calves fed milk replacers containing different amounts of protein1. J. Anim. Sci. 2003, 81, 1641–1655. [Google Scholar] [CrossRef]
- Hill, T.M.; Bateman, H.G.; Aldrich, J.M.; Schlotterbeck, R.L. Effect of milk replacer program on digestion of nutrients in dairy calves. J. Dairy Sci. 2010, 93, 1105–1115. [Google Scholar] [CrossRef]
- Hill, T.M.; Bateman, H.G.; Aldrich, J.M.; Schlotterbeck, R.L. Effect of consistency of nutrient intake from milk and milk replacer on dairy calf performance. Prof. Anim. Sci. 2009, 25, 85–92. [Google Scholar] [CrossRef]
- Badman, J.; Daly, K.; Kelly, J.; Moran, A.W.; Cameron, J.; Watson, I.; Newbold, J.; Shirazi-Beechey, S.P. The effect of milk replacer composition on the intestinal microbiota of pre-ruminant dairy calves. Front. Vet. Sci. 2019, 6, 371. [Google Scholar] [CrossRef] [PubMed]
- Virgínio Júnior, G.F.; Coelho, M.G.; de Toledo, A.F.; Montenegro, H.; Coutinho, L.L.; Bittar, C.M.M. The liquid diet composition affects the fecal bacterial community in pre-weaning dairy calves. Front. Anim. Sci. 2021, 2, 12. [Google Scholar] [CrossRef]
- Quigley, J.D.; Dennis, T.S.; Suarez-Mena, F.X.; Hill, T.M.; Aragona, K.M. Meta-analysis of effects of age on intestinal digestibility of liquid feeds in young calves. JDS Commun. 2021, 2, 114–117. [Google Scholar] [CrossRef]
- Quigley, J.D.; Bernard, J.K. Effects of nutrient source and time of feeding on changes in blood metabolites in young calves1. J. Anim. Sci. 1992, 70, 1543–1549. [Google Scholar] [CrossRef]
- Khan, M.A.; Bach, A.; Weary, D.M.; von Keyserlingk, M.A.G. Invited review: Transitioning from milk to solid feed in dairy heifers. J. Dairy Sci. 2016, 99, 885–902. [Google Scholar] [CrossRef]
- Haga, S.; Fujimoto, S.; Yonezawa, T.; Yoshioka, K.; Shingu, H.; Kobayashi, Y.; Takahashi, T.; Otani, Y.; Katoh, K.; Obara, Y. Changes in hepatic key enzymes of dairy calves in early weaning production systems. J. Dairy Sci. 2008, 91, 3156–3164. [Google Scholar] [CrossRef]
- Davis, C.L.; Drackley, J.K. The Development, Nutrition, and Management of the Young Calf, 1st ed.; Iowa State University Press: Ames, IA, USA, 1998; ISBN 0813829801. [Google Scholar]
- Cruywagen, C.W.; Brisson, G.J.; Tremblay, G.F.; Meissner, H.H. Effect of curd suppression in a milk replacer on physiological parameters in calves. I Digestibility of nutrients and body mass. S. Afr. Soc. Anim. Sci. 1990, 20, 234–238. [Google Scholar]
- Cruywagen, C.W.; Brisson, G.J.; Meissner, H.H. Casein curd-forming ability and abomasal retention of milk replacer components in young calves. J. Dairy Sci. 1990, 73, 1578–1585. [Google Scholar] [CrossRef]
- Armbruster, D.A. Fructosamine: Structure, analysis, and clinical usefulness. Clin. Chem. 1987, 33, 2153–2163. [Google Scholar] [CrossRef]
- Raju, S.; Rao, J.N. Jaypees Review of Medical Biochemistry; Jaypee Brothers Medical Publishers (P) Ltd.: New Delhi, India, 2005; ISBN 9788180615634. [Google Scholar]
- Willms, B.; Lehmann, P. A new fructosamine test—As a routine parameter in the control of diabetes. Wien. Klin. Wochenschr. Suppl. 1990, 180, 5–10. [Google Scholar]
- Caré, S.; Trevisi, E.; Minuti, A.; Ferrari, A.; Loor, J.J.; Calamari, L. Plasma fructosamine during the transition period and its relationship with energy metabolism and inflammation biomarkers in dairy cows. Livest. Sci. 2018, 216, 138–147. [Google Scholar] [CrossRef]


| KERRYPNX | Calf Starter 1 | Milk Replacer 2 |
|---|---|---|
| Dry Matter, % | 87.4 | 96.5 |
| Total Solids, % | - | 14 |
| Ash, %DM | 8.6 | 8.7 |
| Crude Protein, %DM | 25.4 | 22.9 |
| Ether Extract, %DM | 5.9 | 18.8 |
| NDF 3, %DM | 14.7 | 1.1 |
| NFC 4, %DM | 45.4 | 48.5 |
| Lactose, %DM | - | 44.0 |
| Item | Liquid Diet 1 | SEM 2 | p-Value 3 | |||
|---|---|---|---|---|---|---|
| WM | MR | T | A | T × A | ||
| Intake, g DM/d | ||||||
| Total | 1028 | 1065 | 50.53 | 0.60 | <0.001 | 0.49 |
| Liquid diet | 772.5 | 840.0 | 2.08 | <0.001 | 0.02 | 0.02 |
| Liquid diet lactose | 263.4 | 369.6 | 0.708 | <0.001 | 0.02 | 0.02 |
| Liquid diet protein | 213.9 | 184.8 | 0.57 | <0.001 | 0.02 | 0.02 |
| Solid diet | 255.6 | 225.2 | 37.53 | 0.574 | <0.001 | 0.76 |
| Average gain, g/d | 705.1 | 512.5 | 27.1 | <0.01 | 0.01 | 0.24 |
| Body weight, kg | ||||||
| Initial | 33.30 | 34.13 | 2.366 | 0.80 | - | - |
| Final | 72.79 | 62.29 | 2.786 | 0.02 | - | - |
| Body measurements gain, cm/week | ||||||
| Wither height | 1.87 | 1.47 | 0.098 | <0.01 | 0.73 | 0.57 |
| Hip width | 0.74 | 0.53 | 0.050 | 0.02 | 0.35 | 0.91 |
| Heart girth | 2.94 | 2.41 | 0.270 | 0.05 | 0.33 | 0.61 |
| Fecal score | 1.8 | 2.1 | 0.08 | 0.03 | <0.01 | 0.99 |
| Liquid Diet 1 | SEM 2 | p-Value 3 | ||||||
|---|---|---|---|---|---|---|---|---|
| WM | MR | T | A | H | T × A | T × H | ||
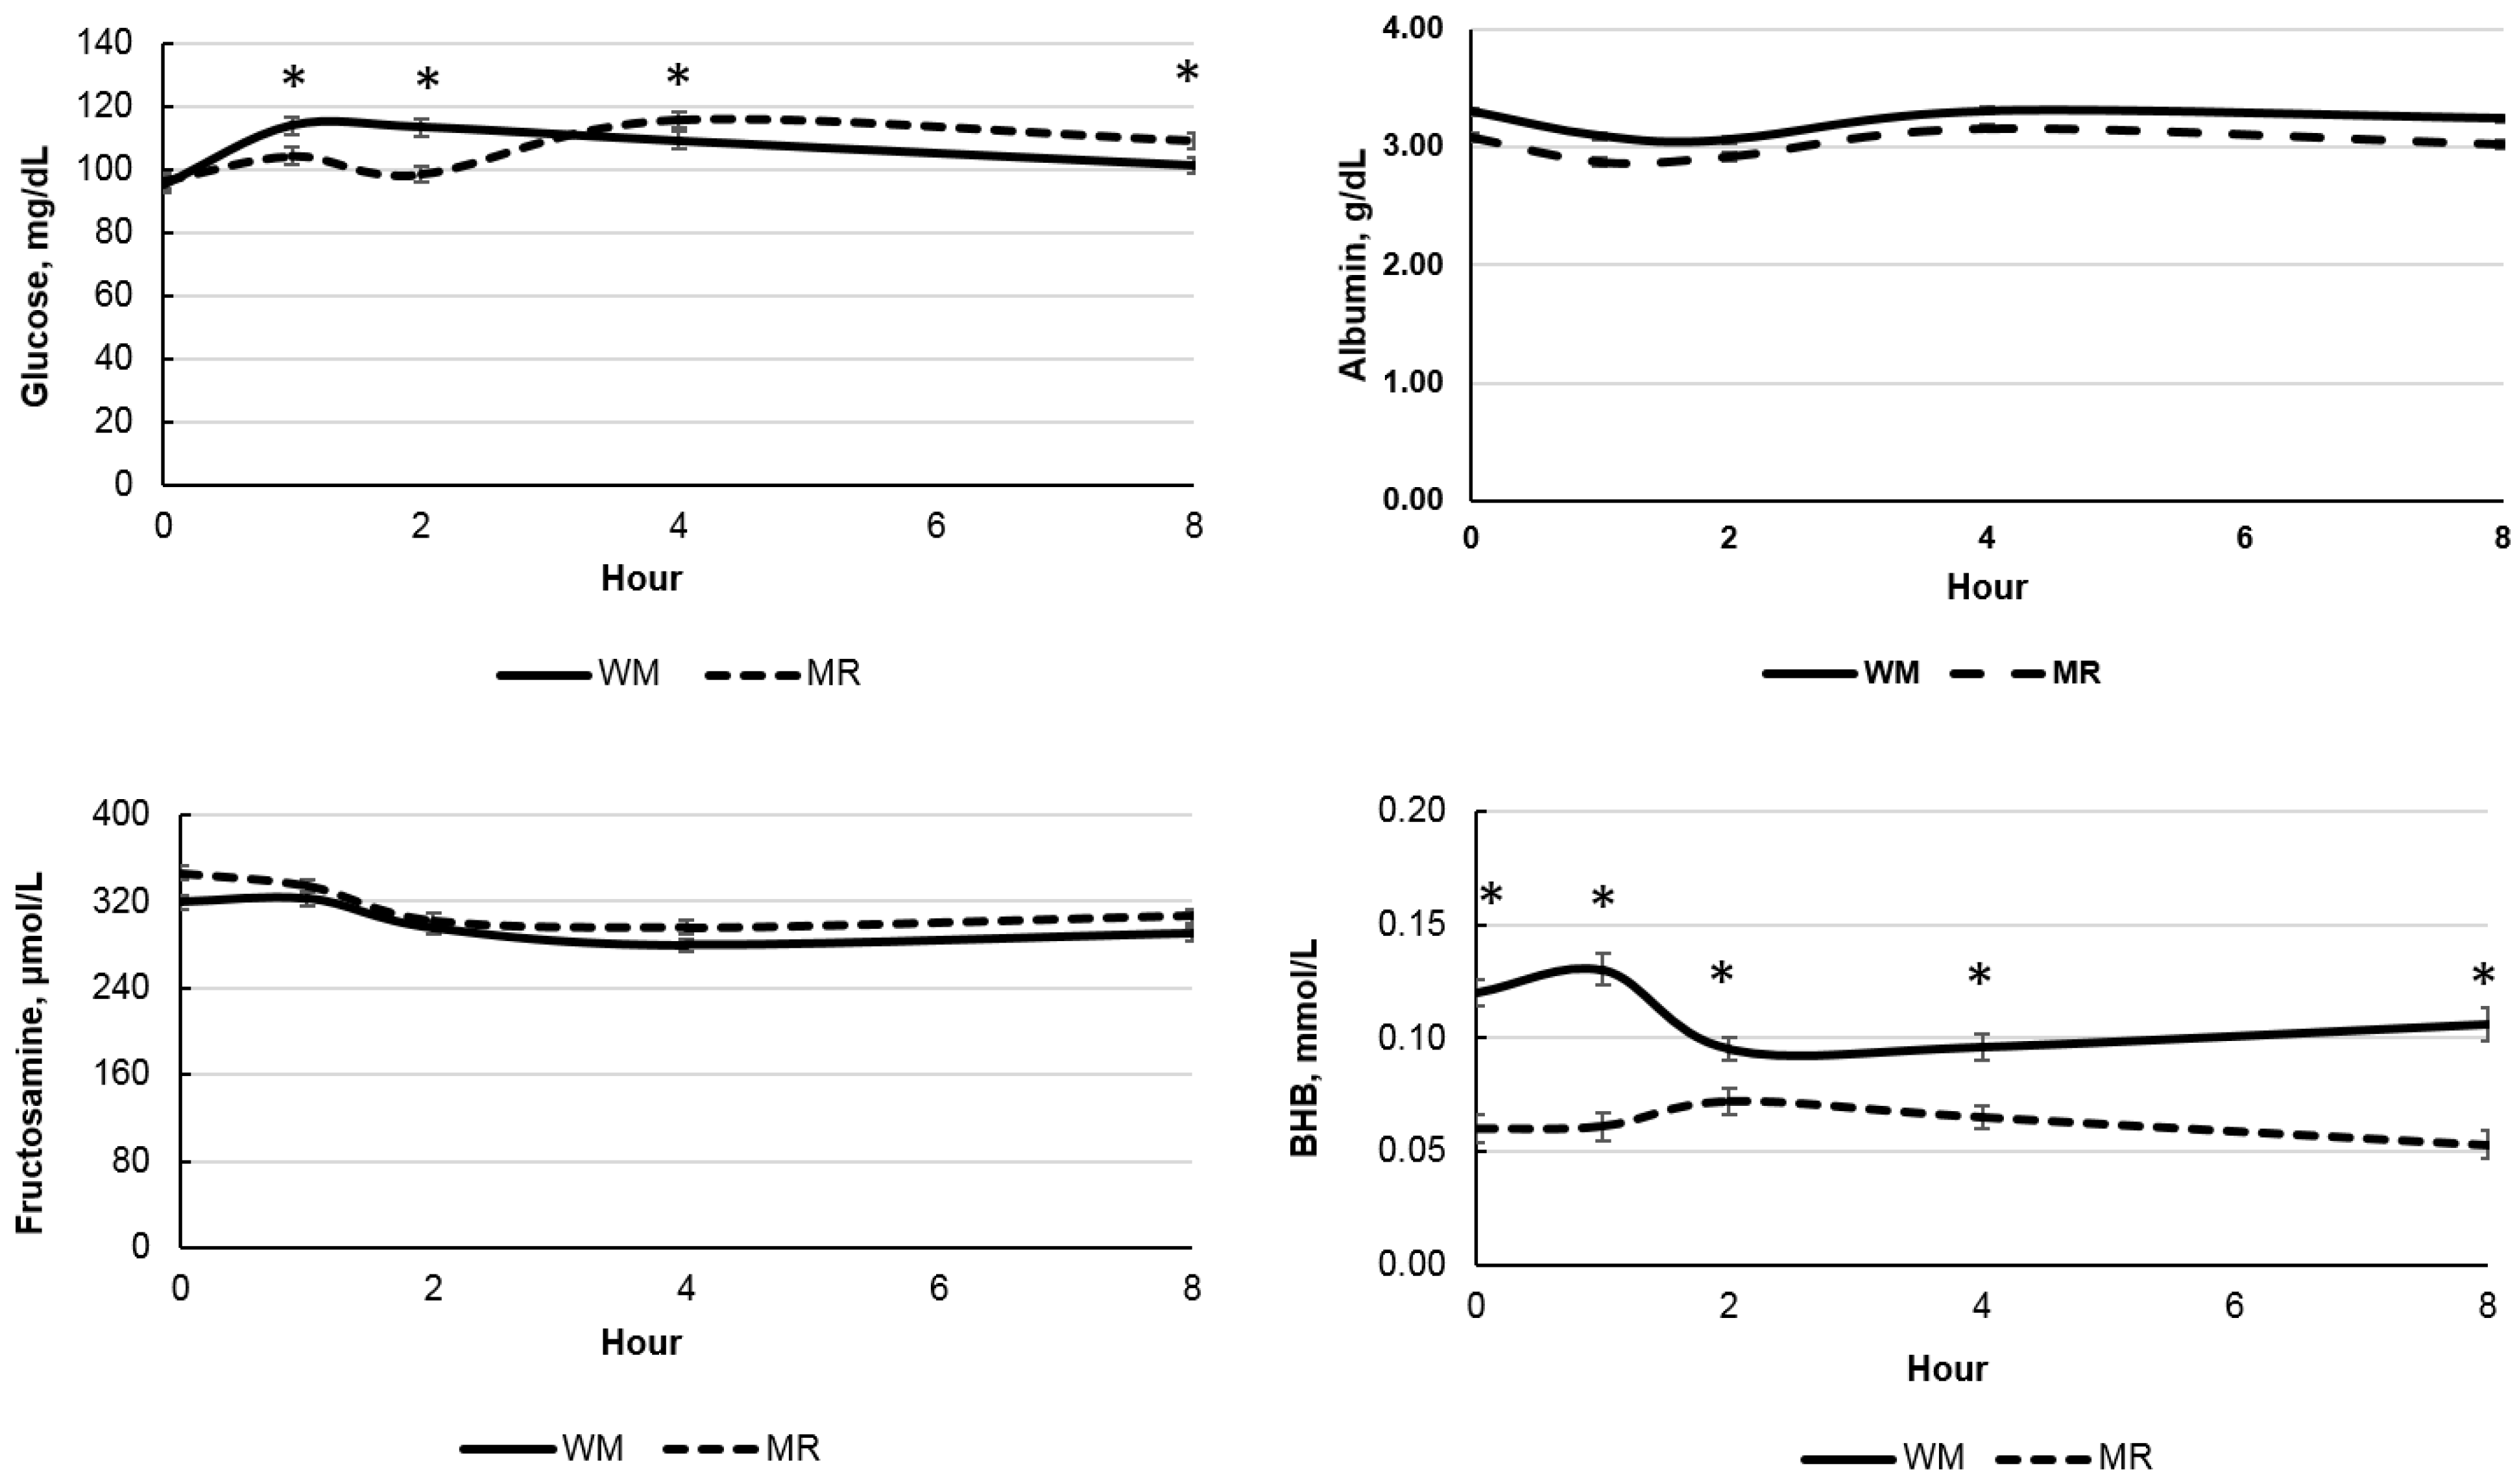
| Glucose, mg/dL | 106.56 | 104.68 | 2.08 | 0.36 | <0.01 | <0.01 | <0.01 | 0.01 |
| BHB, mmol/L | 0.110 | 0.062 | 0.005 | <0.01 | <0.01 | <0.01 | <0.01 | 0.01 |
| Fructosamine, μmol/L | 301.60 | 316.59 | 5.13 | 0.06 | <0.01 | <0.01 | 0.18 | 0.19 |
| Total protein, g/dL | 6.34 | 5.88 | 0.16 | 0.07 | <0.01 | <0.01 | 0.97 | 0.22 |
| Albumin, g/dL | 3.20 | 3.01 | 0.02 | <0.01 | <0.01 | <0.01 | <0.01 | 0.07 |
Publisher’s Note: MDPI stays neutral with regard to jurisdictional claims in published maps and institutional affiliations. |
© 2022 by the authors. Licensee MDPI, Basel, Switzerland. This article is an open access article distributed under the terms and conditions of the Creative Commons Attribution (CC BY) license (https://creativecommons.org/licenses/by/4.0/).
Share and Cite
Cezar, A.M.; Dondé, S.C.; Tomaluski, C.R.; da Silva, A.P.; Toledo, A.F.d.; Coelho, M.G.; Virgínio Júnior, G.F.; Bittar, C.M.M. Age and Post-Prandial Variations on Selected Metabolites in Dairy Calves Fed Different Liquid Diets. Animals 2022, 12, 3063. https://doi.org/10.3390/ani12213063
Cezar AM, Dondé SC, Tomaluski CR, da Silva AP, Toledo AFd, Coelho MG, Virgínio Júnior GF, Bittar CMM. Age and Post-Prandial Variations on Selected Metabolites in Dairy Calves Fed Different Liquid Diets. Animals. 2022; 12(21):3063. https://doi.org/10.3390/ani12213063
Chicago/Turabian StyleCezar, Amanda Moelemberg, Sophia Cattleya Dondé, Cristiane Regina Tomaluski, Ana Paula da Silva, Ariany Faria de Toledo, Marina Gavanski Coelho, Gercino Ferreira Virgínio Júnior, and Carla Maris Machado Bittar. 2022. "Age and Post-Prandial Variations on Selected Metabolites in Dairy Calves Fed Different Liquid Diets" Animals 12, no. 21: 3063. https://doi.org/10.3390/ani12213063
APA StyleCezar, A. M., Dondé, S. C., Tomaluski, C. R., da Silva, A. P., Toledo, A. F. d., Coelho, M. G., Virgínio Júnior, G. F., & Bittar, C. M. M. (2022). Age and Post-Prandial Variations on Selected Metabolites in Dairy Calves Fed Different Liquid Diets. Animals, 12(21), 3063. https://doi.org/10.3390/ani12213063