Article

The Influence of Environmental Variables on Home Range Size and Use in the Golden Snub-Nosed Monkey (Rhinopithecus roxellana) in Tangjiahe National Nature Reserve, China

1
Institute of Laboratory Animal Science, Guizhou University of Traditional Chinese Medicine, Guiyang 550025, China
2
Key Laboratory of Southwest China Wildlife Resources Conservation (Ministry of Education), Institute of Rare Animals and Plants, China West Normal University, Nanchong 637009, China
3
Guang’an Forestry Bureau, Guang’an 638500, China
4
Department of Wildlife Ecology and Conservation, University of Florida, P.O. Box 110430, Gainesville, FL 32611, USA
5
Tangjiahe National Nature Reserve, Qingchuan 628109, China
*
Author to whom correspondence should be addressed.
Animals 2022, 12(18), 2338; https://doi.org/10.3390/ani12182338
Submission received: 19 June 2022 / Revised: 24 August 2022 / Accepted: 7 September 2022 / Published: 8 September 2022
(This article belongs to the Section Ecology and Conservation)

Abstract

:

Simple Summary

The objectives of our study were to determine the seasonal home range size variation, and to determine the fraction of variation in home range use explained by environmental variables. We found that the core home range size of the golden snub-nosed monkey in Tangjiahe National Nature Reserve varied seasonally. The environmental variables in spring and summer explained a large part of home range use intensity, while the environmental variables in autumn and winter explained a moderate fraction and no fraction of home range use intensity, respectively. Water sources, tree density, and dominant trees of Chinese wingnut (Pterocarya stenoptera) were the important environmental factors determining home range use.

Abstract

Accurate descriptions of home ranges can provide important information for understanding animal ecology and behavior and contribute to the formulation of conservation strategies. We used the grid cell method and kernel density estimation (KDE) to estimate the home range size of golden snub-nosed monkeys (Rhinopithecus roxellana) in Tangjiahe National Nature Reserve. We also used Moran’s eigenvector maps analysis and variation partitioning to test the influence of environmental variables on home range use. The seasonal home range size was 15.4 km2 in spring, 11.6 km2 in summer, 13.7 km2 in autumn, and 15.6 km2 in winter, based on the grid cell method. The seasonal core area of 50% KDE was 9.86 km2 in spring, 5.58 km2 in summer, 7.20 km2 in autumn, and 4.23 km2 in winter. The environmental variables explained 63.60% of home range use intensity in spring, 72.21% in summer, 26.52% in autumn, and none in winter, and some environmental variables contributed to the spatial variation in home range use intensity. Water sources, tree density, and dominant trees of Chinese wingnut (Pterocarya stenoptera) were the important environmental factors determining home range use. These environmental factors require protection to ensure the survival of the golden snub-nosed monkey.

Graphical Abstract

1. Introduction

A home range is the total area used by an animal, and encompasses resources that affect an animal’s fitness, including food, potential mates, and safe sites [1,2]. An accurate description of home range is beneficial for the formulation of conservation strategies to protect endangered animals. Some important factors influencing home range size in mammals include season [3,4], food availability [4,5,6,7,8], latitude [9], and human disturbance [10].
Seasons influence home range variation in many primates. Japanese monkeys (Macaca fuscata fuscata) have different home range sizes across the four seasons [3]. The home range size of blue-eyed black lemur (Eulemur flavifrons) varied significantly between dry and wet seasons [11]. Lion-tailed macaques (Macaca silenus) have the largest home range size in summer compared with the other seasons [12].
Food availability is an important environmental variable in ecological studies in birds [13], reptiles [14], and mammals [15,16]. Studies suggested that food availability plays a key role in determining home range size in many primates [17,18,19]. Home ranges are smaller where resources are abundant than where they are limited. Northern pig-tailed macaques (Macaca leonina) tend to increase their home range when food is scarce, while they decrease their home range when consuming human food [17]. Japanese monkeys shrink and change their home range size from separate winter and summer ranges to a single, year-round range when supplemental feeding is heavy [20]. The Yunnan snub-nosed monkey (Rhinopithecus bieti) has a small home range when fruits, which comprise a major part of the diet, are plentiful and a large home range size when food is scarce [21]. Patchy, high-quality food resources also increase the distance traveled per day in some primates, such as muriquis (Brachyteles arachnoides) [22], Yunnan snub-nosed monkeys [23], and Taï chimpanzees (Pan troglodytes verus) [24], resulting in a relatively large home range. Primates may travel less on cold days to reduce energy loss when food is scarce [23], and a short travel distance usually means a small home range size [25], resulting in a small home range [2]. Aside from the influence of food resources, hot days are associated with a relatively small home range size for some primates, such as the white-faced capuchin (Cebus capucinus) [26,27].
Latitude is another factor contributing to home range size variation [9]. Latitude may act as a surrogate variable for food resource. Higher plant food abundance is observed at lower latitude sites than in higher latitude sites in the northern hemisphere [28], which may lead to a small home range size at low latitudes. For example, in one study, rhesus monkeys (Macaca mulatta) at a lower latitude site had a much smaller home range size compared to that of a group at a higher latitude site [29,30].
Anthropogenic activities affect the home range size in some primates. For example, studies showed that the home range size of indri (Indri indri) decreased when habitat disturbance increased in Betampona Nature Reserve [31]. Dian’s tarsiers (Tarsius dianae) enlarge their home range where anthropogenic effects are increasing [32]. Consequently, studies on animals without anthropogenic disturbance are able to give an accurate description of home range size.
Animals do not use their home ranges evenly. They use some habitat patches more frequently than others. Some environmental variables are important determinants of home range use. For example, water sources influence home range use by primates such as tufted capuchin monkeys (Cebus paella nigritus) [33] and red-fronted lemurs (Eulemur fulvus rufus) [34]. The forest canopy also influences home range use; for example, samango monkeys (Cercopithecus mitis erythrarchus) select habitats with higher canopy density to reduce the risk of predation [35].
The golden snub-nosed monkey (Rhinopithecus roxellana) is a semiarboreal, temperate forest-dwelling species endemic to China [36]. The distribution regions for the species include Jiuzhaigou, Songpan, Heishui, Pingwu, Qingchuan, Beichuan, Maoxian, Wenchuan, Lixian, Anzhou, Mianzhu, Dayi, Shifang, Doujiangyan, Pengzhou, Chongzhou, Tianquan, Lushan, Baoxing, and Kangding in Sichuan; Wenxian, Zhouqu, and Wudou in Gansu; Foping, Yangxian, Zhouzhi, Taibai, Ningshan in Shaanxi; and Shenlongjia, Fangxian, Xingshan, and Badong in Hubei (Figure 1) [37,38,39,40]. Three subspecies inhabit three isolated regions: the Moupin golden snub-nosed monkey (R. roxellana roxellana) in Sichuan and Gansu; the Hubei golden snub-nosed monkey (R. roxellana hubeiensis) in Hubei; and the Qinling golden snub-nosed monkey (R. roxellana qinlingensis) in the Qinling mountains, southern Shaanxi [38]. It is an Endangered species [36] that has been prioritized for protection by the Chinese government and is listed in CITES Appendix I (https://cites.org/eng/app/appendices.php (accessed on 6 September 2022)) due to threats of habitat destruction and hunting. It has a seasonal and diverse diet and subsists on over 100 plant species and a variety of plant parts, including buds, young leaves, fruits, flowers, and bark [4,41,42,43,44,45].
Golden snub-nosed monkeys have a larger home range than that of other colobines [46], such as langurs (Presbytis spp.) (usually <5 km2) [47] and guerezas (Colobus guereza) (<10 km2) [48], in part because of the large group size but also due to the wide variation in food resources foraged throughout the year [45]. Golden snub-nosed monkeys usually travel much shorter distances for food during seasons when their food resources are abundant than in seasons when food resources are scarce [4], leading to a small home range size [25]. The home range size of the species also varies among groups in different locations [49]. A group of nearly 200 individuals in Baihe Nature Reserve had a home range of 51.42 km2 [50]. A group estimated to be made up of 100–120 individuals in Qingmuchuan Nature Reserve occupies a home range of 20.35 km2 [44]. A group of >112 individuals in Zhouzhi Nature Reserve has a home range size estimated to be 18.3 km2 [51]. Seasonal home range size variation was also observed in golden snub-nosed monkey at a relatively high latitude at the north slope of Qinling mountains, and the group has the largest home range size in spring, the smallest in winter, and moderate in autumn and summer [4].
Many environmental variables influence home range use in golden snub-nosed monkeys, including distance to a water source, the height of large trees, canopy density, and type of forest, while the diameter at breast height (DBH) of large trees also affects habitat use [52,53]. Golden snub-nosed monkeys usually select habitat <300 m from a water source, with large trees with a height of 10–29 m and diameter of 16–30 cm, with a canopy density of 30–80%, and in deciduous broadleaf forest or coniferous–broadleaf mixed forest [52,53]. Moreover, our preliminary observations in Tangjiahe National Nature Reserve, Sichuan, China, suggested that the habitat selected by golden snub-nosed monkeys also included primary forest, large trees, dead trees, fallen logs, tree stumps, and small shrubs. However, the contribution of environmental variables influencing the home range use intensity of golden snub-nosed monkeys is unknown.
We studied the home range size and use in a group of Moupin golden snub-nosed monkeys in Tangjiahe National Nature Reserve, Sichuan, China. Our objectives were: (i) to determine whether the home range size varied with seasonal food resource variation; and (ii) to determine the fraction of variation in home range use explained by environmental variables (water source, large trees, canopy density, type of forest, dead trees, fallen logs, tree stumps, and shrubs) in the habitat selected by golden snub-nosed monkeys.

2. Materials and Methods
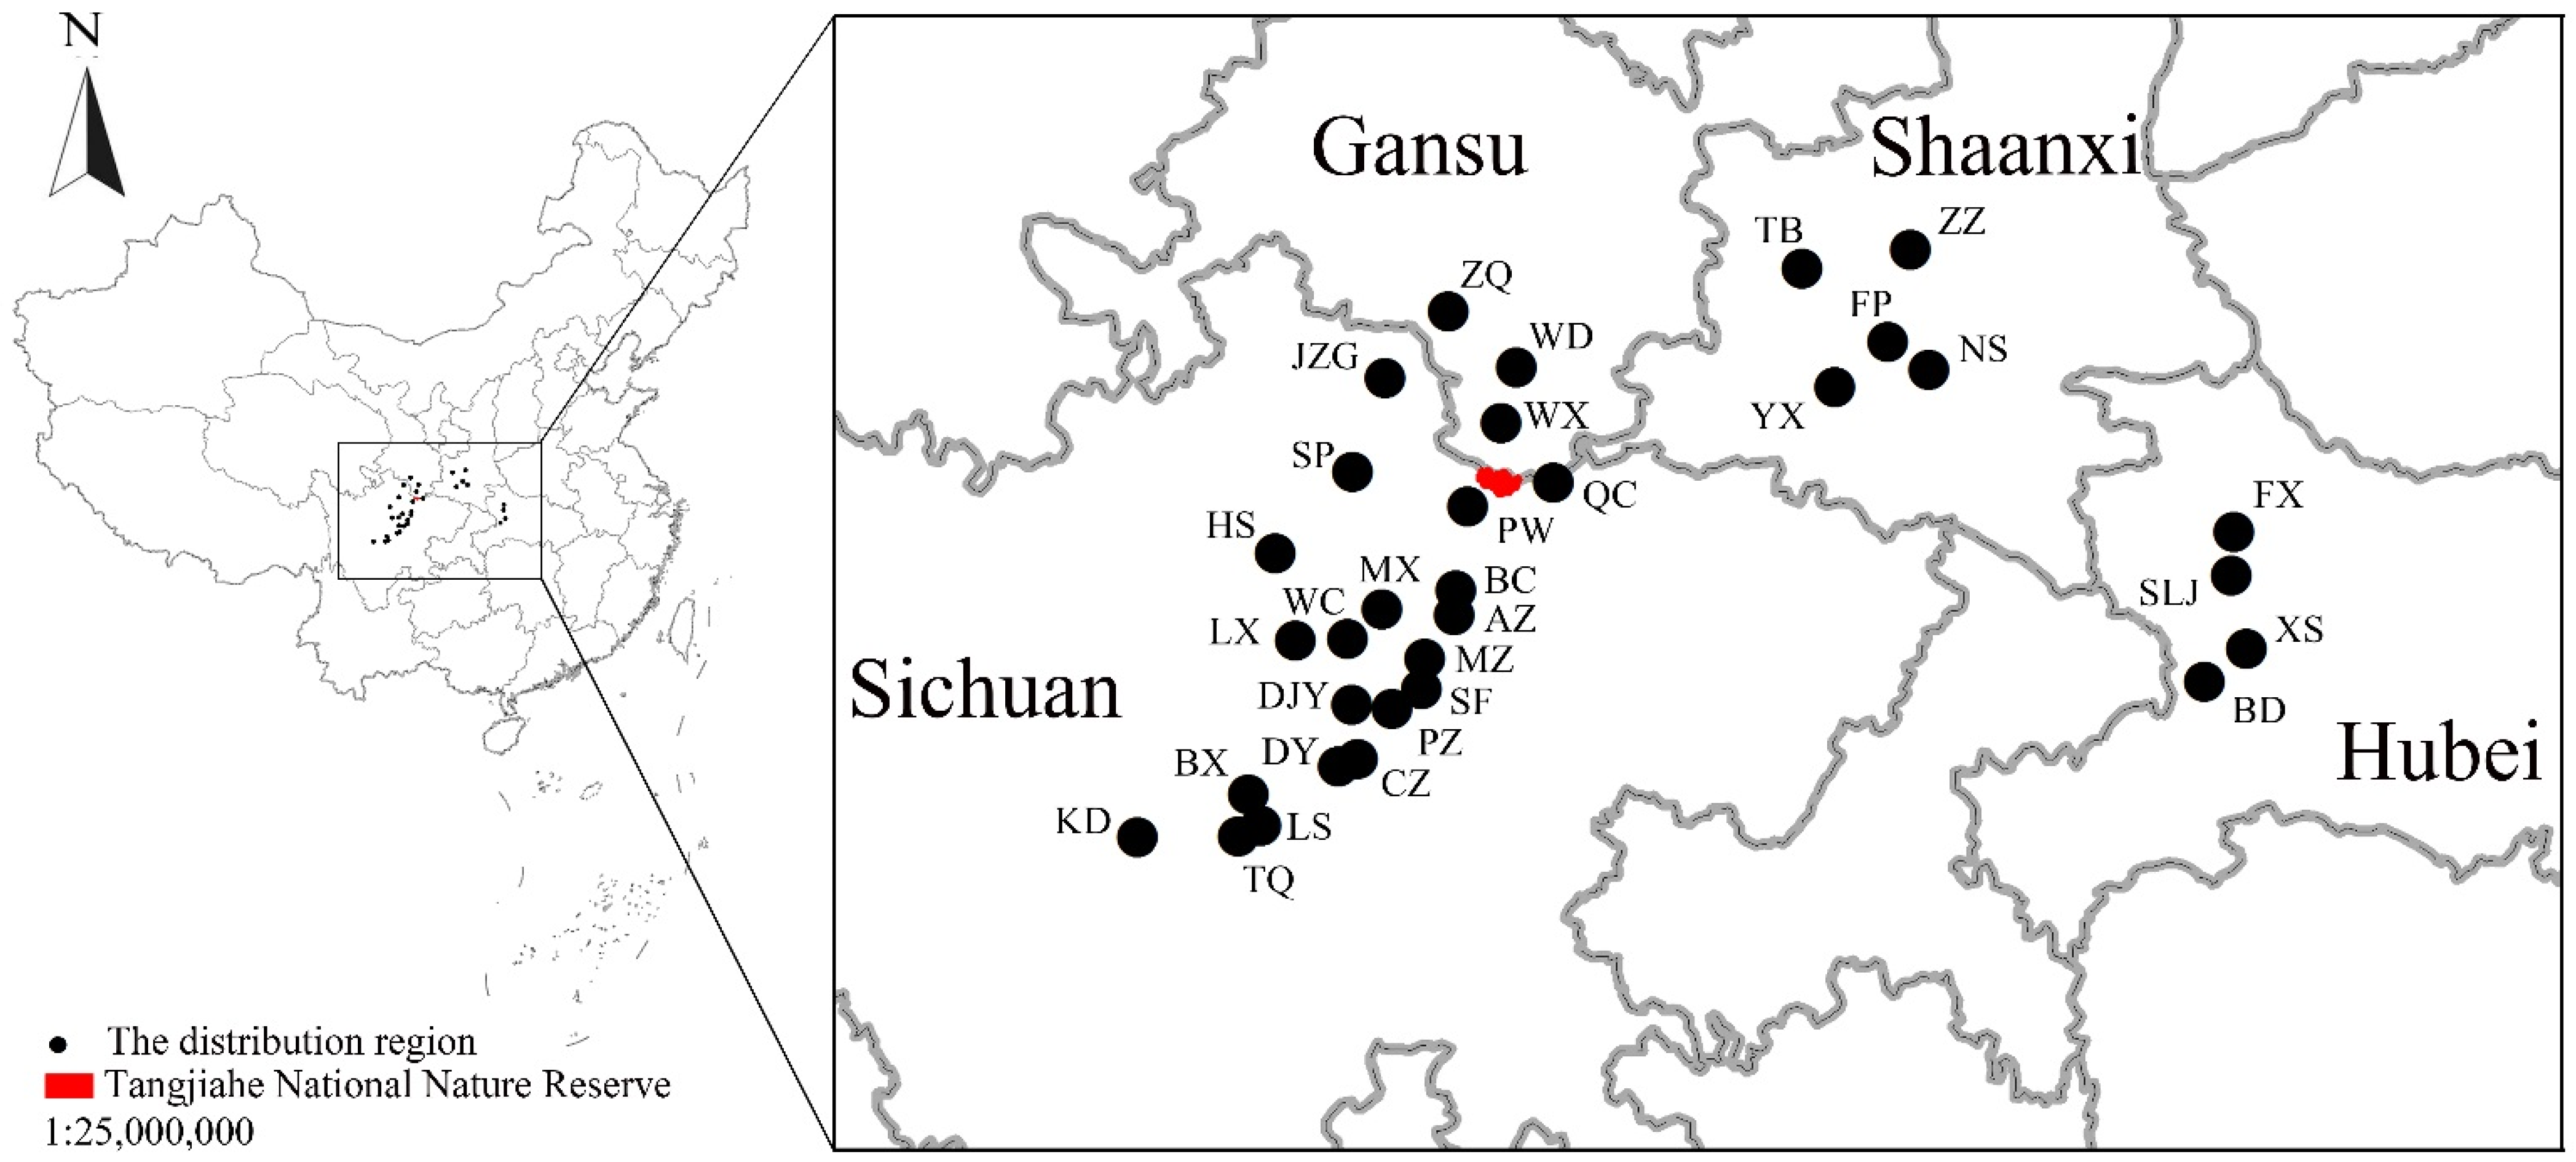
2.1. Study Area

Tangjiahe National Nature Reserve is in Qingchuan, Guangyuan, Sichuan, China (104°37′–104°53′ E, 32°32′–32°41′ N) (Figure 1). The local geography consists of alpine valleys making up the transition zone between the Qinghai–Tibet Plateau and the Sichuan Basin. Tangjiahe is approximately 400 km2 in area [54,55] and is adjacent to Baishuijiang National Nature Reserve in Gansu Province to the north and Dongyanggou Nature Reserve in Sichuan Province to the east [56]. The elevation in the reserve ranges 1150–3864 m. Tangjiahe supports evergreen broadleaf forest (elevation: <1600 m), evergreen and deciduous broadleaf mixed forest (elevation: 1600–2000 m), broadleaf–conifer mixed forest (elevation: 2000–2300 m), coniferous forest (elevation: 2300–2500 m) and meadow (elevation >2500 m) [54,55]. The mean annual rainfall ranges 1100–1300 mm [57]. We classified the seasons in the alpine area based on the alpine daily mean temperature, with spring defined by months of April to May, summer by months of June to August, autumn by months of September to October, and winter by months of November to March of the next year [58,59].

2.2. Sampling Design

Approximately 14 groups of golden snub-nosed monkeys live in the Tangjiahe National Nature Reserve [60]. Group sizes ranged from 20 to 100 individuals in 2011, and the total number of individuals was 640 [60]. Our previous studies suggested that the largest group increased to 138 individuals in 2014 and inhabited the core area of Tangjiahe National Nature Reserve, with no human disturbance, unlike other groups [58]. We studied this group, which comprised 16 adult males, 48 adult females, 11 subadult females, 3 subadult males, 36 juveniles, and 24 infants [58].
We conducted fieldwork from July 2015 to October 2016. We made preliminary observations of the study group to acclimatize them to our presence from July to October 2015 and observed them from November 2015 to October 2016. We followed the group from dawn to dusk on each sampling day (07:00–19:00) and observed the monkeys at 50–200 m, parallel to their movement [44]. We used a grid size of 200 m × 200 m to track the study group; this grid size is approximately the spread area of the study group [4]. We tracked the grid cells used by overlaying the 200 m × 200 m grid system on a topographic map (1:50,000) [51]. We recorded coordinates using a handheld global positioning system (GPS) receiver (Garmin, GPSMAP60CSX, Shanghai, China) every 30 min. We estimated the central location coordinates of the study group by the compass bearing and distance (detected by a compass and a telemeter) on the topographic map. In addition, we recorded and geolocated any fresh food residues or fresh feces left by the study group and included these sites in the home range; all the site information was ascertained by our actual observation through binoculars before arriving at the observation sites. We used these coordinates of the study group to analyze home range size.
We used ArcGIS 10.3 (ArcGIS Desktop: Release 10.3; Environmental Systems Research Institute: Redlands, CA, USA, https://desktop.arcgis.com/zh-cn/arcmap/10.3/main/get-started/whats-new-in-arcgis.htm (accessed on 6 September 2022)) [61] and Home Range Tools (HRT) version 2.0 [62] software to determine the monkeys’ home range. We imported all recorded location coordinate data into Home Range Tools in ArcGIS 10.3 to model the home range size. We used fixed kernel density estimations (KDE) to measure the home range use distribution [63,64]. We defined the home range size as 95% KDE isopleths and core areas of the home range size as 50% KDE isopleths (contour lines) [65].
We recorded the plant species eaten by the monkeys using instantaneous scan sampling from one side of the study group to the opposite side, at 15 min intervals [66]. We also collected fresh food remains on the ground to identify species. Simultaneously, we recorded the dominant tree species at the foraged place.
We established a set of sampling quadrats (20 m × 20 m) at the location of habitat patches used in the 200 m × 200 m grid cells. We also established control quadrats at the central location of the 200 m × 200 m grid cells, which the study group did not use. We recorded the following parameters for each quadrat: elevation, type of forest, primary forest or secondary forest, number of dead trees, number of fallen logs, number of tree stumps, distance to the nearest water source, tree height, canopy density, mean DBH of trees, tree density, dominant tree species, shrub height and shrub cover (Table 1). We used the sampling points method to measure canopy density [67]. We marked a set of sampling points at an interval of one meter along two vertical diagonal lines in the quadrat. We calculated canopy density using the number of shaded sampling points divided by the total number of sampling points. We used the Braun-Blanquet cover-abundance scale method to measure shrub cover [68].

2.3. Data Analysis

We marked group movements on the map and counted the number of times the group used each of the grid cells, considering any cells with a value of one or greater to be within the home range. We added grid cells that had zero values but that were between two locations where we recorded the study group and where there was no other way of passage between the two locations. We calculated annual and seasonal home range sizes by multiplying the number of grid cells by the area of each cell (40,000 m2).
We investigated the correlation between the dominant tree species and the foraged tree species to determine whether the foraged tree species were the dominant trees in the foraged habitat patches. The dominant tree species and the foraged tree species are two multistate qualitative descriptors. We binary-coded these two multistate qualitative descriptors as two sets of dummy variables [69] and placed them in two dummy matrices using the function model.matrix in R 3.5.0 software (R Core Team, Vienna, Austria. URL https://www.R-project.org/ (accessed on 6 September 2022)) [70]. We tested the correlation of the two dummy matrices to determine the correlation between the dominant tree species and the foraged tree species using a Mantel test with the mantel.rtest function in R (Monte Carlo test, n = 999) [70].
Variation partitioning analysis is used to apportion the variation in response variable sets among two or more explanatory variable sets that may include environmental variables, spatial variables, or temporal variables [69]. The fraction of variation in response variable sets explained by different explanatory variable sets is estimated by the adjusted coefficient of multiple determination (adjusted R2). The adjusted R2 that provides an unbiased estimate is used to estimate the fraction of variation by partial regression.
The multiscale analysis involves one group method of the spatial eigenfunction analysis. The spatial eigenfunction analysis method includes one special class of general Moran’s eigenvector maps (MEM) analysis that constructs the MEM model as explanatory data. MEM analysis can be combined with variation partitioning analysis to calculate the degree to which the response variable is explained by explanatory variable [69,71].
We constructed an MEM model and combined this with variation partitioning [71] to study the influence of the environmental variables on the frequency with which the study group used each grid cell, and we defined the frequency as home range use intensity. The quadrats established in the grid cells without use were also included in our analysis, and we recognized the frequency as zero. First, we transformed longitude and latitude coordinates into Cartesian coordinates. We defined the home range use intensity as the response variable. We constructed MEM models based on the central coordinates of the grid cells. Calculation of an MEM model includes a connectivity matrix B and an edge weighting matrix A. We used the method provided in previous studies to select the best model [72]. We constructed the connectivity matrix B based on inclusion circles of increasing radii around each point, and the edge weighting matrix A using the complement of the power of the distances, the concave-down function f2 [72]. Then, we constructed a spatial weighting matrix W by computing the Hadamard product of the matrix B and matrix A, and a truncated matrix Dtrunc by replacing the zero values in the matrix W by 4 times the threshold value. The threshold value is the length of the largest edge of a minimum spanning tree that is computed by a matrix D = [1 − sij] in which sij is the similarity coefficients in concave-down function f2 [69]. Finally, we obtained the best MEM model (including several MEM eigenfunctions) by computing the principal coordinates of matrix Dtrunc. The eigenvalues of MEM eigenfunctions were the MEM variables. We used the positive MEM variables as spatial predictors in later variation partitioning analysis. We observed seven positive MEM variables in spring, seven in summer, nine in autumn, and 19 in winter. In addition, we selected significant canonical axis produced by positive MEM variables, and we regressed the canonical axis on the environmental data collected in the set of sampling quadrats by multiple linear regression to assess whether environmental variables affect spatial variation.
We used variation partitioning to separate variation in the home range use intensity (response variables) among explanatory variables, the environmental data from the set of sampling quadrat, and the spatial predictors. We independently forward-selected the explanatory variables before variation partitioning to delete data with significant linear trends. We used permutation tests to test the significance of unique fractions of each explanatory variable alone.
In addition, we regressed the home range use intensity on the environmental data by multiple linear regression to determine which environmental parameters were significantly related to the home range use.
We performed all statistical analyses using R software [70].

3. Results

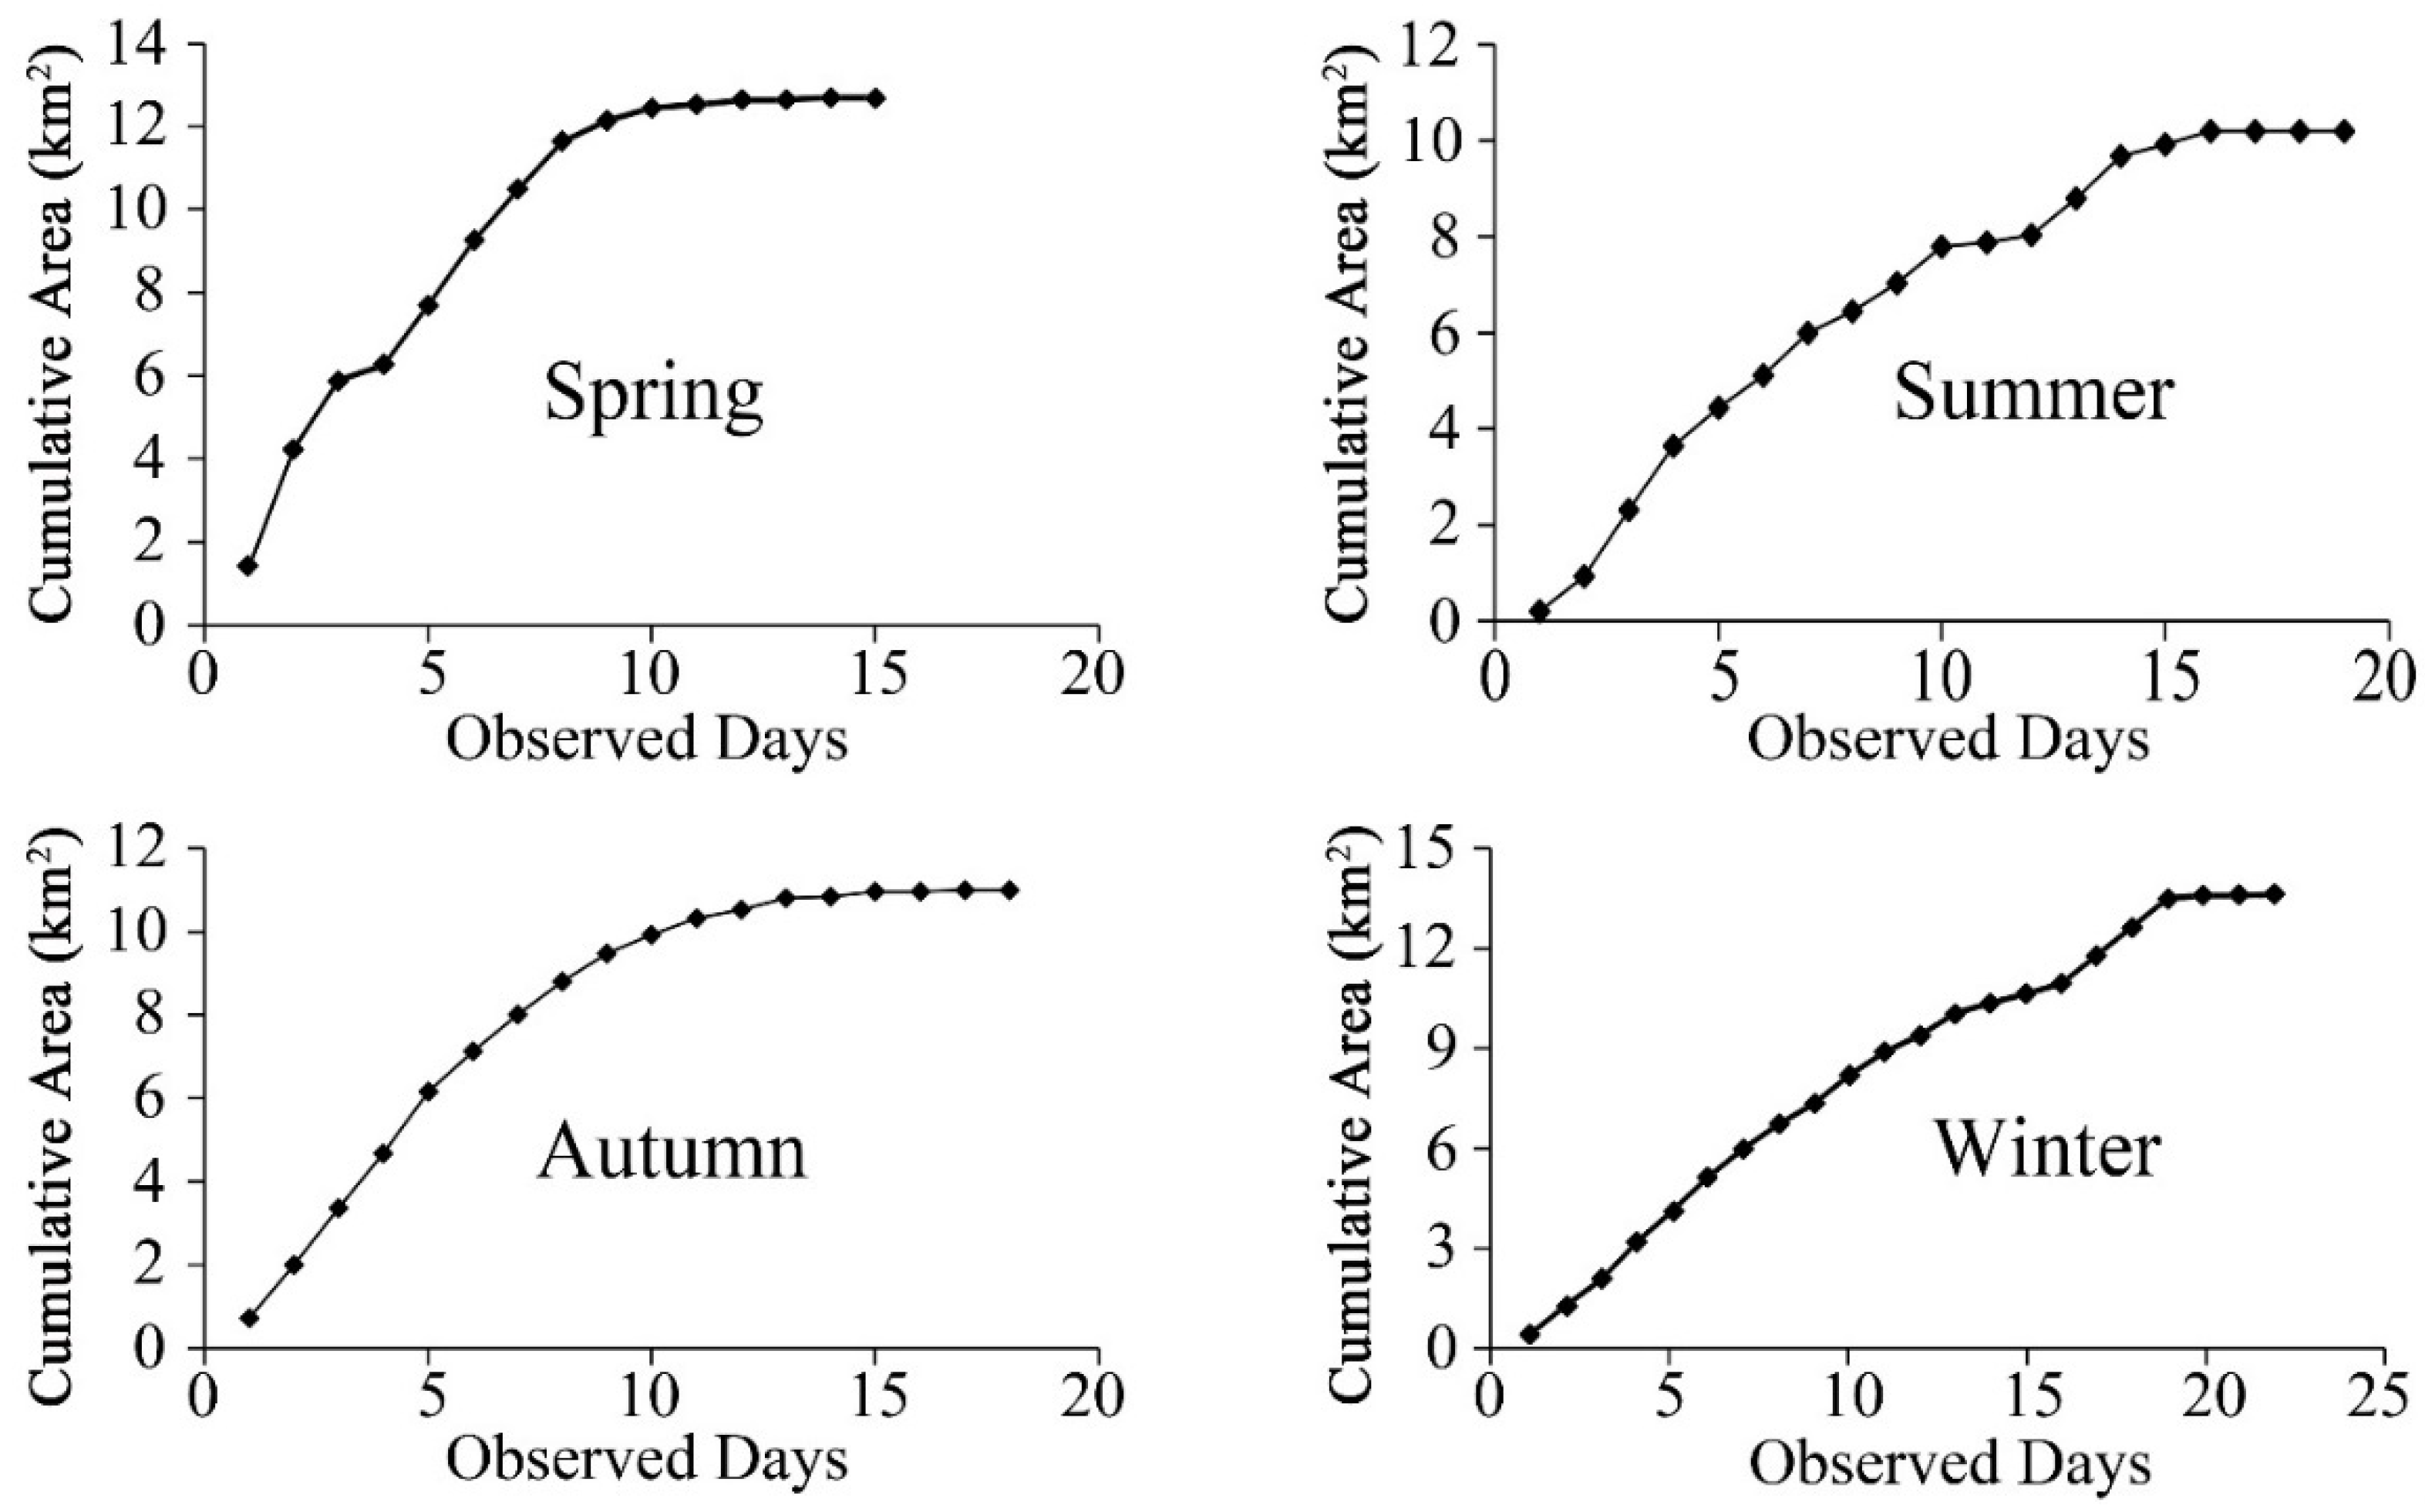
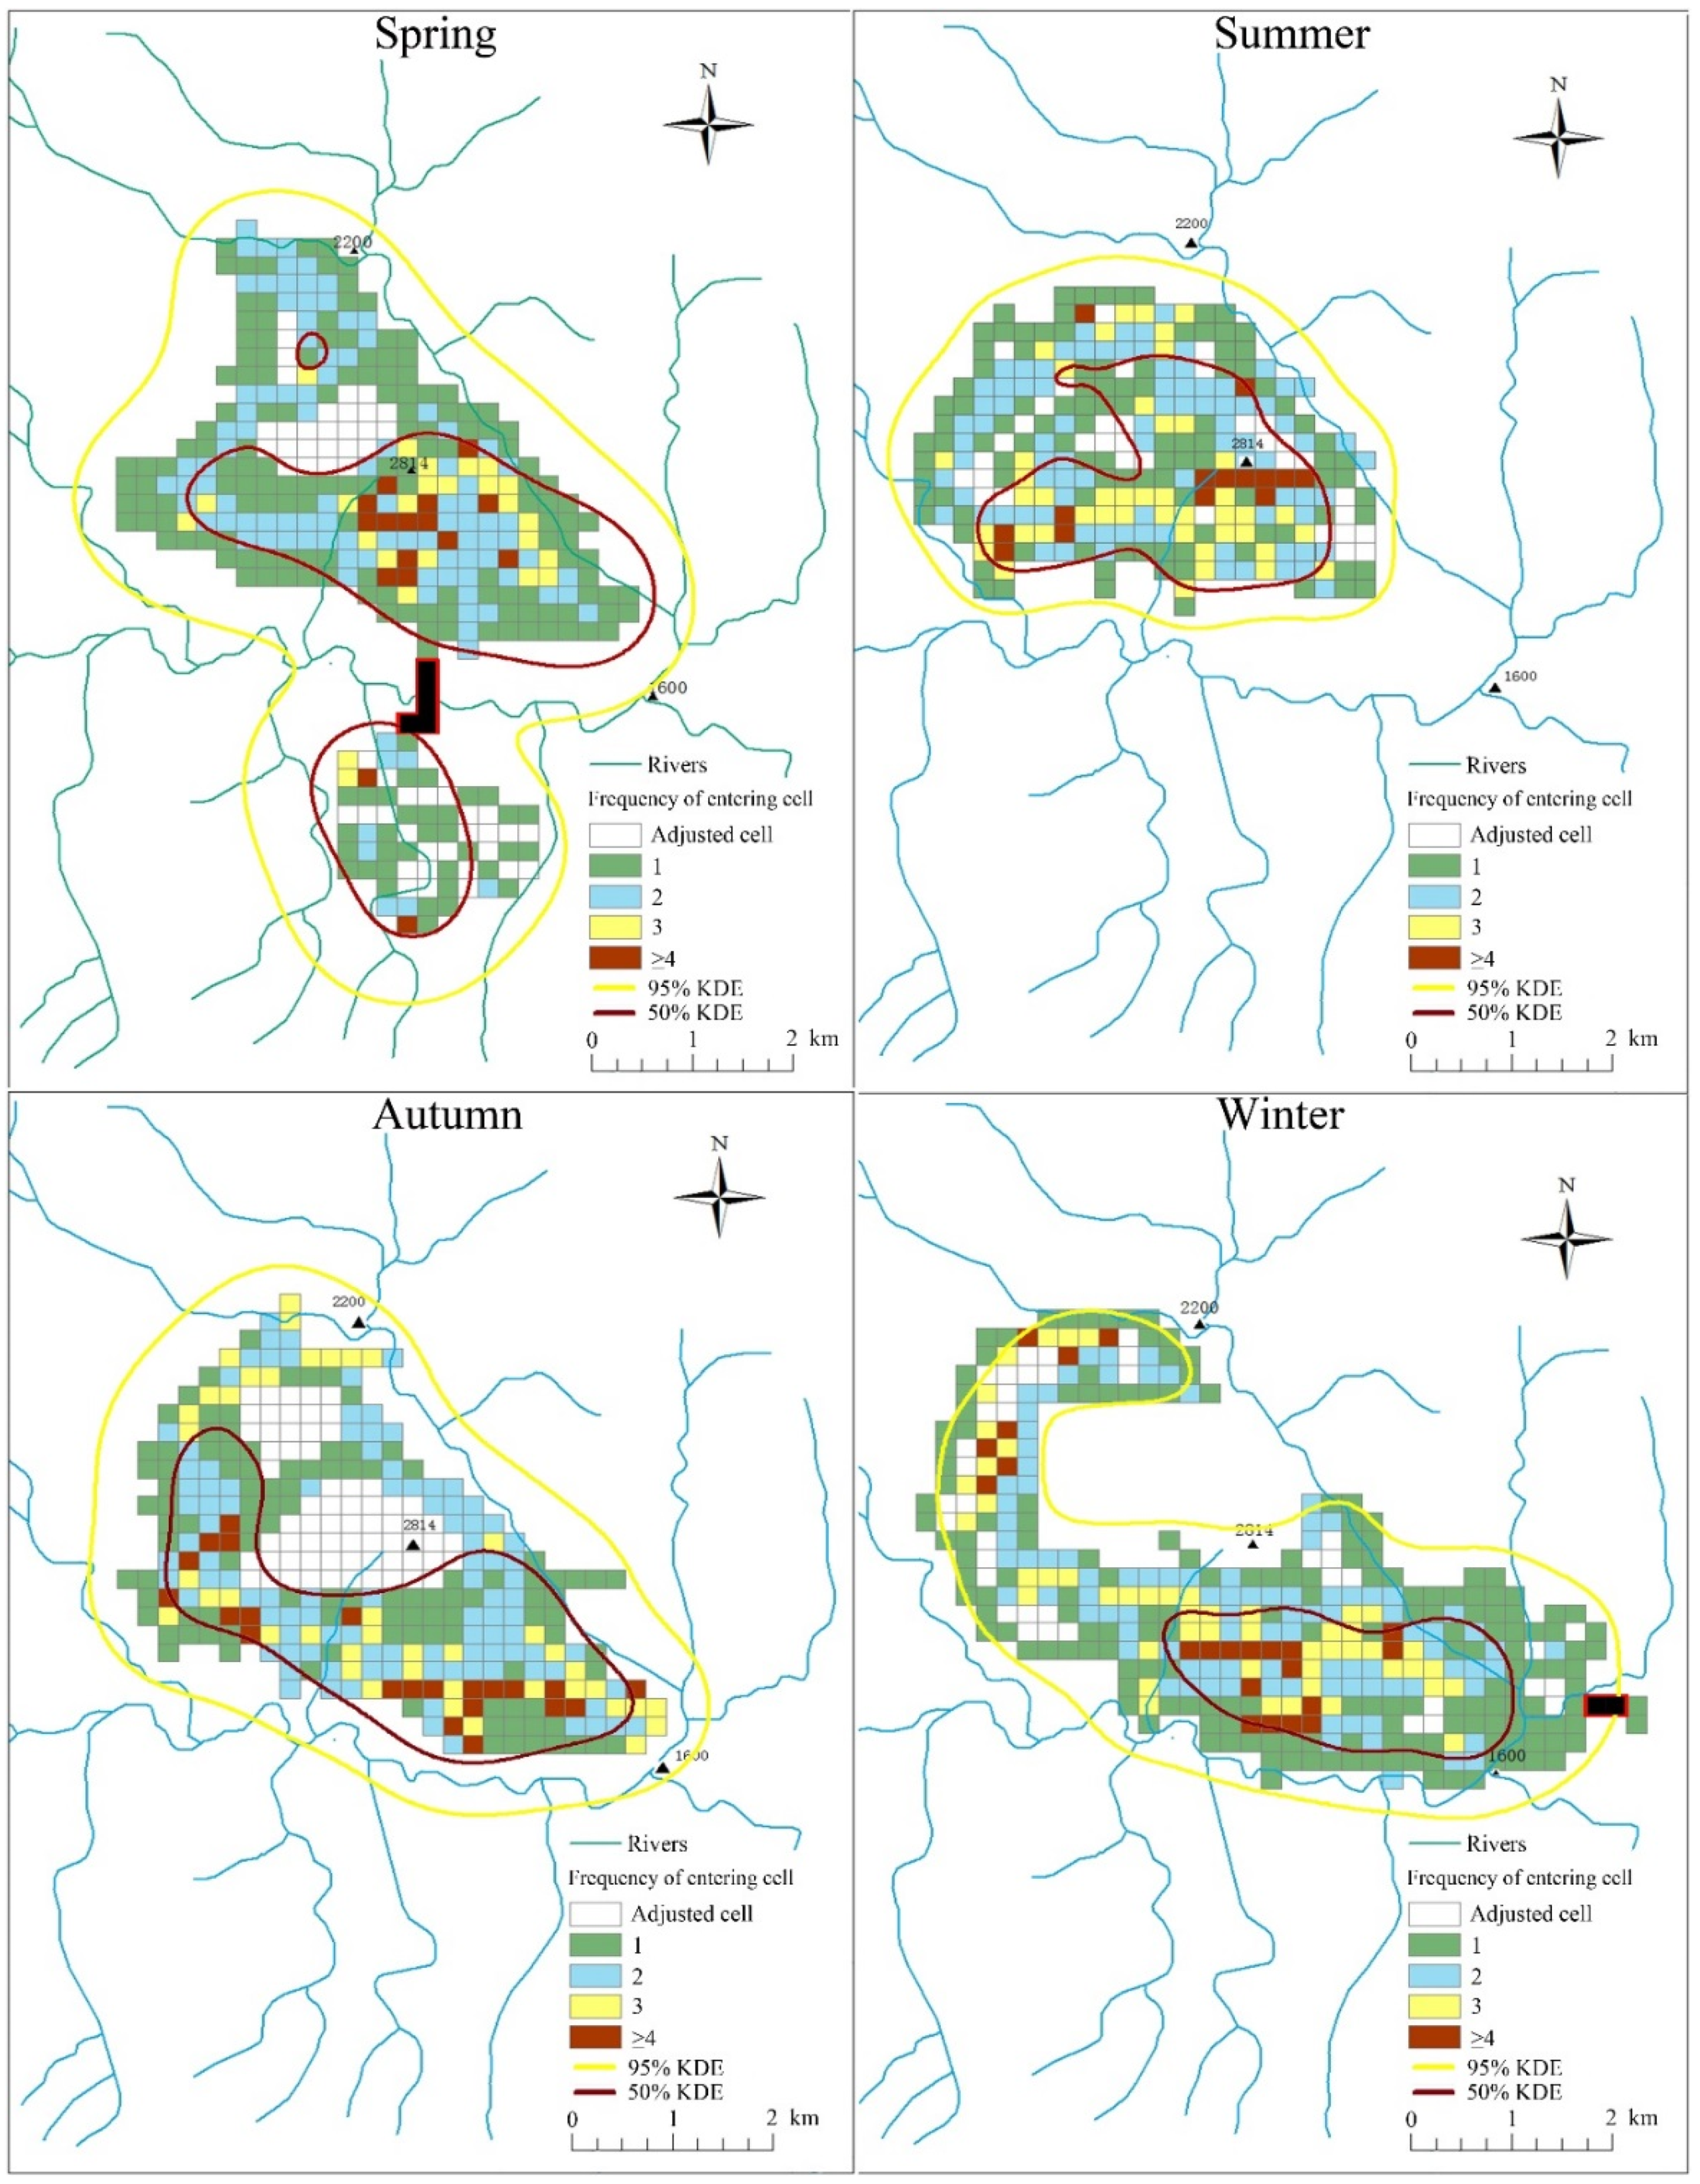
3.1. Seasonal Home Range Size Variation

Our tracking days were relatively even across seasons (spring: 15 days; summer: 19 days; autumn: 18 days; winter: 22 days; X2 = 1.35, p = 0.72, df = 3). The cumulative area barely increased in the last five days of observation in all seasons, and there was no significant difference in the accumulated area of the last five observation days in each season (spring: X2 = 0.00, p = 1.00, df = 4; summer: X2 = 0.00, p = 1.00, df = 4; autumn: X2 = 0.00, p = 1.00, df = 4; winter: X2 = 0.058, p = 1.00, df = 4) (Figure 2). These results collectively suggested that our fieldwork was sufficient to determine the home range in each season.
The golden snub-nosed monkey had a large annual home range (Figure 3). There was significant difference among different seasons in home range size based on 50% KDE isopleths (X2 = 10.16, p = 0.017, df = 3), but no significant difference based on grid systems (X2 = 1.20, p = 0.75, df = 3) (Table S1; Figure 4), or the 95% KDE home range (X2 = 6.64, p = 0.084, df = 3) (Table 2).

3.2. Food Species and Food Abundance

The food foraged by the golden snub-nosed monkey varied across the four seasons (Table S2). The study group mainly foraged on bark, buds, and some tender leaves in spring; some bark pieces, many bamboo shoots, tender leaves, and a small portion of fruits in summer; many fruits, some leaves and bark pieces in autumn; and many bark pieces and small buds in winter (Table 3).
The tree species eaten in each season were significantly and strongly positively correlated with the dominant tree species in the habitat patches in spring and winter (spring, r = 0.91, p < 0.001, n = 64; winter, r = 0.85, p < 0.001, n = 65), and significantly and moderately positively correlated in summer (r = 0.59, p < 0.001, n = 39) and autumn (r = 0.61, p < 0.001, n = 94).

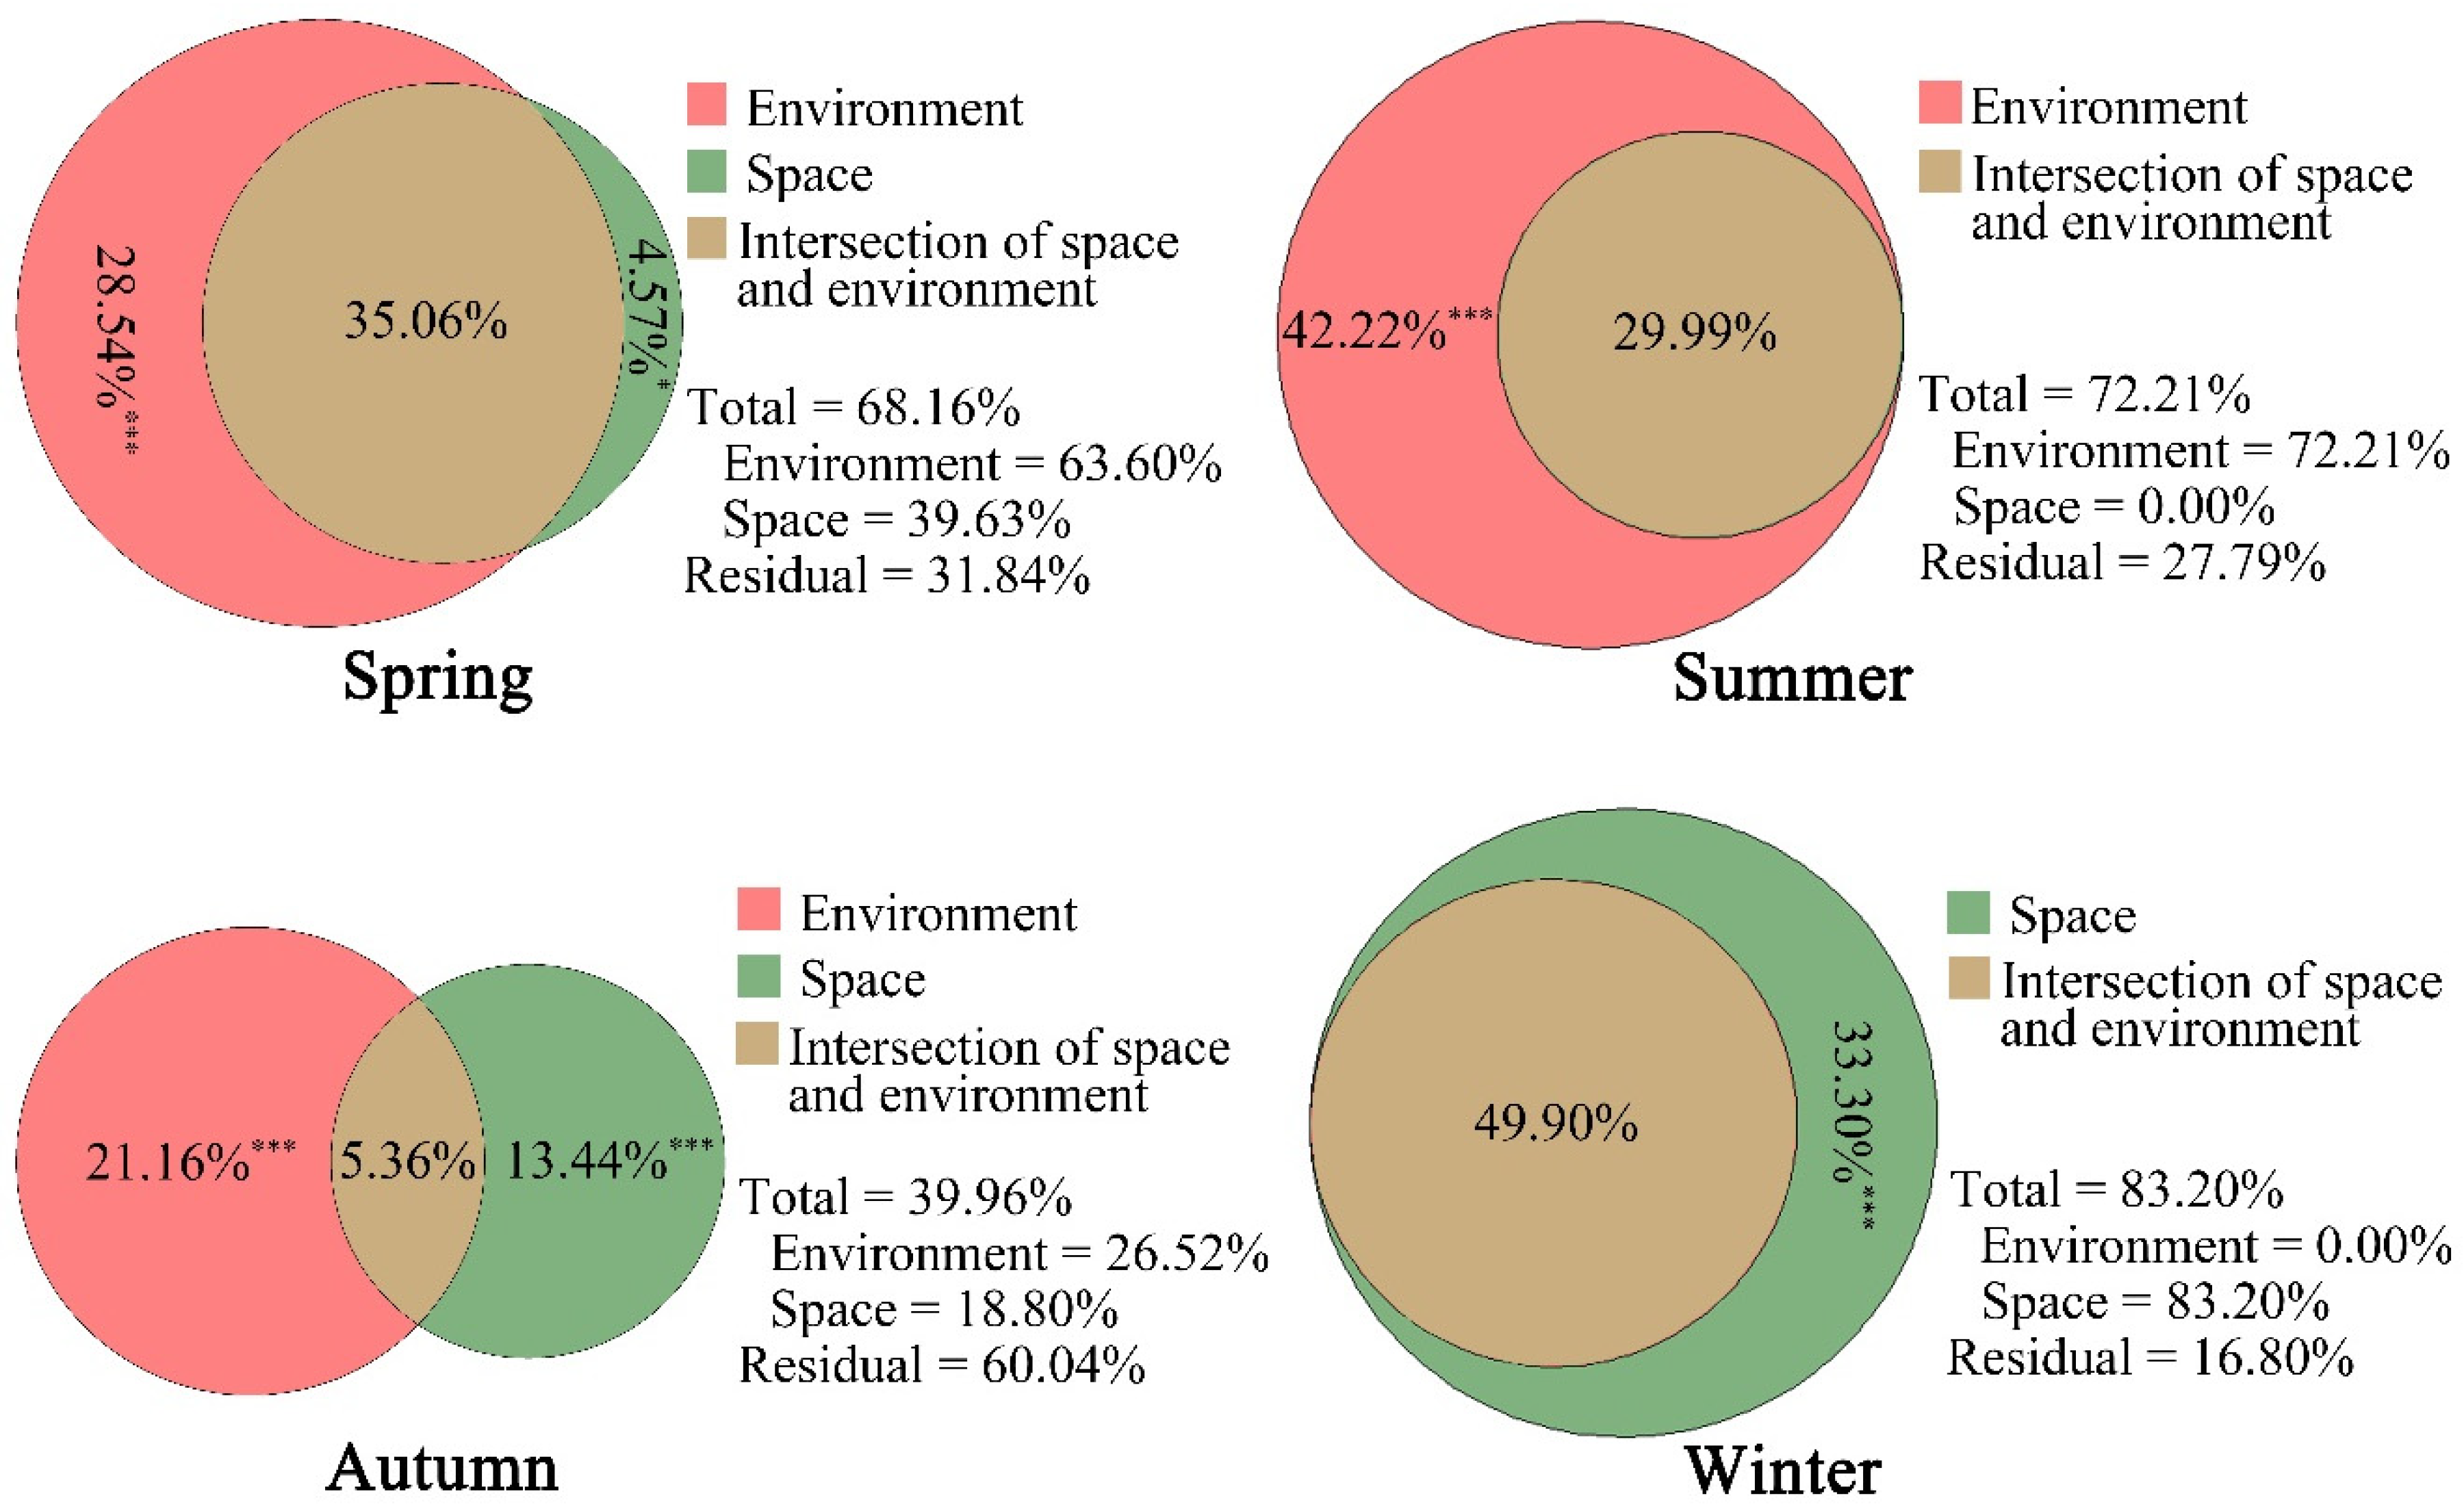
3.3. Relationships between Environmental Variables and Home Range Use Intensity

We observed that some of the environmental variables affected spatial predictors. Dominant trees of masson pine (Pinus massoniana), primary forest, and elevation may have positive effects on the spatial predictors, and dominant trees of beech (Fagus longipetiolata) and basswood (Tilia tuan) may have negative effects on the spatial predictors (Table S3). The results suggested that the spatial variation in the home range use intensity may be affected by some environmental variables.
Variation partitioning results suggested that the environmental components explained the home range use intensity more powerfully in spring (63.6%) and summer (72.21%) than in autumn (26.52%) and winter (0.00%) (Figure 5). The explanatory variables of environmental components and space had many intersections to explain the home range use intensity in spring, summer, and winter.
We observed that some environmental variables were related to the home range use intensity (Table 4). The significant environmental variables did not include any foraged food trees, but did include tree density, canopy density, water source, and dominant trees of Chinese wingnut (Pterocarya stenoptera).

4. Discussion

Our results showed that golden snub-nosed monkeys in Tangjiahe National Nature Reserve had a larger home range size than that found for other colobine monkeys in previous studies (Table 2; Figure 3 and Figure 4) [47]. Home range size may be determined in part by group size. A larger group needs to increase their foraging areas to obtain enough food for all group members [4,21]. Our results are consistent with those of other studies of the same species, with studies recording a large home range size that ranges from 18.3 km2 to 51.42 km2 [4,44,50,51]. The large home range size observed for the golden snub-nosed monkey is also consistent with those of other snub-nosed monkeys in China. A group of 175 Yunnan snub-nosed monkeys (Rhinopithecus brelichi) had a home range size of >20 km2 [73], and a group of 125–336 Guizhou snub-nosed monkeys had a home range size of 27.8 km2 [49]. These studies suggest that snub-nosed monkeys occupy larger home ranges than other colobine monkeys [46], such as langurs that have ranges from 0.088–0.848 km2 [47] and guerezas of 0.053–0.117 km2 [48].
Food availability is an important environmental variable influencing home range size of primates [17,18,19]. We found significant differences in home range size calculated from 50% KDE isopleths among the four seasons. This home range variation may be partly attributed to the variation in food availability. In spring, the study group tended to select buds and young leaves as their food, which started to appear in April. Buds and young leaves are sparsely distributed in the home range, requiring the study group to move further distances, resulting in a larger home range size than in other seasons [4]. Abundant food is not a limitation to golden snub-nosed monkeys in summer, and heat stress in summer may restrict the movement [26,27] leading to a smaller home range size than in other seasons. Even if fruits and seeds are abundant in autumn they are usually distributed at different sites, and the golden snub-nosed monkey tends to move long distances to forage on these high quality foods [4], which results in a large home range size in autumn. The golden snub-nosed monkeys mainly foraged on low-quality bark in the winter months when there were no other choices, and they tended to move slowly and over short distances in winter to reduce energy loss [4]. The seasonal home range changes in golden snub-nosed monkeys at lower latitudes were similar to those in other studies at higher latitudes in the Qinling mountains [4].
Regression analysis of the canonical axis produced through MEM variables on environmental variables showed that some environmental variables contributed to the spatial variation in the home range use of the study group. The variation partitioning analysis showed that the environmental components explained a large fraction of the variation in spring (63.60%) and summer (72.21%), a moderate fraction in autumn (26.52%), and none in winter. The variation explained by environmental components was co-explained by the spatial predictors in spring, summer, and autumn, and was explained solely by the spatial predictors in winter. These findings collectively indicated that the environmental components were strongly spatially structured [74], especially the primary forest, elevation, and dominant trees of masson pine, beech, and basswood. The spatial predictors also explained a large fraction of variation, suggesting that the other factors that we did not measure are important drivers of the home range use, which should be determined in more detail in future studies.
We observed that the foraged tree species were positively correlated with the dominant tree species across the four seasons, which suggests that habitat patches selected by the golden snub-nosed monkey are sites potentially including abundant food resources. Interestingly, the foraged tree species were not positively correlated with home range use intensity, but tree density in summer and winter, moderate distance to water source and dominant trees of Chinese wingnut in autumn. Chinese wingnut is a large tree that can provide high tree stratum. Other variables may determine home range use when food is not the factor limiting survival. Studies have observed that ecological variables other than food confine home range use by primates, such as water source availability [33,34] and tree density [53]. Water source availability influences the home range use of golden snub-nosed monkeys, and they regularly drink water from streams in their home range [75]. The golden snub-nosed monkey selects habitats with a high tree density of 10 trees in 20 m2 to cross the distance among trees easily [53]. They select patches with large trees to forage leaves, fruits, or bark, and also to use trees over 6 m tall to facilitate fleeing from mammal predators, such as Asiatic golden cat (Catopuma temmincki), wolf (Canis lupus), red dog (Cuon alpinus), and leopard (Panthera pardus) [76]. Our results suggest that these environmental variables may have positively effects on the home range use intensity; however, it is worth noting that all p values for significant predictors in our model results were significant at the 0.05 level but not the 0.01 level. Consequently, further studies are needed to investigate in detail why the home range use of golden snub-nosed monkeys is not mainly affected by food resources.

5. Conclusions

Our study suggested that the core home range size of the golden snub-nosed monkey in Tangjiahe National Nature Reserve varied seasonally. Primary forest, elevation, and dominant trees of masson pine, beech, and basswood contributed to the spatial variation in the home range use of the study group. Water sources, tree density, and dominant trees of Chinese wingnut were the important environmental factors determining the home range use of golden snub-nosed monkeys, and these environmental factors require protection to ensure the survival of the golden snub-nosed monkey.

Supplementary Materials

The following supporting information can be downloaded at: https://www.mdpi.com/article/10.3390/ani12182338/s1, Table S1: The frequency with which golden snub-nosed monkeys entered 200 m × 200 m grid cells in Tangjiahe National Nature Reserve, China, November 2015 to October 2016; Table S2: Recorded foraged tree species and diet parts of the golden snub-nosed monkey in Tangjiahe National Nature Reserve, China, from November 2015 to October 2016. N, No. of sampling quadrats; Table S3: The regression analysis of canonical axis produced by positive MEM variables on environmental variables in Tangjiahe National Nature Reserve, China, November 2015 to October 2016. The environmental variables with the positive coefficient values suggested a positive influence on the spatial predictors, and the negative coefficient values suggested a negative effect.

Author Contributions

J.H. and G.Y. conceived and designed the research; Y.F., J.H., D.L. and L.S. conducted field surveys. Y.F. analyzed the data and drew the geographical figures, J.H., G.Y. and D.L. contributed for interpretation of data for the work. G.Y. wrote the manuscript. V.H. and Y.L. revised the manuscript. All authors have read and agreed to the published version of the manuscript.

Funding

The study was funded by the National Natural Science Foundation of China (31370412), the Biodiversity Survey and Assessment Project of the Ministry of Ecology and Environment, China (2019HJ209600106), the Meritocracy Research Funds of China West Normal University (17YC330), and the golden snub-nosed monkey research project of Tangjiahe National Nature Reserve (QGZZC-DY [2015]03).

Institutional Review Board Statement

Not applicable.

Informed Consent Statement

Not applicable.

Data Availability Statement

The data presented in this study are available from the corresponding author upon request.

Acknowledgments

We are grateful to staffs in the Tangjiahe National Nature Reserve for their contribution to our study, and we are thankful for everyone who contributed to our project.

Conflicts of Interest

The authors declare no conflict of interest.

References

  1. Powell, R.A.; Mitchell, M.S. What is a home range? J. Mammal. 2012, 93, 948–958. [Google Scholar] [CrossRef]
  2. Ren, B.; Li, M.; Long, Y.; Wu, R.; Wei, F. Home range and seasonality of Yunnan snub-nosed monkeys. Integr. Zool. 2009, 4, 162–171. [Google Scholar] [CrossRef]
  3. Wada, K.; Ichiki, Y. Seasonal home range use by Japanese monkeys in the snowy Shiga Heights. Primates 1980, 21, 468–483. [Google Scholar] [CrossRef]
  4. Li, B.; Chen, C.; Ji, W.; Ren, B. Seasonal home range changes of the Sichuan snub-nosed monkey (Rhinopithecus roxellana) in the Qinling Mountains of China. Folia. Primatol. 2000, 71, 375–386. [Google Scholar] [CrossRef] [PubMed]
  5. McNab, B.K. Bioenergetics and the determination of home range size. Am. Nat. 1963, 97, 133–140. [Google Scholar] [CrossRef]
  6. Herfindal, I.; Linnell, J.D.C.; Odden, J.; Nilsen, E.B.; Andersen, R. Prey density, environmental productivity and home-range size in the Eurasian lynx (Lynx lynx). J. Zool. 2005, 265, 63–71. [Google Scholar] [CrossRef]
  7. Saïd, S.; Servanty, S. The influence of landscape structure on female roe deer home-range size. Landsc. Ecol. 2005, 20, 1003–1012. [Google Scholar] [CrossRef]
  8. Castillo-Contreras, R.; Carvalho, J.; Serrano, E.; Mentaberre, G.; Fernández-Aguilar, X.; Colom, A.; González-Crespo, C.; Lavín, S.; López-Olvera, J. Urban wild boars prefer fragmented areas with food resources near natural corridors. Sci. Total Environ. 2018, 615, 282–288. [Google Scholar] [CrossRef] [PubMed]
  9. Mcloughlin, P.D.; Ferguson, S.H. A hierarchical pattern of limiting factors helps explain variation in home range size. Ecoscience 2000, 7, 123–130. [Google Scholar] [CrossRef]
  10. McKinney, T. A classification system for describing anthropogenic influence on nonhuman primate populations. Am. J. Primatol. 2015, 77, 715–726. [Google Scholar] [CrossRef]
  11. Volampeno, M.S.N.; Masters, J.C.; Downs, C.T. Home range size in the blue-eyed black lemur (Eulemur flavifrons): A comparison between dry and wet seasons. Mamm. Biol. 2011, 76, 157–164. [Google Scholar] [CrossRef]
  12. Erinjery, J.J.; Kavana, T.; Singh, M. Food resources, distribution and seasonal variations in ranging in lion-tailed macaques, Macaca silenus in the Western Ghats, India. Primates 2015, 56, 45–54. [Google Scholar] [CrossRef] [PubMed]
  13. Wang, C.; Liu, H.; Li, Y.; Dong, B.; Qiu, C.; Yang, J.; Zong, Y.; Chen, H.; Zhao, Y.; Zhang, Y. Study on habitat suitability and environmental variable thresholds of rare waterbirds. Sci. Total. Environ. 2021, 785, 147316. [Google Scholar] [CrossRef] [PubMed]
  14. Itonaga, K.; Jones, S.M.; Wapstra, E. Effects of maternal basking and food quantity during gestation provide evidence for the selective advantage of matrotrophy in a viviparous lizard. PLoS ONE 2012, 7, e41835. [Google Scholar] [CrossRef] [PubMed]
  15. Jacquier, M.; Calenge, C.; Say, L.; Devillard, S.; Ruette, S. Altitude shapes the environmental drivers of large-scale variation in abundance of a widespread mammal species. Ecol. Evol. 2020, 10, 119–130. [Google Scholar] [CrossRef]
  16. Huang, Z.-P.; Cui, L.-W.; Scott, M.B.; Wang, S.-J.; Xiao, W. Seasonality of reproduction of wild black-and-white snub-nosed monkeys (Rhinopithecus bieti) at Mt. Lasha, Yunnan, China. Primates 2012, 53, 237–245. [Google Scholar] [CrossRef] [PubMed]
  17. Albert, A.; Huynen, M.C.; Savini, T.; Hambuckers, A. Influence of food resources on the ranging pattern of northern pig-tailed macaques (Macaca leonina). Int. J. Primatol. 2013, 34, 696–713. [Google Scholar] [CrossRef]
  18. Izumiyama, S.; Mochizuki, T.; Shiraishi, T. Troop size, home range area and seasonal range use of the Japanese macaque in the Northern Japan Alps. Ecol. Res. 2003, 18, 465–474. [Google Scholar] [CrossRef]
  19. Palacios, E.; Rodriguez, A. Ranging pattern and use of space in a group of red howler monkeys (Alouatta seniculus) in a southeastern Colombian rainforest. Am. J. Primatol. 2001, 55, 233–251. [Google Scholar] [CrossRef]
  20. Koganezawa, M.; Imaki, H. The effects of food sources on Japanese monkey home range size and location, and population dynamics. Primates 1999, 40, 177–185. [Google Scholar] [CrossRef]
  21. Grueter, C.C.; Li, D.; van Schaik, C.P.; Ren, B.; Long, Y. Ranging of Rhinopithecus bieti in the Samage Forest, China. I. Characteristics of Range Use. Int. J. Primatol. 2008, 29, 1121–1145. [Google Scholar] [CrossRef]
  22. Strier, K.B. Ranging behavior of woolly spider monkeys, or muriquis, Brachyteles arachnoides. Int. J. Primatol. 1987, 8, 575–591. [Google Scholar] [CrossRef]
  23. Grueter, C.C.; Li, D.; Ren, B.; Li, M. Overwintering strategy of Yunnan snub-nosed monkeys: Adjustments in activity scheduling and foraging patterns. Primates 2013, 54, 125–135. [Google Scholar] [CrossRef] [PubMed]
  24. Ban, S.D.; Boesch, C.; Janmaat, K.R. Taï chimpanzees anticipate revisiting high-valued fruit trees from further distances. Anim. Cogn. 2014, 17, 1353–1364. [Google Scholar] [CrossRef]
  25. Maruhashi, T.; Saito, C.; Agetsuma, N. Home range structure and inter-group competition for land of Japanese macaques in evergreen and deciduous forests. Primates 1998, 39, 291–301. [Google Scholar] [CrossRef]
  26. Fedigan, F. Behavioral adaptations to heat stress and water scarcity in white-faced capuchins (Cebus capucinus) in Santa Rosa National Park, Costa Rica. Am. J. Phys. Anthropol. 2009, 138, 101–111. [Google Scholar]
  27. Campos, F.A.; Bergstrom, M.L.; Childers, A.; Hogan, J.D.; Jack, K.M.; Melin, A.; Mosdossy, K.N.; Myers, M.S.; Parr, N.A.; Sargeant, E. Drivers of home range characteristics across spatiotemporal scales in a Neotropical primate, Cebus capucinus. Anim. Behav. 2014, 91, 93–109. [Google Scholar] [CrossRef]
  28. Hillebrand, H. On the generality of the latitudinal diversity gradient. Am. Nat. 2004, 163, 192–211. [Google Scholar] [CrossRef]
  29. Jiang, H.; Liu, Z.; Zhang, Y.; Southwick, C. Population ecology of rhesus monkeys (Macaca mulatta) at Nanwan nature reserve, Hainan, China. Am. J. Primatol. 1991, 25, 207–217. [Google Scholar] [CrossRef]
  30. Qu, W.; Zhang, Y.; Manry, D.; Southwick, C.H. Rhesus monkeys (Macaca mulatta) in the Taihang mountains, Jiyuan county, Henan, China. Int. J. Primatol. 1993, 14, 607–621. [Google Scholar]
  31. Glessner, K.D.; Britt, A. Population density and home range size of Indri indri in a protected low altitude rain forest. Int. J. Primatol. 2005, 26, 855–872. [Google Scholar] [CrossRef]
  32. Merker, S. Habitat-specific ranging patterns of Dian’s tarsiers (Tarsius dianae) as revealed by radiotracking. Am. J. Primatol. 2006, 68, 111–125. [Google Scholar] [CrossRef] [PubMed]
  33. Bitetti, M. Home-range use by the tufted capuchin monkey (Cebus apella nigritus) in a subtropical rainforest of Argentina. J. Zool. 2010, 253, 33–45. [Google Scholar] [CrossRef]
  34. Scholz, F.; Kappeler, P.M. Effects of seasonal water scarcity on the ranging behavior of Eulemur fulvus rufus. Int. J. Primatol. 2004, 25, 599–613. [Google Scholar] [CrossRef]
  35. Coleman, B.T.; Hill, R.A. Living in a landscape of fear: The impact of predation, resource availability and habitat structure on primate range use. Anim. Behav. 2014, 88, 165–173. [Google Scholar] [CrossRef]
  36. Long, Y.; Richardson, M. Rhinopithecus roxellana (amended version of 2020 assessment). In The IUCN Red List of Threatened Species; IUCN Global Species Programme Red List Unit: Cambridge, UK. [CrossRef]
  37. Sung, W. China Red Data Book of Endangered Animals: Mammalia; Science Press: Beijing, China, 1998. [Google Scholar]
  38. Wang, Y.; Jiang, X.; Li, D. Classification and distribution of the extant subspecies of golden snub-nosed monkey (Rhinopithecus [Rhinopithecus] roxellana). In The Natural History of the Doucs and Snub-Nosed Monkeys; World Scientific: Hackensack, NJ, USA, 1998; pp. 53–64. [Google Scholar]
  39. Mao, Z.; Bai, W.; Fu, L.; Cai, T.; Huang, Y.; Hong, Y.; Hou, J.; Luo, H.; Zhang, J.; Zhou, C. Investigation on beasts of suspicious distribution in Mabian Dafengding nature reserve. J. China West. Norm. Univ. (Nat. Sci.) 2022, 43, 1–8. [Google Scholar]
  40. Qiao, J.; Jia, G.; Zhou, H.; Gong, L.; Jiang, Y.; Xiao, N.; Gao, X.; Wen, A.; Wang, J. Mammal and bird diversity recorded with camera traps in Gongga Mountain National Nature Reserve, Sichuan, China. Biodivers. Sci. 2022, 30, 20395. [Google Scholar] [CrossRef]
  41. Guo, S.; Li, B.; Watanabe, K. Diet and activity budget of Rhinopithecus roxellana in the Qinling Mountains, China. Primates 2007, 48, 268–276. [Google Scholar] [CrossRef]
  42. Hou, R.; He, S.; Wu, F.; Chapman, C.; Pan, R.; Garber, P.; Guo, S.; Li, B. Seasonal variation in diet and nutrition of the northern-most population of Rhinopithecus roxellana. Am. J. Primatol. 2018, 80, e22755. [Google Scholar] [CrossRef]
  43. Liu, X.; Stanford, C.; Yang, J.; Yao, H.; Li, Y. Foods eaten by the Sichuan snub-nosed monkey (Rhinopithecus roxellana) in Shennongjia National Nature Reserve, China, in relation to nutritional chemistry. Am. J. Primatol. 2013, 75, 860–871. [Google Scholar] [CrossRef]
  44. Li, Y.; Jiang, Z.; Li, C.; Grueter, C.C. Effects of seasonal folivory and frugivory on ranging patterns in Rhinopithecus roxellana. Int. J. Primatol. 2010, 31, 609–626. [Google Scholar] [CrossRef]
  45. Ren, B.; Li, B.; Li, M.; Wei, F. Inter-population variation of diets of golden snub-nosed monkeys (Rhinopithecus roxellana) in China. Acta. Theriol. Sin. 2010, 30, 357–364. [Google Scholar]
  46. Ren, B.; Ming, L.; Long, Y.; Wei, F. Influence of day length, ambient temperature, and seasonality on daily travel distance in the Yunnan snub-nosed monkey at Jinsichang, Yunnan, China. Am. J. Primatol. 2010, 71, 233–241. [Google Scholar]
  47. van Schaik, C.P.; Assink, P.R.; Salafsky, N.S. Territorial behavior in southeast Asian langurs: Resource defense or mate defense? Am. J. Primatol. 1992, 26, 233–242. [Google Scholar] [CrossRef]
  48. Harris, T.; Chapman, C. Variation in diet and ranging of black and white colobus monkeys in Kibale National Park, Uganda. Primates 2007, 48, 208–221. [Google Scholar] [CrossRef]
  49. Guo, Y.; Ren, B.; Dai, Q.; Zhou, J.; Zhou, J. Habitat estimates reveal that there are fewer than 400 Guizhou snub-nosed monkeys, Rhinopithecus brelichi, remaining in the wild. Glob. Ecol. Conserv. 2020, 24, e01181. [Google Scholar]
  50. Chu, Y.; Sha, J.; Kawazoe, T.; Dong, X. Sleeping site and tree selection by Sichuan snub-nosed monkeys (Rhinopithecus roxellana) in Baihe Nature Reserve, Sichuan, China. Am. J. Primatol. 2018, 80, e22936. [Google Scholar] [CrossRef]
  51. Tan, C.L.; Guo, S.; Li, B. Population structure and ranging patterns of Rhinopithecus roxellana in Zhouzhi National Nature Reserve, Shaanxi, China. Int. J. Primatol. 2007, 28, 577–591. [Google Scholar] [CrossRef]
  52. Zhou, X.; Yang, W.; Jin, K. Study on the habitat selection of Sichuan snub-nosed monkey in Baishuijiang Nature Reserve, Gansu. Gansu For. 2020, 5, 35–36. [Google Scholar]
  53. Wang, W.; Chu, Y.; Hu, G. Habitat selection of golden snub-nosed monkey (Rhinopithecus roxellana) of Baihe Nature Reserve in autumn. J. China West. Norm. Univ. (Nat. Sci.) 2013, 34, 16–21. [Google Scholar]
  54. Wang, Y.; Zhou, C.; Zhang, J.; Zhou, Y.; Hu, J.; Xiong, Y. Spatial niche of the rodents in summer in Tangjiahe Nature Reserve. Acta. Theriol. Sin. 2005, 25, 39–44. [Google Scholar] [CrossRef]
  55. Wang, Y.; Hu, J.; Shen, L.; Zhang, H.; Xu, L.; Hu, Z.; Xu, H. Biomass of small mammals in Tangjiahe Nature Reserve. Chin. J. Ecol. 2005, 24, 707–710. [Google Scholar]
  56. Yao, G.; Li, Y.; Li, D.; Williams, P.; Hu, J. Phylogenetic analysis of the endangered takin in the confluent zone of the Qinling and Minshan Mountains using mtDNA control region. Mitochondrial DNA Part A 2016, 27, 2594–2605. [Google Scholar] [CrossRef]
  57. Shen, L.; Gao, Z.; Ou, W.; Chen, W.; Ma, W. Investigation of amphibian and reptile in Sichuan Tangjiahe Nature Reserve. Sichuan J. Zool. 1999, 18, 132–134. [Google Scholar] [CrossRef]
  58. Fan, Y.; Li, D.; Huang, X.; Li, Y.; Chen, L.; Wang, X.; Xia, W.; Hu, J. Social structure of Sichuan snub-nosed monkeys (Rhinopithecus roxellana) in Minshan Mountains: A case study of Sichuan snub-nosed monkey in Tangjiahe National Nature Reserve. Sichuan J. Zool. 2015, 34, 832–836. [Google Scholar] [CrossRef]
  59. Zhang, B. Season distribution in China. Acta. Geogr. Sin. 1934, 1, 32–77. [Google Scholar]
  60. Zhang, Z. Research on Biodiversity in Tangjiahe National Nature Reserve, China; Science Press: Beijing, China, 2016. [Google Scholar]
  61. ESRI. ArcGIS Desktop: Release 10.3; Environmental Systems Research Institute: Redlands, CA, USA, 2011; Available online: https://desktop.arcgis.com/zh-cn/arcmap/10.3/main/get-started/whats-new-in-arcgis.htm (accessed on 1 April 2020).
  62. Rodfers, A.; Kie, J.; Wright, D.; Beyer, H.; Carr, A. HRT: Home Range Tools for ArcGIS. Version 2.0; Ontario Ministry of Natural Resources, Centre for Northern Forest Ecosystem Research: Thunder Bay, ON, Canada, 2015; Available online: http://flash.lakeheadu.ca/~arodgers/hre/ (accessed on 1 April 2020).
  63. Seaman, D.E.; Powell, R.A. An evaluation of the accuracy of kernel density estimators for home range analysis. Ecology 1996, 77, 2075–2085. [Google Scholar] [CrossRef]
  64. Worton, B. Kernel methods for estimating the utilization distribution in home-range studies. Ecology 1989, 70, 164–168. [Google Scholar] [CrossRef]
  65. Mekonnen, A.; Fashing, P.; Bekele, A.; Hernandez-Aguilar, R.; Rueness, E.; Nguyen, N.; Stenseth, N. Impacts of habitat loss and fragmentation on the activity budget, ranging ecology and habitat use of Bale monkeys (Chlorocebus djamdjamensis) in the southern Ethiopian highlands. Am. J. Primatol. 2017, 79, e22644. [Google Scholar] [CrossRef] [Green Version]
  66. Altmann, J. Observational study of behavior: Sampling methods. Behaviour 1974, 49, 227–266. [Google Scholar] [CrossRef]
  67. Li, Y.; Zhang, B.; Qin, S.; Li, S.; Huang, X. Review of research and application of forest canopy closure and its measuring methods. World For. Res. 2008, 21, 40–45. [Google Scholar]
  68. Wikum, D.A.; Shanholtzer, G.F. Application of the Braun-Blanquet cover-abundance scale for vegetation analysis in land development studies. Environ. Manag. 1978, 2, 323–329. [Google Scholar] [CrossRef]
  69. Legendre, P.; Legendre, L. Numerical Ecology, 3rd English ed.; Elsevier: Amsterdam, The Netherlands, 2012; pp. 785–906. [Google Scholar]
  70. R-Core-Team. R: A Language and Environment for Statistical Computing; R Foundation for Statistical Computing: Vienna, Austria, 2019. [Google Scholar]
  71. Borcard, D.; Gillet, F.; Legendre, P. Numerical Ecology with R; Springer: New York, NY, USA, 2011. [Google Scholar]
  72. Dray, S.; Legendre, P.; Peres-Neto, P.R. Spatial modelling: A comprehensive framework for principal coordinate analysis of neighbour matrices (PCNM). Ecol. Modell. 2006, 196, 483–493. [Google Scholar] [CrossRef]
  73. Kirkpatrick, R.C.; Long, Y.C.; Zhong, T.; Xiao, L. Social organization and range use in the Yunnan snub-nosed monkey Rhinopithecus bieti. Int. J. Primatol. 1998, 19, 13–51. [Google Scholar] [CrossRef]
  74. Murphy, S.J.; Audino, L.D.; Whitacre, J.; Eck, J.L.; Wenzel, J.W.; Queenborough, S.A.; Comita, L.S. Species associations structured by environment and land-use history promote beta-diversity in a temperate forest. Ecology 2015, 96, 705–715. [Google Scholar] [CrossRef] [PubMed]
  75. Zhang, J.; Hull, V.; Ouyang, Z.; Li, R.; Connor, T.; Yang, H.; Zhang, Z.; Silet, B.; Zhang, H.; Liu, J. Divergent responses of sympatric species to livestock encroachment at fine spatiotemporal scales. Biol. Conserv. 2017, 209, 119–129. [Google Scholar] [CrossRef]
  76. Li, Y. Terrestriality and tree stratum use in a group of Sichuan snub-nosed monkeys. Primates 2007, 48, 197–207. [Google Scholar] [CrossRef]
Figure 1. The location of Tangjiahe National Nature Reserve, China. JZG, Jiuzhaigou; SP, Songpan; HS, Heishui; PW, Pingwu; QC, Qingchuan; BC, Beichuan; MX, Maoxian; WC, Wenchuan; LX, Lixian; AZ, Anzhou; MZ, Mianzhu; DY, Dayi; SF, Shifang; DJY, Doujiangyan; PZ, Pengzhou; CZ, Chongzhou; TQ, Tianquan; LS, Lushan; BX, Baoxing; KD, Kangding; WX, Wenxian; ZQ, Zhouqu; WD, Wudou; FP, Foping; YX, Yangxian; ZZ, Zhouzhi; TB, Taibai; NS, Ningshan; SLJ, Shenlongjia; FX, Fangxian; XS, Xingshan; BD, Badong.
Animals 12 02338 g001
Figure 2. The relationship between cumulative home range area and golden snub-nosed monkey observation days in Tangjiahe National Nature Reserve, China, from November 2015 to October 2016.
Animals 12 02338 g002
Figure 3. The annual home range size of a golden snub-nosed monkey group (n = 138 individuals) in Tangjiahe National Nature Reserve, China, based on the grid cell method and kernel density estimation, November 2015 to October 2016.
Animals 12 02338 g003
Figure 4. Seasonal home range size of a group of golden snub-nosed monkeys (n = 138 individuals) in Tangjiahe National Nature Reserve, China, based on the grid cell method and kernel density estimations for November 2015 to October 2016; adjusted cells included only food residues and feces; black grid cells outlined in red indicate the smallest number of cells between two disparate home range areas with no other way of passage between the two parts (spring and winter).
Animals 12 02338 g004
Figure 5. Variation partitioning of home range use intensity by golden snub-nosed monkeys into an environmental component and MEM spatial components (space) in Tangjiahe National Nature Reserve, China, November 2015 to October 2016. *, p < 0.05; ***, p < 0.001. Values = 0 not shown.
Animals 12 02338 g005
Table 1. Environmental data recorded in quadrats in Tangjiahe National Nature Reserve, China, from November 2015 to October 2016.
Environmental VariableDescription
Elevation (m)The elevation at the location of the plant species eaten.
Type of forestEvergreen broadleaf forest, evergreen and deciduous broadleaf mixed forest, deciduous broadleaf forest, coniferous–broadleaf mixed forest, or coniferous forest.
Primary forest or secondary forestPrimary forest: Forest that has never been destroyed by human activities.
Secondary forest: Forest where large trees were cut down 40 years ago and have since regenerated.
Dead treesDead trees in an upright position with DBH ≥ 10 cm.
Fallen treesFallen trees with DBH ≥ 10 cm when standing upright.
Tree stumpsTree stumps with a diameter ≥ 10 cm.
Distance to the nearest water source0–50 m, 50–100 m, >100 m.
Tree heightMean height of trees with DBH ≥ 10 cm.
Canopy density0–25%, 25–50%, 50–75%, and 75–100%.
Mean DBH of treesMean DBH of trees with DBH ≥ 10 cm.
Tree densityStem density of trees with DBH ≥ 10 cm.
Dominant trees speciesTree species with the largest stem density in the quadrat among trees with DBH ≥ 10 cm.
Shrub heightMean height of shrubs.
Shrub cover0–25%, 25–50%, 50–75%, and 75–100%.
Table 2. Home range sizes of golden snub-nosed monkeys in Tangjiahe National Nature Reserve, China, November 2015 to October 2016.
No. of Days ObservedNo. of Days per Month (Mean ± SE)No. of GPS PointsGrid Cell Method (km2)50% KDE
(km2)
95% KDE
(km2)
Overall746.2 ± 0.8176324.06.2826.95
Spring157.5 ± 0.552815.49.8631.79
Summer196.3 ± 1.539811.65.5815.96
Autumn189.0 ± 2.034413.77.2023.19
Winter224.4 ± 1.249315.64.2319.37
Table 3. The ratio of observed diet part on foraged tree species in Tangjiahe National Nature Reserve, China, November 2015 to October 2016.
SeasonsThe Ratio of Observed Diet Part (%)
BarkBudTender LeafMature LeafFruit
SpringApril56.0024.0020.000.000.00
may63.6332.473.900.000.00
SummerJune69.2326.923.850.000.00
July50.0015.3830.770.003.85
August29.4147.065.8817.650.00
AutumnSeptember36.580.000.0012.2051.22
October36.592.440.0020.7340.24
WinterNovember72.730.000.0027.270.00
December60.000.000.0040.000.00
January75.0025.000.000.000.00
February56.2543.750.000.000.00
March60.5323.6810.535.260.00
Table 4. The regression analysis of the home range use intensity on environmental variables in Tangjiahe National Nature Reserve, China, November 2015 to October 2016. The environmental variables with the positive coefficient values suggest a positive influence on the home range use, and the negative coefficient values suggest a negative effect.
SeasonsSignificant Environmental VariablesCoefficientIntercepttp
SpringNoneNone−19.00NoneNone
SummerTree density0.91−65.702.260.045
AutumnModerate distance to water source (50–100 m)7.9629.402.120.039
Dominant trees of Chinese wingnut31.6529.402.140.038
WinterTree density0.66−22.302.120.043
Canopy density−26.02−22.30−2.080.046
Publisher’s Note: MDPI stays neutral with regard to jurisdictional claims in published maps and institutional affiliations.

