
Utility of the Ratio between Lactate Dehydrogenase (LDH) Activity and Total Nucleated Cell Counts in Effusions (LDH/TNCC Ratio) for the Diagnosis of Feline Infectious Peritonitis (FIP)

 , ,
, ,
Abstract
:Simple Summary
Abstract
1. Introduction
2. Materials and Methods
2.1. Study Design, Case Selection and Analytical Methods
- electrophoretogram: when normal, tended to exclude the diagnosis of FIP or allowed to classify samples as unlikely; conversely it supported the classification of samples as “possible” or “probable” based on the presence and magnitude of polyclonal gammopathy and/or of increased alpha2 globulins, especially if associated with other biochemical or hematological changes potentially consistent with FIP [10,29];
- acute phase proteins: normal concentration of serum amyloid A and/or haptoglobin were considered not consistent with FIP; increased concentrations, especially when associated with other biochemical, hematological or electrophoretic changes consistent with FIP, increased the probability of FIP up to “probable”, depending on the magnitude of the changes [30,31];
- bacteriology: positive results allowed to classify the effusions as “septic” (and therefore as “not FIP”), independent of their cytological or physicochemical features;
- histology: histological features consistent with diseases other than FIP allowed to classify the effusion as “non FIP”, independent of the cytological or physicochemical features of the effusions. Conversely, histological findings consistent with FIP [2], especially if associated with positive immunohistochemistry or PCR for FCoVs on tissues, allowed to classify the effusions as “almost confirmed FIP”;
- PCR: positive FCoV PCR on effusions, performed on the same sample submitted for the cytological and physicochemical analysis with results reported separately from the cytological and physicochemical description and therefore not included in the original report allowed to classify the effusions as “almost confirmed FIP”
2.2. Statistical Analysis
- true positives: samples from cats classified as FIP “probable” or “almost confirmed”, that for each analyte or parameter had values higher than the operating point;
- false positives: samples from cats classified as “not FIP”, “FIP unlikely” or “FIP possible”, that for each analyte or parameter had values higher than the operating point;
- false negative: samples from cats classified as FIP “probable” or “almost confirmed”, that for each analyte or parameter had values lower than the operating point;
- true negatives: samples from cats classified as “not FIP”, “FIP unlikely” or “FIP possible”, that for each analyte or parameter had values lower than the operating point.
3. Results
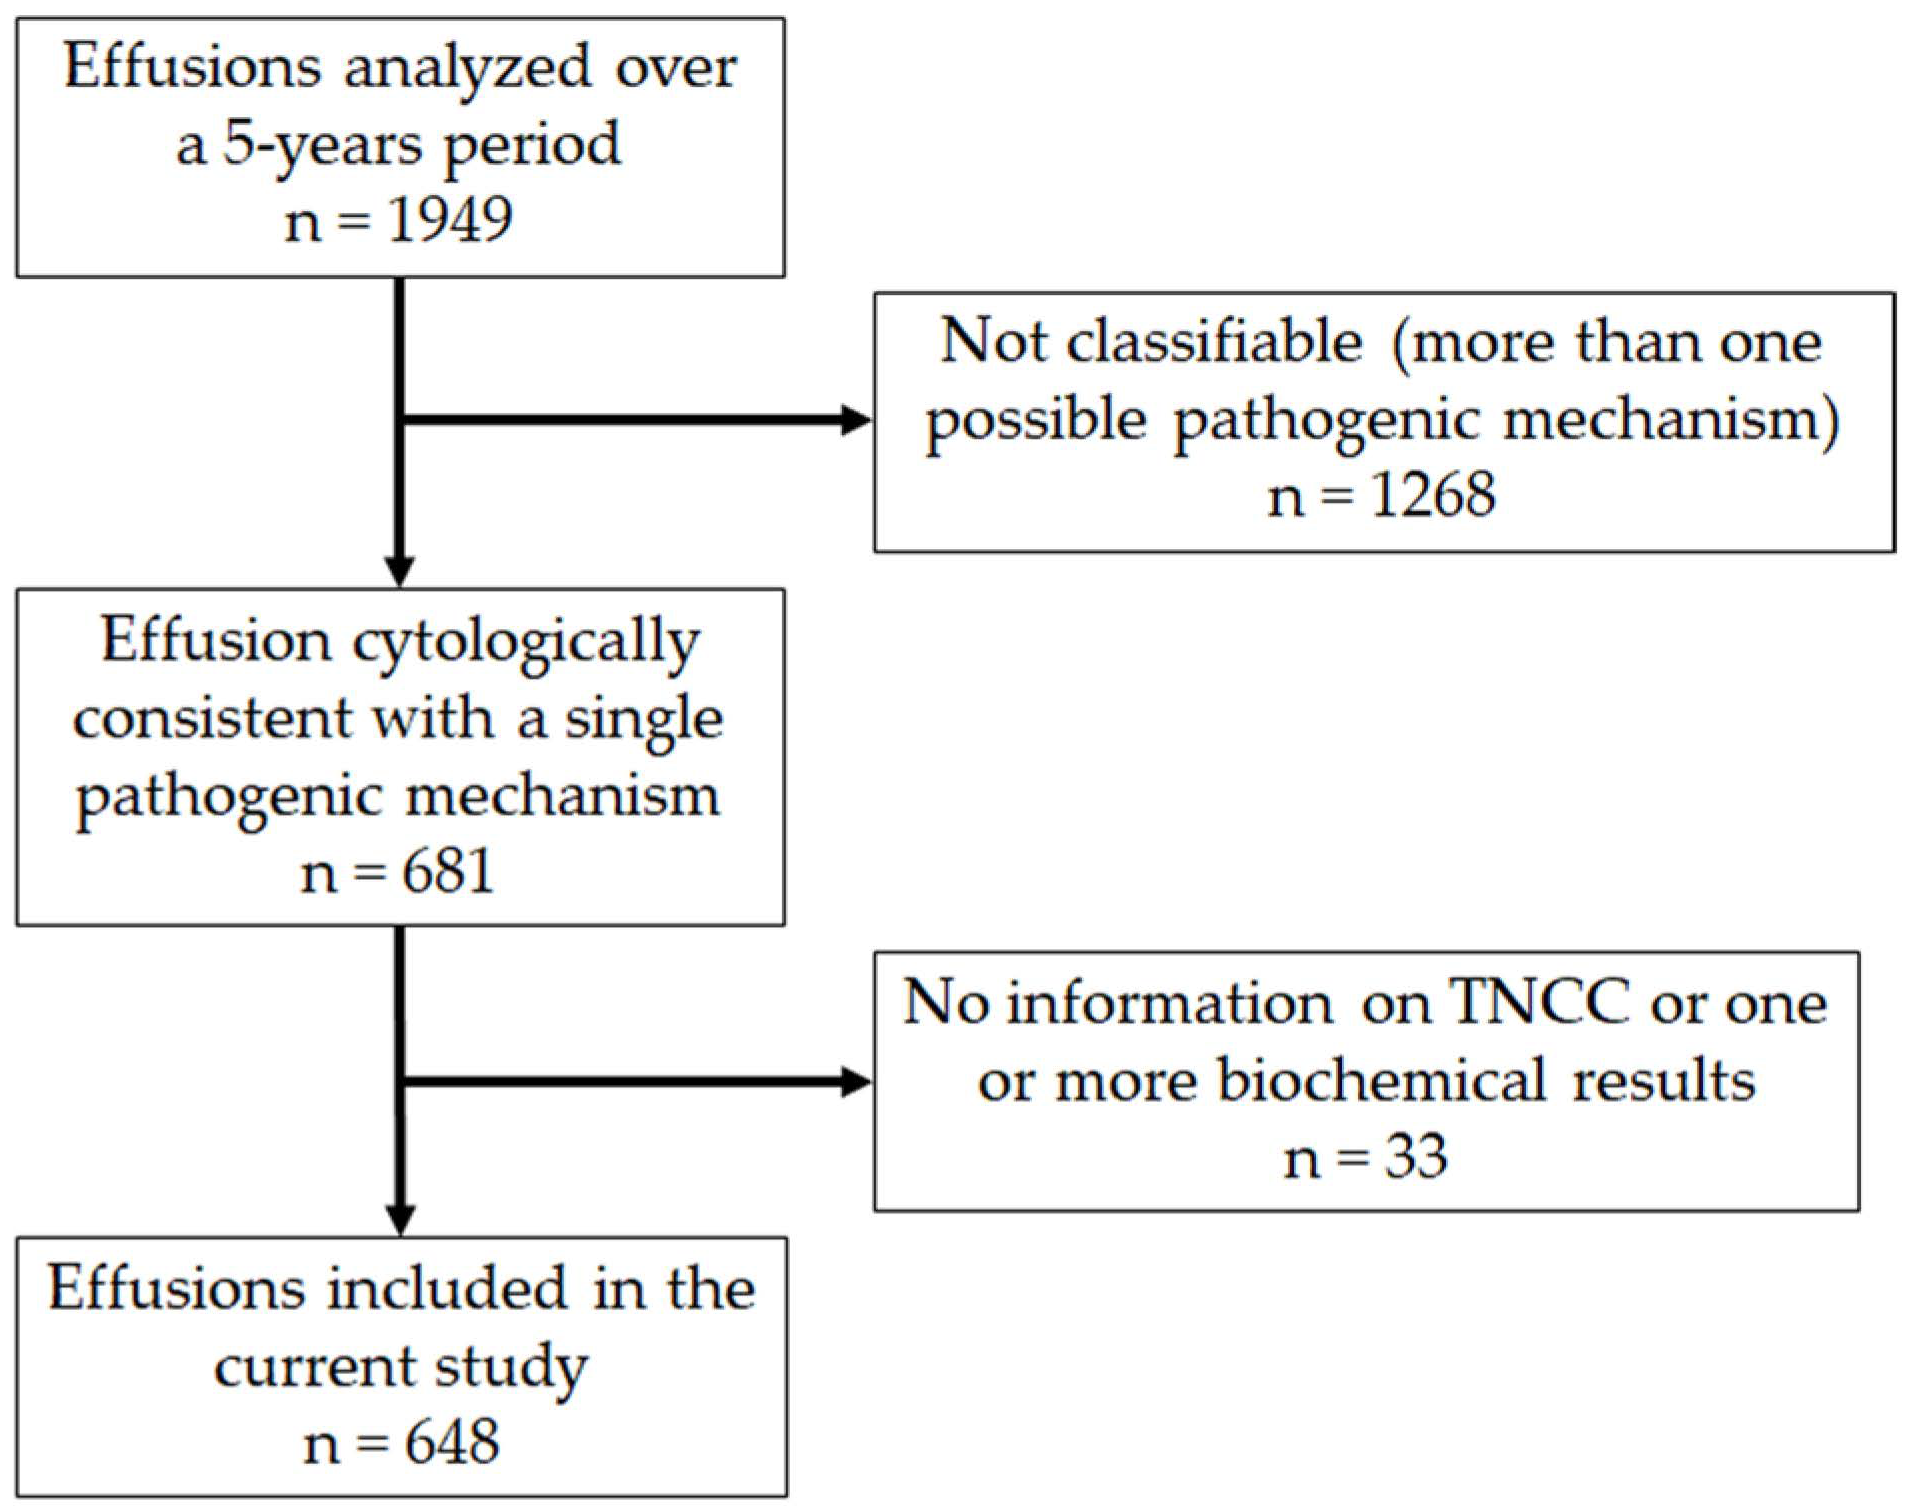
3.1. Caseload
3.2. Classification of Samples
- all the 296 samples classified as “not FIP” remained in the original category, except 2 lymphocyte-rich transudates, that were classified as “unlikely”;
- among the 37 samples that were originally classified as “unlikely” 10 were downgraded to “not FIP” (one “lymphocyte-rich transudate” and 9 “protein-rich transudates”), and 5 were reclassified as “possible FIP” (one “transudate” and 4 “protein-rich transudates”);
- among the 63 samples originally classified as “possible FIP” 3 were reclassified as “non FIP” (1 with positive bacteriology and 2 with neoplastic diseases), 27 were downgraded to “unlikely” (19 protein-rich transudates, 7 non septic exudates, 1 FIP effusion), 12 were reclassified as “probable FIP” (7 FIP effusions, 3 protein-rich transudates, 2 non septic exudates ) and 10 with positive PCR for FCoVs, not included in the original report, were then reclassified as “almost confirmed” (7 originally classified as FIP effusions, 2 as protein-rich transudate, 1 as non-septic exudate).
- among the 58 samples originally classified as “probable FIP” 1 was reclassified as “non FIP” due to a positive bacteriology, 1 was downgraded to “possible FIP” and 18 FIP effusions positive to FCoV PCR were turned to “almost confirmed FIP”;
- all the 17 effusions that were already classified as “almost confirmed FIP” based on positive FCoV PCR remained in the same class.
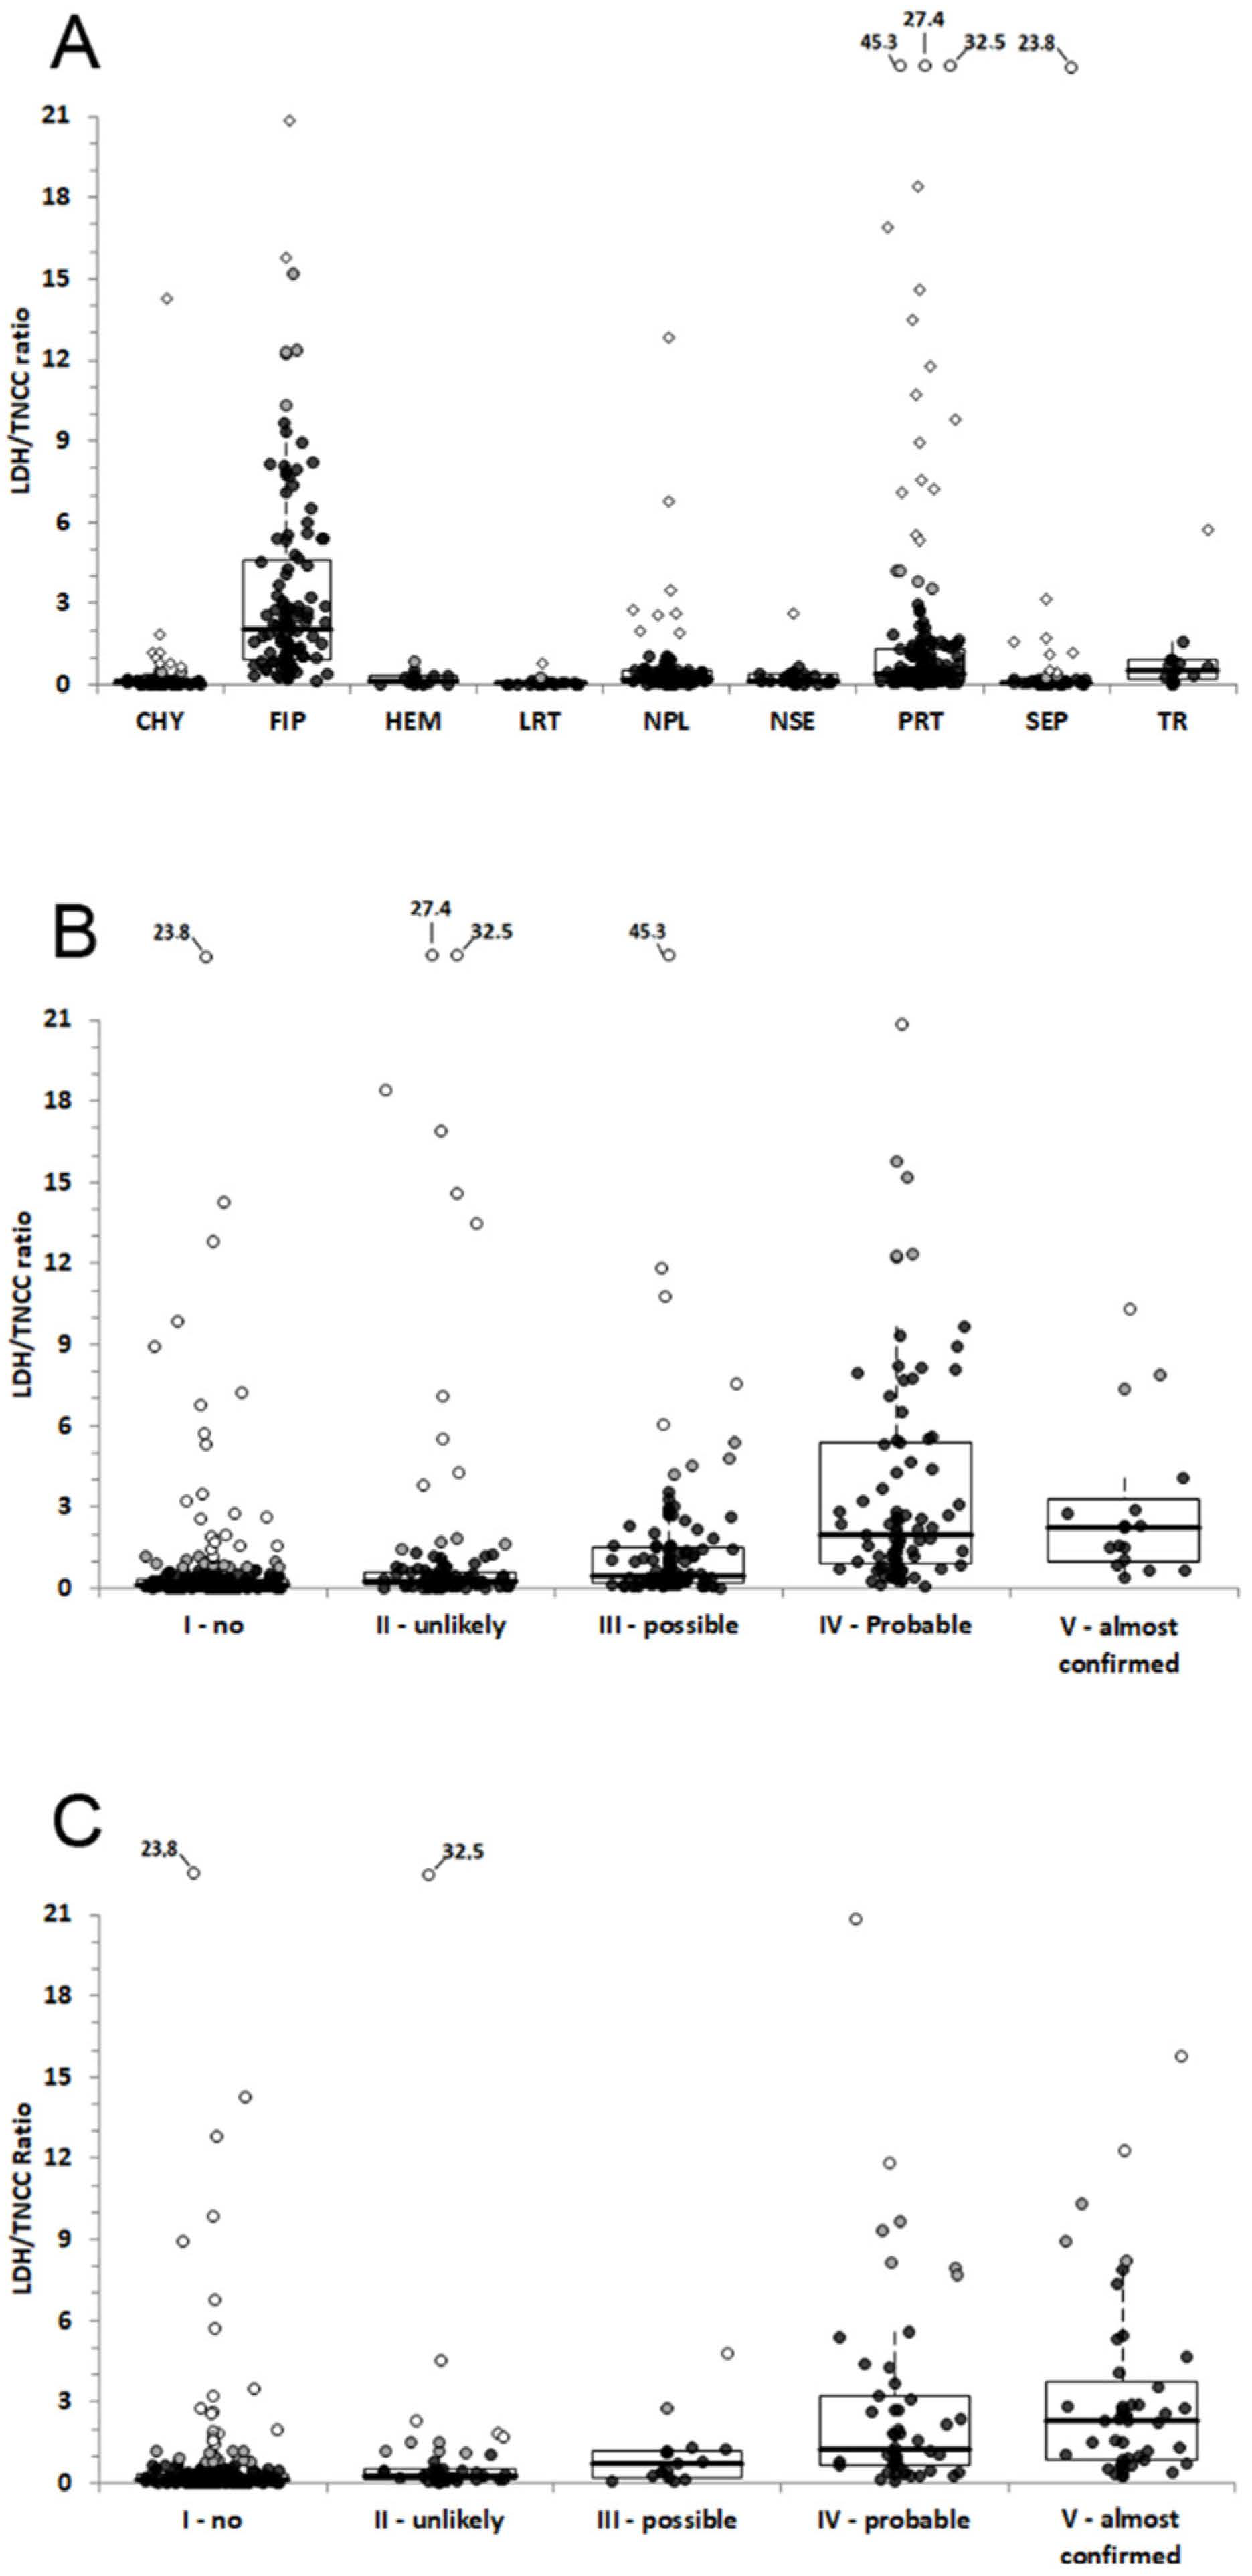
3.3. Differences of TNCC, LDH and LDH/TNCC Ratio among Groups
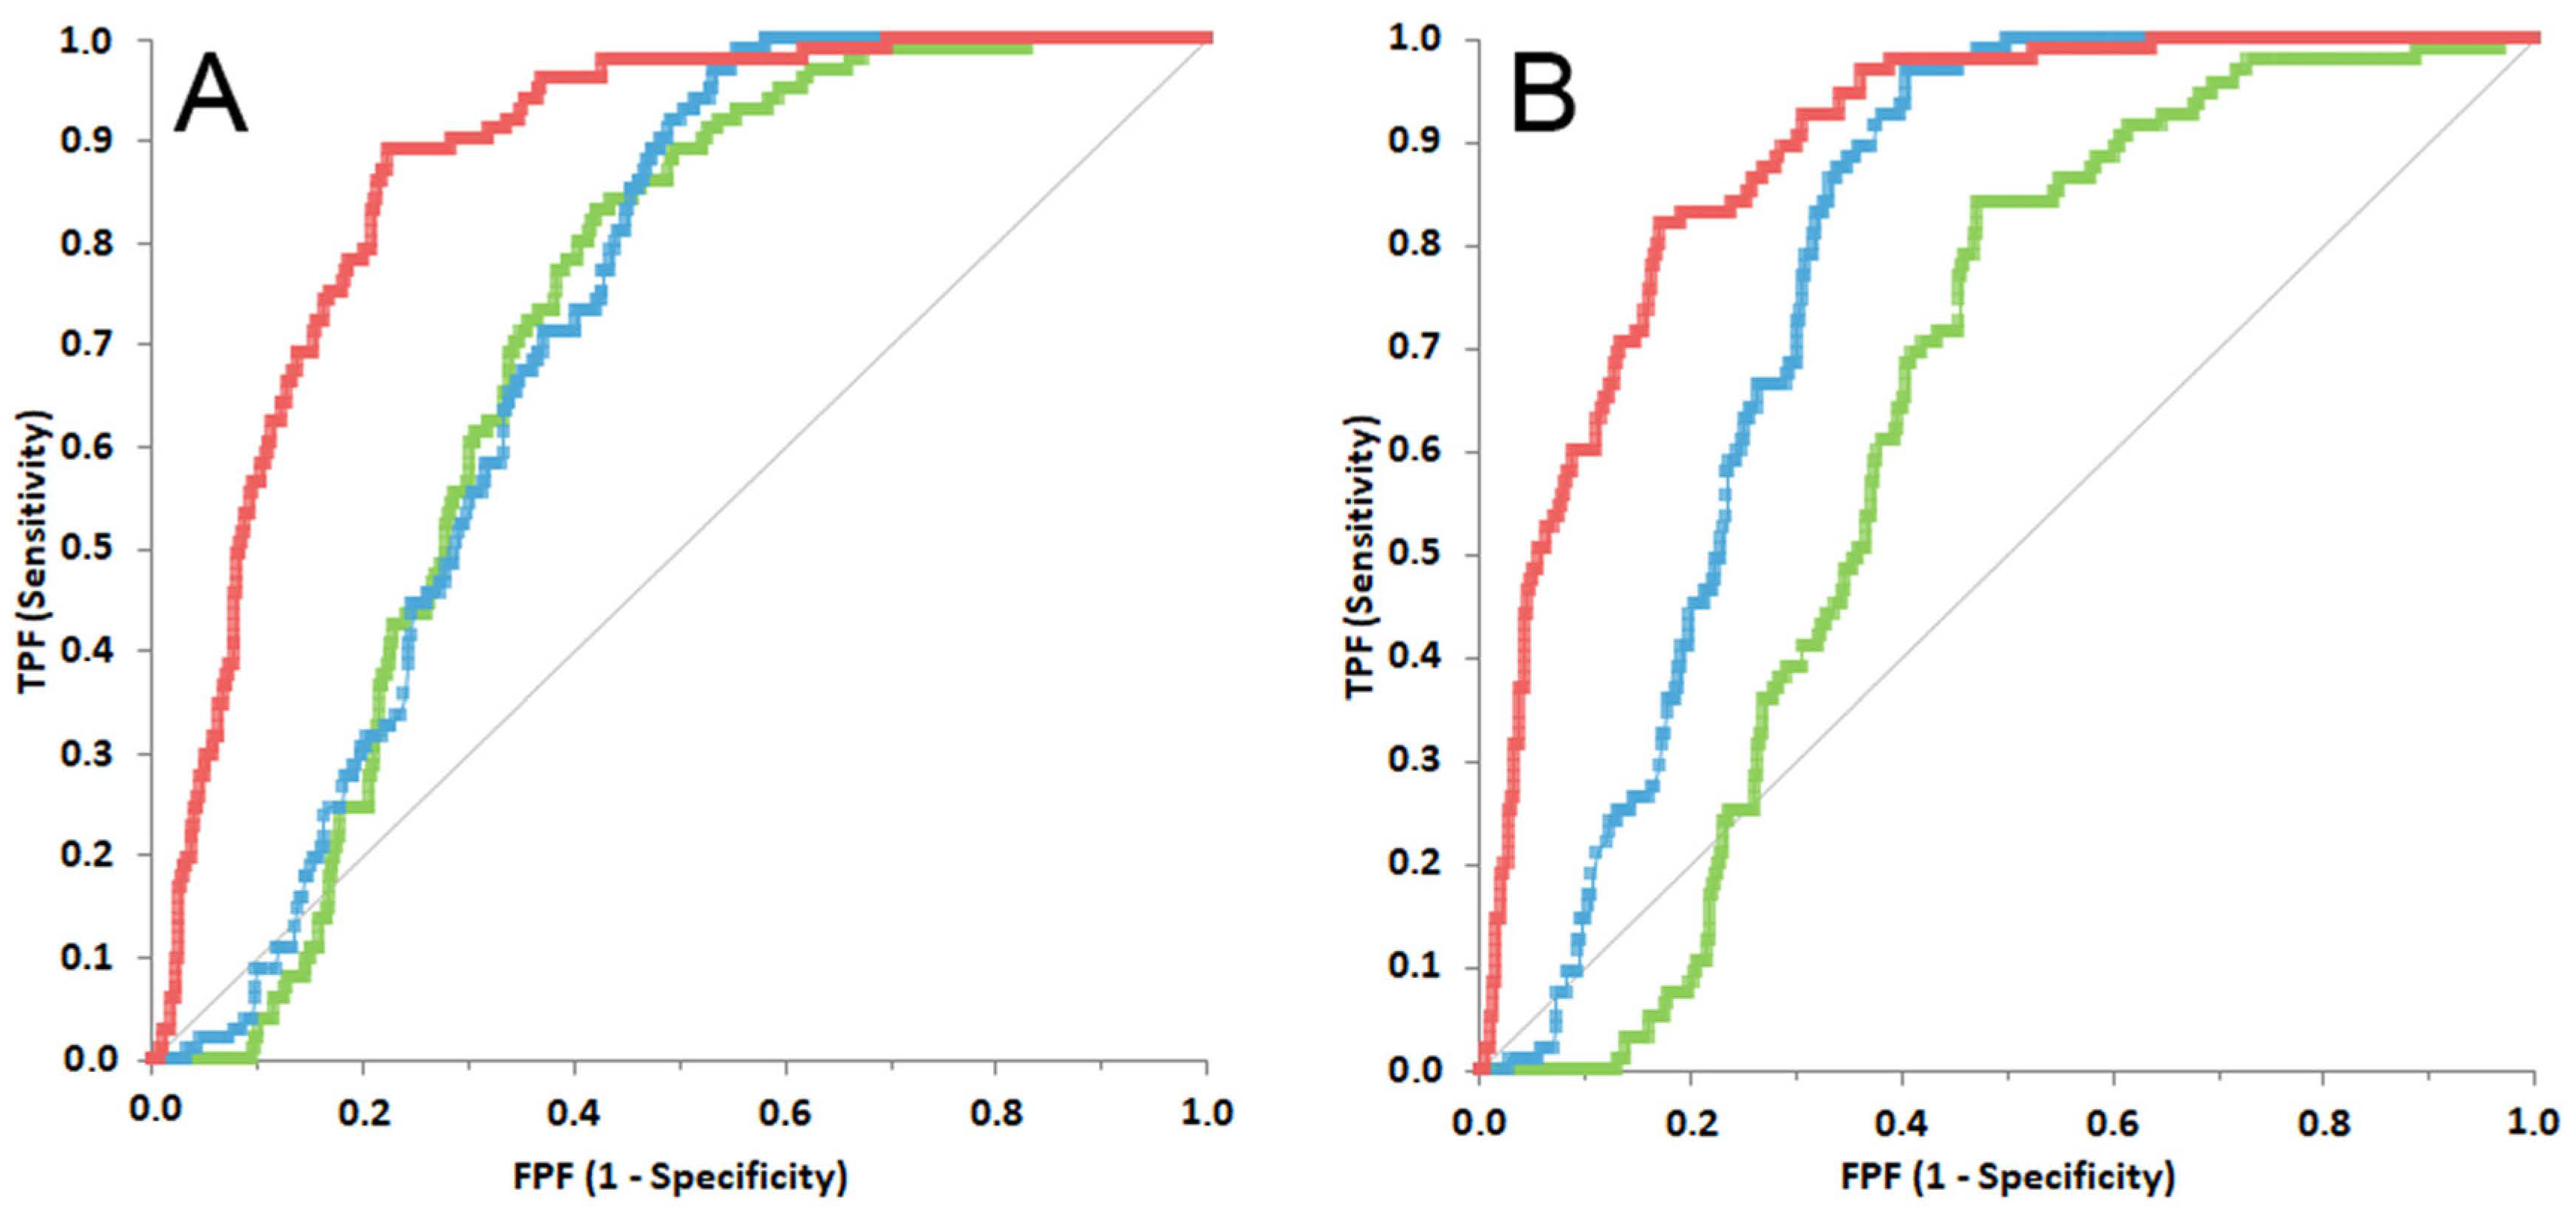
3.4. ROC Curve Analysis for Steps 2 and 3
4. Discussion
5. Conclusions
Author Contributions
Funding
Institutional Review Board Statement
Informed Consent Statement
Data Availability Statement
Conflicts of Interest
References
- Tasker, S. Diagnosis of feline infectious peritonitis: Update on evidence supporting available tests. J. Feline Med. Surg. 2018, 20, 228–243. [Google Scholar] [CrossRef]
- Pedersen, N.C. An update on feline infectious peritonitis: Diagnostics and therapeutics. Vet. J. 2014, 201, 133–141. [Google Scholar] [CrossRef]
- Paltrinieri, S.; Parodi, M.C.; Cammarata, G. In Vivo Diagnosis of Feline Infectious Peritonitis by Comparison of Protein Content, Cytology, and Direct Immunofluorescence Test on Peritoneal and Pleural Effusions. J. Vet. Diagn. Investig. 1999, 11, 358–361. [Google Scholar] [CrossRef] [PubMed]
- Valenciano, A.C.; Rizzi, T.E. Abdominal, Thoracic, and Pericardial Effusion. In Cowell and Tyler’s Diagnostic Cytology and Hematology of the Dog and Cat, 5th ed.; Mosby: St. Louis, MO, USA, 2014; pp. 229–246. [Google Scholar]
- Hartmann, K.; Binder, C.; Hirschberger, J.; Cole, D.; Reinacher, M.; Schroo, S.; Frost, J.; Egberink, H.; Lutz, H.; Hermanns, W. Comparison of Different Tests to Diagnose Feline Infectious Peritonitis. J. Vet. Intern. Med. 2003, 17, 781–790. [Google Scholar] [CrossRef] [PubMed]
- Fischer, Y.; Sauter-Louis, C.; Hartmann, K. Diagnostic accuracy of the Rivalta test for feline infectious peritonitis. Vet. Clin. Pathol. 2012, 41, 558–567. [Google Scholar] [CrossRef] [PubMed]
- Fischer, Y.; Weber, K.; Sauter-Louis, C.; Hartmann, K. The Rivalta’s Test as a Diagnostic Variable in Feline Effusions–Evaluation of Optimum Reaction and Storage Conditions. Tierarztl. Prax. Ausg. K Kleintiere Heimtiere 2013, 41, 297–303. [Google Scholar] [CrossRef] [PubMed]
- Giordano, A.; Stranieri, A.; Rossi, G.; Paltrinieri, S. High diagnostic accuracy of the Sysmex XT-2000iV delta total nucleated cells on effusions for feline infectious peritonitis. Vet. Clin. Pathol. 2015, 44, 295–302. [Google Scholar] [CrossRef] [PubMed]
- Stranieri, A.; Paltrinieri, S.; Giordano, A. Diagnosing feline infectious peritonitis using the Sysmex XT-2000iV based on frozen supernatants from cavitary effusions. J. Vet. Diagn. Investig. 2017, 29, 321–324. [Google Scholar] [CrossRef]
- Stranieri, A.; Giordano, A.; Paltrinieri, S.; Giudice, C.; Cannito, V.; Lauzi, S. Comparison of the performance of laboratory tests in the diagnosis of feline infectious peritonitis. J. Vet. Diagn. Investig. 2018, 30, 459–463. [Google Scholar] [CrossRef] [PubMed]
- Riemer, F.; Kuehner, K.A.; Ritz, S.; Sauter-Louis, C.; Hartmann, K. Clinical and Laboratory Features of Cats with Feline Infectious Peritonitis–a Retrospective Study of 231 Confirmed Cases (2000–2010). J. Feline Med. Surg. 2016, 18, 348–356. [Google Scholar] [CrossRef] [Green Version]
- Felten, S.; Weider, K.; Doenges, S.; Gruendl, S.; Matiasek, K.; Hermanns, W.; Mueller, E.; Matiasek, L.; Fischer, A.; Weber, K.; et al. Detection of feline coronavirus spike gene mutations as a tool to diagnose feline infectious peritonitis. J. Feline Med. Surg. 2017, 19, 321–335. [Google Scholar] [CrossRef]
- Doenges, S.J.; Weber, K.; Dorsch, R.; Fux, R.; Hartmann, K. Comparison of real-time reverse transcriptase polymerase chain reaction of peripheral blood mononuclear cells, serum and cell-free body cavity effusion for the diagnosis of feline infectious peritonitis. J. Feline Med. Surg. 2017, 19, 344–350. [Google Scholar] [CrossRef] [PubMed]
- Longstaff, L.; Porter, E.; Crossley, V.J.; Hayhow, S.E.; Helps, C.R.; Tasker, S. Feline Coronavirus Quantitative Reverse Transcriptase Polymerase Chain Reaction on Effusion Samples in Cats with and without Feline Infectious Peritonitis. J. Feline. Med. Surg. 2017, 19, 240–245. [Google Scholar] [CrossRef] [PubMed]
- Felten, S.; Leutenegger, C.M.; Balzer, H.-J.; Pantchev, N.; Matiasek, K.; Wess, G.; Egberink, H.; Hartmann, K. Sensitivity and specificity of a real-time reverse transcriptase polymerase chain reaction detecting feline coronavirus mutations in effusion and serum/plasma of cats to diagnose feline infectious peritonitis. BMC Vet. Res. 2017, 13, 228. [Google Scholar] [CrossRef] [PubMed]
- Günther, S.; Felten, S.; Wess, G.; Hartmann, K.; Weber, K. Detection of feline Coronavirus in effusions of cats with and without feline infectious peritonitis using loop-mediated isothermal amplification. J. Virol. Methods 2018, 256, 32–36. [Google Scholar] [CrossRef] [PubMed]
- Felten, S.; Hartmann, K. Diagnosis of Feline Infectious Peritonitis: A Review of the Current Literature. Viruses 2019, 11, 1068. [Google Scholar] [CrossRef]
- Hirschberger, J.; Sauer, U.G. Clinico-chemical study of body cavity effusions. Tierarztl. Prax. 1991, 19, 431–434. [Google Scholar]
- Zoia, A.; Slater, L.A.; Heller, J.; Connolly, D.J.; Church, D.B. A new approach to pleural effusion in cats: Markers for distinguishing transudates from exudates. J. Feline Med. Surg. 2009, 11, 847–855. [Google Scholar] [CrossRef]
- Smuts, C.; Mills, J.N.; Gaál, T. Transudate or exudate: Can lactate dehydrogenase activity in canine and feline effusions help to differentiate between the 2? Vet. Clin. Pathol. 2016, 45, 680–688. [Google Scholar] [CrossRef] [PubMed]
- Funk, D.; Neiger, R. Interpretation des Laktatdehydrogenasespiegels in Thoraxerguss und Aszites beim Hund. Schweiz. Arch. Tierheilkd. 2014, 156, 577–583. [Google Scholar] [CrossRef] [PubMed]
- Mercer, R.M.; Corcoran, J.P.; Porcel, J.M.; Rahman, N.M.; Psallidas, I. Interpreting pleural fluid results. Clin. Med. 2019, 19, 213–217. [Google Scholar] [CrossRef] [PubMed] [Green Version]
- Saint-Rémy, P.; Buret, J.; Radermecker, M. Significance of lactate dehydrogenases in pleural effusions. Rev. Pneumol. Clin. 1986, 42, 74–81. [Google Scholar]
- Stockham, S.L.; Scott, M.A. Cavitary effusion. In Fundamentals of Clinical Pathology, 2nd ed.; Blackwell: Iowa, IA, USA, 2008; pp. 832–865. [Google Scholar]
- Probo, M.; Valenti, V.; Venco, L.; Paltrinieri, S.; Lavergne, E.; Trumel, C.; Bertazzolo, W. Pleural lymphocyte-rich transudates in cats. J. Feline Med. Surg. 2018, 20, 767–771. [Google Scholar] [CrossRef] [PubMed]
- Dempsey, S.M.; Ewing, P.J. A Review of the Pathophysiology, Classification, and Analysis of Canine and Feline Cavitary Effusions. J. Am. Anim. Hosp. Assoc. 2011, 47, 1–11. [Google Scholar] [CrossRef] [PubMed]
- König, A.; Hartmann, K.; Mueller, R.S.; Wess, G.; Schulz, B.S. Retrospective analysis of pleural effusion in cats. J. Feline Med. Surg. 2019, 21, 1102–1110. [Google Scholar] [CrossRef]
- Athanasiou, L.V.; Spyropoulou, M.; Meichner, K. The laboratory diagnostic approach to thoracic and abdominal effusions in the dog, cat, and horse. J. Hell. Vet. Med. Soc. 2019, 70, 1589–1602. [Google Scholar] [CrossRef]
- Stranieri, A.; Giordano, A.; Bo, S.; Braghiroli, C.; Paltrinieri, S. Frequency of electrophoretic changes consistent with feline infectious peritonitis in two different time periods (2004–2009 vs 2013–2014). J. Feline Med. Surg. 2017, 19, 880–887. [Google Scholar] [CrossRef]
- Giordano, A.; Spagnolo, V.; Colombo, A.; Paltrinieri, S. Changes in some acute phase protein and immunoglobulin concentrations in cats affected by feline infectious peritonitis or exposed to feline coronavirus infection. Vet. J. 2004, 167, 38–44. [Google Scholar] [CrossRef]
- Hazuchova, K.; Held, S.; Neiger, R. Usefulness of acute phase proteins in differentiating between feline infectious peritonitis and other diseases in cats with body cavity effusions. J. Feline Med. Surg. 2017, 19, 809–816. [Google Scholar] [CrossRef]
- Gardner, I.A.; Greiner, M. Receiver-operating characteristic curves and likelihood ratios: Improvements over traditional methods for the evaluation and application of veterinary clinical pathology tests. Vet. Clin. Pathol. 2006, 35, 8–17. [Google Scholar] [CrossRef]
- Humm, K.; Hezzell, M.; Sargent, J.; Connolly, D.J.; Boswood, A. Differentiating between feline pleural effusions of cardiac and non-cardiac origin using pleural fluid NT-proBNP concentrations. J. Small Anim. Pract. 2013, 54, 656–661. [Google Scholar] [CrossRef] [PubMed]
- Alonso, F.H.; Behling-Kelly, E.; Borjesson, D.L. Lipoprotein profile of pleural and peritoneal transudates in dogs and cats. J. Vet. Intern. Med. 2022, 36, 464–472. [Google Scholar] [CrossRef] [PubMed]
- Da Cunha, N.P.; Giordano, A.; Caniatti, M.; Paltrinieri, S. Analytical validation of the Sysmex XT-2000iV for cell counts in canine and feline effusions and concordance with cytologic diagnosis. Vet. Clin. Pathol. 2009, 38, 230–241. [Google Scholar] [CrossRef]
- Bauer, N.; Moritz, A. Flow cytometric analysis of effusions in dogs and cats with the automated haematologyanalyser ADVIA 120. Vet. Rec. 2005, 156, 674–678. [Google Scholar] [CrossRef]
- Lee, S.M.; Williamson, K.; Weir, W.; Hulme-Moir, L.; Haining, H. Use of hyaluronidase in the comparison between manual and automated hematology analysis with the ADVIA 120 to improve analysis of feline body cavity effusions. J. Vet. Diagn. Investig. 2017, 29, 212–216. [Google Scholar] [CrossRef] [PubMed]
- Houle, J.C.; Chen, A.V.; Brenna, A.C.; Mealey, K.L.; Kiszonas, A.M. Determination of optimal storage temperature and duration for analysis of total and isoenzyme lactate dehydrogenase activities in canine serum and cerebrospinal fluid. Vet. Clin. Pathol. 2015, 44, 253–261. [Google Scholar] [CrossRef] [PubMed]
- Maher, I.; Tennant, K.V.; Papasouliotis, K. Effect of storage time on automated cell count and cytological interpretation of body cavity effusions. Vet. Rec. 2010, 167, 519–522. [Google Scholar] [CrossRef]
- Pedersen, N.C.; Perron, M.; Bannasch, M.; Montgomery, E.; Murakami, E.; Liepnieks, M.; Liu, H. Efficacy and safety of the nucleoside analog GS-441524 for treatment of cats with naturally occurring feline infectious peritonitis. J. Feline Med. Surg. 2019, 21, 271–281. [Google Scholar] [CrossRef]
- Krentz, D.; Zenger, K.; Alberer, M.; Felten, S.; Bergmann, M.; Dorsch, R.; Matiasek, K.; Kolberg, L.; Hofmann-Lehmann, R.; Meli, M.L.; et al. Curing Cats with Feline Infectious Peritonitis with an Oral Multi-Component Drug Containing GS-441524. Viruses 2021, 13, 2228. [Google Scholar] [CrossRef]


| Type of Effusion | Description |
|---|---|
| Pure transudate (protein-poor transudate) | Clear to yellow and transparent; low SG 1 (<1.015); Negligible/low protein content (<20 g/L); variably low cellularity (generally <1.5 × 10⁹/L); mixed cell population (mesothelial cells, rare neutrophils, macrophages, and/or lymphocytes) |
| Protein-rich transudate | Clear to yellow and transparent; SG >1.015); Moderate/high protein content (>20 g/L); variably low cellularity (<5.0 × 10⁹/L); mixed cell populations (mesothelial cells, variable amount of non-degenerated neutrophils, macrophages, and/or lymphocytes) |
| Lymphocyte-rich transudate | Clear to yellow and transparent; variable SG (1.015–1.030); variable protein content, low triglyceride content with a triglycerides/cholesterol ratio <1; variable cellularity; prevalent population of small lymphocytes without morphological abnormalities, lower amount of non-degenerated neutrophils, macrophages and mesothelial cells |
| Chylous | White to pink (milky) and turbid; variable SG; variable protein content; high triglyceride content (>1 g/L) or triglycerides/cholesterol ratio >1.0); variable cellularity; prevalent population of small lymphocytes, variable amount of foamy macrophages and neutrophils |
| Neoplastic | Variable gross appearance, SG and protein content; variably (moderate to high) cellularity; presence of atypical cells of various origin (mostly epithelial or lymphoid) |
| Hemorrhagic | Bloody appearance; variable SG; high protein content and cellularity; presence of blood cells possibly associated with rare mesothelial cells or macrophages |
| Non specific exudate | Yellowish, transparent to turbid, possibly with fibrin clots; high SG (>1.015); high protein content (>20 g/L); variable cellularity (>5 × 10⁹/L); prevalent population of neutrophils, mostly non degenerated, in the absence of bacteria, and variable amount of macrophages and lymphocytes |
| Septic | Yellowish to brownish, usually turbid, possibly with fibrin clots; high SG (>1.015); high protein content (>20 g/L); high cellularity (>5 × 10⁹/L); prevalent population of neutrophils, mostly degenerated, with phagocytosed bacteria, low number of macrophages and lymphocytes, possibly with scant amount of protein granules on the background |
| FIP | Yellowish, transparent, possibly with fibrin clots; high SG (>1.015); high protein content (>20 g/L) with albumin:globulin ratio <1.0; moderate to low cellularity (generally <5 × 10⁹/L); prevalent population of neutrophils, mostly non degenerated, in the absence of bacteria, and variable amount of macrophages and lymphocytes; presence of proteinaceous granular background |
| Effusion | Not FIP | Unlikely | Possible | Probable | Almost Confirmed |
|---|---|---|---|---|---|
| Hemorragic | All | ||||
| Neoplastic | All | ||||
| Septic | All | ||||
| Chylous | Typical milky appearance and high prevalence of small lymphocytes | Moderate milky appearance, low cellularity and presence of neutrophils along with lymphocytes and monocytes | |||
| Pure transudates | Very low cellularity | Moderate cellularity and predominance of neutrophils | |||
| Lymphocyte-rich transudates | High cellularity and almost absolute presence of lymphocytes | Low cellularity and moderate amount of neutrophils along with lymphocytes | |||
| Protein-rich transudates | Negligible cellularity | Low cellularity and low proportion of neutrophils (lower than mononuclear cells) | High cellularity and moderate proportion of neutrophils (similar to mononuclear cells) | High cellularity, high proportion of neutrophils (higher than mononuclear cells) and proteinaceous background | |
| Non Septic exudates | Moderate-high cellularity and low proportion of neutrophils compared with macrophages and lymphocytes | Moderate cellularity and prevalence of neutrophils without granular background | Moderate-low cellularity, prevalence of neutrophils and proteinaceous background | Moderate-low cellularity, prevalence of neutrophils and proteinaceous background, positive FCoV PCR | |
| FIP | FIP effusions with low amount of proteinaceous background or from old cats (>3 years) | Typical gross and cytologic appearance but without information on FCoV PCR or with negative FCoV PCR | Typical gross and cytologic appearance and positive FCoV PCR |
| Step 1: Groups Formed Based on Cytological and Chemico-Physical Analysis of the Effusion | Step 2: Probability of FIP Based Only on Cytological and Chemico-Physical Analysis of the Effusion | Step 3: Probability of FIP Based on Cytological and Chemico-Physical Analysis of the Effusion and on Additional Signalment or Laboratory Data | ||||||||||
|---|---|---|---|---|---|---|---|---|---|---|---|---|
| Classification | TOTAL | Not FIP | Unl | Pos | Prob | Almost conf | Not FIP | Unl | Pos | Prob | Almost conf | TOTAL |
| Chylous | 78 | 76 | 2 | 76 | 76 | |||||||
| FIP | 117 | 22 | 79 | 16 | 1 | 1 | 3 | 44 | 42 | 91 | ||
| Hemorragic | 17 | 17 | 17 | 17 | ||||||||
| Lymphocyte-rich transudate | 32 | 15 | 17 | 5 | 4 | 9 | ||||||
| Neoplastic | 120 | 120 | 120 | 120 | ||||||||
| Non septic exudate | 31 | 8 | 19 | 3 | 1 | 8 | 1 | 3 | 1 | 13 | ||
| Protein-rich transudate | 174 | 22 | 79 | 71 | 2 | 15 | 37 | 12 | 3 | 2 | 69 | |
| Septic | 64 | 64 | 64 | 65 | ||||||||
| Transudate | 15 | 10 | 5 | 10 | 1 | 1 | 11 | |||||
| TOTAL | 648 | 324 | 111 | 112 | 84 | 17 | 308 | 51 | 18 | 50 | 45 | 471 |
| Classification | H/C | SPE | PCR | Bact | FCoV | Cyto | Histo | Other | No Tests |
|---|---|---|---|---|---|---|---|---|---|
| Chylous | 24 | 20 | 3 | 52 | 5 | 2 | 11 | 16 | |
| FIP | 46 | 68 | 49 | 56 | 9 | 3 | 9 | 13 | |
| Hemorragic | 4 | 4 | 9 | 2 | 2 | 4 | |||
| Lymphocyte-rich transudate | 9 | 9 | 6 | 15 | 4 | 5 | 7 | ||
| Neoplastic | 28 | 32 | 5 | 55 | 18 | 15 | 38 | ||
| Non septic exudate | 7 | 11 | 14 | 16 | 3 | 1 | 2 | 18 | |
| Protein-rich transudate | 50 | 54 | 20 | 82 | 5 | 7 | 2 | 13 | 43 |
| Septic | 15 | 17 | 2 | 45 | 3 | 1 | 6 | 10 | |
| Transudate | 7 | 8 | 9 | 1 | 3 | 1 | |||
| TOTAL | 190 | 223 | 99 | 339 | 22 | 40 | 5 | 66 | 140 |
| Type of Effusion | LDH (U/L) | TNCC × 109/L | LDH/TNCC Ratio |
|---|---|---|---|
| Chylous (Ch) | 692 ± 877FIP,He,LRT,Npl,NSE,PRT,Se,Tr 387 (246–818) | 9.2 ± 12.1FIP,Npl,NSE,PRT,Se,Tr 6.2 (2.2–9.8) | 0.37 ± 1.63FIP,Npl,NSE,PRT,Tr 0.08 (0.03–0.18) |
| FIP | 3419 ± 3008Ch,He,LRT,PRT,Se,Tr 2211 (1314–4771) | 1.6 ± 1.1Ch,He,LRT,Npl,NSE,PRT,Se,Tr 1.3 (0.6–2.3) | 3.38 ± 3.70Ch,He,LRT,Npl,NSE,PRT,Se,Tr 2.01 (0.94–4.58) |
| Hemorragic (He) | 2027 ± 3842Ch,FIP,LRT,Npl,NSE,PRT,Se,Tr 908 (357–1724) | 10.7 ± 10.7FIP,PRT,Se,Tr 7.3 (4.5–13.3) | 0.22 ± 0.22FIP,LRT,PRT,Tr 0.15 (0.06–0.34) |
| Lymphocyte-rich transudate (LRT) | 844 ± 1607Ch,FIP,He,Npl,NS,Se,Tr 236 (131–465) | 10.1 ± 11.2FIP,Npl,NSE,PRT,Se,Tr 6.4 (2.6–12.0) | 0.10 ± 0.14FIP,He,Npl,NSE,PRT,Tr 0.05 (0.02–0.10) |
| Neoplastic (Npl) | 4628 ± 5502Ch,He,LRT,PRT,Se,Tr 2368 (996–5570) | 22.9 ± 27.0Ch,FIP,LRT,PRT,Se,Tr 12.9 (5.0–31.1) | 0.56 ± 1.39Ch,FIP,LRT,PRT,Se 0.21 (0.09–0.50) |
| Non septic exudate (NSE) | 4010 ± 6570Ch,He,LRT,PRT,Se,Tr 1673 (1038–3043) | 29.8 ± 71.4Ch.FIP.LRT,PRT,Se,Tr 7.9 (6.6–17.8) | 0.28 ± 0.47Ch,FIP,LRT,PRT,Se,Tr 0.15 (0.08–0.37) |
| Protein-rich transudate (PRT) | 698 ± 1145Ch,FIP,He,Npl.NSE,Se,Tr 286 (162–670) | 1.2 ± 1.1Ch.FIP.He,LRT,Npl,NSE,Se,Tr 0.9 (0.4–1.7) | 1.99 ± 5.38Ch,FIP,He,LRT,Npl,NSE,Se 0.42 (0.17–1.30) |
| Septic (Se) | 18861 ± 17,307Ch,FIP,He,LRT,Npl,NSE,PRT,Tr 15,786 (8403–26,868) | 217.6 ± 158.7Ch,FIP,He,LRT,Npl,NSE,PRT,Tr 218.7 (57.0–323.9) | 0.59 ± 3.00FIP,Npl,NSE,PRT,Tr 0.07 (0.04–0.12) |
| Transudate (Tr) | 366 ± 605Ch,FIP,He,LRT,Npl,NSE,PRT,Se 99 (57–358) | 0.7 ± 1.0Ch,FIP,He,LRT,Npl,NSE,PRT,Se 0.3 (0.2–0.8) | 0.88 ± 1.40Ch,FIP,He,LRT,NSE,Se 0.50 (0.23–0.89) |
| p < 0.001 | p < 0.001 | p < 0.001 |
| Probability of FIP | Step 2 | Step 3 | ||||
|---|---|---|---|---|---|---|
| LDH (U/L) | TNCC × 109/L | LDH/TNCC ratio | LDH (U/L) | TNCC × 109/L | LDH/TNCC ratio | |
| Not FIP | 5772 ± 10768Un,Pos,Pro 1204 (357–6052) | 54.8 ± 108.7Un,Pos,Pro,Conf 9.7 (3.3–37.4) | 0.57 ± 1.98Un,Pos,Pro,Conf 0.11 (0.06–0.33) | 6059 ± 10,968Un,Pos,Conf 1383 (398–7121) | 57.4 ± 110.9Un,Pos,Pro,Conf 10.1 (3.7–40.5) | 0.56 ± 1.97Un,Pos,Pro,Conf 0.12 (0.06–0.34) |
| Unlikely | 1010 ± 2991No,Pos,Pro,Conf 269 (139–849) | 7.5 ± 38.8No 1.2 (0.4–3.0) | 1.63 ± 4.93No,Pro,Conf 0.24 (0.10–0.61) | 813 ± 1473No,Pro,Conf 319 (182–845) | 4.3 ± 8.6No 1.4 (0.4–4.0) | 1.17 ± 4.54No,Pos,Pro,Conf 0.24 (0.13–0.50) |
| Possible | 1721 ± 2995No,Un,Pro,Conf 807 (234–1861) | 4.2 ± 10.21No 1.2 (0.5–2.6) | 1.66 ± 4.58No,Pro,Conf 0.47 (0.19–1.53) | 850 ± 1002No,Pro,Conf 415 (223–1208) | 1.7 ± 1.9No 0.8 (0.4–2.8) | 0.99 ± 1.19No,Un,Pro,Conf 0.69 (0.22–1.21) |
| Probable | 3491 ± 3143No,Un,Pos 2440 (1228–4771) | 1.7 ± 1.4No 1.2 (0.6–2.6) | 3.62 ± 4.08No,Un,Pos 1.99 (0.92–5.37) | 3223 ± 2979Un,Pos 2278 (1189–4432) | 2.1 ± 1.7No 1.5 (0.7–2.8) | 2.87 ± 3.85No,Un,Pos 1.26 (0.65–3.25) |
| A. confirmed | 3586 ± 2640Un,Pos 2437 (1700–4969) | 1.8 ± 1.4No 1.5 (1.0–2.1) | 2.96 ± 2.87No,Un,Pos 2.20 (1.00–3.30) | 3515 ± 3023No,Un,Pos 2092 (1474–5218) | 1.7 ± 1.4No 1.3 (0.8–2.3) | 3.20 ± 3.45No,Un,Pos 2.30 (0.87–3.72) |
| p < 0.001 | p < 0.001 | p < 0.001 | p < 0.001 | p < 0.001 | p < 0.001 | |
| Step of Analysis | Parameter | 100% Se | 100% Sp | Max LR+ | Youden Index | Equal Se and Sp | ||||||
|---|---|---|---|---|---|---|---|---|---|---|---|---|
| Cut-Off | LR+ | Index | Cut-Off | % Se | % Sp | Cut-Off | % Se | % Sp | ||||
| Step 2 | TNCC × 109/L | <6.7 | <0.1 | <2 | 1.92 | 0.438 | <5.0 | 97.0 | 46.8 | <1.6 | 65.3 | 65.4 |
| LDH (U/L) | >185 | >115,889 | >1615 | 2.04 | 0.411 | >1108 | 83.2 | 58 | >1679 | 66.3 | 66.2 | |
| LDH/TNCC ratio | >0.09 | >45.29 | >7.54 | 6.58 | 0.668 | >0.62 | 89.1 | 77.7 | >0.72 | 79.2 | 79.2 | |
| Step 3 | TNCC × 109/L | <7.9 | <0.1 | <3.0 | 2.60 | 0.564 | <5.2 | 96.8 | 59.6 | <2.5 | 69.5 | 70.0 |
| LDH (U/L) | >91 | >115,889 | >1108 | 1.79 | 0.371 | >1108 | 84.2 | 52.9 | >1815 | 61.1 | 60.9 | |
| LDH/TNCC ratio | >0.09 | >32.46 | >2.27 | 10.39 | 0.651 | >0.62 | 82.1 | 83.0 | >0.54 | 82.1 | 81.9 | |
Publisher’s Note: MDPI stays neutral with regard to jurisdictional claims in published maps and institutional affiliations. |
© 2022 by the authors. Licensee MDPI, Basel, Switzerland. This article is an open access article distributed under the terms and conditions of the Creative Commons Attribution (CC BY) license (https://creativecommons.org/licenses/by/4.0/).
Share and Cite
Romanelli, P.; Paltrinieri, S.; Bonfanti, U.; Castaman, M.G.; Monza, E.; Bertazzolo, W. Utility of the Ratio between Lactate Dehydrogenase (LDH) Activity and Total Nucleated Cell Counts in Effusions (LDH/TNCC Ratio) for the Diagnosis of Feline Infectious Peritonitis (FIP). Animals 2022, 12, 2262. https://doi.org/10.3390/ani12172262
Romanelli P, Paltrinieri S, Bonfanti U, Castaman MG, Monza E, Bertazzolo W. Utility of the Ratio between Lactate Dehydrogenase (LDH) Activity and Total Nucleated Cell Counts in Effusions (LDH/TNCC Ratio) for the Diagnosis of Feline Infectious Peritonitis (FIP). Animals. 2022; 12(17):2262. https://doi.org/10.3390/ani12172262
Chicago/Turabian StyleRomanelli, Pierpaolo, Saverio Paltrinieri, Ugo Bonfanti, Marco Graziano Castaman, Elisa Monza, and Walter Bertazzolo. 2022. "Utility of the Ratio between Lactate Dehydrogenase (LDH) Activity and Total Nucleated Cell Counts in Effusions (LDH/TNCC Ratio) for the Diagnosis of Feline Infectious Peritonitis (FIP)" Animals 12, no. 17: 2262. https://doi.org/10.3390/ani12172262
APA StyleRomanelli, P., Paltrinieri, S., Bonfanti, U., Castaman, M. G., Monza, E., & Bertazzolo, W. (2022). Utility of the Ratio between Lactate Dehydrogenase (LDH) Activity and Total Nucleated Cell Counts in Effusions (LDH/TNCC Ratio) for the Diagnosis of Feline Infectious Peritonitis (FIP). Animals, 12(17), 2262. https://doi.org/10.3390/ani12172262