
Effect of an Immunomodulatory Feed Additive in Mitigating the Stress Responses in Lactating Dairy Cows to a High Concentrate Diet Challenge

 , , ,
, , , 
Abstract
:Simple Summary
Abstract
1. Introduction
2. Materials and Methods
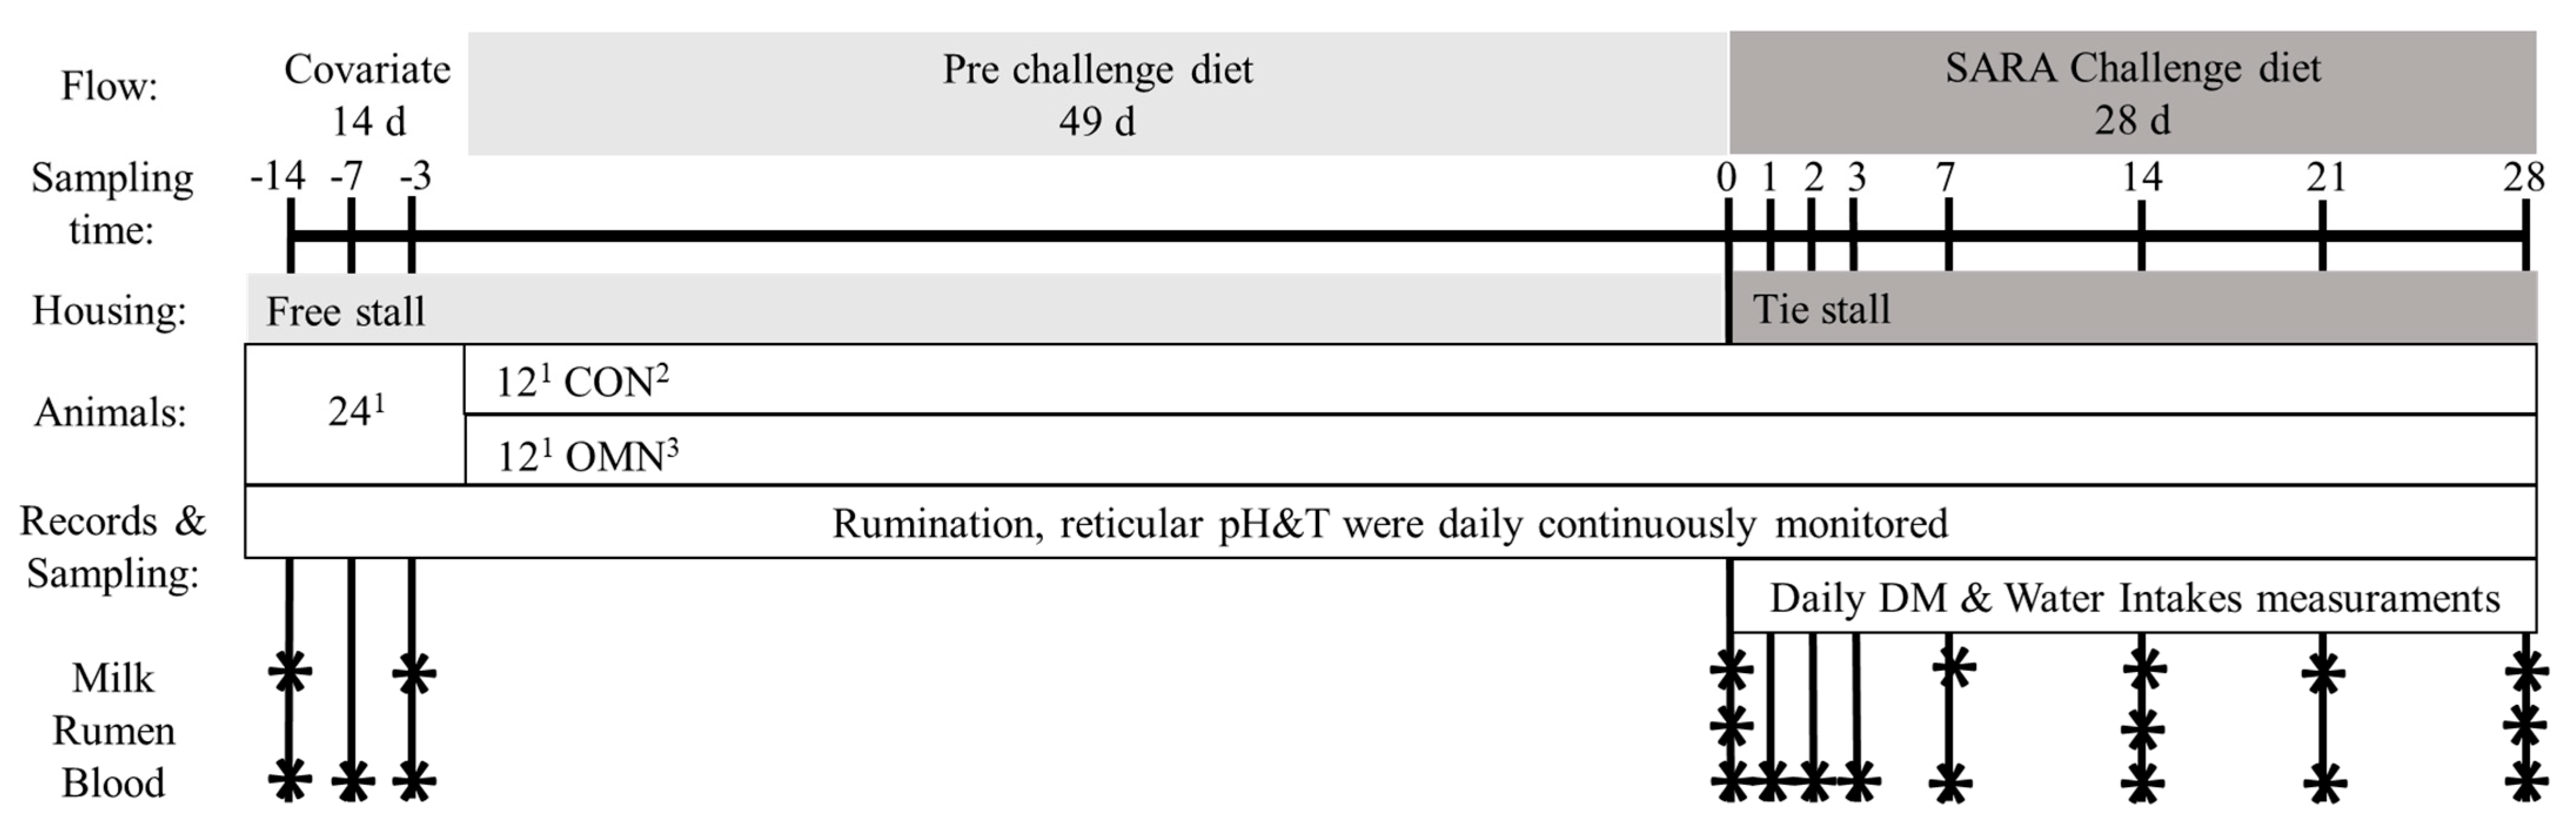
2.1. Experimental Design, Housing and Diets
2.2. Feed and Milk Sampling
2.3. Rumen Sampling and Measurements
2.4. Blood Sampling
2.5. Data Analysis
3. Results
3.1. Intake and Milk Production
3.2. Ruminal Parameters
3.3. Hematological, Metabolic, and Immunological Parameters
4. Discussion
5. Conclusions
Author Contributions
Funding
Institutional Review Board Statement
Data Availability Statement
Acknowledgments
Conflicts of Interest
References
- Collier, R.J.; Renquist, B.J.; Xiao, Y. A 100-Year Review: Stress physiology including heat stress. J. Dairy Sci. 2017, 100, 10367–10380. [Google Scholar] [CrossRef] [PubMed]
- Giammarco, M.; Fusaro, I.; Vignola, G.; Manetta, A.C.; Gramenzi, A.; Fustini, M.; Palmonari, A.; Formigoni, A. Effects of a single injection of Flunixin meglumine or Carprofen postpartum on haematological parameters, productive performance and fertility of dairy cattle. Anim. Prod. Sci. 2018, 58, 322. [Google Scholar] [CrossRef]
- Ferlizza, E. Preliminary Study on Urine Chemistry and Protein Profile in Cows and Heifers. Pak. Vet. J. 2020, 40, 413–418. [Google Scholar] [CrossRef]
- Mammi, L.M.E.; Cavallini, D.; Fustini, M.; Fusaro, I.; Giammarco, M.; Formigoni, A.; Palmonari, A. Calving difficulty influences rumination time and inflammatory profile in Holstein dairy cows. J. Dairy Sci. 2021, 104, 750–761. [Google Scholar] [CrossRef] [PubMed]
- Costa, A.; Egger-Danner, C.; Mészáros, G.; Fuerst, C.; Penasa, M.; Sölkner, J.; Fuerst-Waltl, B. Genetic associations of lactose and its ratios to other milk solids with health traits in Austrian Fleckvieh cows. J. Dairy Sci. 2019, 102, 4238–4248. [Google Scholar] [CrossRef]
- Formigoni, A.; Trevisi, E. Transition Cow: Interaction with Fertility. Veter-Res. Commun. 2003, 27, 143–152. [Google Scholar] [CrossRef]
- Fustini, M.; Galeati, G.; Gabai, G.; Mammi, L.E.; Bucci, D.; Baratta, M.; Accorsi, P.A.; Formigoni, A. Overstocking dairy cows during the dry period affects dehydroepiandrosterone and cortisol secretion. J. Dairy Sci. 2017, 100, 620–628. [Google Scholar] [CrossRef]
- Horst, E.A.; Kvidera, S.K.; Baumgard, L.H. Invited review: The influence of immune activation on transition cow health and performance—A critical evaluation of traditional dogmas. J. Dairy Sci. 2021, 104, 8380–8410. [Google Scholar] [CrossRef]
- Calsamiglia, S.; Blanch, M.; Ferret, A.; Moya, D. Is subacute ruminal acidosis a pH related problem? Causes and tools for its control. Anim. Feed. Sci. Technol. 2012, 172, 42–50. [Google Scholar] [CrossRef]
- Zebeli, Q.; Aschenbach, J.R.; Tafaj, M.; Boguhn, J.; Ametaj, B.N.; Drochner, W. Invited review: Role of physically effective fiber and estimation of dietary fiber adequacy in high-producing dairy cattle. J. Dairy Sci. 2012, 95, 1041–1056. [Google Scholar] [CrossRef]
- Humer, E.; Petri, R.M.; Aschenbach, J.R.; Bradford, B.J.; Penner, G.B.; Tafaj, M.; Südekum, K.-H.; Zebeli, Q. Invited review: Practical feeding management recommendations to mitigate the risk of subacute ruminal acidosis in dairy cattle. J. Dairy Sci. 2018, 101, 872–888. [Google Scholar] [CrossRef] [PubMed]
- Villot, C.; Meunier, B.; Bodin, J.; Martin, C.; Silberberg, M. Relative reticulo-rumen pH indicators for subacute ruminal acidosis detection in dairy cows. Animal 2018, 12, 481–490. [Google Scholar] [CrossRef] [PubMed]
- Kleen, J.L.; Hooijer, G.A.; Rehage, J.; Noordhuizen, J.P.T.M. Subacute Ruminal Acidosis (SARA): A Review. J. Vet. Med. Ser. A 2003, 50, 406–414. [Google Scholar] [CrossRef] [PubMed]
- Plaizier, J.C.; Li, S.; Tun, H.M.; Khafipour, E. Nutritional Models of Experimentally-Induced Subacute Ruminal Acidosis (SARA) Differ in Their Impact on Rumen and Hindgut Bacterial Communities in Dairy Cows. Front. Microbiol. 2017, 7, 2128. [Google Scholar] [CrossRef] [PubMed]
- Wu, Z.H.; Yu, Y.; Alugongo, G.M.; Xiao, J.X.; Li, J.H.; Li, Y.X.; Wang, Y.J.; Li, S.L.; Cao, Z.J. Short communication: Effects of an immunomodulatory feed additive on phagocytic capacity of neutrophils and relative gene expression in circulating white blood cells of transition Holstein cows. J. Dairy Sci. 2017, 100, 7549–7555. [Google Scholar] [CrossRef]
- Plaizier, J.C.; Krause, D.O.; Gozho, G.N.; McBride, B.W. Subacute ruminal acidosis in dairy cows: The physiological causes, incidence and consequences. Veter. J. 2008, 176, 21–31. [Google Scholar] [CrossRef]
- Khafipour, E.; Krause, D.O.; Plaizier, J.C. A grain-based subacute ruminal acidosis challenge causes translocation of lipopolysaccharide and triggers inflammation. J. Dairy Sci. 2009, 92, 1060–1070. [Google Scholar] [CrossRef]
- Minuti, A.; Ahmed, S.; Trevisi, E.; Piccioli-Cappelli, F.; Bertoni, G.; Jahan, N.; Bani, P. Experimental acute rumen acidosis in sheep: Consequences on clinical, rumen, and gastrointestinal permeability conditions and blood chemistry. J. Anim. Sci. 2014, 92, 3966–3977. [Google Scholar] [CrossRef]
- Ceciliani, F.; Ceron, J.J.; Eckersall, P.D.; Sauerwein, H. Acute phase proteins in ruminants. J. Proteom. 2012, 75, 4207–4231. [Google Scholar] [CrossRef]
- Zebeli, Q.; Ametaj, B.N. Linking rumen disorders to immunity in cattle: Old and new paradigms. Albanian J. Agric. Sci. 2013, 12, 57–60. [Google Scholar]
- Ingvartsen, K.L.; Moyes, K. Nutrition, immune function and health of dairy cattle. Animal 2013, 7, 112–122. [Google Scholar] [CrossRef] [PubMed]
- Sordillo, L.M. Nutritional strategies to optimize dairy cattle immunity. J. Dairy Sci. 2016, 99, 4967–4982. [Google Scholar] [CrossRef] [PubMed]
- Regolamento (UE) 2019/ del Parlamento Europeo e del Consiglio, dell’11 Dicembre 2018, Relativo ai Medicinali Veterinari e Che abroga la Direttiva 2001/82/C.E.125. Available online: https://eur-lex.europa.eu/legal-content/IT/TXT/PDF/?uri=CELEX:32019R0006&from=EN (accessed on 1 February 2022).
- Ryman, V.E.; Nickerson, S.C.; Kautz, F.M.; Hurley, D.J.; Ely, L.O.; Wang, Y.Q.; Forsberg, N.E. Effect of dietary supplementation on the antimicrobial activity of blood leukocytes isolated from Holstein heifers. Res. Vet. Sci. 2013, 95, 969–974. [Google Scholar] [CrossRef] [PubMed]
- Zhang, Y.; Guo, X.; Yang, H.; Shi, S. The Studies in Constructing Yeast Cell Factories for the Production of Fatty Acid Alkyl Esters. Front. Bioeng. Biotechnol. 2022, 9, 799032. [Google Scholar] [CrossRef]
- Brandão, A.P.; Cooke, R.F.; Schubach, K.M.; Marques, R.S. Physiologic and innate immunity responses to bacterial lipopolysaccharide administration in beef heifers supplemented with OmniGen-AF. Animal 2019, 13, 153–160. [Google Scholar] [CrossRef]
- Ortiz-Marty, R.J.; Lewandowski, A.; Chapman, J.D.; Kanevsky-Mullarky, I. A commercial immune modulating feed additive restores L-selectin and CCL5 expression following dexamethasone treatment of murine immune cells in a MyD88-dependent manner. J. Dairy Sci. 2017, 100, 6422–6428. [Google Scholar] [CrossRef]
- Fabris, T.F.; Laporta, J.; Corra, F.N.; Torres, Y.M.; Kirk, D.J.; McLean, D.J.; Chapman, J.D.; Dahl, G.E. Effect of nutritional immunomodulation and heat stress during the dry period on subsequent performance of cows. J. Dairy Sci. 2017, 100, 6733–6742. [Google Scholar] [CrossRef]
- Mezzetti, M.; Minuti, A.; Piccioli-Cappelli, F.; Gabai, G.; Trevisi, E. Administration of an Immune Stimulant during the Transition Period Improved Lipid Metabolism and Rumination without Affecting Inflammatory Status. Animals 2019, 9, 619. [Google Scholar] [CrossRef]
- Mammi, L.M.E.; Palmonari, A.; Fustini, M.; Cavallini, D.; Canestrari, G.; Chapman, J.D.; McLean, D.J.; Formigoni, A. Immunomodulant feed supplement to support dairy cows health and milk quality evaluated in Parmigiano Reggiano cheese production. Anim. Feed. Sci. Technol. 2018, 242, 21–30. [Google Scholar] [CrossRef]
- Palmonari, A.; Cavallini, D.; Sniffen, C.J.; Fernandes, L.; Holder, P.; Fagioli, L.; Fusaro, I.; Biagi, G.; Formigoni, A.; Mammi, L. Short communication: Characterization of molasses chemical composition. J. Dairy Sci. 2020, 103, 6244–6249. [Google Scholar] [CrossRef]
- Palmonari, A.; Cavallini, D.; Sniffen, C.J.; Fernandes, L.; Holder, P.; Fusaro, I.; Giammarco, M.; Formigoni, A.; Mammi, L.M.E. In vitro evaluation of sugar digestibility in molasses. Ital. J. Anim. Sci. 2021, 20, 571–577. [Google Scholar] [CrossRef]
- Hall, L.W.; Villar, F.; Chapman, J.D.; McLean, D.J.; Long, N.M.; Xiao, Y.; Collier, J.L.; Collier, R.J. An evaluation of an immunomodulatory feed ingredient in heat-stressed lactating Holstein cows: Effects on hormonal, physiological, and production responses. J. Dairy Sci. 2018, 101, 7095–7105. [Google Scholar] [CrossRef] [PubMed]
- Buonaiuto, G.; Cavallini, D.; Mammi, L.M.E.; Ghiaccio, F.; Palmonari, A.; Formigoni, A.; Visentin, G. The accuracy of NIRS in predicting chemical composition and fibre digestibility of hay-based total mixed rations. Ital. J. Anim. Sci. 2021, 20, 1730–1739. [Google Scholar] [CrossRef]
- Cavallini, D.; Mammi, L.M.E.; Fustini, M.; Palmonari, A.; Heinrichs, A.J.; Formigoni, A. Effects of ad libitum or restricted access to total mixed ration with supplemental long hay on production, intake, and rumination. J. Dairy Sci. 2018, 101, 10922–10928. [Google Scholar] [CrossRef]
- Fusaro, I.; Cavallini, D.; Giammarco, M.; Manetta, A.C.; Martuscelli, M.; Mammi, L.M.E.; Lanzoni, L.; Formigoni, A.; Vignola, G. Oxidative Status of Marchigiana Beef Enriched in n-3 Fatty Acids and Vitamin, E.; Treated With a Blend of Oregano and Rosemary Essential Oils. Front. Vet. Sci. 2021, 8, 662079. [Google Scholar] [CrossRef]
- Palmonari, A.; Canestrari, G.; Fustini, M.; Bonfante, E.; Mammi, L.; Formigoni, A. Using single or multiple liquor-donor cows for in vitro digestibility of amylase—and sodium sulfite-treated neutral detergent fiber with ash correction. J. Dairy Sci. 2016, 99, 9754–9758. [Google Scholar] [CrossRef]
- Palmonari, A.; Gallo, A.; Fustini, M.; Canestrari, G.; Masoero, F.; Sniffen, C.J.; Formigoni, A. Estimation of the indigestible fiber in different forage types. J. Anim. Sci. 2016, 94, 248–254. [Google Scholar] [CrossRef]
- Palmonari, A.; Canestrari, G.; Bonfante, E.; Fustini, M.; Mammi, L.; Formigoni, A. Technical note: In vitro digestibility of amylase-treated, ash-corrected neutral detergent fiber, with addition of sodium sulfite, at 240 hours with or without rumen fluid reinoculation. J. Dairy Sci. 2017, 100, 1200–1202. [Google Scholar] [CrossRef]
- Klevenhusen, F.; Pourazad, P.; Wetzels, S.U.; Qumar, M.; Khol-Parisini, A.; Zebeli, Q. Technical note: Evaluation of a real-time wireless pH measurement system relative to intraruminal differences of digesta in dairy cattle. J. Anim. Sci. 2014, 92, 5635–5639. [Google Scholar] [CrossRef]
- Humer, E.; Ghareeb, K.; Harder, H.; Mickdam, E.; Khol-Parisini, A.; Zebeli, Q. Peripartal changes in reticuloruminal pH and temperature in dairy cows differing in the susceptibility to subacute rumen acidosis. J. Dairy Sci. 2015, 98, 8788–8799. [Google Scholar] [CrossRef]
- Humer, E.; Khol-Parisini, A.; Gruber, L.; Gasteiner, J.; Abdel-Raheem, S.M.; Zebeli, Q. Long-term reticuloruminal pH dynamics and markers of liver health in early-lactating cows of various parities fed diets differing in grain processing. J. Dairy Sci. 2015, 98, 6433–6448. [Google Scholar] [CrossRef] [PubMed]
- Goetsch, A.L.; Galyean, M.L. Influence of Feeding Frequency on Passage of Fluid and Particulate Markers in Steers Fed a Concentrate Diet. Can. J. Anim. Sci. 1983, 63, 727–730. [Google Scholar] [CrossRef]
- Troìa, R.; Gruarin, M.; Grisetti, C.; Serafini, F.; Magna, L.; Monari, E.; Giunti, M.; Dondi, F. Fractional excretion of electrolytes in volume-responsive and intrinsic acute kidney injury in dogs: Diagnostic and prognostic implications. J. Vet. Intern. Med. 2018, 32, 1372–1382. [Google Scholar] [CrossRef] [PubMed]
- Monari, E.; Troìa, R.; Magna, L.; Gruarin, M.; Grisetti, C.; Fernandez, M.; Balboni, A.; Giunti, M.; Dondi, F. Urine neutrophil gelatinase-associated lipocalin to diagnose and characterize acute kidney injury in dogs. J. Vet. Intern. Med. 2020, 34, 176–185. [Google Scholar] [CrossRef]
- Calamari, L.; Ferrari, A.; Minuti, A.; Trevisi, E. Assessment of the main plasma parameters included in a metabolic profile of dairy cow based on Fourier Transform mid-infrared spectroscopy: Preliminary results. BMC Vet. Res. 2016, 12, 4. [Google Scholar] [CrossRef]
- Jacometo, C.B.; Osorio, J.S.; Socha, M.; Corrêa, M.N.; Piccioli-Cappelli, F.; Trevisi, E.; Loor, J.J. Maternal consumption of organic trace minerals alters calf systemic and neutrophil mRNA and microRNA indicators of inflammation and oxidative stress. J. Dairy Sci. 2015, 98, 7717–7729. [Google Scholar] [CrossRef]
- Bionaz, M.; Trevisi, E.; Calamari, L.; Librandi, F.; Ferrari, A.; Bertoni, G. Plasma Paraoxonase, Health, Inflammatory Conditions, and Liver Function in Transition Dairy Cows. J. Dairy Sci. 2007, 90, 1740–1750. [Google Scholar] [CrossRef]
- Zebeli, Q.; Dijkstra, J.; Tafaj, M.; Steingass, H.; Ametaj, B.N.; Drochner, W. Modeling the Adequacy of Dietary Fiber in Dairy Cows Based on the Responses of Ruminal pH and Milk Fat Production to Composition of the Diet. J. Dairy Sci. 2008, 91, 2046–2066. [Google Scholar] [CrossRef]
- Buonaiuto, G.; Palmonari, A.; Ghiaccio, F.; Visentin, G.; Cavallini, D.; Campidonico, L.; Formigoni, A.; Mammi, L.M.E. Effects of complete replacement of corn flour with sorghum flour in dairy cows fed Parmigiano Reggiano dry hay-based ration. Ital. J. Anim. Sci. 2021, 20, 826–833. [Google Scholar] [CrossRef]
- Cavallini, D.; Mammi, L.M.E.; Biagi, G.; Fusaro, I.; Giammarco, M.; Formigoni, A.; Palmonari, A. Effects of 00-rapeseed meal inclusion in Parmigiano Reggiano hay-based ration on dairy cows’ production, reticular pH and fibre digestibility. Ital. J. Anim. Sci. 2021, 20, 295–303. [Google Scholar] [CrossRef]
- Fustini, M.; Palmonari, A.; Bucchi, E.; Heinrichs, A.J.; Formigoni, A. Chewing and ruminating with various forage qualities in nonlactating dairy cows. Prof. Anim. Sci. 2011, 27, 352–356. [Google Scholar] [CrossRef]
- Fustini, M.; Palmonari, A.; Canestrari, G.; Bonfante, E.; Mammi, L.; Pacchioli, M.T.; Sniffen, G.C.J.; Grant, R.J.; Cotanch, K.W.; Formigoni, A. Effect of undigested neutral detergent fiber content of alfalfa hay on lactating dairy cows: Feeding behavior, fiber digestibility, and lactation performance. J. Dairy Sci. 2017, 100, 4475–4483. [Google Scholar] [CrossRef] [PubMed]
- Heinrichs, A.J.; Heinrichs, B.S.; Cavallini, D.; Fustini, M.; Formigoni, A. Limiting total mixed ration availability alters eating and rumination patterns of lactating dairy cows. JDS Commun. 2021, 2, 186–190. [Google Scholar] [CrossRef]
- Cavallini, D.; Mammi, L.M.E.; Buonaiuto, G.; Palmonari, A.; Valle, E.; Formigoni, A. Immune-metabolic-inflammatory markers in Holstein cows exposed to a nutritional and environmental stressing challenge. J. Anim. Physiol. Anim. Nutr. 2021, 105, 42–55. [Google Scholar] [CrossRef]
- DeVries, T.J.; Beauchemin, K.A.; Dohme, F.; Schwartzkopf-Genswein, K.S. Repeated ruminal acidosis challenges in lactating dairy cows at high and low risk for developing acidosis: Feeding, ruminating, and lying behavior. J. Dairy Sci. 2009, 92, 5067–5078. [Google Scholar] [CrossRef]
- Moretti, R.; Biffani, S.; Tiezzi, F.; Maltecca, C.; Chessa, S.; Bozzi, R. Rumination time as a potential predictor of common diseases in high-productive Holstein dairy cows. J. Dairy Res. 2017, 84, 385–390. [Google Scholar] [CrossRef]
- Falk, M.; Münger, A.; Dohme-Meier, F. Technical note: A comparison of reticular and ruminal pH monitored continuously with 2 measurement systems at different weeks of early lactation. J. Dairy Sci. 2016, 99, 1951–1955. [Google Scholar] [CrossRef]
- Mensching, A.; Bünemann, K.; Meyer, U.; von Soosten, D.; Hummel, J.; Schmitt, A.O.; Sharifi, A.R.; Dänicke, S. Modeling reticular and ventral ruminal pH of lactating dairy cows using ingestion and rumination behavior. J. Dairy Sci. 2020, 103, 7260–7275. [Google Scholar] [CrossRef]
- Duffield, T.; Plaizier, J.C.; Fairfield, A.; Bagg, R.; Vessie, G.; Dick, P.; Wilson, J.; Aramini, J.; McBride, B. Comparison of Techniques for Measurement of Rumen pH in Lactating Dairy Cows. J. Dairy Sci. 2004, 87, 59–66. [Google Scholar] [CrossRef]
- Sahar, M.W.; Beaver, A.; von Keyserlingk, M.A.G.; Weary, D.M. Predicting Disease in Transition Dairy Cattle Based on Behaviors Measured Before Calving. Animals 2020, 10, 928. [Google Scholar] [CrossRef]
- Trevisi, E.; Minuti, A. Assessment of the innate immune response in the periparturient cow. Res. Vet. Sci. 2018, 116, 47–54. [Google Scholar] [CrossRef] [PubMed]
- De Nardi, R.; Marchesini, G.; Plaizier, J.C.; Li, S.; Khafipour, E.; Ricci, R.; Andrighetto, I.; Segato, S. Use of dicarboxylic acids and polyphenols to attenuate reticular pH drop and acute phase response in dairy heifers fed a high grain diet. BMC Vet. Res. 2014, 10, 277. [Google Scholar] [CrossRef] [PubMed]
- Zebeli, Q.; Metzler-Zebeli, B.U. Interplay between rumen digestive disorders and diet-induced inflammation in dairy cattle. Res. Vet. Sci. 2012, 93, 1099–1108. [Google Scholar] [CrossRef] [PubMed]
- Trevisi, E.; Riva, F.; Filipe, J.F.S.; Massara, M.; Minuti, A.; Bani, P.; Amadori, M. Innate immune responses to metabolic stress can be detected in rumen fluids. Res. Vet. Sci. 2018, 117, 65–73. [Google Scholar] [CrossRef]
- Roche, M.; Rondeau, P.; Singh, N.R.; Tarnus, E.; Bourdon, E. The antioxidant properties of serum albumin. FEBS Lett. 2008, 582, 1783–1787. [Google Scholar] [CrossRef]
- Mayasari, N.; Trevisi, E.; Ferrari, A.; Kemp, B.; Parmentier, H.K.; van Knegsel, A.T.M. Relationship between inflammatory biomarkers and oxidative stress with uterine health in dairy cows with different dry period lengths1. Transl. Anim. Sci. 2019, 3, 607–619. [Google Scholar] [CrossRef]
- Bertoni, G.; Trevisi, E. Use of the Liver Activity Index and Other Metabolic Variables in the Assessment of Metabolic Health in Dairy Herds. Vet. Clin. N. Am. Food Anim. Pract. 2013, 29, 413–431. [Google Scholar] [CrossRef]
- Hoffman, R.; Benz, E.J.; Silberstein, L.E.; Heslop, H.E.; Weitz, J.I.; Anastasi, J.; Salama, M.E. Hematology Basic Principles and Practice, 7th ed.; Elsevier: Philadelphia, PA, USA, 2017; p. 19103-2899. ISBN 978-0-323-35762-3. [Google Scholar]
- Armstrong, S.A.; McLean, D.J.; Bobe, G. The effect of a commercial feed additive on the immune-metabolic axis, liver function and predicted carcass quality in purebred Angus steers. Livest. Sci. 2018, 210, 39–46. [Google Scholar] [CrossRef]
- Wang, Y.; Puntenney, S.B.; Burton, J.L.; Forsberg, N.E. Ability of a commercial feed additive to modulate expression of innate immunity in sheep immunosuppressed with dexamethasone. Animal 2007, 1, 945–951. [Google Scholar] [CrossRef]
- Playford, M.; Dawson, K.; Playford, S.; Smith, A.; Page, S.; Collins, K.; Forsberg, N. Effect of an immunomodulatory feed additive on markers of immunity in pasture-fed dairy cows. Aust. Vet. J. 2014, 92, 479–481. [Google Scholar] [CrossRef]
- Nace, E.L.; Nickerson, S.C.; Kautz, F.M.; Breidling, S.; Wochele, D.; Ely, L.O.; Hurley, D.J. Modulation of innate immune function and phenotype in bred dairy heifers during the periparturient period induced by feeding an immunostimulant for 60 days prior to delivery. Vet. Immunol. Immunopathol. 2014, 161, 240–250. [Google Scholar] [CrossRef] [PubMed]
- Brandão, A.P.; Cooke, R.F.; Corrá, F.N.; Piccolo, M.B.; Gennari, R.; Leiva, T.; Vasconcelos, J.L.M. Physiologic, health, and production responses of dairy cows supplemented with an immunomodulatory feed ingredient during the transition period. J. Dairy Sci. 2016, 99, 5562–5572. [Google Scholar] [CrossRef] [PubMed]
- Wang, Y.-Q.; Puntenney, S.B.; Burton, J.L.; Forsberg, N.E. Use of gene profiling to evaluate the effects of a feed additive on immune function in periparturient dairy cattle. J. Anim. Physiol. Anim. Nutr. 2009, 93, 66–75. [Google Scholar] [CrossRef]
- Carroll, J.A.; Forsberg, N.E. Influence of Stress and Nutrition on Cattle Immunity. Vet. Clin. N. Am. Food Anim. Pract. 2007, 23, 105–149. [Google Scholar] [CrossRef] [PubMed]
- Guo, J.; Xu, L.; Khalouei, H.; Fehr, K.; Senaratne, V.; Ghia, J.E.; Yoon, I.; Khafipour, E.; Plaizier, J.C. Saccharomyces cerevisiae fermentation products reduce bacterial endotoxin concentrations and inflammation during grain-based subacute ruminal acidosis in lactating dairy cows. J. Dairy Sci. 2022, 105, 2354–2368. [Google Scholar] [CrossRef] [PubMed]
- Wu, Z.; Alugongo, G.M.; Xiao, J.; Li, J.; Yu, Y.; Li, Y.; Wang, Y.; Li, S.; Cao, Z. Effects of an immunomodulatory feed additive on body weight, production parameters, blood metabolites, and health in multiparous transition Holstein cows. Anim. Sci. J. 2019, 90, 167–177. [Google Scholar] [CrossRef]
- Gomez, D.E.; Galvão, K.N.; Rodriguez-Lecompte, J.C.; Costa, M.C. The Cattle Microbiota and the Immune System. Vet. Clin. N. Am. Food Anim. Pract. 2019, 35, 485–505. [Google Scholar] [CrossRef]
- Benedet, A.; Costa, A.; de Marchi, M.; Penasa, M. Heritability estimates of predicted blood β-hydroxybutyrate and nonesterified fatty acids and relationships with milk traits in early-lactation Holstein cows. J. Dairy Sci. 2020, 103, 6354–6363. [Google Scholar] [CrossRef]
- Rodriguez-Jimenez, S.; Haerr, K.J.; Trevisi, E.; Loor, J.J.; Cardoso, F.C.; Osorio, J.S. Prepartal standing behavior as a parameter for early detection of postpartal subclinical ketosis associated with inflammation and liver function biomarkers in peripartal dairy cows. J. Dairy Sci. 2018, 101, 8224–8235. [Google Scholar] [CrossRef]
- Benzie, I.F.F.; Strain, J.J. The Ferric Reducing Ability of Plasma (FRAP) as a Measure of “Antioxidant Power”: The FRAP Assay. Anal. Biochem. 1996, 239, 70–76. [Google Scholar] [CrossRef]

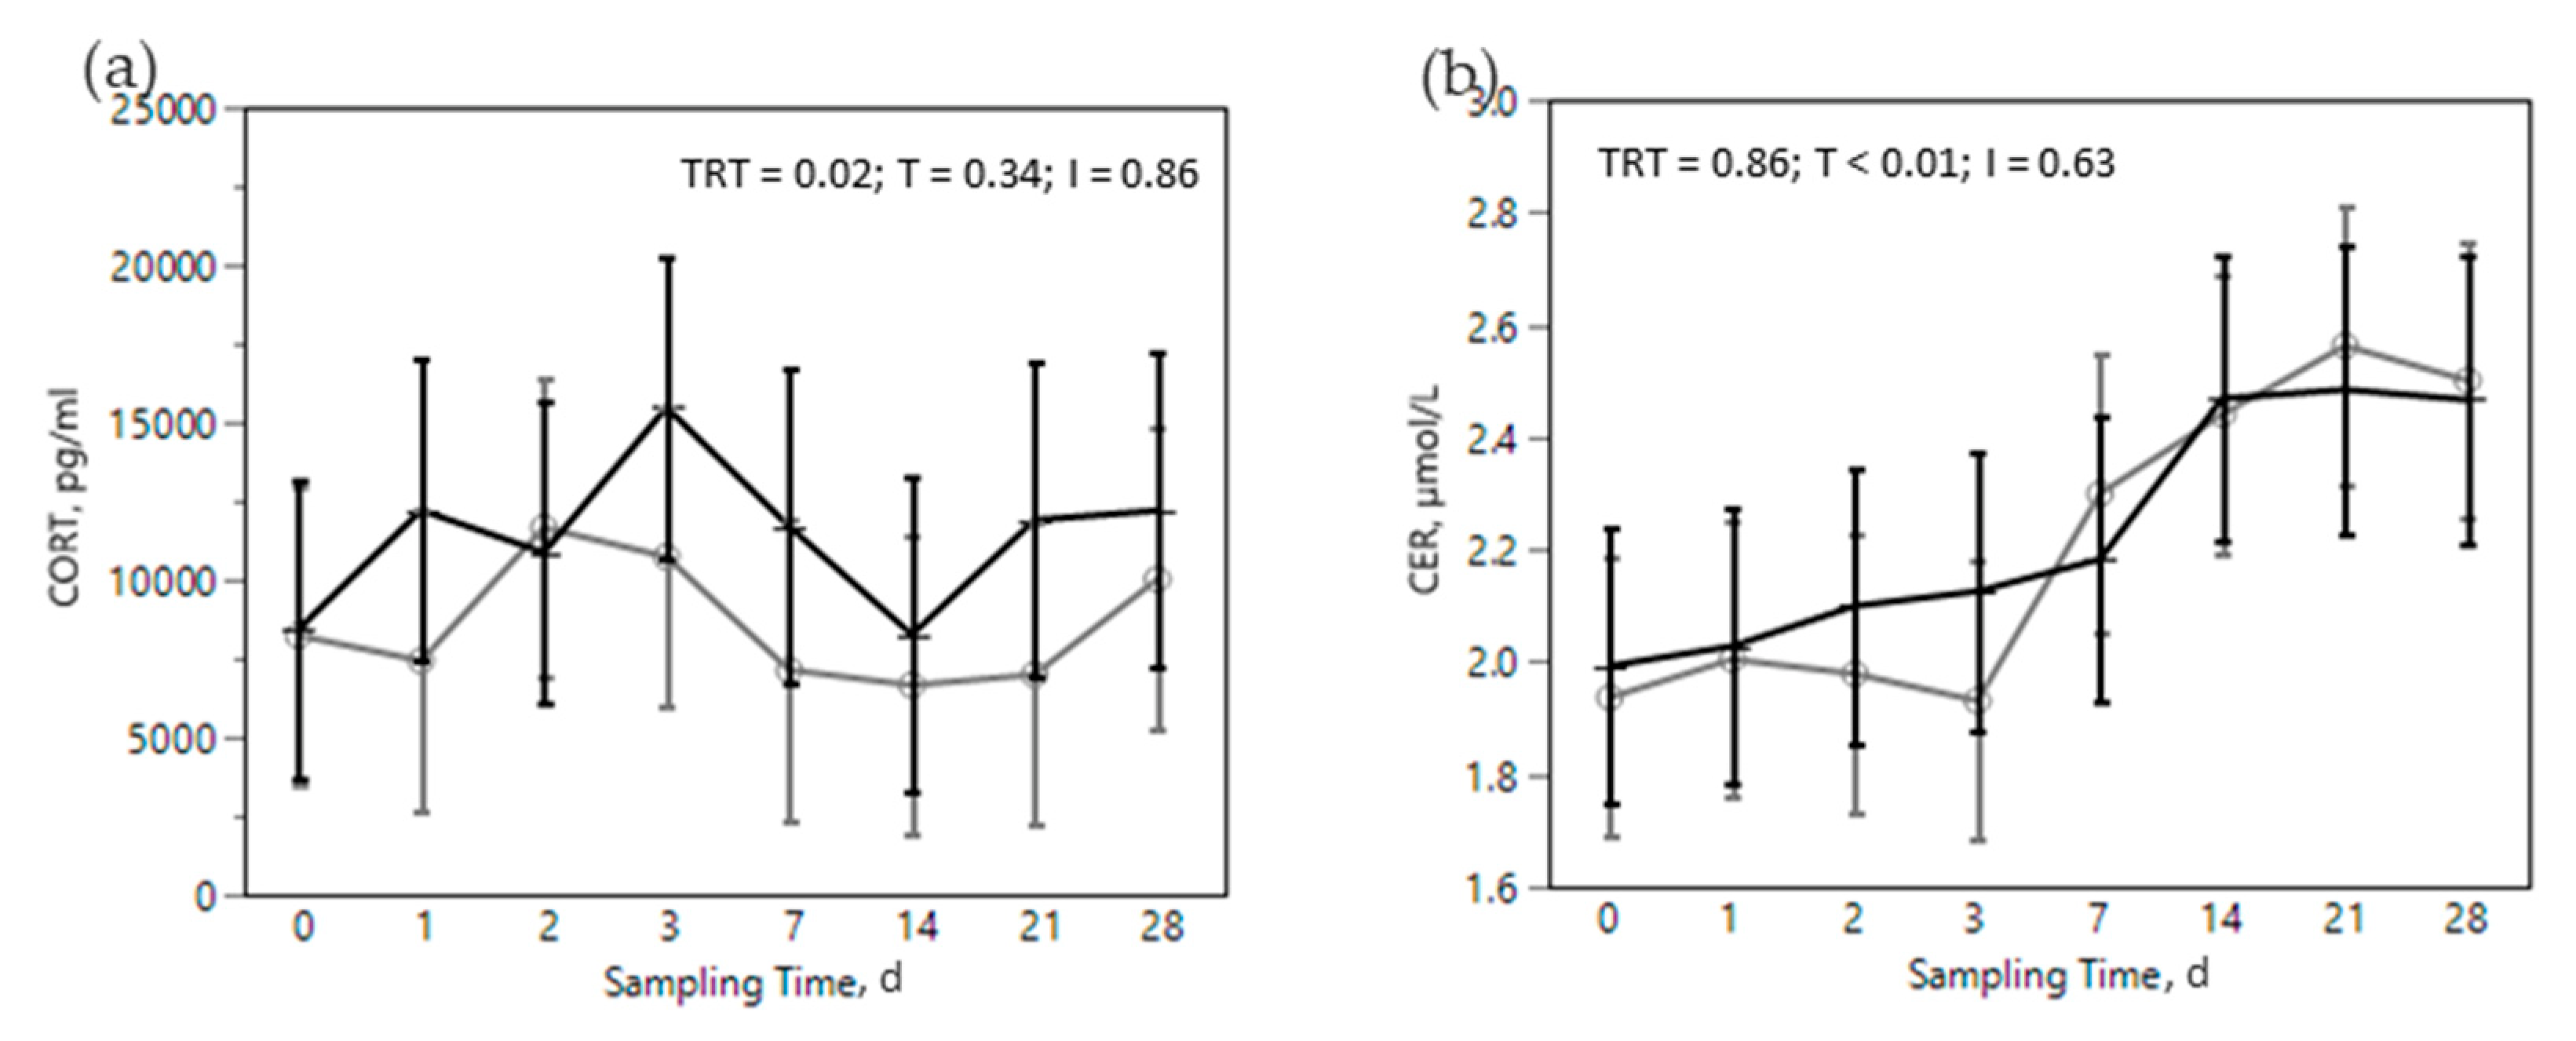
 ) or OMN 2 (
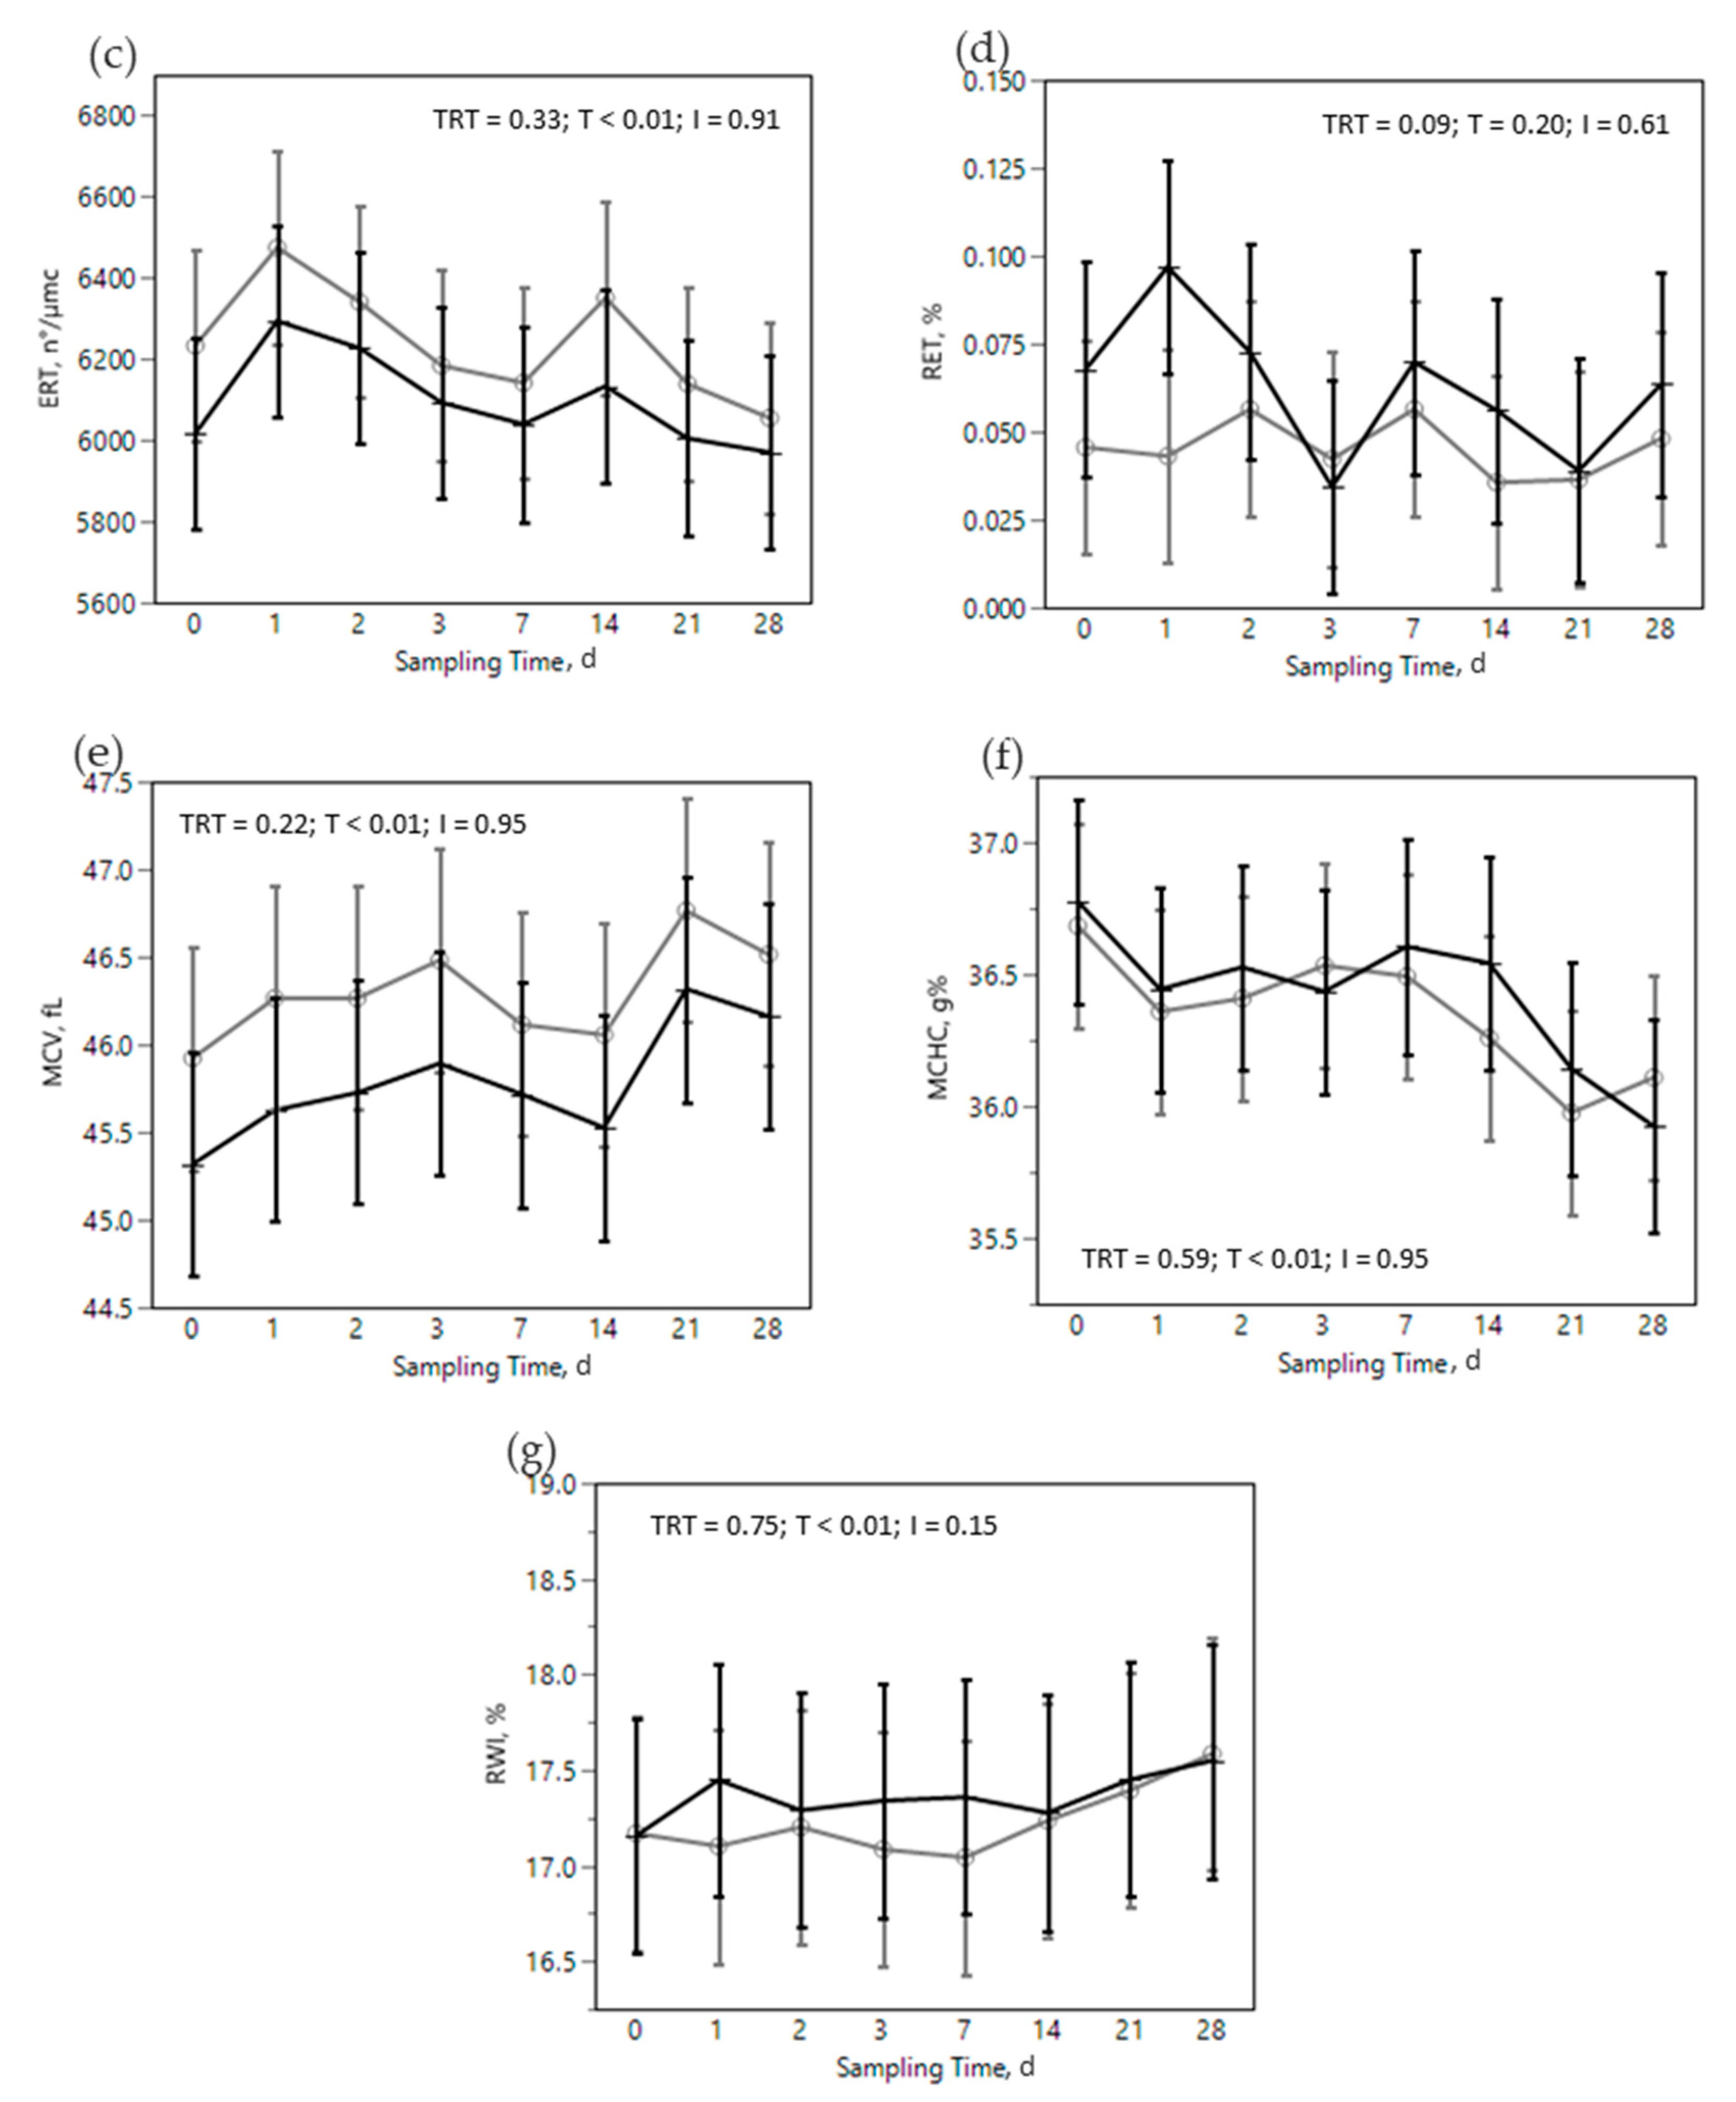
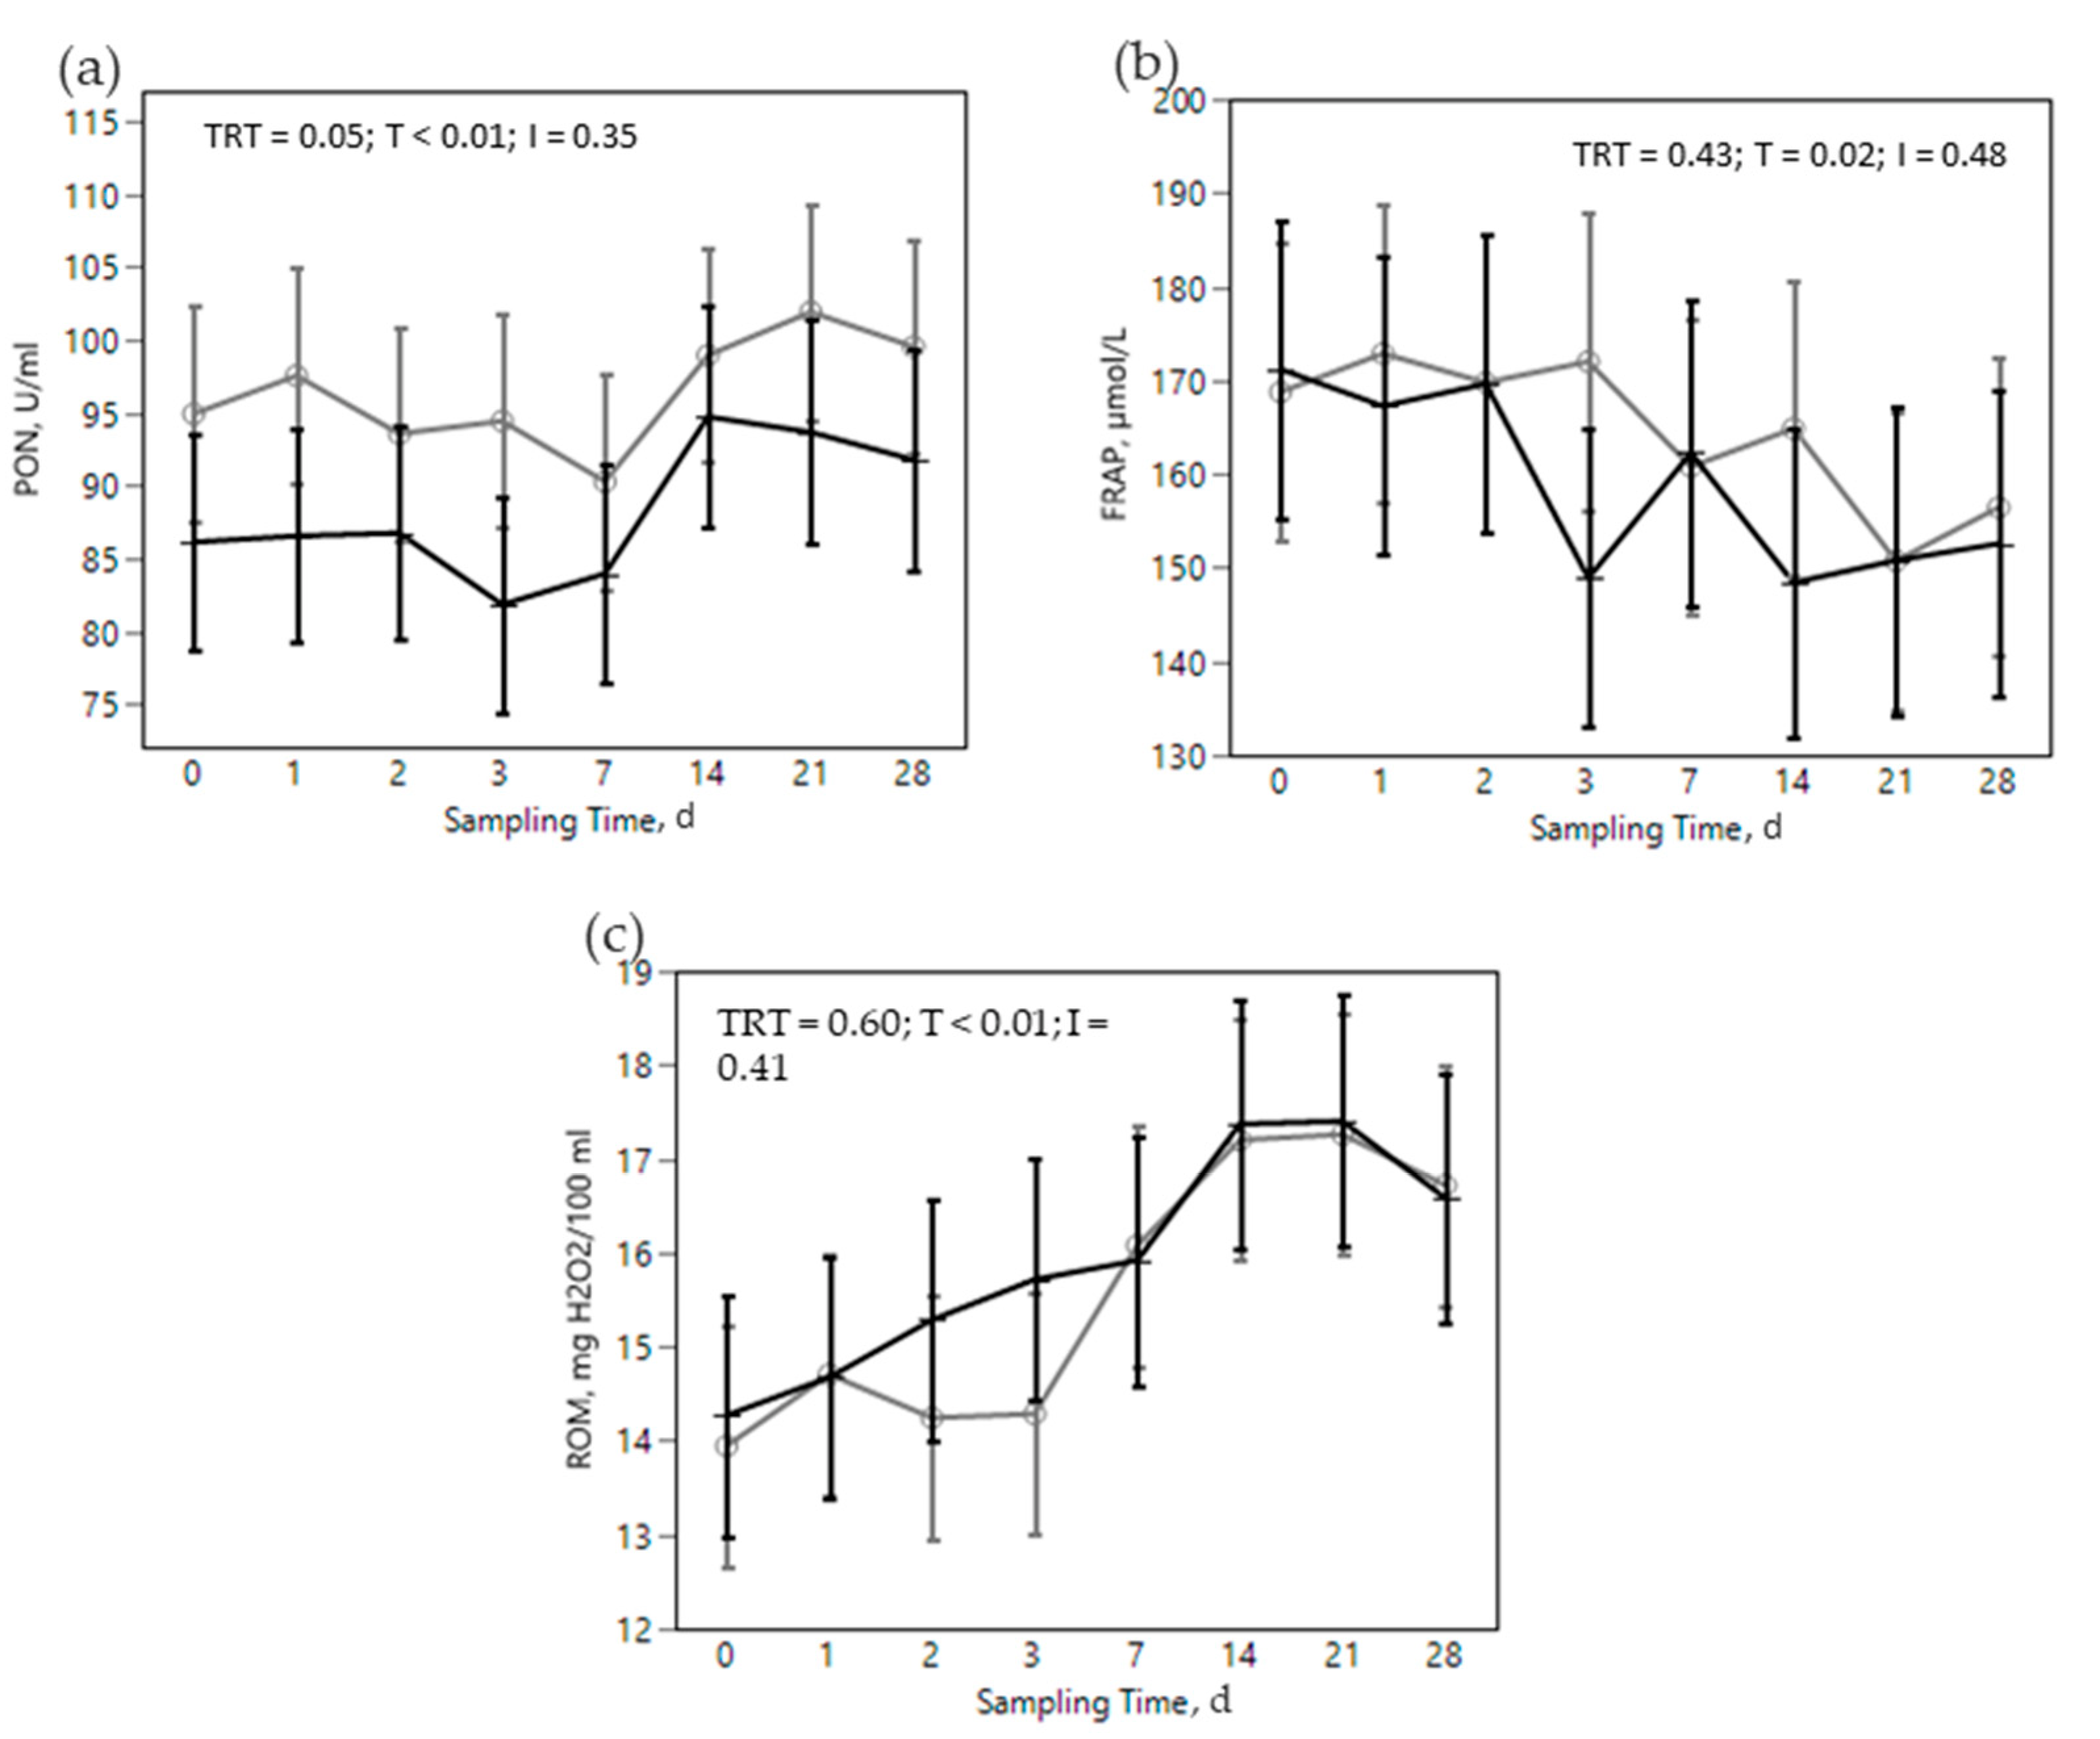
  ) treatments during the SARA challenge. 1 Control group. 2 Treated group (cows receiving OmniGen-AF, 55g/d). TRT: treatment p-value effect; T: time p-value effect; I: interaction TRT x T p-value effect.
) or OMN 2 ( ) treatments during the SARA challenge. 1 Control group. 2 Treated group (cows receiving OmniGen-AF, 55g/d). TRT: treatment p-value effect; T: time p-value effect; I: interaction TRT x T p-value effect.
) treatments during the SARA challenge. 1 Control group. 2 Treated group (cows receiving OmniGen-AF, 55g/d). TRT: treatment p-value effect; T: time p-value effect; I: interaction TRT x T p-value effect.
) or OMN 2 ( ) treatments during the SARA challenge. 1 Control group. 2 Treated group (cows receiving OmniGen-AF, 55g/d). TRT: treatment p-value effect; T: time p-value effect; I: interaction TRT x T p-value effect.
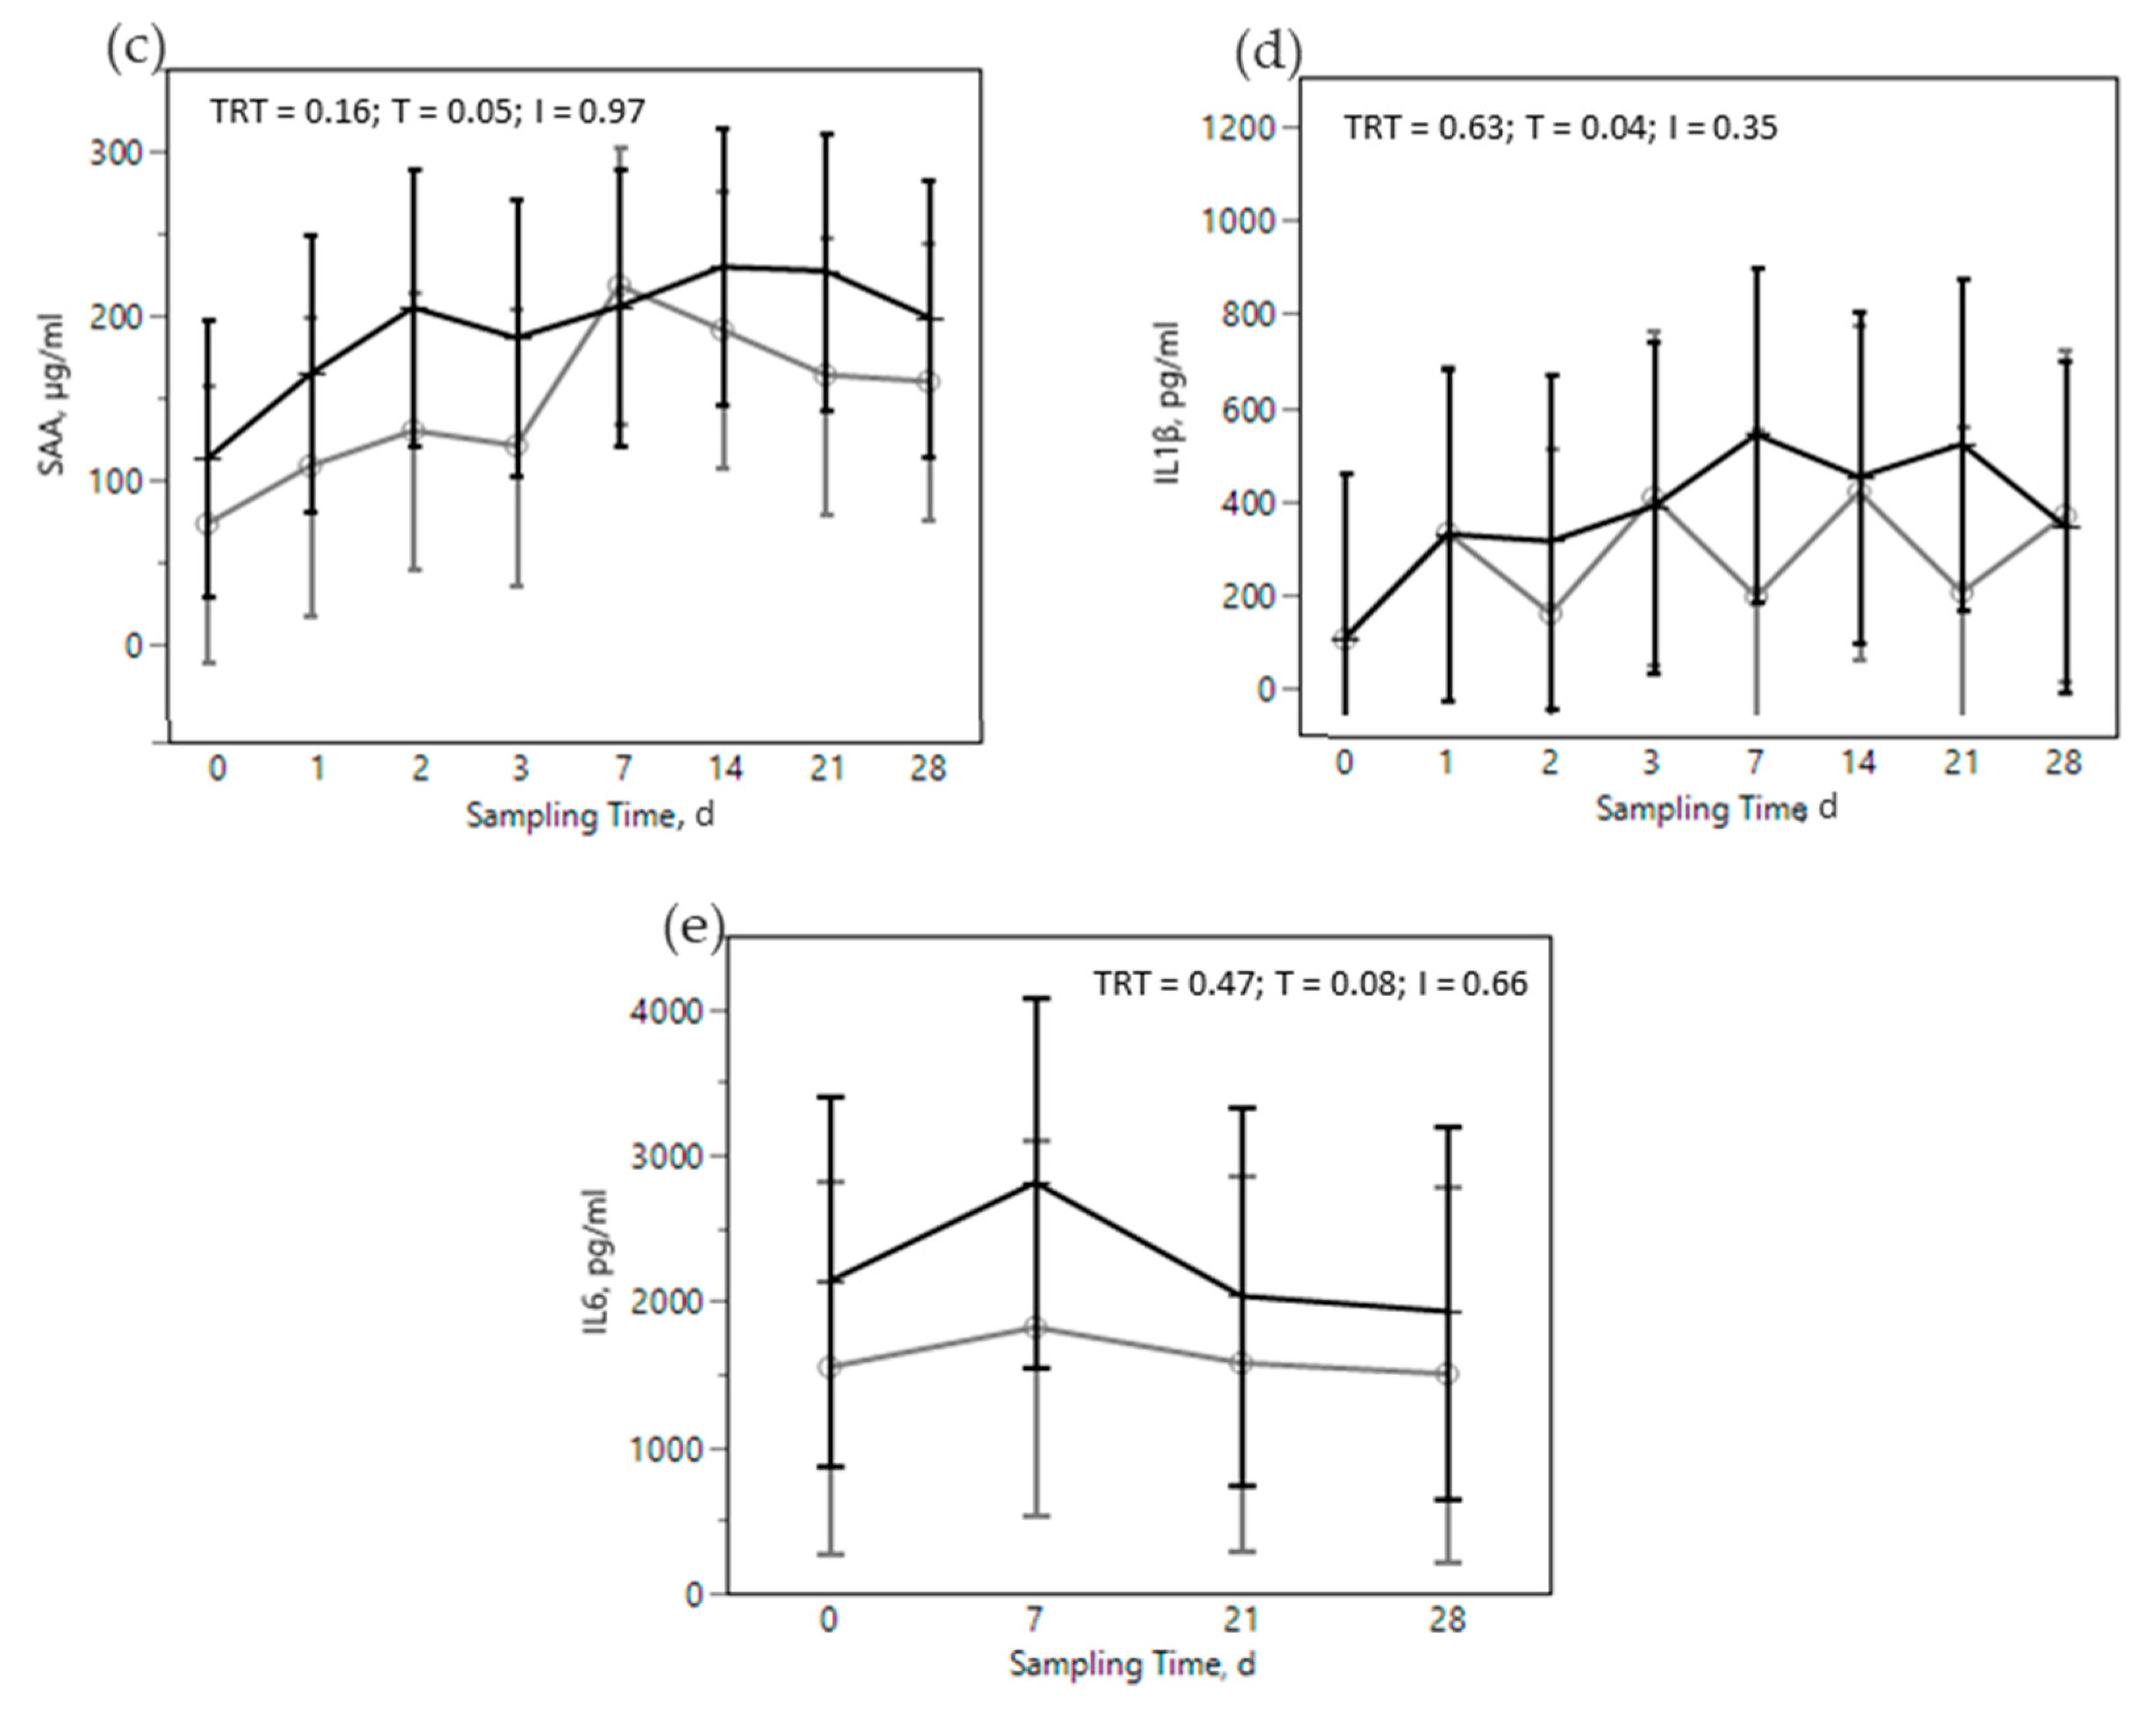
 ) or OMN 2 (
  ) treatments during the SARA challenge. 1 Control group. 2 Treated group (cows receiving OmniGen-AF, 55g/d). TRT: treatment p-value effect; T: time p-value effect; I: interaction TRT x T p-value effect.
) or OMN 2 ( ) treatments during the SARA challenge. 1 Control group. 2 Treated group (cows receiving OmniGen-AF, 55g/d). TRT: treatment p-value effect; T: time p-value effect; I: interaction TRT x T p-value effect.
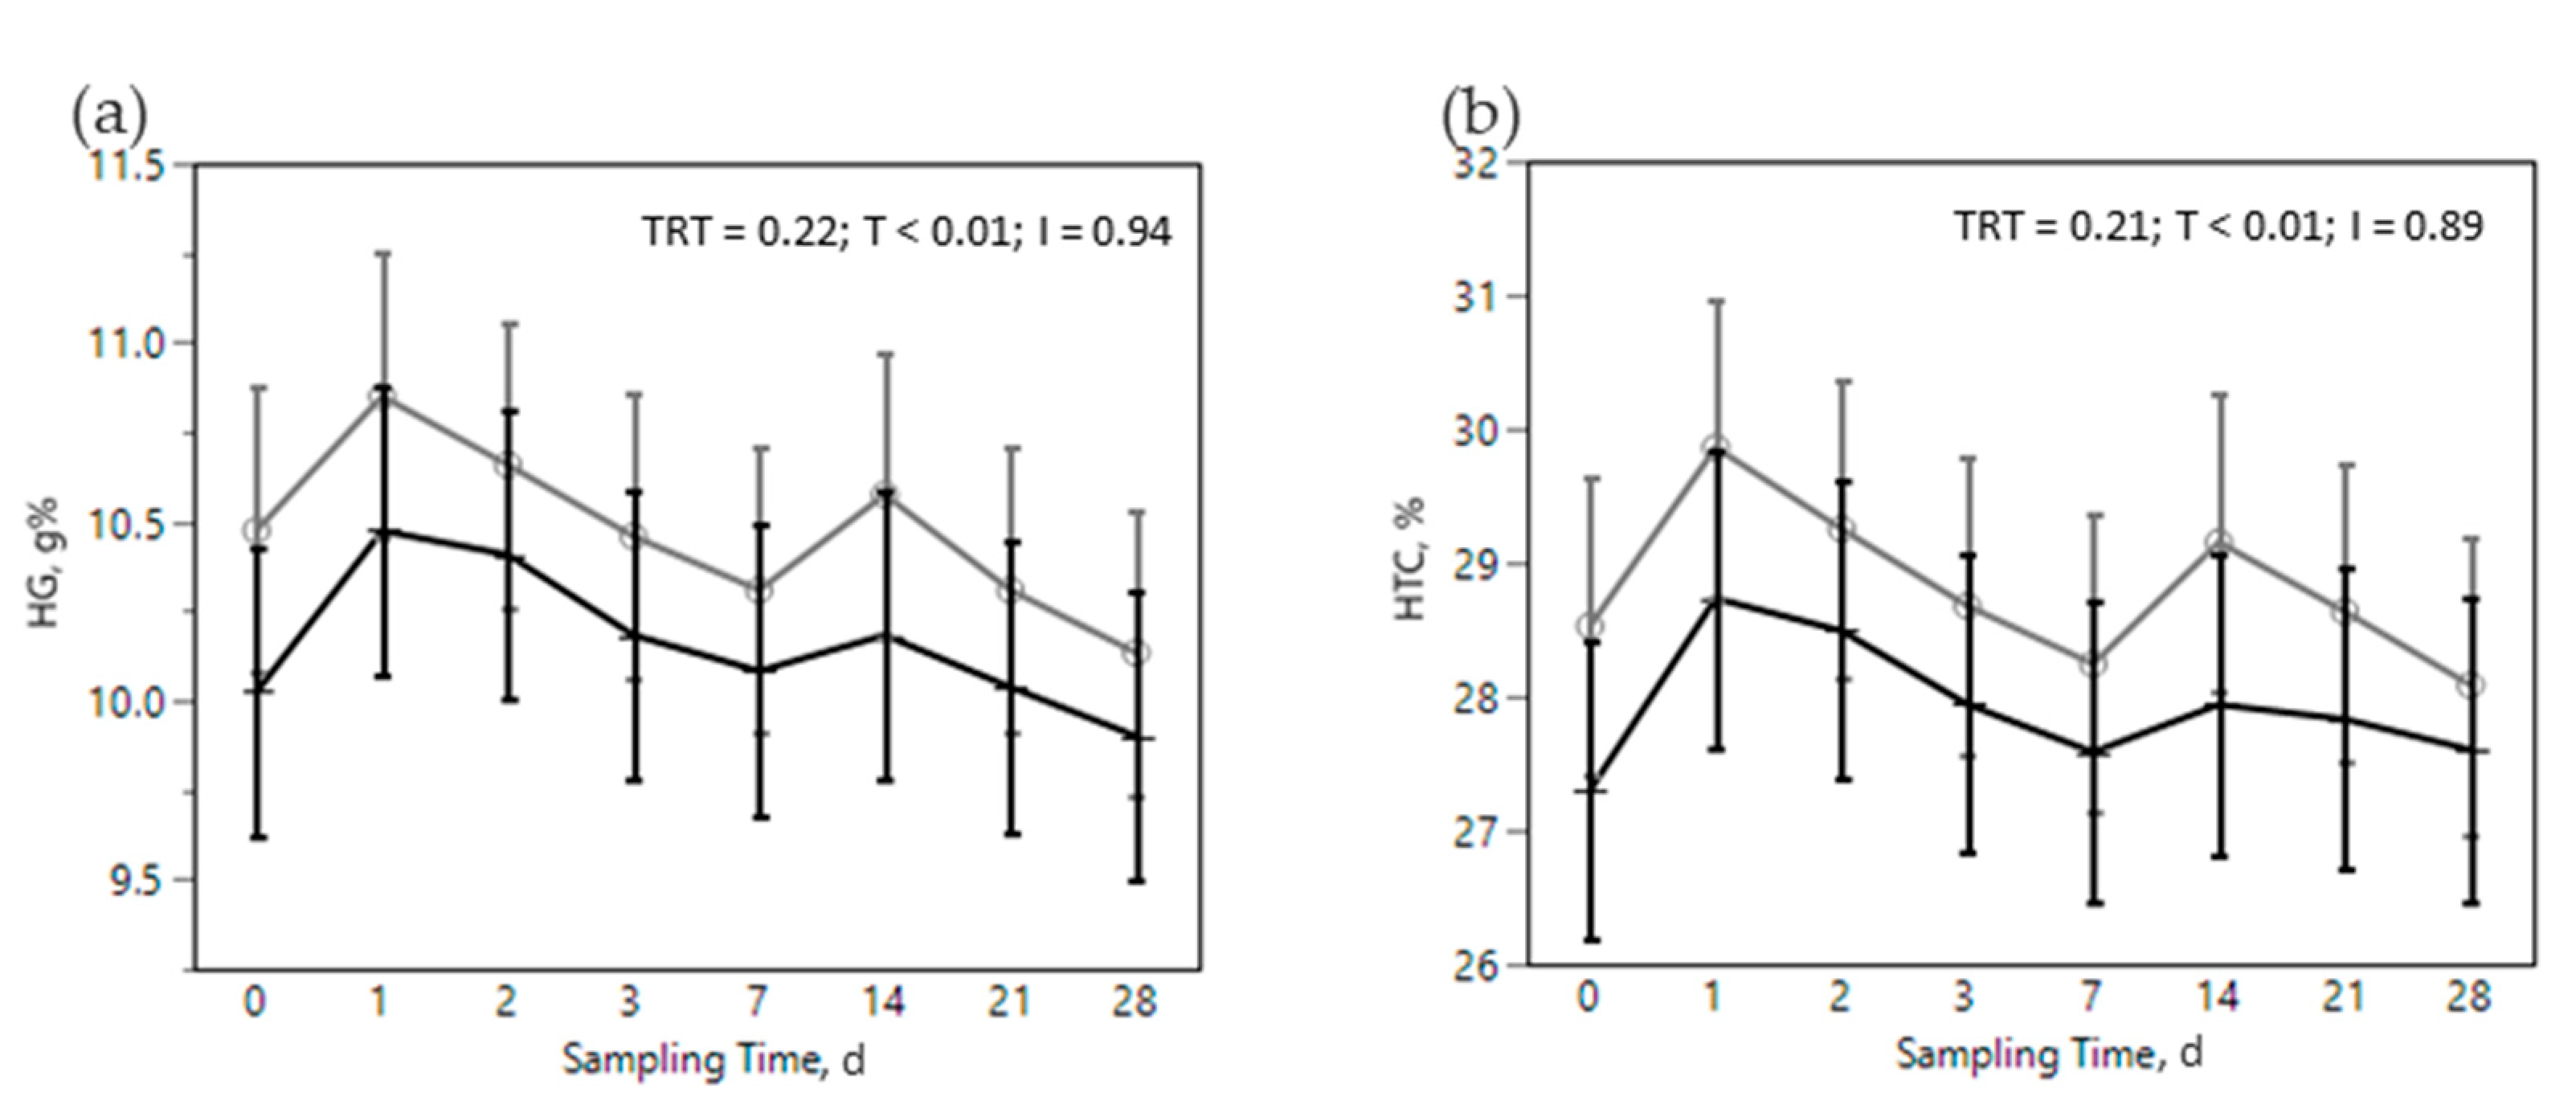
) treatments during the SARA challenge. 1 Control group. 2 Treated group (cows receiving OmniGen-AF, 55g/d). TRT: treatment p-value effect; T: time p-value effect; I: interaction TRT x T p-value effect.
) or OMN 2 ( ) treatments during the SARA challenge. 1 Control group. 2 Treated group (cows receiving OmniGen-AF, 55g/d). TRT: treatment p-value effect; T: time p-value effect; I: interaction TRT x T p-value effect.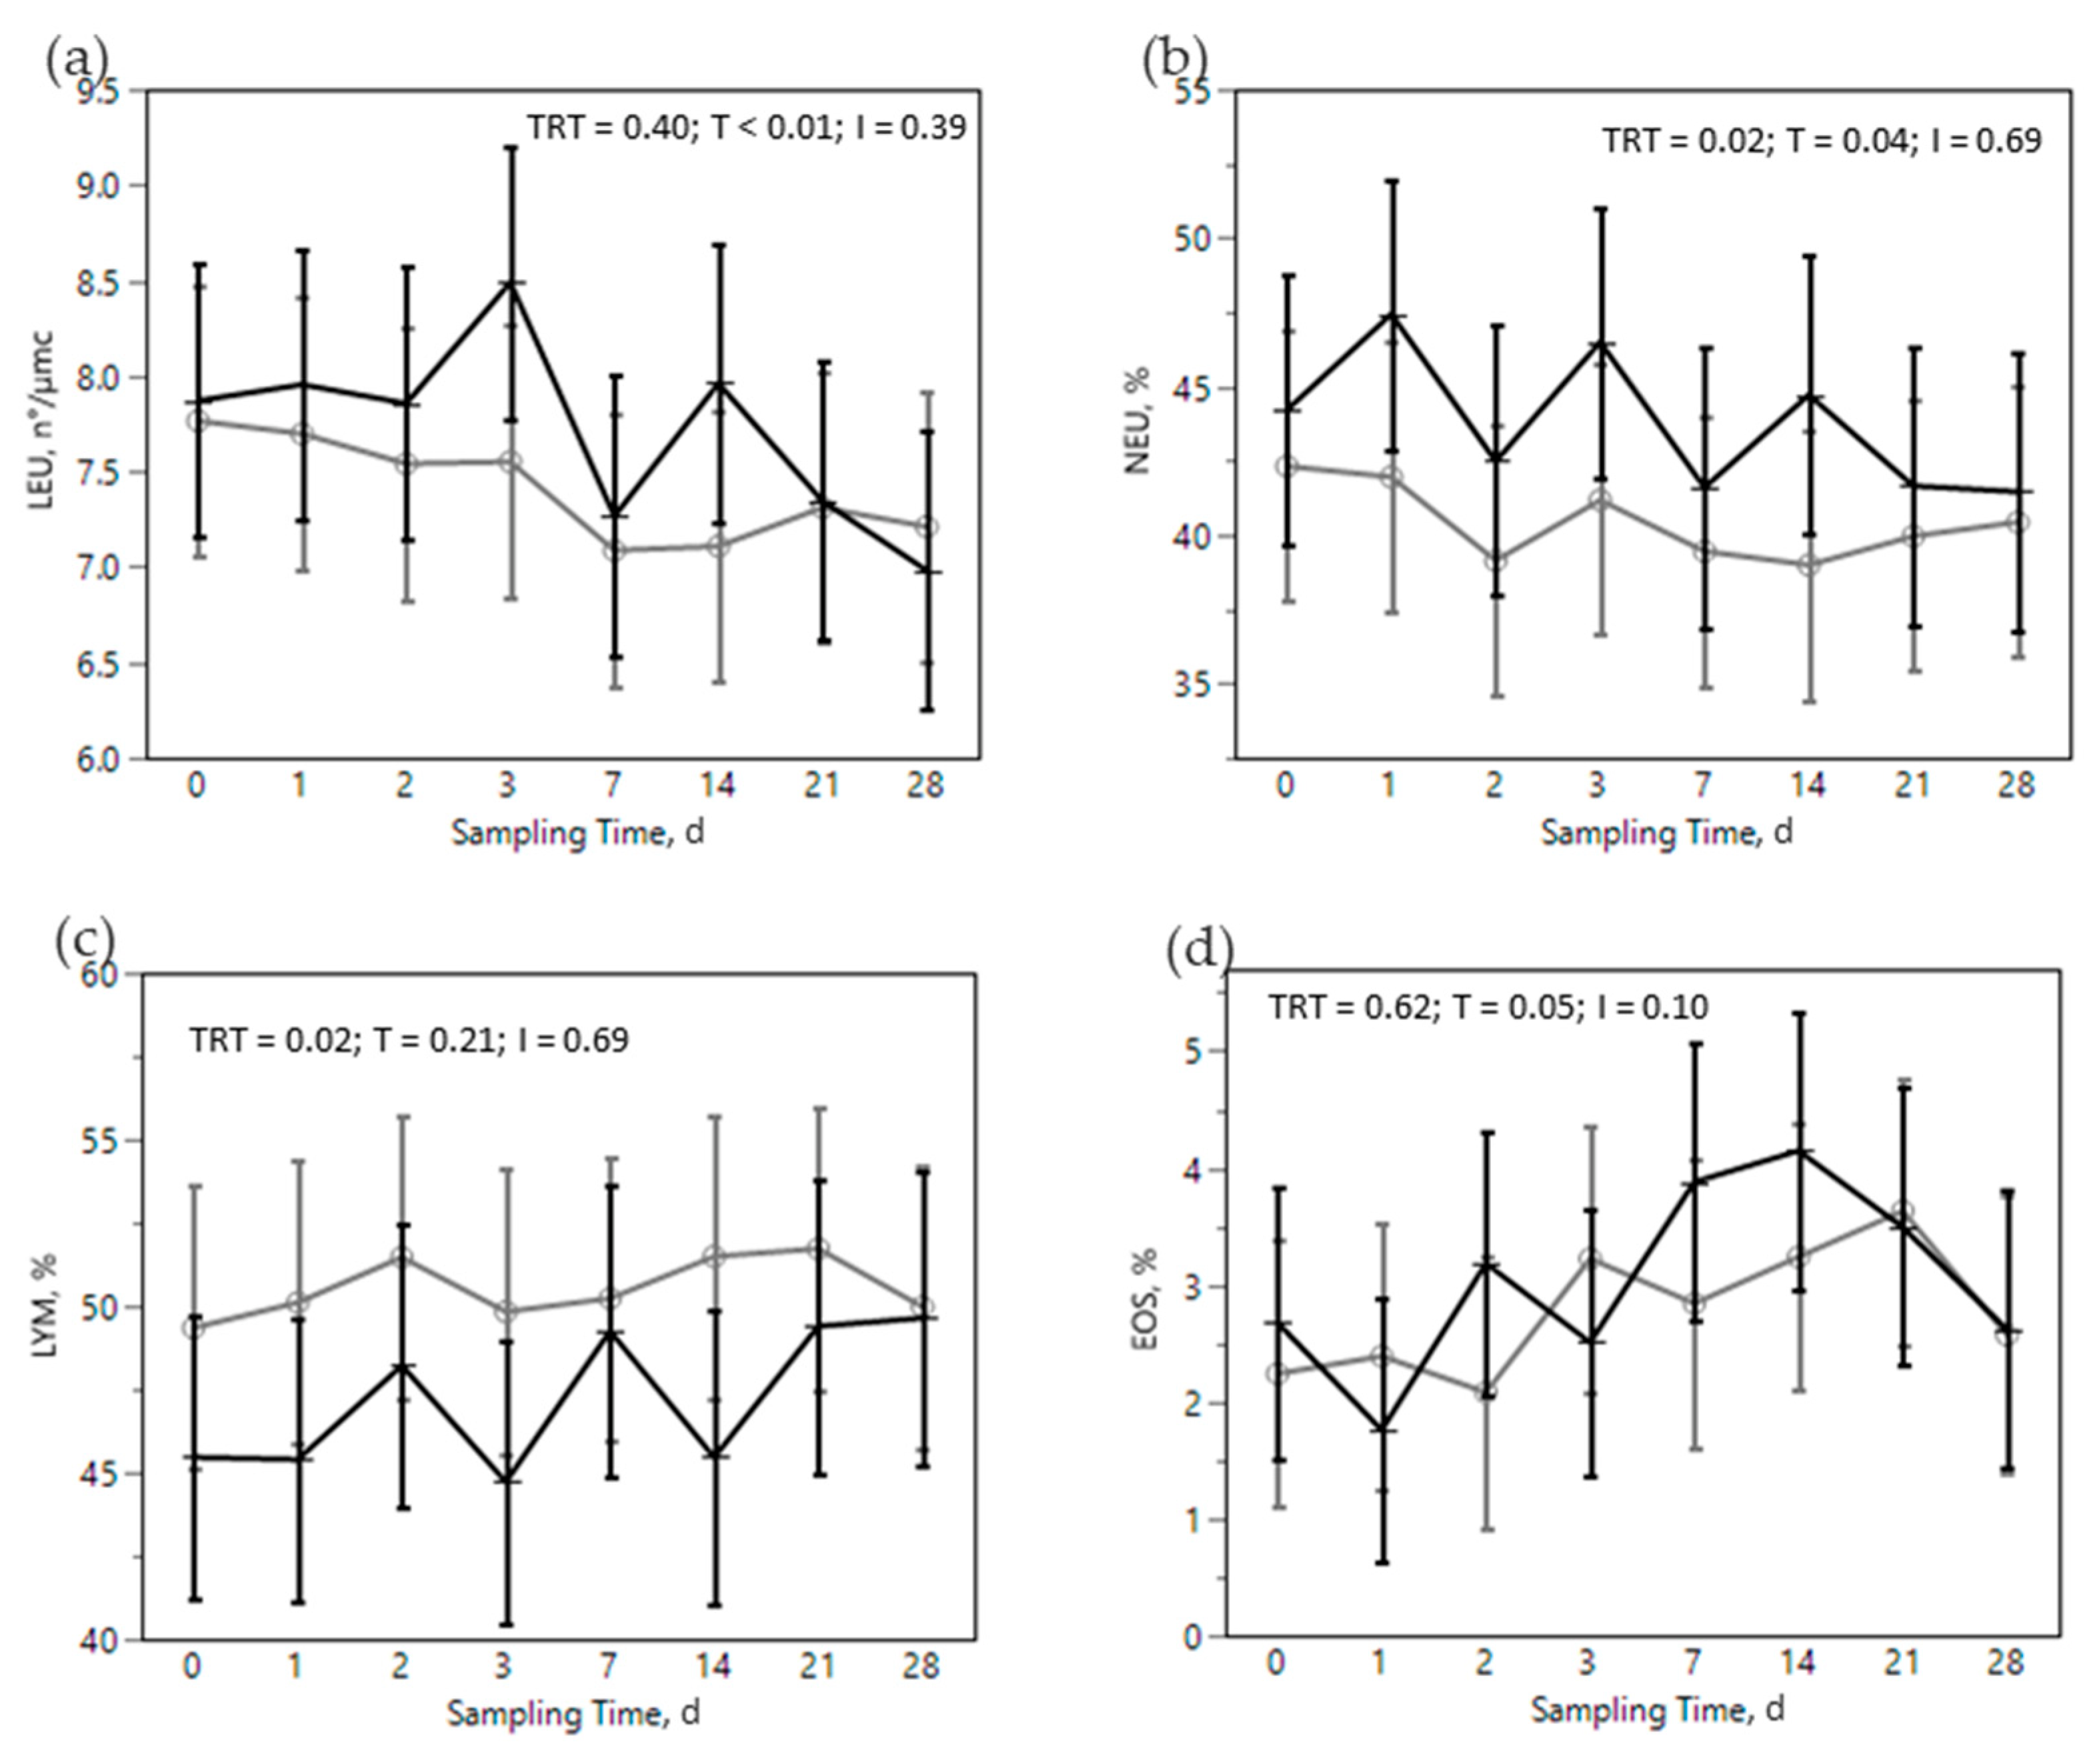
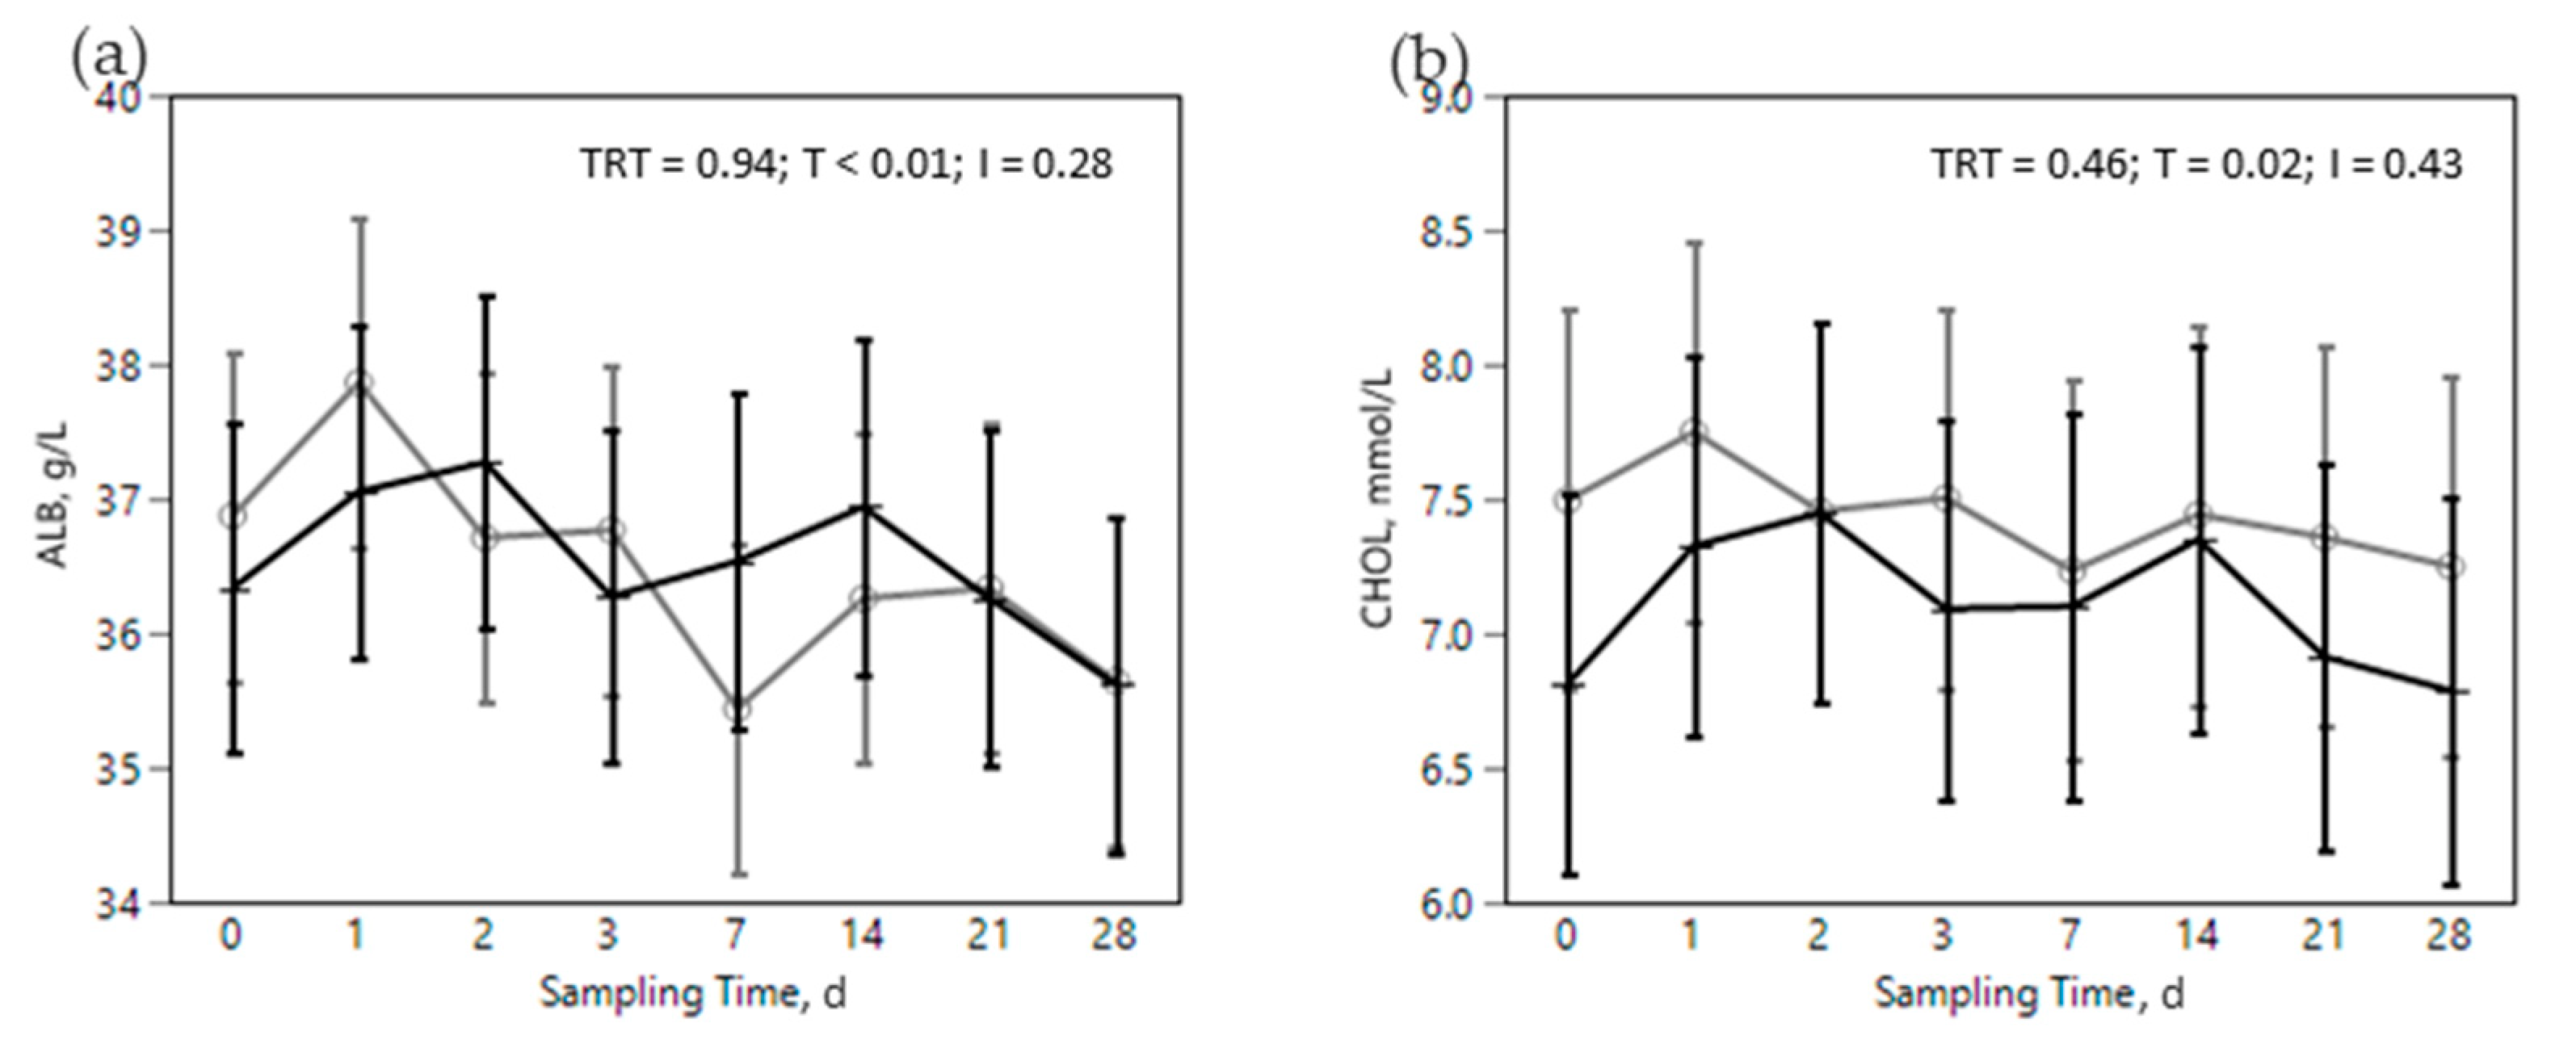
 ) or OMN 2 (
  ) treatments during the SARA challenge. 1 Control group. 2 Treated group (cows receiving OmniGen-AF, 55g/d). TRT: treatment p-value effect; T: time p-value effect; I: interaction TRT x T p-value effect.
) or OMN 2 ( ) treatments during the SARA challenge. 1 Control group. 2 Treated group (cows receiving OmniGen-AF, 55g/d). TRT: treatment p-value effect; T: time p-value effect; I: interaction TRT x T p-value effect.
) treatments during the SARA challenge. 1 Control group. 2 Treated group (cows receiving OmniGen-AF, 55g/d). TRT: treatment p-value effect; T: time p-value effect; I: interaction TRT x T p-value effect.
) or OMN 2 ( ) treatments during the SARA challenge. 1 Control group. 2 Treated group (cows receiving OmniGen-AF, 55g/d). TRT: treatment p-value effect; T: time p-value effect; I: interaction TRT x T p-value effect.

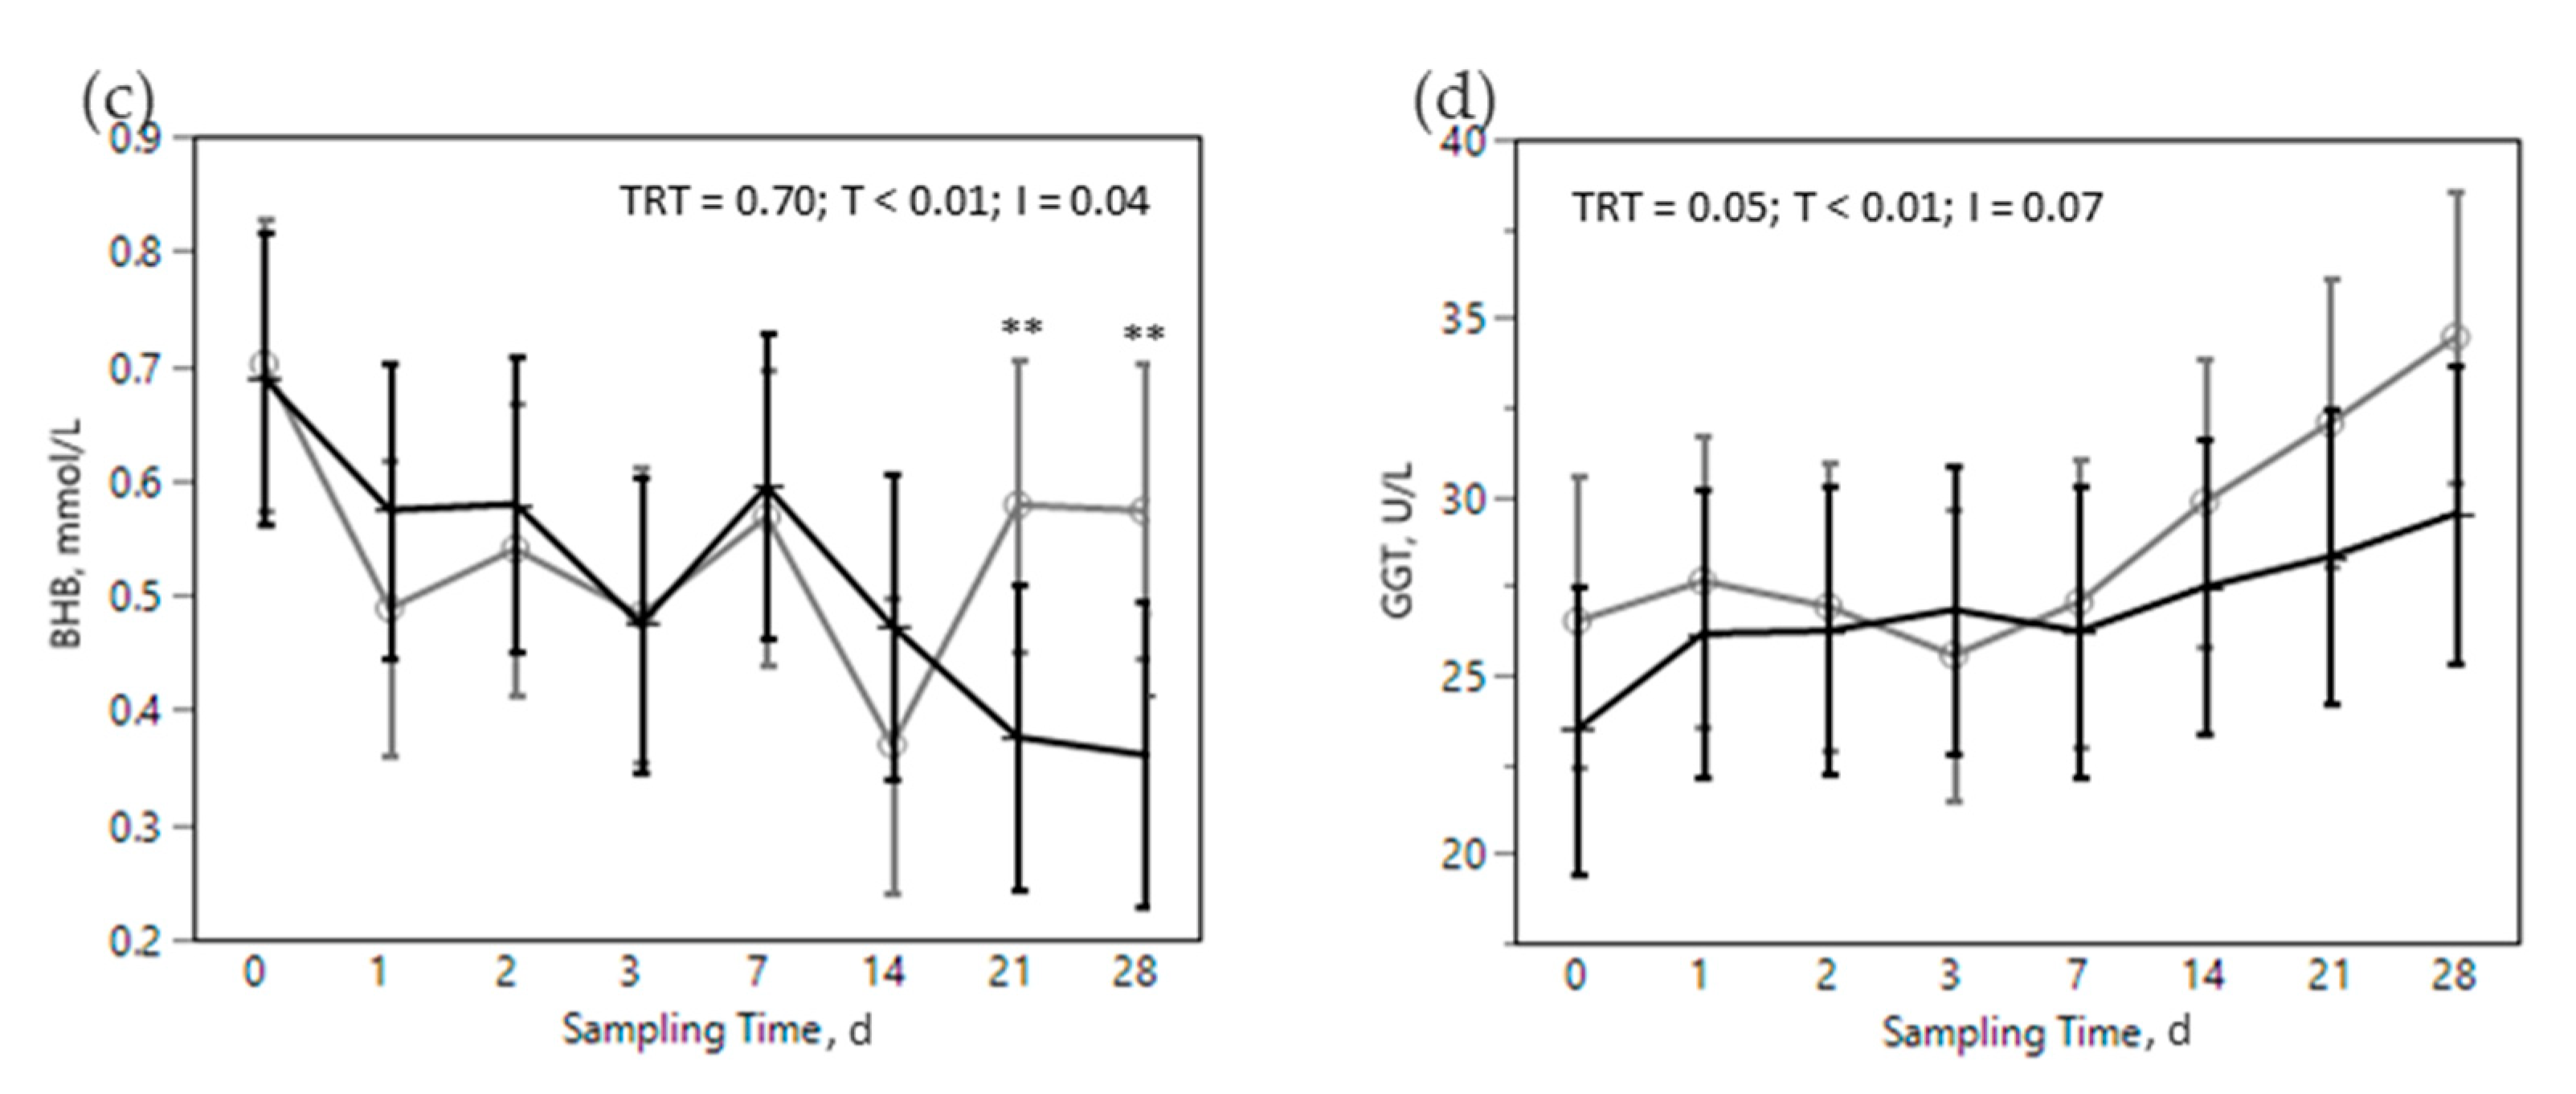
 ) or OMN 2 (
  ) treatments during the SARA challenge. 1 Control group. 2 Treated group (cows receiving OmniGen-AF, 55g/d). TRT: treatment p-value effect; T: time p-value effect; I: interaction TRT x T p-value effect. ** p-value ≤ 0.05 between TRT within time point.
) or OMN 2 ( ) treatments during the SARA challenge. 1 Control group. 2 Treated group (cows receiving OmniGen-AF, 55g/d). TRT: treatment p-value effect; T: time p-value effect; I: interaction TRT x T p-value effect. ** p-value ≤ 0.05 between TRT within time point.
) treatments during the SARA challenge. 1 Control group. 2 Treated group (cows receiving OmniGen-AF, 55g/d). TRT: treatment p-value effect; T: time p-value effect; I: interaction TRT x T p-value effect. ** p-value ≤ 0.05 between TRT within time point.
) or OMN 2 ( ) treatments during the SARA challenge. 1 Control group. 2 Treated group (cows receiving OmniGen-AF, 55g/d). TRT: treatment p-value effect; T: time p-value effect; I: interaction TRT x T p-value effect. ** p-value ≤ 0.05 between TRT within time point.

 ) or OMN 2 (
  ) treatments during the SARA challenge. 1 Control group. 2 Treated group (cows receiving OmniGen-AF, 55g/d). TRT: treatment p-value effect; T: time p-value effect; I: interaction TRT x T p-value effect.
) or OMN 2 ( ) treatments during the SARA challenge. 1 Control group. 2 Treated group (cows receiving OmniGen-AF, 55g/d). TRT: treatment p-value effect; T: time p-value effect; I: interaction TRT x T p-value effect.
) treatments during the SARA challenge. 1 Control group. 2 Treated group (cows receiving OmniGen-AF, 55g/d). TRT: treatment p-value effect; T: time p-value effect; I: interaction TRT x T p-value effect.
) or OMN 2 ( ) treatments during the SARA challenge. 1 Control group. 2 Treated group (cows receiving OmniGen-AF, 55g/d). TRT: treatment p-value effect; T: time p-value effect; I: interaction TRT x T p-value effect.

| Cows’ Characteristics | Beginning Experiment | Beginning Challenge | ||
|---|---|---|---|---|
| CON | OMN 1 | CON | OMN 1 | |
| Age, y | 2.65 ± 0.66 | 2.62 ± 0.52 | 2.78 ± 0.79 | 2.75 ± 0.65 |
| Lactation, n | 1.64 ± 0.65 | 1.67 ± 0.65 | 1.64 ± 0.65 | 1.67 ± 0.65 |
| DIM 2 | 51.5 ± 28.9 | 52.3 ± 30.5 | 100.5 ± 28.9 | 101.3 ± 30.5 |
| BW 3, kg | 630 ± 58.3 | 633 ± 64.1 | 644 ± 73.2 | 634 ± 70.4 |
| Milk yield, kg/d | 40.0 ± 7.74 | 40.4 ± 7.78 | 41.77 ± 6.85 | 43.0 ± 9.06 |
| Fat, % | 3.91 ± 0.74 | 3.89 ± 0.54 | 3.59 ± 0.18 | 3.53 ± 0.15 |
| Total protein, % | 3.30 ± 0.24 | 3.28 ± 0.23 | 3.24 ± 0.18 | 3.26 ± 0.20 |
| Lactose, % | 4.95 ± 0.17 | 5.02 ± 0.10 | 4.96 ± 0.17 | 5.03 ± 0.08 |
| MUN 4, mg/dL | 8.27 ± 2.90 | 8.35 ± 3.26 | 9.79 ± 1.99 | 9.15 ± 1.99 |
| SCC 5, log10/mL | 1.45 ± 0.32 | 1.63 ± 0.42 | 1.78 ± 0.29 | 2.20 ± 0.32 |
| Diets’ Composition | Pre-Challenge Diet | SARA Challenge Diet |
|---|---|---|
| Ingredients 1, kg/cow/d, as fed | ||
| Grass hay, finely chopped | 9.5 | 6.0 |
| Wheat straw, finely chopped | 1.0 | 1.0 |
| Corn flakes | 6.0 | 13.0 |
| Concentrate 2 | 7.5 | 8.0 |
| Liquid feed 3 | 1.0 | 1.0 |
| Grass hay, long | Ad libitum | - |
| Forage:Concentrate | 45.4:54.6 | 24.8:75.2 |
| Chemical composition, %DM | ||
| DM | 87.22 ± 3.00 | 88.11 ± 0.74 |
| Ash | 7.50 ± 1.28 | 6.25 ± 0.43 |
| Ether extract | 3.21 ± 0.47 | 2.78 ± 0.65 |
| aNDFom 4 | 35.94 ± 4.16 | 29.00 ± 2.80 |
| ADF | 24.55 ± 2.56 | 18.86 ± 1.64 |
| ADL | 5.27 ± 1.09 | 4.65 ± 0.19 |
| uNDF240h 5 | 9.93 ± 3.32 | 8.05 ± 0.96 |
| Starch | 22.95 ± 2.62 | 33.62 ± 2.45 |
| peNDF1.18mm 6 | 17.56 ± 1.35 | 13.80 ± 0.98 |
| Item | Pre-Challenge Diet | SARA Challenge Diet | SEM | p-Values | ||||
|---|---|---|---|---|---|---|---|---|
| CON 1 | OMN 2 | CON | OMN | TRT | Diet | TRT x D | ||
| DMI, kg/d | - | - | 25.8 | 25.7 | 1.25 | 0.99 | - | - |
| WI, L/d | - | - | 144 | 147 | 10.4 | 0.70 | - | - |
| BW, kg | 646 | 617 | 641 | 639 | 17.2 | 0.61 | 0.31 | 0.11 |
| Rumination time, min/d | 502 | 488 | 434 | 405 | 13.8 | 0.23 | <0.01 | 0.27 |
| Reticular pH | 6.05 | 6.05 | 6.04 | 6.05 | 0.02 | 0.91 | 0.69 | 0.19 |
| Reticular pH < 5.5, min/d | 35.6 | 40.2 | 57.2 | 57.1 | 12.5 | 0.65 | <0.01 | 0.64 |
| Reticular temperature, °C | 37.8 | 38.8 | 37.9 | 38.9 | 0.11 | 0.52 | <0.01 | 0.91 |
| Milk yield, kg/d | 42.3 | 43.4 | 41.1 | 40.6 | 3.20 | 0.94 | <0.01 | 0.12 |
| Fat yield, g/d | 1455 | 1365 | 1165 | 1081 | 9.48 | 0.35 | <0.01 | 0.90 |
| Protein yield 3, g/d | 1351 | 1441 | 1312 | 1293 | 10.1 | 0.73 | <0.01 | 0.11 |
| ECM, kg/d | 38.2 | 39.5 | 34.3 | 34.9 | 2.57 | 0.72 | <0.01 | 0.35 |
| MUN, mg/dL | 10.13 | 9.16 | 6.04 | 5.46 | 0.72 | 0.23 | <0.01 | 0.28 |
| SCC, log10 cells/mL | 1.78 | 2.20 | 2.45 | 2.71 | 0.29 | 0.52 | <0.01 | 0.34 |
| Item | D 0 | D 14 | D 28 | SEM | p-Values | |||||
|---|---|---|---|---|---|---|---|---|---|---|
| CON 1 | OMN 2 | CON | OMN | CON | OMN | TRT | Time | TRT x T | ||
| Total VFA, mmol/L | 89.4 | 89.3 | 110.2 | 103.0 | 103.4 | 105.5 | 5.16 | 0.71 | <0.01 | 0.62 |
| Acetic, %mmol | 56.6 | 56.0 | 52.5 | 55.5 | 50.5 | 53.5 | 1.34 | 0.13 | 0.03 | 0.30 |
| Propionic, %mmol | 27.8 | 28.4 | 36.0 a | 29.7 b | 37.1 | 32.0 | 1.76 | 0.04 | <0.01 | 0.08 |
| Iso-butyric, %mmol | 0.50 | 0.36 | 0.36 B | 0.47 A | 0.42 | 0.47 | 0.06 | 0.12 | 0.69 | <0.01 |
| Nor-butyric, %mmol | 13.1 | 12.3 | 9.8 b | 11.5 a | 10.6 | 11.2 | 0.55 | 0.33 | <0.01 | 0.08 |
| l-lactic, mg/dL | 151 | 119 | 187 | 155 | 154 | 121 | 25.1 | 0.09 | 0.35 | 0.99 |
| d-lactic, mg/dL | 172 | 125 | 241 | 147 | 174 | 121 | 37.2 | 0.02 | 0.41 | 0.81 |
Publisher’s Note: MDPI stays neutral with regard to jurisdictional claims in published maps and institutional affiliations. |
© 2022 by the authors. Licensee MDPI, Basel, Switzerland. This article is an open access article distributed under the terms and conditions of the Creative Commons Attribution (CC BY) license (https://creativecommons.org/licenses/by/4.0/).
Share and Cite
Cavallini, D.; Mammi, L.M.E.; Palmonari, A.; García-González, R.; Chapman, J.D.; McLean, D.J.; Formigoni, A. Effect of an Immunomodulatory Feed Additive in Mitigating the Stress Responses in Lactating Dairy Cows to a High Concentrate Diet Challenge. Animals 2022, 12, 2129. https://doi.org/10.3390/ani12162129
Cavallini D, Mammi LME, Palmonari A, García-González R, Chapman JD, McLean DJ, Formigoni A. Effect of an Immunomodulatory Feed Additive in Mitigating the Stress Responses in Lactating Dairy Cows to a High Concentrate Diet Challenge. Animals. 2022; 12(16):2129. https://doi.org/10.3390/ani12162129
Chicago/Turabian StyleCavallini, Damiano, Ludovica M. E. Mammi, Alberto Palmonari, Ruben García-González, James D. Chapman, Dereck J. McLean, and Andrea Formigoni. 2022. "Effect of an Immunomodulatory Feed Additive in Mitigating the Stress Responses in Lactating Dairy Cows to a High Concentrate Diet Challenge" Animals 12, no. 16: 2129. https://doi.org/10.3390/ani12162129
APA StyleCavallini, D., Mammi, L. M. E., Palmonari, A., García-González, R., Chapman, J. D., McLean, D. J., & Formigoni, A. (2022). Effect of an Immunomodulatory Feed Additive in Mitigating the Stress Responses in Lactating Dairy Cows to a High Concentrate Diet Challenge. Animals, 12(16), 2129. https://doi.org/10.3390/ani12162129