Article

Adaptability and Evolution of Gobiidae: A Genetic Exploration

College of Life Sciences, Qufu Normal University, Jingxuan West Street No. 57, Qufu 273165, China
*
Author to whom correspondence should be addressed.
These authors contributed equally to this work.
Animals 2022, 12(14), 1741; https://doi.org/10.3390/ani12141741
Submission received: 11 May 2022 / Revised: 5 July 2022 / Accepted: 5 July 2022 / Published: 6 July 2022
(This article belongs to the Section Animal Genetics and Genomics)

Abstract

:

Simple Summary

Animals living in different environments must overcome different environmental pressures. Previous studies have explored this phenomenon for other aquatic organisms, including Fundulus genus, intertidal spiders, and intertidal chitons. Gobiidae is a group of bony fishes that is second most diverse group of vertebrates globally, and one of the most diverse families of fish. These fish occupy different environments, including marine, brackish, and freshwater habitats. One key reason for the successful colonization of different habitats by this group is their ability to adapt to different energy demands. Energy requirement is related to the ability of mitochondria in cells to generate energy via a process called oxidative phosphorylation (OXPHOS). This study explored the genetic mechanisms underlying the adaptability of Gobiidae to different environments and energy requirements and, hence, their evolution.

Abstract

The Gobiidae family occupy one of the most diverse habitat ranges of all fishes. One key reason for their successful colonization of different habitats is their ability to adapt to different energy demands. This energy requirement is related to the ability of mitochondria in cells to generate energy via oxidative phosphorylation (OXPHOS). Here, we assembled three complete mitochondrial genomes of Rhinogobius shennongensis, Rhinogobius wuyanlingensis, and Chaenogobius annularis. These mitogenomes are circular and include 13 protein-coding genes (PCGs), two rRNAs, 22 tRNAs, and one non-coding control region (CR). We used comparative mitochondrial DNA (mtDNA) genome and selection pressure analyses to explore the structure and evolutionary rates of Gobiidae mitogenomics in different environments. The CmC model showed that the ω ratios of all mtDNA PCGs were <1, and that the evolutionary rate of adenosine triphosphate 8 (atp8) was faster in Gobiidae than in other mitochondrial DNA PCGs. We also found evidence of positive selection for several sites of NADH dehydrogenase (nd) 6 and atp8 genes. Thus, divergent mechanisms appear to underlie the evolution of mtDNA PCGs, which might explain the ability of Gobiidae to adapt to diverse environments. Our study provides new insights on the adaptive evolution of Gobiidae mtDNA genome and molecular mechanisms of OXPHOS.

1. Introduction

Gobiidae is the second most diverse group of vertebrates, and is one of the most diverse families of fish. This family consists of more than 210 genera and over 1950 described species (i.e., nearly 10% of all fish species), with many species yet to be described [1]. The fish of this family occupy a wide range of environments, including marine, brackish, and freshwater habitats [2,3]. Gobiidae require different amounts of energy to survive in different types of habitats. Mitochondria, which are organelles found in eukaryotic cells [4], are the main site of aerobic cell respiration, converting organic matter into energy, and are the energy factories of cells [5]. Vertebrate mitochondria are double-stranded molecules that have closed structures, usually about 14 to 16 kB in size [6]. The two strands of mitochondrial DNA are: (1) a guanine-rich strand, known as the heavy (H) strand and (2) a cytosine-rich light (L) strand [7]. Mitochondria consist of 13 protein-coding genes (PCGs), 22 tRNAs (transfer RNA) genes, two rRNAs (ribosomal RNA) genes, and one D-loop (control region) [8,9,10,11]. Mitochondrial stress has a large impact on the metabolic performance of an organism [12]. Maintaining mitochondrial integrity and the signals contained therein are essential for cellular homeostasis and survival [13,14]. Mitochondrial genes have been widely used to elucidate phylogenetic relationships among species because of their simple structure, rapid evolution rate, maternal heredity, and minimal recombination [15,16,17]. Therefore, the mitogenome is widely used for the molecular identification, evolution, and genetic relationships of inter-organism systems [18,19]. Estimation of selection pressures acting on mitochondria could provide deep insights on the adaptive evolution of the mitochondrial genome.
Previous studies have explored characteristics of mitochondrial genes of some aquatic organisms [8,20,21]. One study found that the mitochondrial genes of killifish in the genus Fundulus, occupying different environments evolved at variable rates, but exhibited very low dN/dS ratios across all lineages of the genus [22]. Li et al. (2021) constructed a novel mitogenome for the intertidal spider (Desis jiaxiangi) and found that positive selection signals in the mitogenome might adapt to different environments [23]. Dhar et al. (2020) observed positive selection in mtDNA PCGs of intertidal chitons (Mollusca: Polyplacophora), indicating that mtDNA PCGs have a role in metabolic adaptations to different environments [12]. To date (April 2022), there have been no reports of mitogenome assemblages in Gobiidae occupying different habitats. Given the critical role of mitochondria in aerobic respiration and adaptation of organisms to different environments, here, we explored the adaptive evolution and phylogenetic relationships of Gobiidae mitogenomes. Our findings are expected to provide new insights on the molecular mechanisms responsible for the adaptation (to different environments) and evolution of Gobiidae.
We assembled and annotated three new complete Gobiidae mitogenomics (Chaenogobius annularis, Rhinogobius shennongensis, Rhinogobius wuyanlingensis) based on high-quality whole mitochondrial genomes. To explore the evolution of Gobiidae, we combined data from 18 publicly available mitogenomes. All species were divided into three groups according to their habitat: freshwater group (FG), seawater group (SG), and euryhaline group (EG). We constructed a phylogenetic tree of 21 species using the Bayesian method, and studied their genome structure and selection. Our study provides new mitogenomic resources and enhances our understanding of the molecular mechanisms underlying the adaptation to the different environments and evolution of Gobiidae.

2. Materials and Methods

2.1. Assembly and Annotation of the Complete Mitogenome

Based on the raw data of Gobiidae genome sequencing (Rhinogobius shennongensis, SRR18029980; Rhinogobius wuyanlingensis, SRR18030029; Chaenogobius annularis, DRR174911.1) that we obtained from the NCBI database, we assembled the three complete mitochondrial genomes using NOVOPlasty 4.1 [24]. The seed sequence was MK758112.1 (Myersina filifer). We used BLAST to validate and revise the assembled sequences based on genome data, seed sequences, and MITOS web (http://mitos.bioinf.uni-leipzig.de/index.py (accessed on 24 February 2022) to annotate the mitochondrial genome [25]. The results of the annotation were compared with annotations of mitochondrial genomes of related species (Myersina filifer and Gymnogobius urotaenia) using BLAST. The three complete mitogenomes were submitted to GenBank under the accession numbers OM830225 (Chaenogobius annularis), OM961050 (Rhinogobius shennongensis), and OM961051 (Rhinogobius wuyanlingensis). A map of the three new complete mitogenomics was generated using the MPI-MP CHLOROBOX website (https://chlorobox.mpimp-golm.mpg.de/geseq.html (accessed on 27 February 2022). MEGA X [26] was used to calculate the relative synonymous codon usage (RSCU) of the mtDNA PCGs. Codon W was used to determine the effective number of codons (ENc) and the GC content of the codons 3rd position option (GC3s) [27]. Comparative alignments of the 21 mitogenomes were performed using Mauve software (2.3.1). Comparative codon usage among the 21 selected mitogenomes was represented by heatmaps using R software.
The three species (i.e., OM830225, OM961050, and OM961051) were divided into three groups according to their habitats: freshwater (FG), seawater (SG), and euryhaline (EG) (Table 1). The mitochondrial genome accession numbers of Gobiidae are presented in Table 1. The composition skew values were calculated according to the following formulas: AT skew [(A − T)/(A + T)] and GC skew [(G − C)/(G + C)] [28].

2.2. Phylogenomic Analyses

We performed phylogenetic analyses of 21 mitogenomic sequences based on 13 mtDNA PCGs (nd1, nd2, co1, co2, atp8, atp6, co3, nd3, nd4l, nd4, nd5, nd6, cyb). We used MUSCLE v3.8.31 to align 13 mtDNA PCGs [29]. Bayesian inference (BI) was used to infer phylogenetic relationships. We used the model finder function of the PhyloSuite software [30] to select the optimal model (GTI + T + G).
Phylogenetic status was determined by comparing the combined mitochondrial gene set (13 mtDNA PCGs and two rRNA genes) based on Bayesian inference (BI). BI was performed using MrBayes [31] with four simultaneous Markov Chain Monte Carlo (MCMC) chains, running for 2,000,000 cycles and sampling every 1000 generations. The Interactive Tree of Life (ITOL) website [32] was used to visualize the derived BI trees.

2.3. Selection Analyses

Evolutionary constraints on individual PCGs in terms of selection pressure were estimated by the ratio of the non-synonymous substitution rate to synonymous substitution rate (ω = dN/dS) using PAML 4.9j [33]. The selected branch model was the free-ratio model (model = 1, NS sites = 0), which assumes different branches have different ω values, but independent values. To evaluate selective pressure, the ω values of 13 mtDNA PCGs and each mtDNA PCG of 21 species were calculated. If the ω value was equal to zero, we assigned the numerical value as “NA” in the ω value dataset (Supplementary Table S2). We used one-way ANOVA and multiple comparison analyses to compare the ω values (a value calculated from a concatenated sequence of 13 mtDNA PCGs and 13 values calculated from 13 mtDNA PCGs). The p-values were corrected using the false discovery rate (FDR) [23]. The ω values of 1, <1, or >1 in protein-coding sequences may be interpreted as neutral mutation, negative (purifying) selection, or positive (diversifying) selection, respectively. We used R 4.0.3 software to draw a boxplot of the ω values. To evaluate the evolutionary rates of Gobiidae in the three environments, we used CmC model analyses. We used clade model C (CmC, model = 3, NSsites = 2, ncatG = 3; null model, M2a_rel, model = 0, NSsites = 22) to compare the evolutionary rates of each mtDNA PCG in response to the three environments. To determine whether positive selection of the 13 mtDNA PCGs occurred in groups differentiated by environment and survival pressures, the EG groups were used as foreground branches, and a branch-site model was used for the analysis. In all analyses (Table S1), the BI tree file was used as the input file for PAML.

3. Results

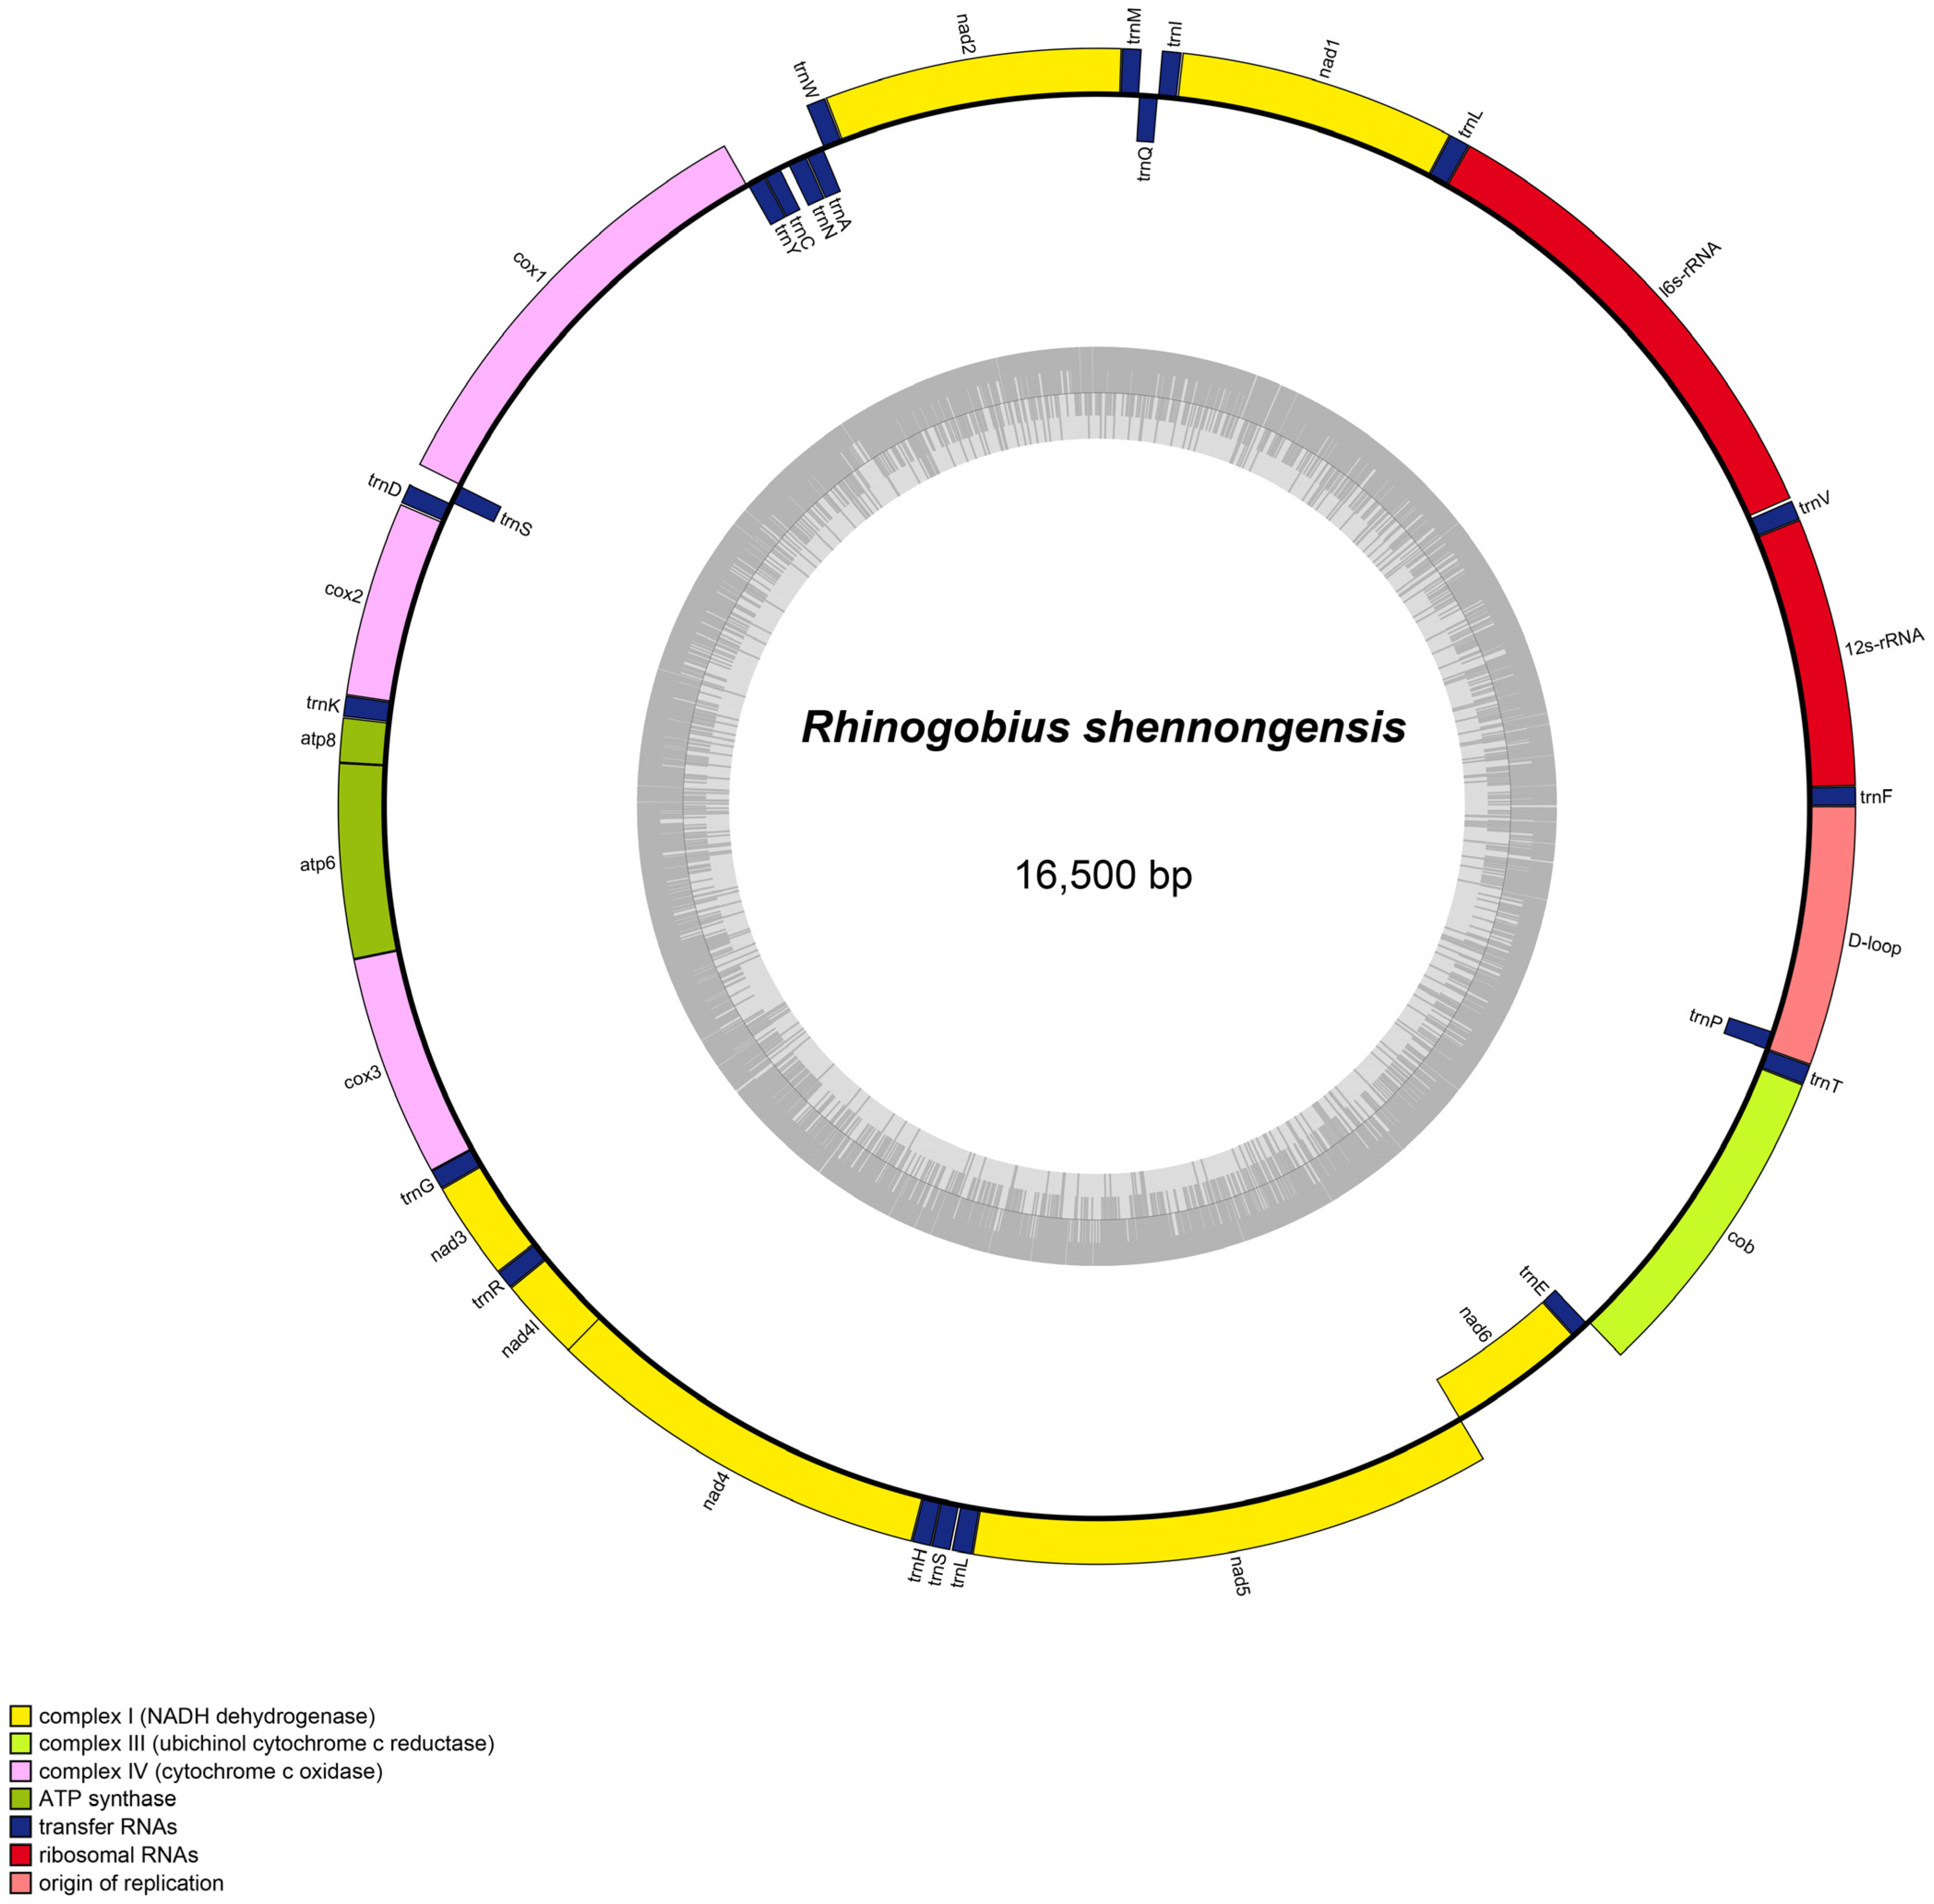
3.1. Mitogenome Organization

The complete mitogenomes of Chaenogobius annularis, Rhinogobius shennongensis, and Rhinogobius wuyanlingensis were assembled, and were 16,477 bp, 16,500 bp, and 16,491 bp in size, respectively. The complete mitogenome genes contained 13 PCGs, 22 tRNA genes, and two rRNA genes (Figure 1 and Figure S1). It also has a major non-coding region (D-loop) (Figure 1 and Figure S1). The position of each gene in the mitogenome was identical to that in other Gobiidae species. One of the 13 PCGs (nad6) and eight tRNAs (trnE, trnP, trnY, trnC, trnN, trnA, trnQ, and trnS2) were encoded by the light strand, whereas the other 28 genes were encoded by the heavy strand (Table 2, Table 3 and Table 4). There were 22 bp, 27 bp, and 24 bp overlaps across the complete mitogenomes of Chaenogobius annularis, Rhinogobius shennongensis and Rhinogobius wuyanlingensis, respectively. In particular, 7 bp had the greatest overlap between atp8 and atp6, and nd4l and nd4.
The nucleotide composition of the complete mitogenome was delineated (Table 1). Specifically, the GC-content of the four heavy strands was 41.1% (Chaenogobius annularis), 47.7% (Rhinogobius shennongensis), and 46.8% (Rhinogobius wuyanlingensis). The AT content of the entire heavy strand (Chaenogobius annularis, 58.9%; Rhinogobius shennongensis, 52.3%; and Rhinogobius wuyanlingensis, 53.2%) was distinctly higher than the GC content. The overall AT-skew and GC-skew in the whole mitogenome of Chaenogobius annularis, Rhinogobius shennongensis, Rhinogobius wuyanlingensis were 0.145 and −0.204, 0.044 and −0.312, and 0.070 and −0.306, respectively (Table 4). The AT skew for the whole mitogenome, except for the D-loop, was slightly positive, whereas the GC skew was slightly negative. This result implies that A has a higher occurrence than T, while C has a higher occurrence than G. In the mitogenome of Chaenogobius annularis, Rhinogobius shennongensis, and Rhinogobius wuyanlingensis, the initiation codon of mtDNA PCGs was GTG (numbers = 1) and ATG (12). Conversely, the termination codons of Chaenogobius annularis were TAG (3), TAA (6), TA (1), and T (3) (Table 2). The termination codons of Rhinogobius shennongensis were TAG (1), TAA (7), TA (1), and T (4) (Table 3). The termination codons of Rhinogobius wuyanlingensis were TAG (2), TAA (6), TA (1), and T (4) (Table 4). Based on the codon usage analysis used, the eight codon families (Ala, Arg, Gly, Leu1, Pro, Ser2, Thr, and Val) exhibited a strong preference for the three species (Figure 2 and Figure S2).

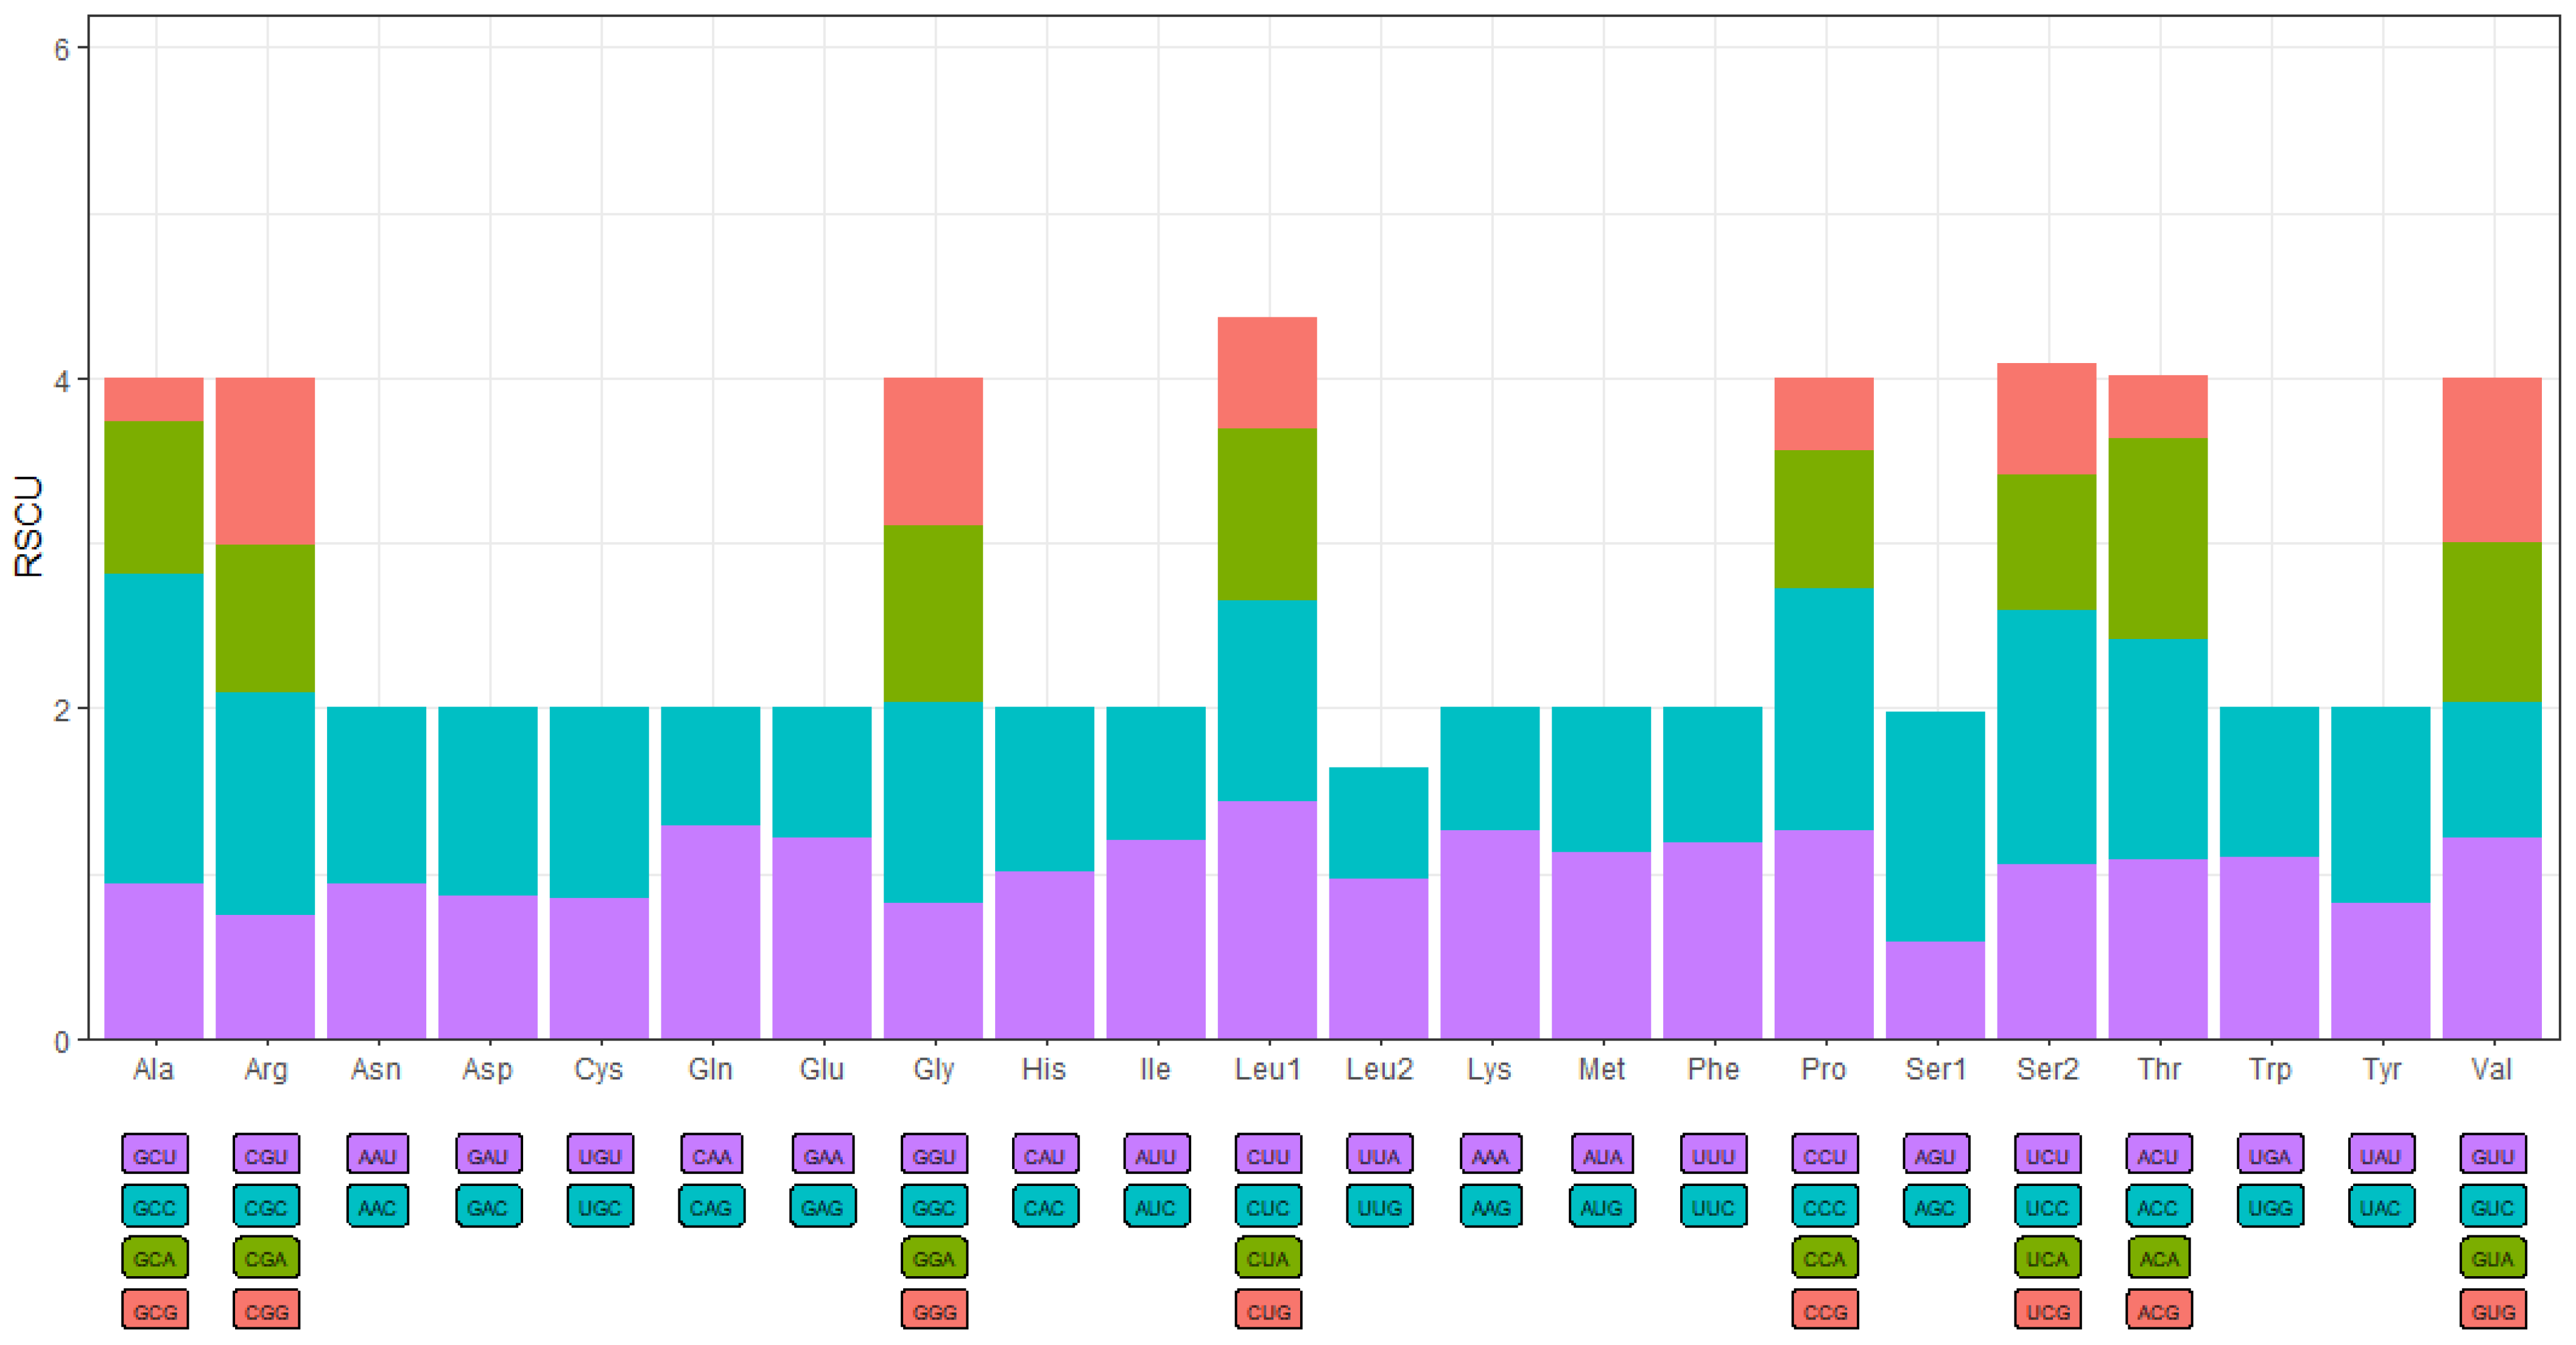
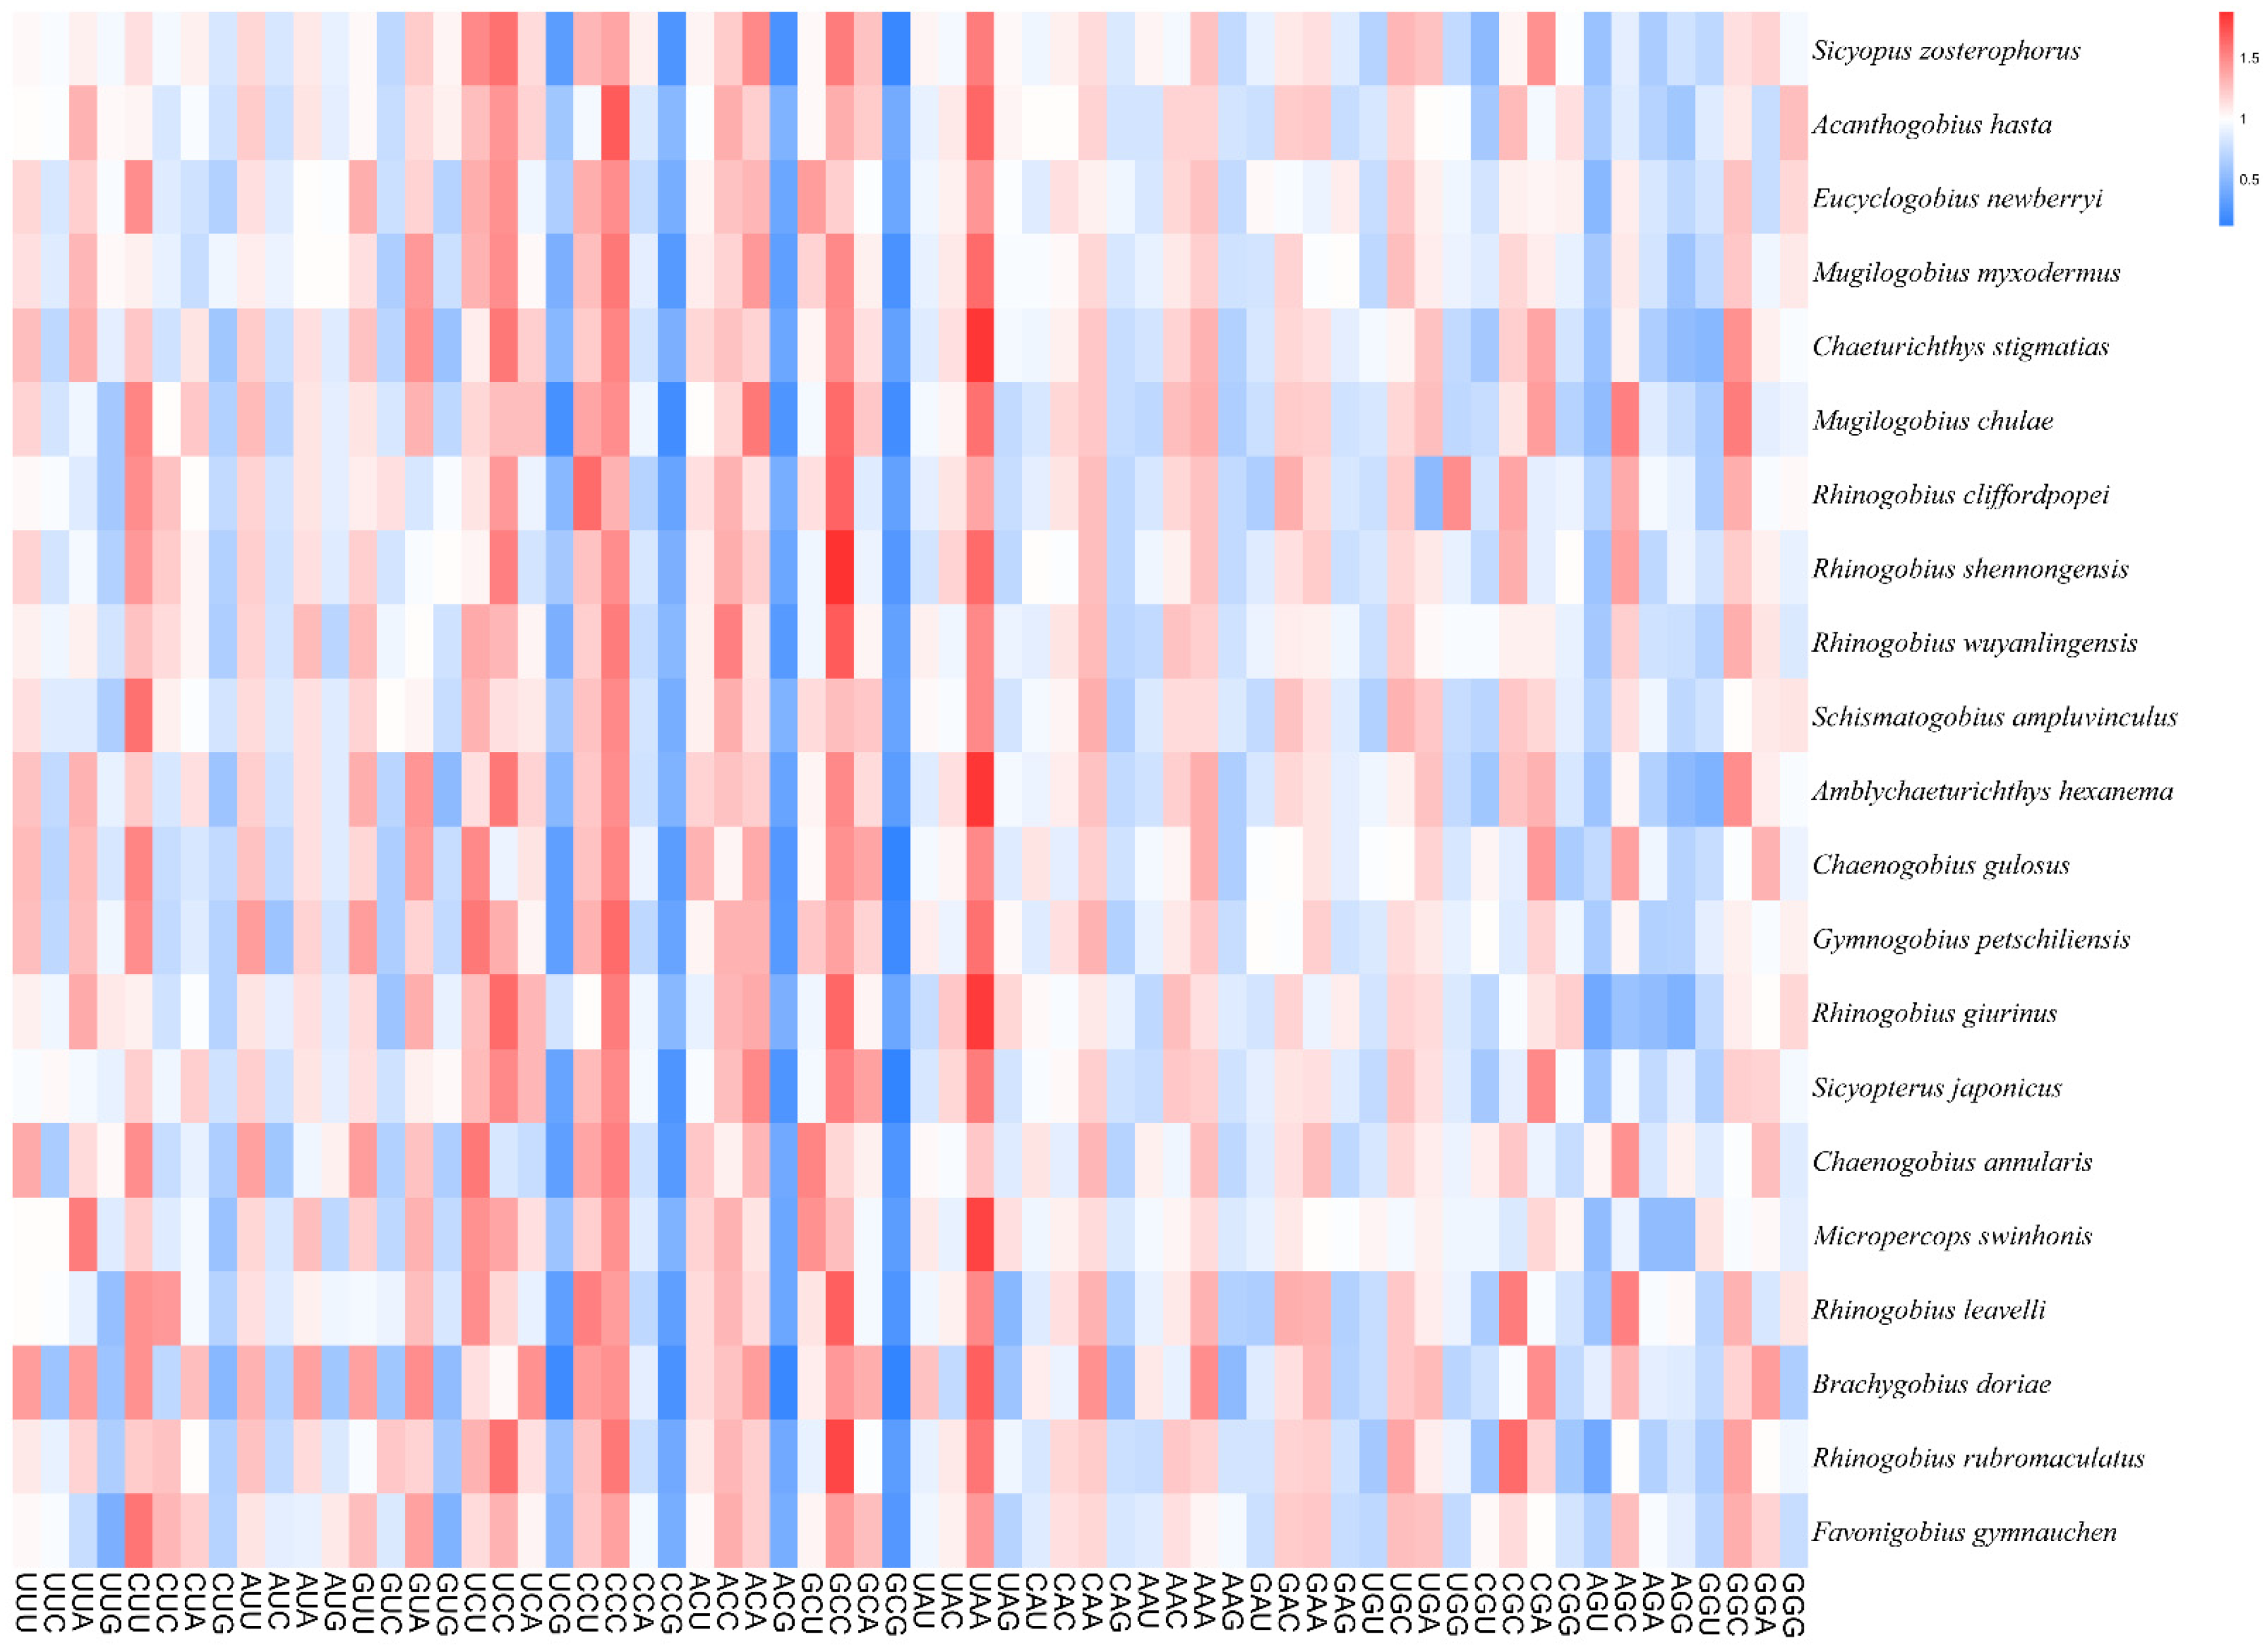
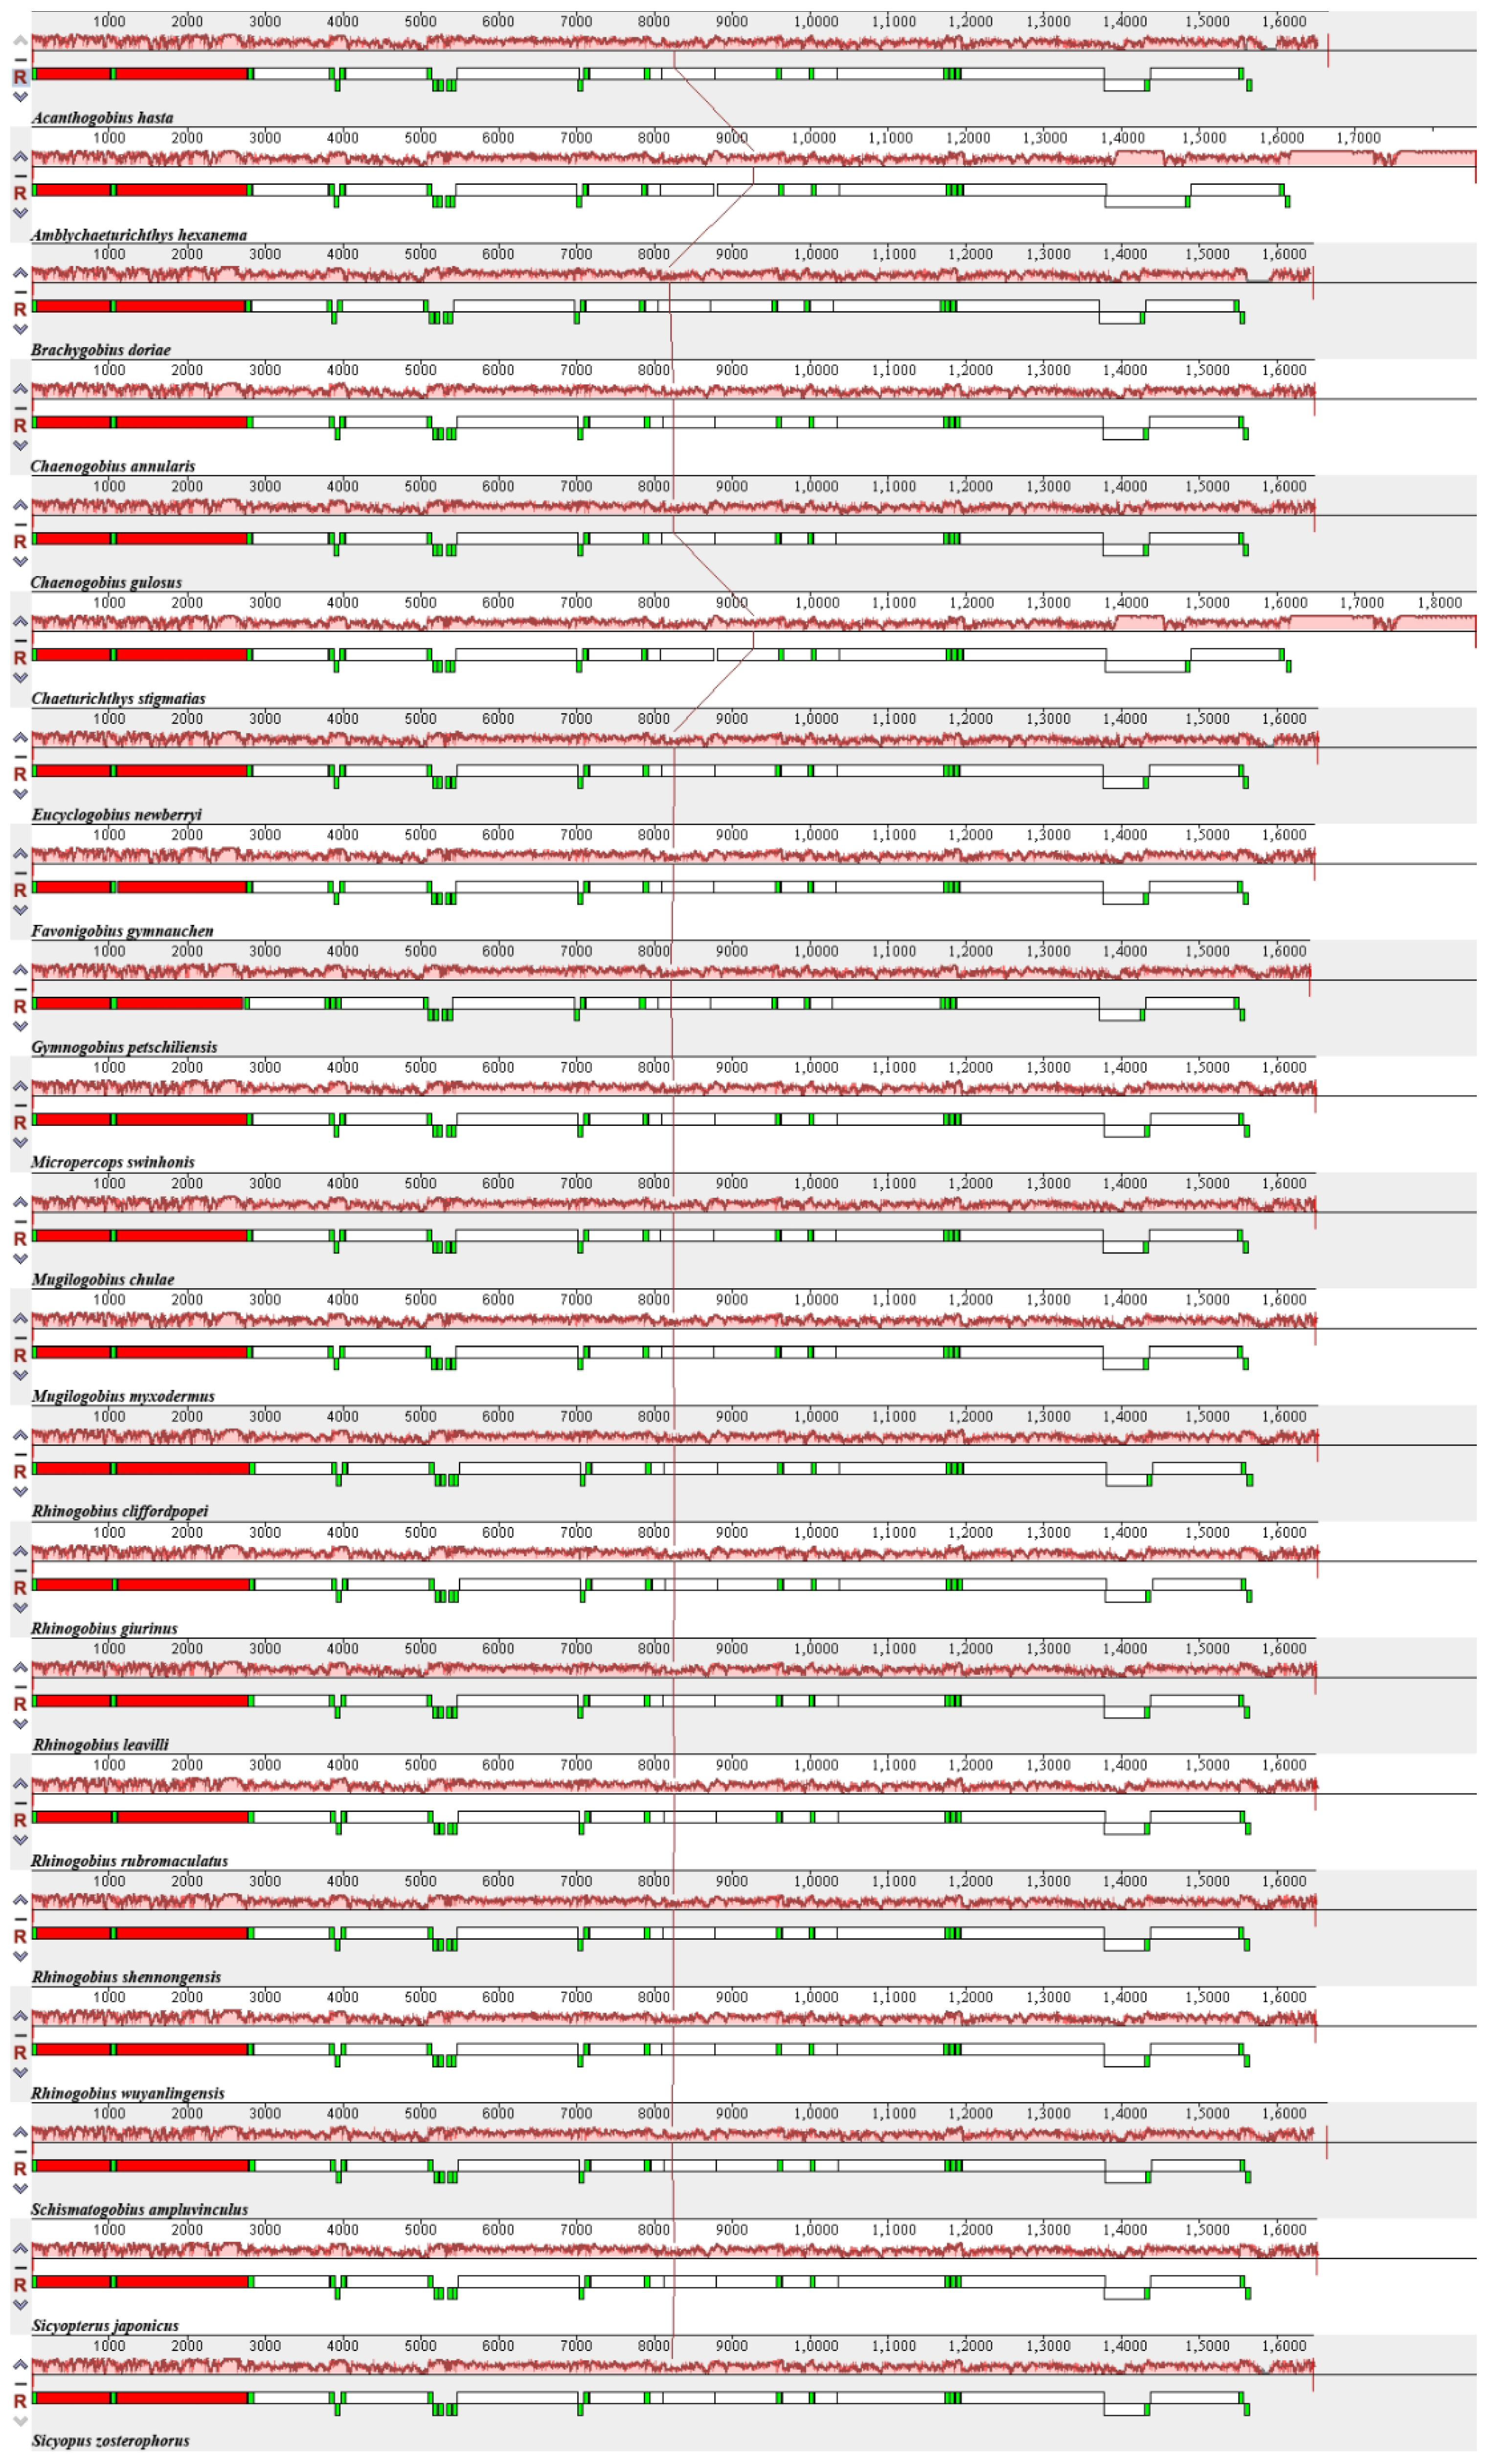
3.2. Comparison of Mitogenomes among Species

Heatmaps based on codon usage (Figure 3) showed that CUU (L), UCU (S), UCC (S), CCC (P), and GCC (A) were the most frequently used codons in the selected mitogenomes. Comparative alignments of the 21 mitogenomes were carried out in Mauve, which showed that the gene order (or synteny of these mitogenomes) was, to a great extent, conservative (Figure 4). An umbrella line was drawn for the “expected ENc value” (i.e., value based on the assumption that only mutational pressure acts on the considered genes), and was compared to the observed ENc values (Figure 5). The effective number of codons (ENc) revealed that all investigated mitogenomes were well below the selection pressure curve.

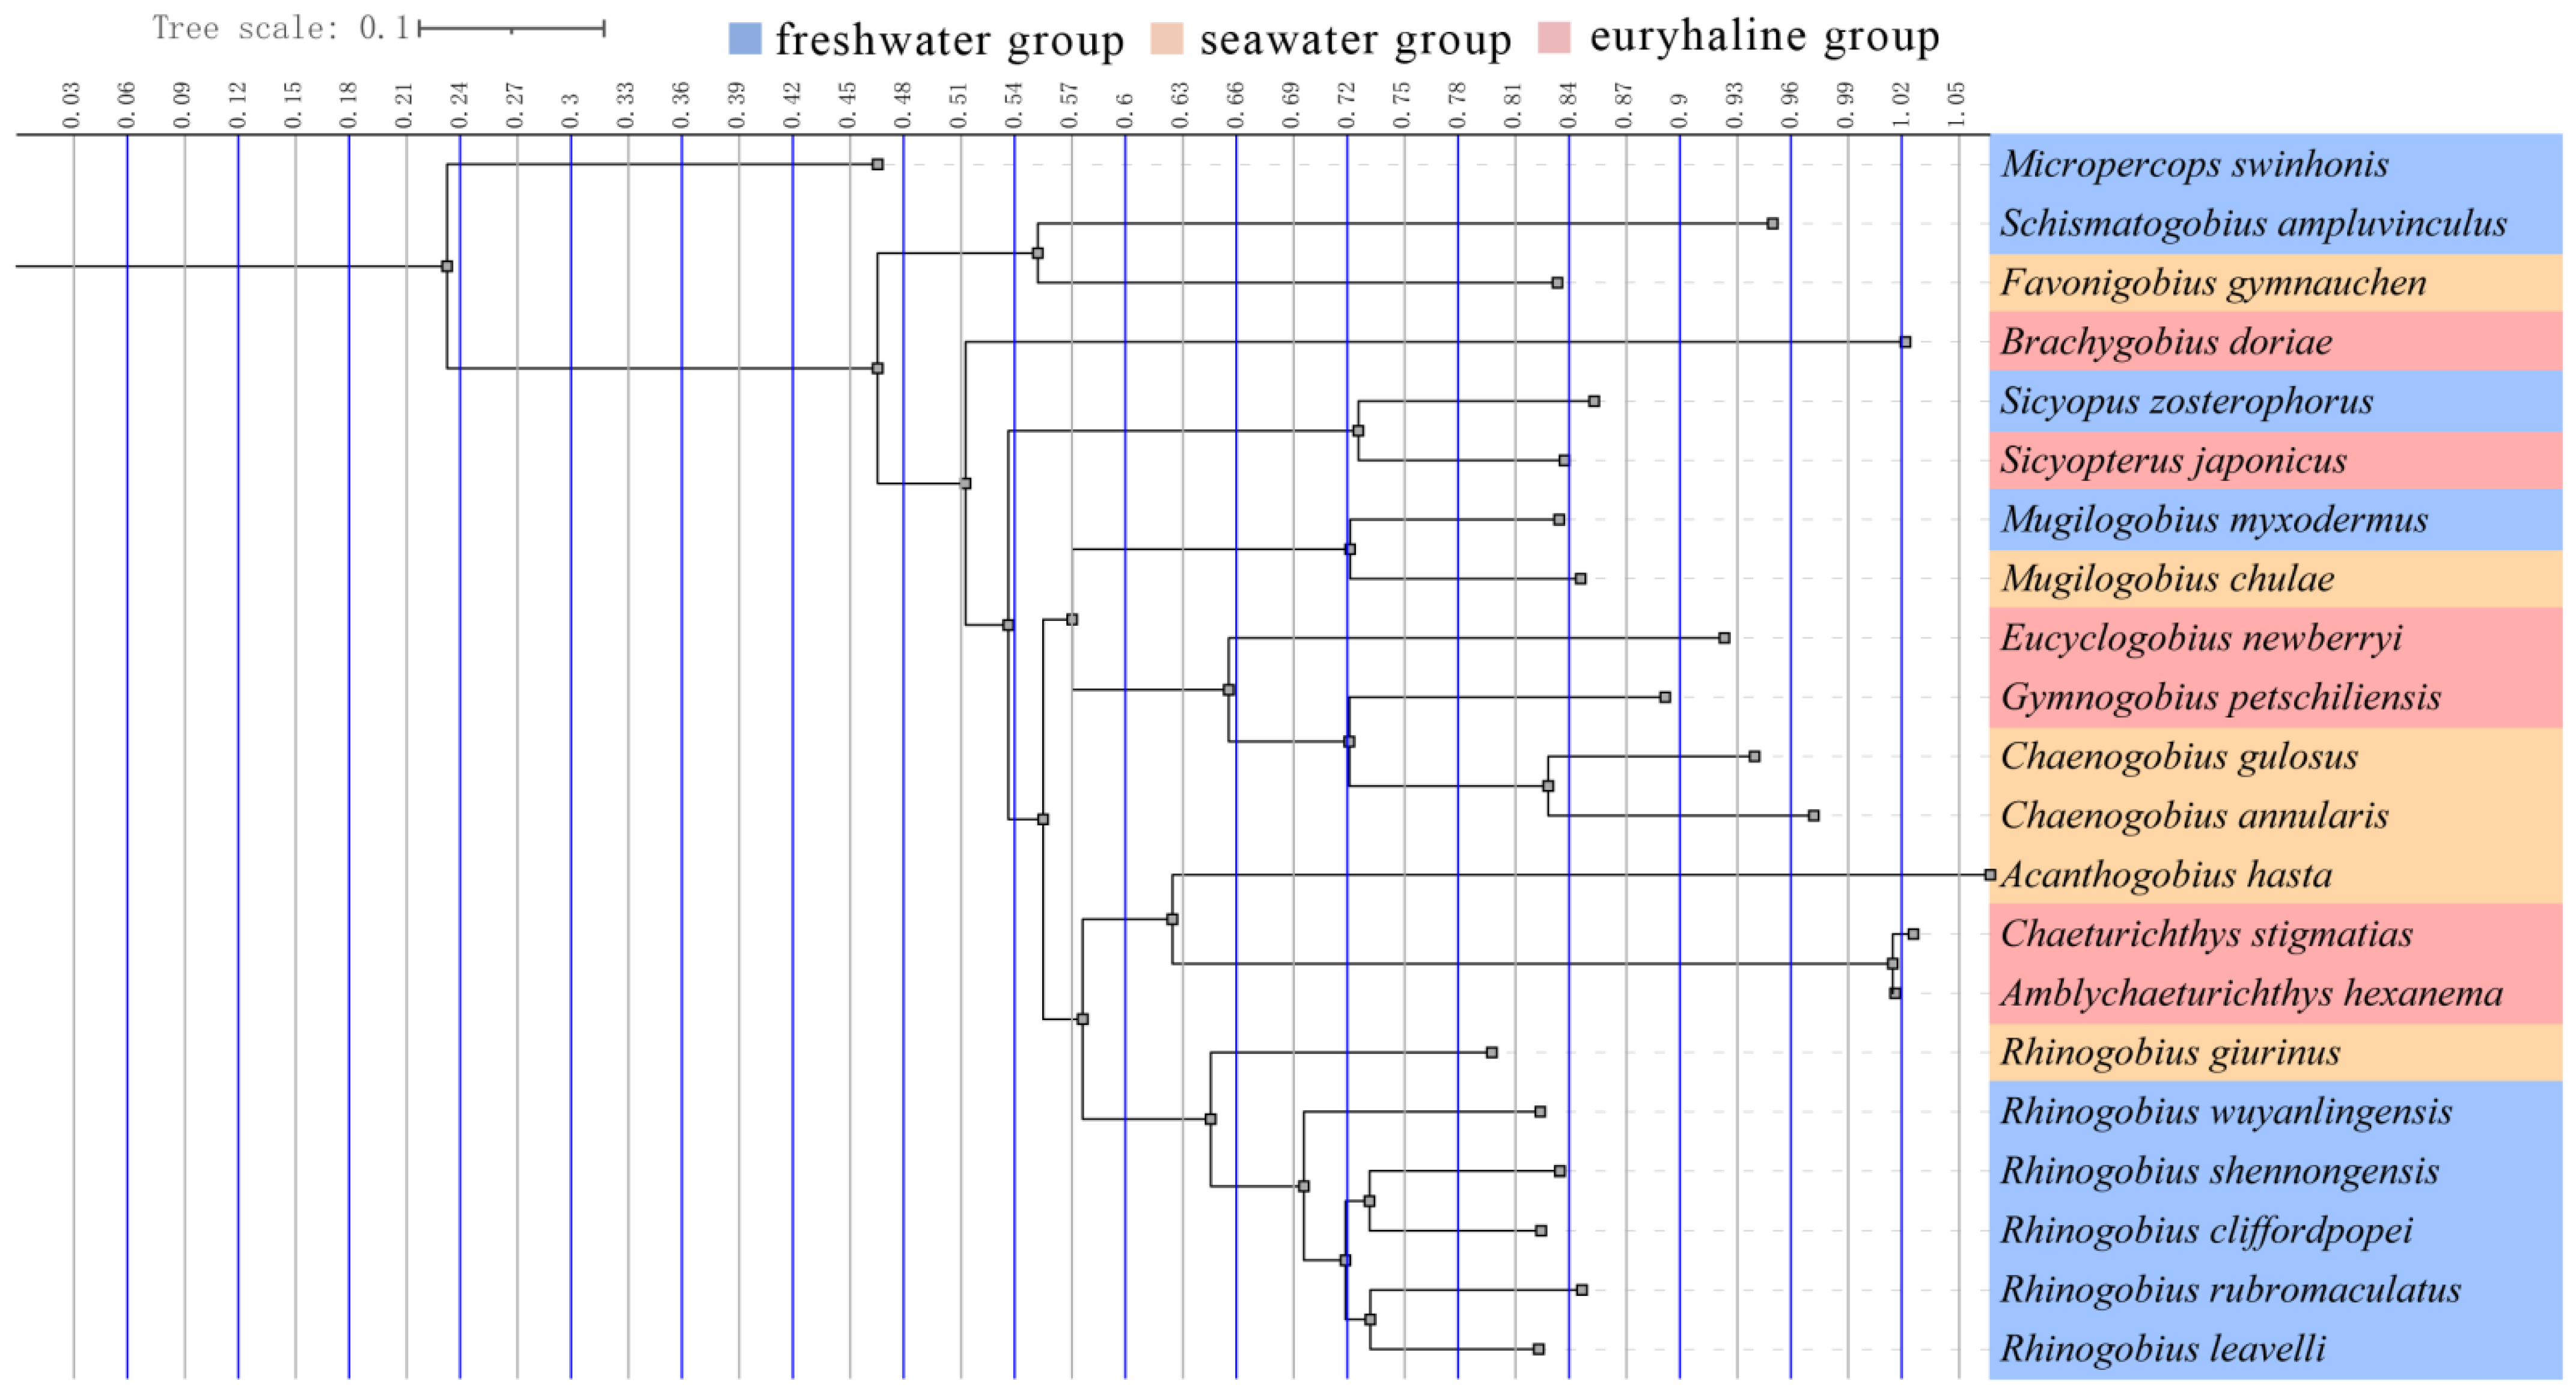
3.3. Phylogenetic Analysis

All Gobiidae species were clustered in a well-supported clade with high bootstrap support values and Bayesian posterior probabilities (Figure 6). Chaenogobius annularis and Chaenogobius gulosus converged in the same clade, whereas Rhinogobius shennongensis, Rhinogobius wuyanlingensis, Rhinogobius rubromaculatus, Rhinogobius leavelli, Rhinogobius cliffordpopei, and Rhinogobius giurinus converged in a separate clade. These evolutionary relationships were consistent with traditional morphological classifications and previous studies [1,34,35].

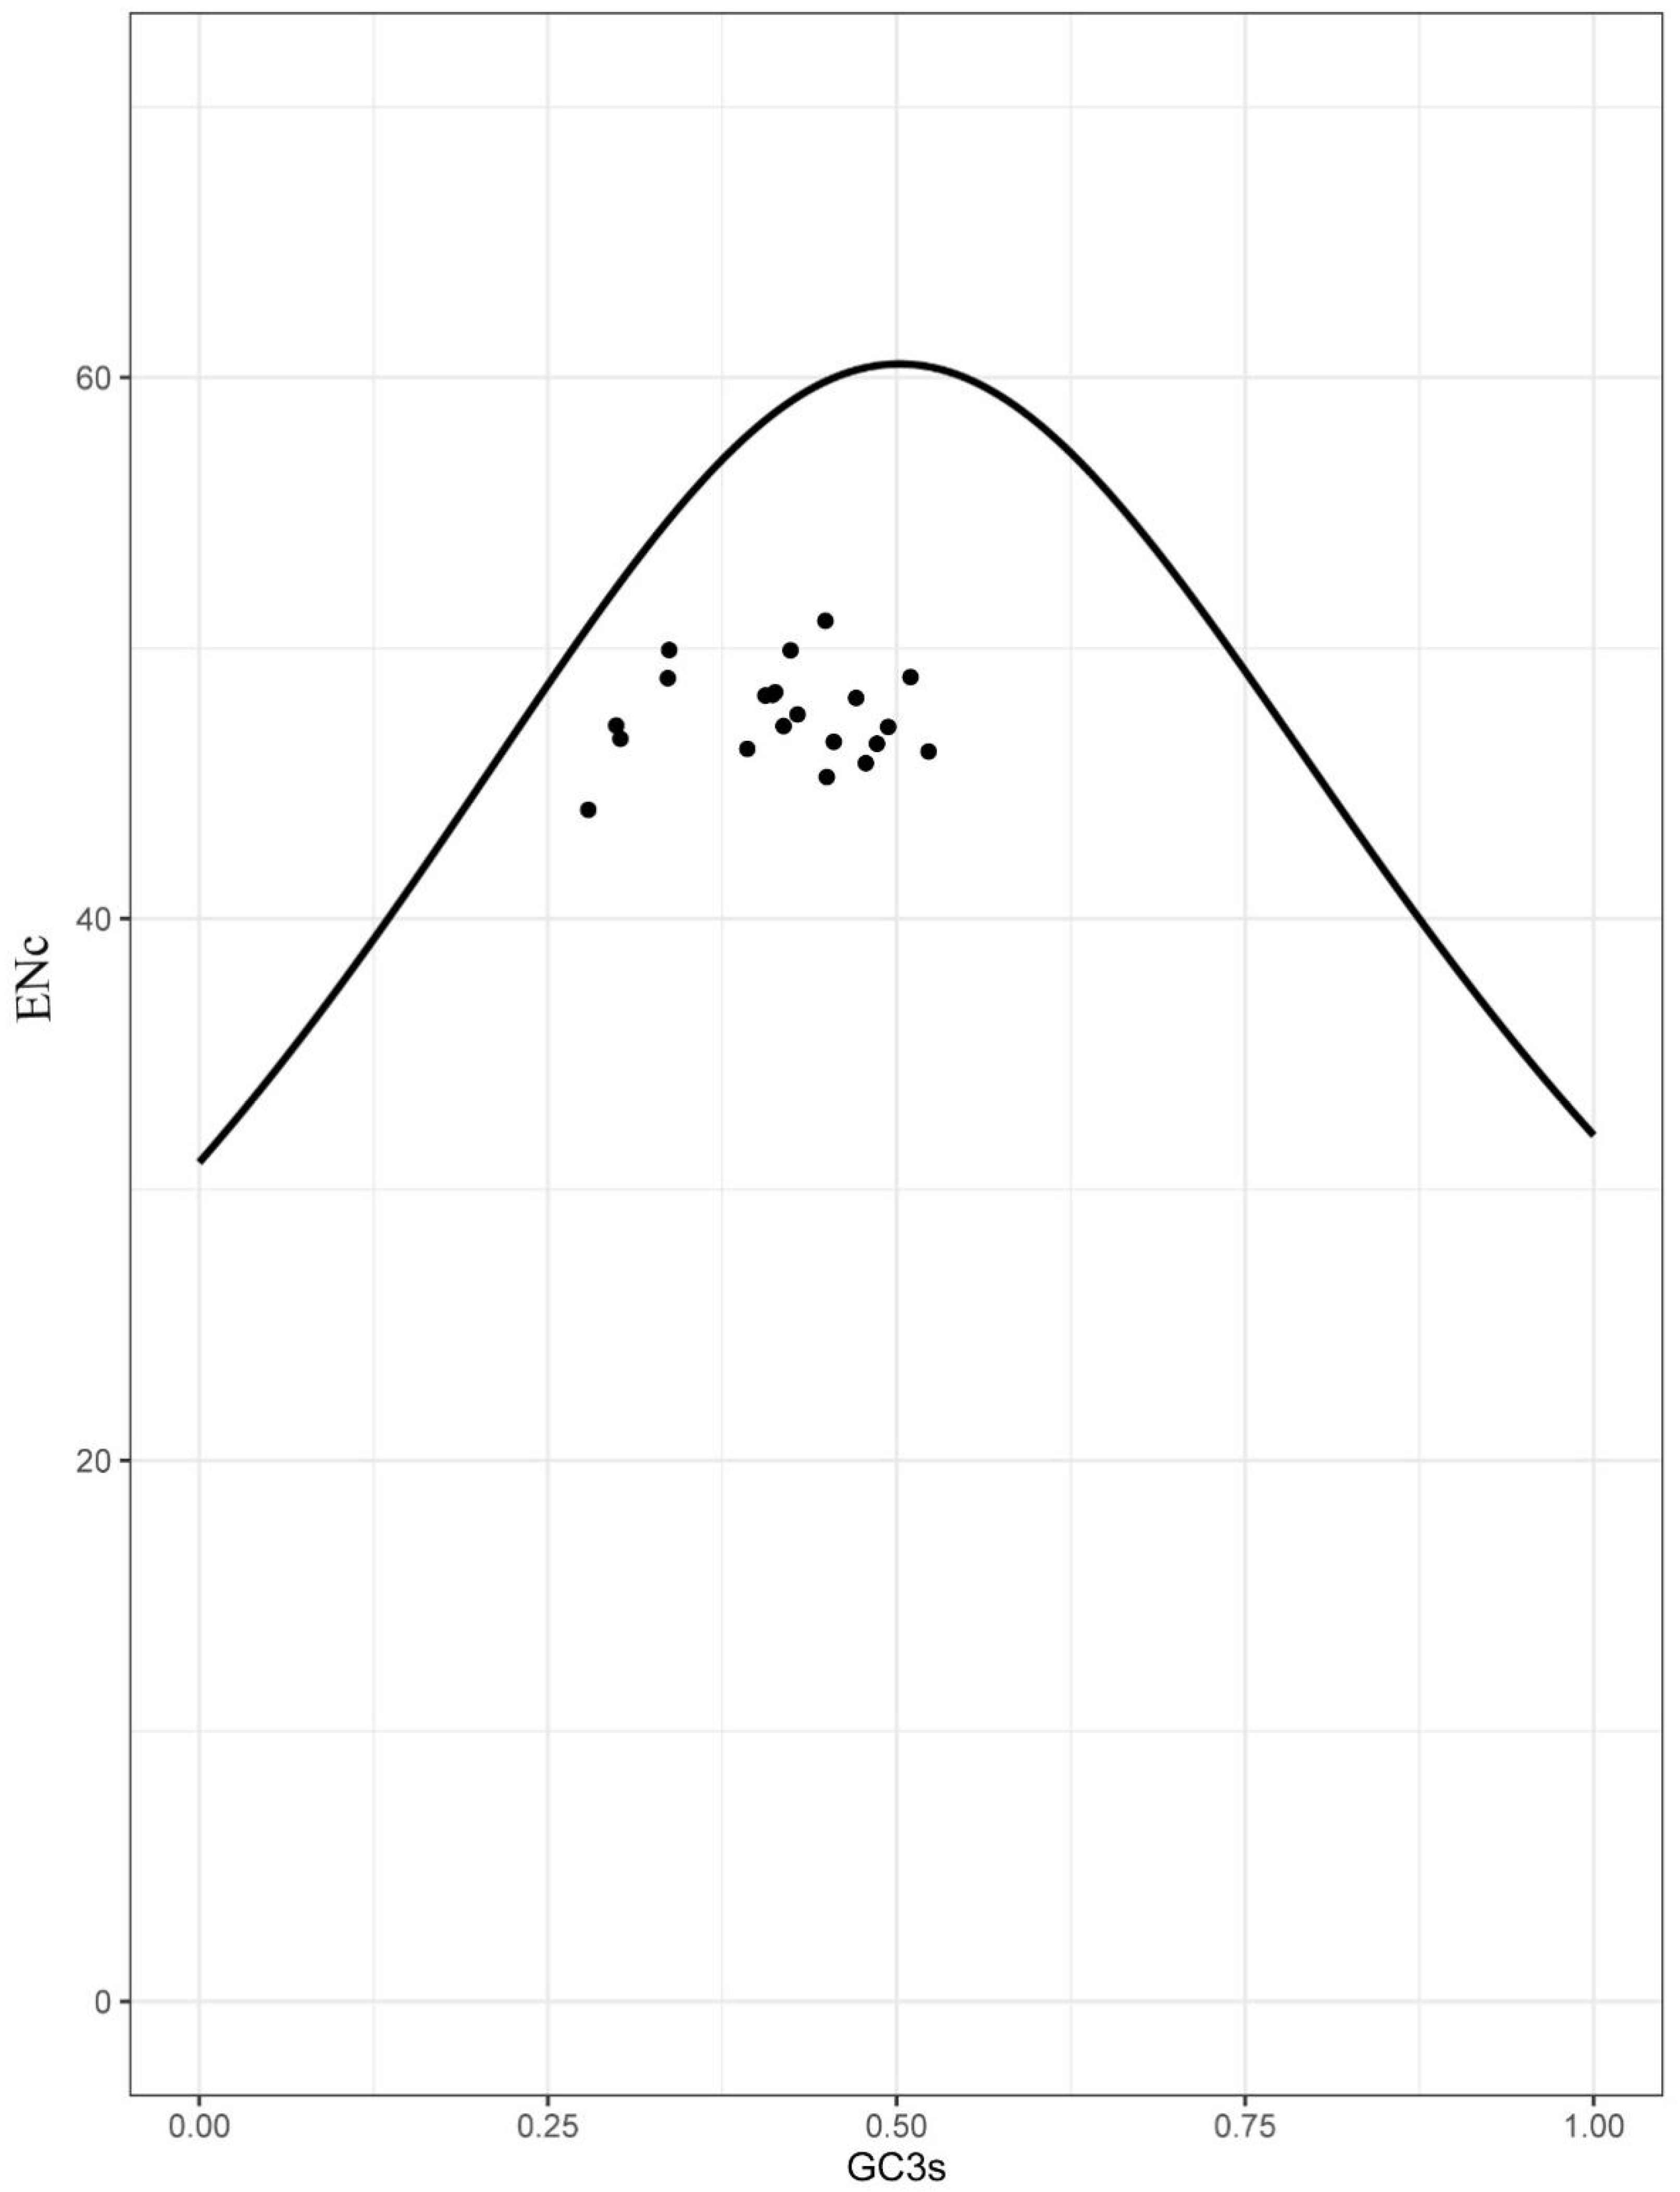
3.4. Selection Analyses

The ω (dN/dS) values from the 13 mtDNA PCGs and each mtDNA PCG of the mitogenomes of 21 species were estimated using the free-ratio model in the PAML package. All ω values (13 mtDNA PCGs and each mtDNA PCG of 21 species) were <1 (Supplementary Figure S3), indicating that all 21 species were under purifying selection.
Out of all the ω values calculated from the 13 mtDNA PCGs of the 21 examined mitogenomes, atp8 had the highest average ω and co1 had the lowest average ω. Thus, the atp8 gene likely evolved more quickly, while the co1 gene might have evolved more slowly, than the other mtDNA PCGs in the mitogenomes (Supplementary Figure S3).
The evolutionary rates of mtDNA PCGs in Gobiidae differed under different environmental selection pressures. The CmC model showed that ω < 1 in all mtDNA PCGs, indicating that these 13 genes were under purification-selection pressure during the evolution of Gobiidae (Table 5). The CmC model also showed that the nine mtDNA PCGs (except co3, nd3, nd4; p > 0.05) were significantly better than those in the M2a_rel model (p < 0.05). The ω values of three genes (atp8, cyb, nd6) in the EG group were higher than those in the SG and FG groups. The branch-site model showed that nd6 and atp8 genes had positively selected sites in the EG groups (Table 6).

4. Discussion

A common question in the field of evolutionary biology is how different environmental conditions shape mitogenomic evolution. Studies have revealed that organisms possess more patterns of adaptation to ecological change than expected [36]. In this comprehensive study, we presented a comparative analysis of the mitogenomes of Gobiidae species and examined natural selection at the molecular genetic level.
To the best of our knowledge, our study is the first to assemble the complete mitogenomes of Chaenogobius annularis, Rhinogobius shennongensis, and Rhinogobius wuyanlingensis using NOVOplasty software. The mitogenome structures and lengths (16,477–16,500 bp) of the three species were consistent with those of other fish species [8,37]. Similar to other animals [38,39], the mitogenomes of Chaenogobius annularis, Rhinogobius shennongensis, and Rhinogobius wuyanlingensis displayed typical circular structure, comprising 13 PCGs, 22 tRNA genes, two rRNA genes, and one partial CR (Figure 1 and Figure S1, Table 2, Table 3 and Table 4). The arrangement and orientation of the genes were similar to those found in other Gobiidae species determined in past research [40,41].
Our study identified some incomplete termination codons. Previous studies showed that the incomplete termination codon could be completed by posttranscriptional polyadenylation. Rhiogobius shennongensis and Rhiogobius wuyanlingensis belong to Rhinogobius, so the termination codons type is T for co2, nd3, nd4, and cyb, while the termination codon type is TA for co3. Chaenogobius annularis belongs to Chaenogobius. Based on the BI tree, this codon type has a distant developmental relationship with Rhinogobius; thus, T is the termination codon type of co2, nd3, and nd4 in Chaenogobius annularis, while TA is the termination codon type of co3.
Previous studies showed that when observed ENc values exceed expected ENc values, complete mutational pressure occurs on the respective genes [42,43]. In contrast, when observed values are less than the expected values, selection pressure lowers the effective number of codons [44]. All plotted points in the current study were located below the umbrella line, indicating that there was more selection pressure than mutational bias on these genes. We also showed that all mitogenomes were translationally efficient, with natural selection playing an important role in these genomes.
Thirteen mtDNA PCGs in the mitochondria of all living organisms are considered important for ATP synthesis and heat generation [45]. Positive selection might provide important functional information relevant to adaptation to a new environment [46]. The ratio of dN/dS is an effective parameter for determining selection pressure [47]. To analyze pressure on mitochondrial PCGs, dN/dS ratios were evaluated for 21 species in our study. We found that each mtDNA PCG in the 21 species was generally lower than 1, indicating that mtDNA PCGs were subjected to purifying selection in different environments. Similar results were obtained by previous studies on marine turtles [36], horseshoe bats [48], and birds [49]. In addition, different dN/dS values for each of the 13 mtDNA PCGs indicate differing functional constraints among the genes [50]. Our results showed that difference in environments affects the evolutionary rate of mtDNA PCGs in Gobiidae. Our results also showed that atp8 had a faster evolutionary rate than other mtDNA PCGs (Figure S1), indicating that atp8 experienced more relaxed selective constraints than other mtDNA PCGs, allowing more mutations to accumulate [51].
The CmC model was used to explore whether different environments impacted Gobiidae. The ω ratios for the three branches (groups FG, SG, and EG) were far lower than 1. Thus, purifying selection was the major evolutionary pattern of mitochondria, implying strong evolutionary constraints on the mitogenome. This indicated the existence of strong selective pressure, with Gobiidae experiencing strong evolutionary constraints against the elimination of deleterious mutations and, hence, maintaining them. Previous studies recorded positive selection for nd5 in vertebrates adapting to high altitudes [52]. Furthermore, positive selection was recorded for nd4, cyb, and atp8 in the adaptation of bats to flight [53]. Our study showed that the genes nd6 and atp8 had positively selected sites in EG; thus, nd6 and atp8 might be essential for the evolutionary processes of EG. The peptides encoded by nd6 were involved in the catalytic synthesis of ATP. Furthermore, atp8 coded subunits of complex V of the respiratory chain, namely ATP synthase, which is responsible for ATP production [54,55]. The positive selection site signals for nd6 and atp8 found in EG might be relevant to their adaptations for energy requirements. The euryhaline group lives in multiple environments (i.e., along a varying saline gradient), and so requires more energy to adapt to associated changes; thus, positive gene selection sites might be associated with adaptation to energy metabolism in different environments. Rhinogobius shennongensis, Rhinogobius wuyanlingensis, and Chaenogobius annularis only inhabit freshwater and seawater, respectively, and so are subject to relatively less environmental pressure than the Euryhaline group. Thus, the evolution of mtDNA PCGs is key to organisms being able to adapt to different environments in Gobiidae. Furthermore, because of the large number of Gobiidae species and limited data, mitochondrial genome studies remain largely underexploited. We hope that our study will stimulate more genome studies on Gobiidae, and reveal more details on the molecular mechanisms underlying the adaptation of Gobiidae to different environments.

5. Conclusions

The fact that Gobiidae inhabit both freshwater and seawater shows that they have adapted to extremely harsh conditions, and are able to tolerate limited oxygen and high seawater salinity. Our study described the mitogenomes of Chaenogobius annularis (16,477 bp), Rhinogobius shennongensis (16,500 bp), and Rhinogobius wuyanlingensis (16,491 bp). These mitogenomes contained 13 PCGs, two rRNAs, 22 tRNAs, and one CR. We found that the ω ratios of all mtPCGs were <1, indicating that these genes perform an important function, and undergo purifying selection to maintain that function. The evolutionary rate of atp8 in Gobiidae (all three environments) was higher than that of other mtDNA PCGs. We found evidence of positive selection at the coding level for several sites in the nd6 and atp8 genes for EG. This finding indicates an ability (EG group species) to adapt to differing energy requirements. In summary, our study provides molecular evidence for the evolution of different lifestyles, and valuable information for further phylogenetic and evolutionary research on the Gobiidae family.

Supplementary Materials

The following supporting information can be downloaded at: www.mdpi.com/article/10.3390/ani12141741/s1, Supplementary Figure S1: Gene map of mitogenome of Chaenogobius annularis (a), Rhinogobius wuyanlingensis (b). The genes outside the circle were transcribed clockwise, while the genes inside were transcribed counterclockwise. Supplementary Figure S2: The relative synonymous codon usage (RSCU) of Chaenogobius annularis (a), Rhinogobius wuyanlingensis (b). Codon families are plotted on the X axis. Supplementary Figure S3: Boxplot of dN/dS (ω) value of the 13 mtDNA PCGs (each mtDNA PCG) across the 21 species mitogenomes; Table S1: Positive selection on 13 mtDNA PCGs of euryhaline group (foreground branch), seawater group and freshwater group (background branch) through branch-site model. Supplementary Table S2: The ω values of 13 mtDNA PCGs and each mtDNA PCGs of 21 species.

Author Contributions

Y.S.: Data curation; formal analysis; project administration; writing–original draft; writing–review and editing. X.W. (Xibao Wang): formal analysis; project administration. G.L.: project administration. X.W. (Xiaoyang Wu): project administration. Q.W.: project administration. G.S.: formal analysis. X.M.: formal analysis. Y.D.: formal analysis. W.S.: project administration. H.Z.: funding acquisition; project administration. All authors have read and agreed to the published version of the manuscript.

Funding

This research was funded by the National Natural Science Foundation of China (31872242, 32070405, 32001228, and 32170530).

Institutional Review Board Statement

Ethical review and approval were waived for this study, due to the fact that only non-invasive samples were collected and analyzed.

Informed Consent Statement

Not applicable.

Data Availability Statement

All the mitochondria genomes sequences used in this study were accessed through the GenBank database using the accession numbers in Table 1.

Acknowledgments

We thank the National Center for Biotechnology Information (NCBI) Database for providing the data platform.

Conflicts of Interest

The authors declare that the research was conducted in the absence of any commercial or financial relationships that could be construed as a potential conflict of interest.

References

  1. Parenti, L.R.; Nelson, J.S. Fishes of the World. Copeia 1995, 1995, 262–264. [Google Scholar] [CrossRef]
  2. Hubbs, C.; Moser, H.G.; Richards, W.J.; Cohen, D.M.; Fahay, M.P.; Kendall, A.W.; Richardson, S.L. Ontogeny and Systematics of Fishes. Copeia 1985, 1985, 523. [Google Scholar] [CrossRef]
  3. Bauchot, M.L.; Hureau, J.C. Fishes of the North-Eastern Atlantic and the Mediterranean. Unesco 1986, 61, 290. [Google Scholar]
  4. Van der Giezen, M.; Tovar, J.; Clark, C.G. Mitochondrion-Derived Organelles in Protists and Fungi. Int. Rev. Cytol. 2005, 244, 175–225. [Google Scholar] [CrossRef]
  5. Van der Bliek, A.M.; Sedensky, M.M.; Morgan, P.G. Cell Biology of the Mitochondrion. Genetics 2017, 207, 843–871. [Google Scholar] [CrossRef] [Green Version]
  6. Brand, M.D. Regulation analysis of energy metabolism. J. Exp. Biol. 1997, 200, 193–202. [Google Scholar] [CrossRef]
  7. Shinde, S.; Bhadra, U. A complex genome-microRNA interplay in human mitochondria. BioMed Res. Int. 2015, 2015, 206382. [Google Scholar] [CrossRef] [Green Version]
  8. Liu, Y.; Wu, P.D.; Zhang, D.Z.; Zhang, H.B.; Tang, B.P.; Liu, Q.N.; Dai, L.S. Mitochondrial genome of the yellow catfish Pelteobagrus fulvidraco and insights into Bagridae phylogenetics. Genomics 2019, 111, 1258–1265. [Google Scholar] [CrossRef]
  9. Mascolo, C.; Ceruso, M.; Palma, G.; Anastasio, A.; Pepe, T.; Sordino, P. The complete mitochondrial genome of the Pink dentex Dentex gibbosus (Perciformes: Sparidae). Mitochondrial DNA Part B Resour. 2018, 3, 525–526. [Google Scholar] [CrossRef] [Green Version]
  10. Taanman, J.-W. The mitochondrial genome: Structure, transcription, translation and replication. Biochim. Biophys. Acta (BBA)-Bioenerg. 1999, 1410, 103–123. [Google Scholar] [CrossRef] [Green Version]
  11. Yang, C.; Chen, Y.; Chen, Z.; He, G.; Zhong, Z.; Xue, W. The next-generation sequencing reveals the complete mitochondrial genome of Rhinogobius formosanus (Perciformes: Gobiidae). Mitochondrial DNA Part B Resour. 2020, 5, 2673–2674. [Google Scholar] [CrossRef] [PubMed]
  12. Dhar, D.; Dey, D.; Basu, S.; Fortunato, H. Insight into the adaptive evolution of mitochondrial genomes in intertidal chitons. J. Molluscan Stud. 2021, 87, eyab018. [Google Scholar] [CrossRef]
  13. Sokolova, I. Mitochondrial Adaptations to Variable Environments and Their Role in Animals’ Stress Tolerance. Integr. Comp. Biol. 2018, 58, 519–531. [Google Scholar] [CrossRef] [PubMed]
  14. Lartigue, L.; Faustin, B. Mitochondria: Metabolic regulators of innate immune responses to pathogens and cell stress. Int. J. Biochem. Cell Biol. 2013, 45, 2052–2056. [Google Scholar] [CrossRef]
  15. Caccone, A.; Gentile, G.; Burns, C.E.; Sezzi, E.; Bergman, W.; Ruelle, M.; Saltonstall, K.; Powell, J.R. Extreme difference in rate of mitochondrial and nuclear DNA evolution in a large ectotherm, Galapagos tortoises. Mol. Phylogenetics Evol. 2004, 31, 794–798. [Google Scholar] [CrossRef]
  16. Harrison, R.G. Animal mitochondrial DNA as a genetic marker in population and evolutionary biology. Trends Ecol. Evol. 1989, 4, 6–11. [Google Scholar] [CrossRef]
  17. Gissi, C.; Iannelli, F.; Pesole, G. Evolution of the mitochondrial genome of Metazoa as exemplified by comparison of congeneric species. Heredity 2008, 101, 301–320. [Google Scholar] [CrossRef] [Green Version]
  18. Saccone, C.; De Giorgi, C.; Gissi, C.; Pesole, G.; Reyes, A. Evolutionary genomics in Metazoa: The mitochondrial DNA as a model system. Gene 1999, 238, 195–209. [Google Scholar] [CrossRef]
  19. Lopez-Lopez, A.; Vogler, A.P. The mitogenome phylogeny of Adephaga (Coleoptera). Mol. Phylogenetics Evol. 2017, 114, 166–174. [Google Scholar] [CrossRef] [Green Version]
  20. Liu, M.; Zhang, Z.; Peng, Z. The mitochondrial genome of the water spiderArgyroneta aquatica(Araneae: Cybaeidae). Zool. Scr. 2015, 44, 179–190. [Google Scholar] [CrossRef]
  21. Zhang, Z.; Xing, Y.; Cheng, J.; Pan, D.; Lv, L.; Cumberlidge, N.; Sun, H. Phylogenetic implications of mitogenome rearrangements in East Asian potamiscine freshwater crabs (Brachyura: Potamidae). Mol. Phylogenetics Evol. 2020, 143, 106669. [Google Scholar] [CrossRef] [PubMed]
  22. Whitehead, A. Comparative mitochondrial genomics within and among species of killifish. BMC Evol. Biol. 2009, 9, 11. [Google Scholar] [CrossRef] [PubMed] [Green Version]
  23. Li, F.; Lv, Y.; Wen, Z.; Bian, C.; Zhang, X.; Guo, S.; Shi, Q.; Li, D. The complete mitochondrial genome of the intertidal spider (Desis jiaxiangi) provides novel insights into the adaptive evolution of the mitogenome and the evolution of spiders. BMC Ecol. Evol. 2021, 21, 72. [Google Scholar] [CrossRef] [PubMed]
  24. Dierckxsens, N.; Mardulyn, P.; Smits, G. NOVOPlasty: De novo assembly of organelle genomes from whole genome data. Nucleic Acids Res. 2017, 45, e18. [Google Scholar] [CrossRef] [PubMed] [Green Version]
  25. Bernt, M.; Donath, A.; Juhling, F.; Externbrink, F.; Florentz, C.; Fritzsch, G.; Putz, J.; Middendorf, M.; Stadler, P.F. MITOS: Improved de novo metazoan mitochondrial genome annotation. Mol. Phylogenetics Evol. 2013, 69, 313–319. [Google Scholar] [CrossRef]
  26. Kumar, S.; Stecher, G.; Li, M.; Knyaz, C.; Tamura, K.; Battistuzzi, F.U. MEGA X: Molecular Evolutionary Genetics Analysis across Computing Platforms. Mol. Biol. Evol. 2018, 35, 1547–1549. [Google Scholar] [CrossRef]
  27. He, W.; Wang, N.; Tan, J.; Wang, R.; Yang, Y.; Li, G.; Guan, H.; Zheng, Y.; Shi, X.; Ye, R.; et al. Comprehensive codon usage analysis of porcine deltacoronavirus. Mol. Phylogenetics Evol. 2019, 141, 106618. [Google Scholar] [CrossRef]
  28. Perna, N.T.; Kocher, T.D. Patterns of nucleotide composition at fourfold degenerate sites of animal mitochondrial genomes. J. Mol. Evol. 1995, 41, 353–358. [Google Scholar] [CrossRef]
  29. Edgar, R.C. MUSCLE: Multiple sequence alignment with high accuracy and high throughput. Nucleic Acids Res. 2004, 32, 1792–1797. [Google Scholar] [CrossRef] [Green Version]
  30. Zhang, D.; Gao, F.; Jakovlić, I.; Zou, H.; Zhang, J.; Li, W.X.; Wang, G.T. PhyloSuite: An integrated and scalable desktop platform for streamlined molecular sequence data management and evolutionary phylogenetics studies. Mol. Ecol. Resour. 2020, 20, 348–355. [Google Scholar] [CrossRef]
  31. Ronquist, F.; Teslenko, M.; van der Mark, P.; Ayres, D.L.; Darling, A.; Hohna, S.; Larget, B.; Liu, L.; Suchard, M.A.; Huelsenbeck, J.P. MrBayes 3.2: Efficient Bayesian phylogenetic inference and model choice across a large model space. Syst. Biol. 2012, 61, 539–542. [Google Scholar] [CrossRef] [PubMed] [Green Version]
  32. Letunic, I.; Bork, P. Interactive Tree Of Life (iTOL) v4: Recent updates and new developments. Nucleic Acids Res. 2019, 47, W256–W259. [Google Scholar] [CrossRef] [Green Version]
  33. Yang, Z. PAML 4: Phylogenetic analysis by maximum likelihood. Mol. Biol. Evol. 2007, 24, 1586–1591. [Google Scholar] [CrossRef] [PubMed] [Green Version]
  34. Wang, H.Y.; Tsai, M.P.; Dean, J.; Lee, S.C. Molecular phylogeny of gobioid fishes (Perciformes: Gobioidei) based on mitochondrial 12S rRNA sequences. Mol. Phylogenetics Evol. 2001, 20, 390–408. [Google Scholar] [CrossRef] [PubMed]
  35. Maxfield, J.M.; Van Tassell, J.L.; St Mary, C.M.; Joyeux, J.C.; Crow, K.D. Extreme gender flexibility: Using a phylogenetic framework to infer the evolution of variation in sex allocation, phylogeography, and speciation in a genus of bidirectional sex changing fishes(Lythrypnus, Gobiidae). Mol. Phylogenetics Evol. 2012, 64, 416–427. [Google Scholar] [CrossRef] [PubMed]
  36. Ramos, E.; Freitas, L.; Nery, M.F. The role of selection in the evolution of marine turtles mitogenomes. Sci. Rep. 2020, 10, 16953. [Google Scholar] [CrossRef]
  37. Zhang, Y.; Li, X.H.; Tian, F.; Liu, S.J.; Feng, C.G.; Zhao, K. Mitochondrial genome and phylogenetic relationship of Gymnocypris eckloni (Schizothoracinae) in Qaidam river basin. Genomics 2020, 112, 4316–4321. [Google Scholar] [CrossRef]
  38. Yi, J.; Wu, H.; Liu, J.; Li, J.; Lu, Y.; Zhang, Y.; Cheng, Y.; Guo, Y.; Li, D.; An, Y. Novel gene rearrangement in the mitochondrial genome of Anastatus fulloi (Hymenoptera Chalcidoidea) and phylogenetic implications for Chalcidoidea. Sci. Rep. 2022, 12, 1351. [Google Scholar] [CrossRef]
  39. Sun, Y.; Huang, H.; Liu, Y.; Liu, S.; Xia, J.; Zhang, K.; Geng, J. Organization and phylogenetic relationships of the mitochondrial genomes of Speiredonia retorta and other lepidopteran insects. Sci. Rep. 2021, 11, 2957. [Google Scholar] [CrossRef]
  40. Kim, I.C.; Kweon, H.S.; Kim, Y.J.; Kim, C.B.; Gye, M.C.; Lee, W.O.; Lee, Y.S.; Lee, J.S. The complete mitochondrial genome of the javeline goby Acanthogobius hasta (Perciformes, Gobiidae) and phylogenetic considerations. Gene 2004, 336, 147–153. [Google Scholar] [CrossRef]
  41. Liu, T.; Jin, X.; Wang, R.; Xu, T. Complete sequence of the mitochondrial genome of Odontamblyopus rubicundus (Perciformes: Gobiidae): Genome characterization and phylogenetic analysis. J. Genet. 2013, 92, 423–432. [Google Scholar] [CrossRef] [PubMed]
  42. Roy, A.; Mukhopadhyay, S.; Sarkar, I.; Sen, A. Comparative investigation of the various determinants that influence the codon and amino acid usage patterns in the genus Bifidobacterium. World J. Microbiol. Biotechnol. 2015, 31, 959–981. [Google Scholar] [CrossRef] [PubMed]
  43. Smith, R. Enhanced effective codon numbers to understand codon usage bias. BioRxiv 2019, 1–22. [Google Scholar] [CrossRef] [Green Version]
  44. Dey, P.; Sharma, S.K.; Sarkar, I.; Ray, S.D.; Pramod, P.; Kochiganti, V.H.S.; Quadros, G.; Rathore, S.S.; Singh, V.; Singh, R.P. Complete mitogenome of endemic plum-headed parakeet Psittacula cyanocephala-characterization and phylogenetic analysis. PLoS ONE 2021, 16, e0241098. [Google Scholar] [CrossRef]
  45. Wang, Y.; Shen, Y.; Feng, C.; Zhao, K.; Song, Z.; Zhang, Y.; Yang, L.; He, S. Mitogenomic perspectives on the origin of Tibetan loaches and their adaptation to high altitude. Sci. Rep. 2016, 6, 29690. [Google Scholar] [CrossRef] [Green Version]
  46. Nielsen, R. Molecular signatures of natural selection. Annu. Rev. Genet. 2005, 39, 197–218. [Google Scholar] [CrossRef] [Green Version]
  47. Yang, Z.; Bielawski, J.P. Statistical methods for detecting molecular adaptation. Trends Ecol. Evol. 2000, 15, 496–503. [Google Scholar] [CrossRef]
  48. Zhang, L.; Sun, K.; Csorba, G.; Hughes, A.C.; Jin, L.; Xiao, Y.; Feng, J. Complete mitochondrial genomes reveal robust phylogenetic signals and evidence of positive selection in horseshoe bats. BMC Ecol. Evol. 2021, 21, 199. [Google Scholar] [CrossRef]
  49. Shen, Y.Y.; Shi, P.; Sun, Y.B.; Zhang, Y.P. Relaxation of selective constraints on avian mitochondrial DNA following the degeneration of flight ability. Genome Res. 2009, 19, 1760–1765. [Google Scholar] [CrossRef] [Green Version]
  50. Muse, S.V. Examining rates and patterns of nucleotide substitution in plants. Plant Mol. Biol. 2000, 42, 25–43. [Google Scholar] [CrossRef]
  51. Yang, H.; Li, T.; Dang, K.; Bu, W. Compositional and mutational rate heterogeneity in mitochondrial genomes and its effect on the phylogenetic inferences of Cimicomorpha (Hemiptera: Heteroptera). BMC Genom. 2018, 19, 264. [Google Scholar] [CrossRef] [PubMed] [Green Version]
  52. Wang, X.; Zhou, S.; Wu, X.; Wei, Q.; Shang, Y.; Sun, G.; Mei, X.; Dong, Y.; Sha, W.; Zhang, H. High-altitude adaptation in vertebrates as revealed by mitochondrial genome analyses. Ecol. Evol. 2021, 11, 15077–15084. [Google Scholar] [CrossRef] [PubMed]
  53. Shen, Y.Y.; Liang, L.; Zhu, Z.H.; Zhou, W.P.; Irwin, D.M.; Zhang, Y.P. Adaptive evolution of energy metabolism genes and the origin of flight in bats. Proc. Natl. Acad. Sci. USA 2010, 107, 8666–8671. [Google Scholar] [CrossRef] [PubMed] [Green Version]
  54. Anderson, S.; Bankier, A.T.; Barrell, B.G.; de Bruijn, M.H.; Coulson, A.R.; Drouin, J.; Eperon, I.C.; Nierlich, D.P.; Roe, B.A.; Sanger, F.; et al. Sequence and organization of the human mitochondrial genome. Nature 1981, 290, 457–465. [Google Scholar] [CrossRef] [PubMed]
  55. Jonckheere, A.I.; Smeitink, J.A.; Rodenburg, R.J. Mitochondrial ATP synthase: Architecture, function and pathology. J. Inherit. Metab. Dis. 2012, 35, 211–225. [Google Scholar] [CrossRef] [Green Version]
Figure 1. Gene map of mitogenome of Chaenogobius annularis. The genes outside the circle are transcribed clockwise, whereas the genes inside the circle are transcribed counterclockwise.
Animals 12 01741 g001
Figure 2. Relative synonymous codon usage (RSCU) of Chaenogobius annularis. Codon families are plotted on the x-axis. Codon type is presented beneath each codon family. On the histogram, the proportion of each codon type (retaining same color code) as a proportion of the respective codon family.
Animals 12 01741 g002
Figure 3. Heatmap based on codon usage of the 21 species evaluated in this study.
Animals 12 01741 g003
Figure 4. Alignment of the 21 species evaluated in this study using Mauve. Gene arrangement is shown in Table 2, Table 3 and Table 4. Red block is 12S rRNA and 16S rRNA, green block is tRNA, and white block is PCG.
Animals 12 01741 g004
Figure 5. ENc vs. GC3 plot showed that the analyzed mitogenomes were translationally efficient and that natural selection played a crucial role in their evolution.
Animals 12 01741 g005
Figure 6. BI tree of all 21 species evaluated in this study based on the 13 mtDNA PCG dataset. Different colors represent different habitat types.
Animals 12 01741 g006
Table 1. Mitogenomes of Gobiidae species sequenced to date and their genomic features.
SpeciesFamilyAccession NumberAT%AT SkewGC%GC SkewLength (bp)Group
Acanthogobius hastaGobiidaeNC_006131.153.90.075 46.1−0.256 16,663seawater group (SG)
Favonigobius gymnauchenGobiidaeNC_047227.150.80.092 49.2−0.269 16,480
Chaenogobius gulosusGobiidaeNC_027193.159.00.113 41.0−0.247 16,477
Rhinogobius giurinusGobiidaeNC_022692.153.30.060 46.7−0.311 16,520
Chaenogobius annularisGobiidaeOM83022558.90.145 41.1−0.204 16,477
Mugilogobius chulaeGobiidaeNC_026519.154.40.081 45.6−0.279 16,489
Amblychaeturichthys hexanemaGobiidaeNC_029228.154.90.093 45.1−0.256 18,562euryhaline group (EG)
Chaeturichthys stigmatiasGobiidaeNC_020786.155.00.096 45.0−0.254 18,562
Eucyclogobius newberryiGobiidaeNC_028288.153.00.163 47.0−0.226 16,523
Sicyopterus japonicusGobiidaeNC_045074.153.70.050 46.3−0.284 16,504
Gymnogobius petschiliensisGobiidaeNC_008743.157.40.140 42.6−0.228 16,424
Brachygobius doriaeGobiidaeNC_037142.160.80.049 39.2−0.272 16,472
Rhinogobius cliffordpopeiGobiidaeNC_029252.149.40.097 50.6−0.291 16,525freshwater group (FG)
Rhinogobius leavelliGobiidaeNC_044964.151.80.080 48.2−0.310 16,499
Rhinogobius rubromaculatusGobiidaeNC_037144.151.50.089 48.5−0.306 16,503
Mugilogobius myxodermusGobiidaeNC_036070.154.20.082 45.8−0.304 16,495
Schismatogobius ampluvinculusGobiidaeNC_035717.152.30.098 47.7−0.262 16,639
Sicyopus zosterophorusGobiidaeNC_058982.155.00.057 45.0−0.281 16,471
Micropercops swinhonisOdontobutidaeNC_021763.157.80.124 42.2−0.225 16,493
Rhinogobius shennongensisGobiidaeOM96105052.30.044 47.7−0.312 16,500
Rhinogobius wuyanlingensisGobiidaeOM96105153.20.070 46.8−0.306 16,491
Table 2. Characteristics of the mitochondrial genome of Chaenogobius annularis.
GeneNucleotide PositionsSize (bp)StrandIntergenic NucleotideStartStop
tRNAPHE1–6868+
12s rRNA69–1014946+0
tRNAVAL1015–108672+0
16s rRNA1091–27671677+4
tRNALEU2768–284275+0
nd12844–3818975+1ATGTAA
tRNAILE3823–389371+4
tRNAGLN3894–3964710
tRNAMET3964–403269+−1
nd24033–50791065+0ATGTAA
tRNATRP5079–515072+−1
tRNAALA5153–5221692
tRNAASN5223–5295731
tRNACYS5331–53956535
tRNATYR5396–5466710
co15468–70211554+1GTGTAA
tRNASER7022–7092710
tRNAASP7096–716772+3
co27171–7861691+3ATGT
tRNALYS7862–793675+0
atp87938–8102165+1ATGTAG
atp68096–8779684+−7ATGTAA
co38779–9563785+−1ATGTA
tRNAGLY9563–963169+−1
nd39632–9980349+0ATGT
tRNAARG9981–1004969+0
nd4l10050–10346297+0ATGTAA
nd410340–117201381+−7ATGT
tRNAHIS11721–1178969+0
tRNASER11790–1185667+0
tRNALEU11860–1193273+3
nd511933–137681836+0ATGTAG
nd613765–14286522−4ATGTAA
tRNAGLU14287–14355690
cyb14361–154981138+5ATGTAG
tRNATHR15502–1557372+3
tRNAPRO15574–15643700
Table 3. Characteristics of the mitochondrial genome of Rhinogobius shennongensis.
GeneNucleotide PositionsSize (bp)StrandIntergenic NucleotideStartStop
tRNAPHE1–6868+
12s rRNA69–1017949+0
tRNAVAL1018–108972+0
16s rRNA1098–27781681+8
tRNALEU2779–285375+0
nd12854–3828975+0ATGTAA
tRNAILE3831–390070+2
tRNAGLN3900–397071−1
tRNAMET3970–403869+−1
nd24039–50851047+0ATGTAA
tRNATRP5087–515771+1
tRNAALA5160–5228692
tRNAASN5230–5302731
tRNACYS5335–53996532
tRNATYR5400–5469700
co15471–70241554+1GTGTAA
tRNASER7025–7095710
tRNAASP7099–717072+3
co27174–7864691+3ATGT
tRNALYS7865–794076+0
atp87942–8106165+1ATGTAA
atp68100–8783684+−7ATGTAA
co38783–9567785+−1ATGTA
tRNAGLY9567–963872+−1
nd39639–9987349+0ATGT
tRNAARG9988–10,05669+0
nd4l10,057–10,353297+0ATGTAA
nd410,347–11,7271381+−7ATGT
tRNAHIS11,728–11,79669+0
tRNASER11,797–11,86468+0
tRNALEU11,869–11,94173+4
nd511,942–13,7801839+−4ATGTAA
nd613,777–14,298522−4ATGTAG
tRNAGLU14,299–14,367690
cyb14,373–15,5121140+5ATGT
tRNATHR15,514–15,58572+1
tRNAPRO15,585–15,64561−1
Table 4. Characteristics of the mitochondrial genome of Rhinogobius wuyanlingensis.
GeneNucleotide PositionsSize (bp)StrandIntergenic NucleotideStartStop
tRNAPHE1–6868+
12s rRNA69–1019951+0
tRNAVAL1019–109072+−1
16s rRNA1099–27741676+8
tRNALEU2775–284874+0
nd12849–3823975+0ATGTAA
tRNAILE3828–389770+4
tRNAGLN3897–396771−1
tRNAMET3967–403569+−1
nd24036–50821047+0ATGTAA
tRNATRP5084–515471+1
tRNAALA5157–5225692
tRNAASN5227–5299731
tRNACYS5332–5397662
tRNATYR5398–5467700
co15469–70221554+1GTGTAA
tRNASER7023–7093710
tRNAASP7097–716872+3
co27172–7862691+3ATGT
tRNALYS7863–793876+0
atp87940–8104165+1ATGTAA
atp68098–8781684+−7ATGTAA
co38781–9565785+−1ATGTA
tRNAGLY9565–963571+−1
nd39636–9984349+0ATGT
tRNAARG9985–10,05369+0
nd4l10,054–10,350297+0ATGTAA
nd410,344–11,7241381+−7ATGT
tRNAHIS11,725–11,79268+0
tRNASER11,793–11,86068+0
tRNALEU11,865–11,93773+4
nd511,938–13,7761839+0ATGTAG
nd613,773–14,294522−4ATGTAG
tRNAGLU14,295–14,363690
cyb14,369–15,5081140+5ATGT
tRNATHR15,510–15,58172+1
tRNAPRO15,581–15,650139−1
Table 5. Test for positive selection in divergent clades of each mtDNA PCG using Clade model C.
GeneModel Compared|2ΔlnL|p-ValueωSGωEGωFG
atp6M2a_rel
vs.
CmC
10.164440.017218814 *0.137660.063560.08155
atp828.098463.46325×10-6 **0.301120.366340.11016
co1123.176521.59679×10-26 **0.106280.139440.15688
co215.342830.001545921 **0.071670.048160.06300
co33.313040.345830.095890.097000.10508
cyb234.476971.48869×10-50 **0.061000.105800.06614
nd18.346670.039364856 *0.100920.045050.13131
nd23.350000.000227486 **0.100870.078800.11073
nd35.492610.139080.135040.071990.14217
nd43.936410.268410.127480.101710.13955
nd4l8.6046890.035035806 *0.087110.067570.08709
nd5271.954141.16596×10-58 **0.122790.117360.15599
nd61407.009578.8747×10-305 **0.079060.226500.15444
Note: * Significant level (** p < 0.01, * p < 0.05). M2a_rel: null model; CmC: Clade model C; |2ΔlnL| is the log-likelihood score; ω is the evolution rate. FG: freshwater group; SG: seawater group; EG: euryhaline group.
Table 6. Positive selection for 13 mtDNA PCGs in the freshwater, seawater, and euryhaline groups based on the branch-site model.
GeneModel2ΔLNLp-ValuePositively Selected Sites (BEB Analysis)Foreground Branch Background Branch
nd6Model A
Null Model
012 S 0.963 *; 100 G 0.977 *; 139 F 0.989 *EGFG and SG
atp8017 S 0.999 **; 25 V 0.988 *; 36 E 0.978 *; 41 N 1.000 **; 51 S 0.966 *EGFG and SG
Note: BEB analysis: Bayes empirical Bayes analysis; * Significant level (** p < 0.01, * p < 0.05). FG: freshwater group; SG: seawater group; EG: euryhaline group.
Publisher’s Note: MDPI stays neutral with regard to jurisdictional claims in published maps and institutional affiliations.

