Simple Summary
Patagonian moray cod is known to inhabit the cold waters near Antarctica, and it belongs to the Muraenolepis genus. This genus has seven species, and five of them are recently reported. The Muraenolepis genus has similar morphological characters, and this is a limitation of taxonomical classification. In this study, a genome survey and microsatellite marker analysis were conducted to characterize the genome profile for classification. As a result, genomic data such as genome size and microsatellite motifs were obtained.
Abstract
The Muraenolepididae family of fishes, known as eel cods, inhabits continental slopes and shelves in the Southern Hemisphere. This family belongs to the Gadiformes order, which constitutes one of the most important commercial fish resources worldwide, but the classification of the fish species in this order is ambiguous because it is only based on the morphological and habitat characteristics of the fishes. Here, the genome of Patagonian moray cod was sequenced using the Illumina HiSeq platform, and screened for microsatellite motifs. The genome was predicted to be 748.97 Mb, with a heterozygosity rate of 0.768%, via K-mer analysis (K = 25). The genome assembly showed that the total size of scaffolds was 711.92 Mb and the N50 scaffold length was 1522 bp. Additionally, 4,447,517 microsatellite motifs were identified from the genome survey assembly, and the most abundant motif type was found to be AC/GT. In summary, these data may facilitate the identification of molecular markers in Patagonian moray cod, which would be a good basis for further whole-genome sequencing with long read sequencing technology and chromosome conformation capture technology, as well as population genetics.
1. Introduction
The Muraenolepididae family of fishes, known as eel cods, belongs to the Gadiformes order and inhabits the cold–temperate waters of continental slopes and shelves in the Southern Hemisphere. They dwell near the bottom of the ocean, at the midwater depth, or near the surface. The family has the following morphological characteristics: the dorsal, anal, and caudal fins are all joined; the chin has a barbel; and there are no teeth on the head of some. The family consists of two genera—Notomuraenobathys (Balushkin and Pirodina, 2010) and Muraenolepis (Günther, 1880) [1,2].
The genus of Muraenolepis is regularly caught around South Georgia and the South Sandwich Islands [3], and has been reported to be preyed on by the Patagonian toothfish (Dissostichus eleginoides) [4]. Muraenolepis comprises seven species, and five of these species have been mostly described recently (Muraenolepis marmorata, Günther 1880; Patagonian moray cod, Vaillant 1888; Muraenolepis andriashevi, Balushkin & Prirodina 2005; Muraenolepis trunovi, Balushkin & Prirodina 2006; Muraenolepis kuderskii, Balushkin & Prirodina 2007; Muraenolepis pacifica, Prirodina & Balushkin 2007; and Muraenolepis evseenkoi, Balushkin & Prirodina 2010) [5,6,7,8,9,10].
Gadiformes fishes, such as cod and hake, are among the most important commercial fishes worldwide. Despite their commercial importance, the taxonomic classification of these fishes is still far from clear, because it is based on morphological data [11]. Likewise, Muraenolepis fishes have been classified based on their morphological and habitat characteristics; various views have been reported taxonomically, including Gadiformes [5,12].
To overcome the limitations of the morphology-based taxonomic classification of Muraenolepis fishes, a study has analyzed the mitochondrial 16S and COI sequences of these fish species, and thereby confirmed that Muraenolepis microps is a junior synonym of M. marmorata [13]. Morphological characteristics are taxonomically very important. However, there are species that are difficult to classify accurately based on morphological characteristics alone, so genome-level information is needed to supplement this. In particular, the applicability of microsatellites (also known as simple sequence repeats (SSRs) in differentiating between fish species has been validated [14], and the complete mitochondrial genome of a Muraenolepis fish species has been sequenced [15].
In this study, we assessed the genomic characteristics of Patagonian moray cod via a genomic survey based on next-generation sequencing (NGS) and then identified SSRs that can be used as markers for taxonomic classification. The data from this study may facilitate further genomic characterization of Patagonian moray cod.
2. Materials and Methods
2.1. Sample Preparation and Sequencing
A sample was collected from the Ross Sea (77°05′ S, 170°30′ E on CCAMLR Subarea 88.1), Antarctica, and then transferred to a freezer at −80 °C. The muscle tissue was dissected from the frozen sample for DNA extraction. The traditional phenol–chloroform method was conducted to obtain the DNA. The quality and quantity of the DNA were assessed using a fragment analyzer (Agilent Technologies, Santa Clara, CA, USA) and a Qubit 2.0 Fluorometer (Life Technologies, Carlsbad, CA, USA), respectively. Then, 1 µg DNA was sheared into 350 bp fragments, using a Covaris S2 system (Covaris, Woburn, MA, USA). DNA library preparation was performed using TruSeq DNA PCR-Free (Illumina, San Diego, CA, USA) according to the manufacturer’s protocol. The library quality was assessed using a Bioanalyzer (Agilent Technologies, Santa Clara, CA, USA), and then the Illumina Novaseq 6000 platform with 2 × 150 bp format (Illumina, San Diego, CA, USA) was used for sequencing.
2.2. Data Analysis for Genome Survey and Microsatellite Identification
The quality (Q) values (Q20 and Q30) were estimated from the primary data using seqtk version 1.3 (Available online: https://github.com/lh3/seqtk (accessed on 20 January 2020). All of the clean reads were used to conduct the K-mer analysis to estimate the genome size. Jellyfish version 2.1.4 was used for the K-mer analysis with K-values of 17, 19, and 25. Based on the K-mer data, GenomeScope was used to determine the genome size, repeat contents, and heterozygosity rate [16,17]. The draft de novo genome assembly was carried out using Maryland Super-Read Celera Assembler (MaSuRCA version 3.3.4) [18]. For the genome-wide microsatellite investigation, the QDD pipeline (version 3.1.2) [19] was used. The microsatellite repeats were investigated for their lengths and nucleotide repeats (from mononucleotide repeats to hexanucleotide repeats). The analysis was conducted in three steps, with the parameters of -contig 1, -make_cons 0, and -contig 1. The final output was used to select the best primer pairs for the microsatellite repeats, and a total of 83 primer pairs were selected according to the following parameters of the QDD pipeline (version 3.1.2): forward and reverse flanking regions between the SSR and the primer sequences ≥ 20 bp, a maximum primer alignment score of 5, the high-quality primer design defined by the QDD pipeline, and ≥7 motif repeats [20]. Among these primer pairs, 25 pairs were randomly selected for validation via PCR, performed in a Thermal Cycler Dice® Touch (Takara Bio, Shiga, Japan). Each PCR tube (20 µL volume) contained 5 µL genomic DNA (20 ng/µL), 1 µL (10 pmole/L) of each forward and reverse primer, 10 µL of 2 × EmeraldAmp PCR Master Mix (Takara Bio, Kusatsu, Japan), and 3 µL of double-distilled water. The PCR conditions were as follows: 2 min at 94 °C, followed by 35 cycles of 94 °C for 30 s, 60 °C for 30 s, and 70 °C for 1 min, and the last extension at 72 °C for 10 min. The PCR products were visualized via 4% agarose gel electrophoresis with a 20 bp DNA ladder (Takara Bio, Kusatsu, Japan).
3. Results and Discussion
3.1. Genome Size Estimation and Genome Assembly
A total of 54.14 Gb of raw data were generated using the paired-end library method in the Illumina NovaSeq platform. The Q20 and Q30 values were 93.3% and 87.2%, respectively (Table 1). Q20 and Q30 values ≥ 90% and ≥85%, respectively, indicate accurate sequencing [21]. Therefore, the accuracy of sequencing for the Patagonian moray cod was high. In addition, the GC content was 49.5% (Table 1). These data were used to estimate the genome size via K-mer analysis. Based on the 25-mer distribution, the predicted genome size was approximately 748.9 Mb, and the heterozygous rate was estimated at 0.768%. The duplication rate was 1.18%, and the highest frequency was nearly 40× coverage (Table 2 and Figure 1). MaSuRCA was used to perform a genome assembly (Table 3). We obtained 661,719 scaffolds, and the total size of the scaffolds was 711,920,928 bp. The longest scaffold size was 67,330 bp, and the number of scaffolds longer than 1 Kb was 211,863. The N50 scaffold length was 1522 bp, and the GC content was 45.7%. These genome survey results can serve as preliminary data for further whole-genome studies with advanced sequencing technologies using long read sequencing technology and chromosome conformation capture technology to achieve a more thorough assembly.

Table 1.
Statistics of the genome-sequencing data.
Table 2.
Genome size estimation via K-mer analysis.
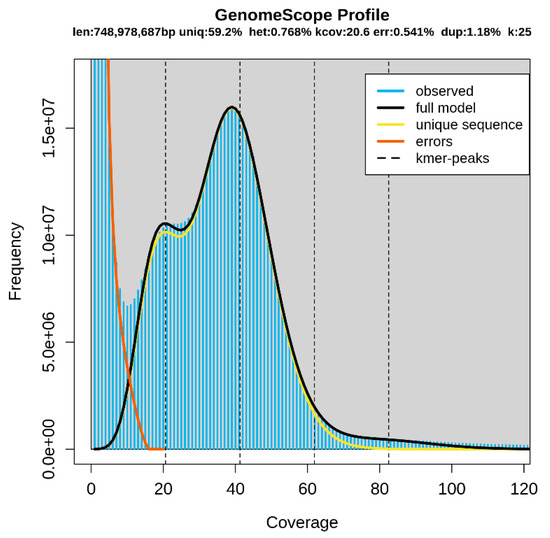
Figure 1.
K-mer analysis (K = 25).
Table 3.
Statistics of the assembled genomic sequences.
Len, estimated total genome length; Uniq, unique portion of the genome (not repetitive); Het, heterozygosity rate; Kcov, mean K-mer coverage for the heterozygous bases; Err, error rate; Dup, duplication rate. The blue bars and black line show the observed K-mer distribution and the modeled distribution without the error K-mers (indicated by the red line), respectively, up to a maximum K-mer coverage specified in the model (indicated by the yellow line).
3.2. Identification of Microsatellite Motifs
A total of 4,447,517 microsatellite motifs were identified from the genome survey assembly of Patagonian moray cod. The types of the motifs were dinucleotide, trinucleotide, tetranucleotide, and pentanucleotide, with the fractions of 77.40% (3,430,720), 17.89% (793,122), 3.97% (175,791), and 0.74% (21,801), respectively (Table 4). The most frequent dinucleotide motif was found to be AC/GT (61.21%), followed by AG/CT (24.80%), AT/AT (13.83%), and CG/CG (0.16%). The most abundant trinucleotide motif was found to be AGG/CCT (29.04%), followed by AAT/ATT (18.99%), ACC/GGT (14.34%), AAC/GTT (9.62%), AAG/CTT (9.03%), ATC/GAT (6.49%), AGC/GCT (5.24%), ACT/AGT (3.89%), CCG/CGG (2.69%), and ACG/CGT (0.67%). Regarding the tetranucleotide and pentanucleotide motifs, the most frequent motifs were ACAG/CTGT (27.78%) and AGAGG/CCTCT (32.37%), respectively (Table 4). To compare the microsatellite motifs of Patagonian moray cod with other species, the microsatellite motif analysis results of Trematomus loennbergii and Pogonophryne albipinna were used [22,23]. When comparing the number of microsatellites, Patagonian moray cod had the most SSRs, and there was no significant difference in the number of SSRs between T. loennbergii and P. albipinna. When comparing the repeat type, it was confirmed that the ratio of trinucleotides was slightly higher in Patagonian moray cod than in other species. Additionally, unlike other species, Patagonian moray cod did not have a hexanucleotide type (Table S1). Based on the microsatellite motif analysis and the parameters of the QDD pipeline, 83 primer pairs were selected (Table S2). To ensure the usability of these microsatellite markers, 25 primer pairs were randomly selected and used for PCR with the genomic DNA of Patagonian moray cod. Consequently, 15 primer pairs were observed to yield only a single band (Figure 2).
Table 4.
Distribution of the microsatellite motifs.
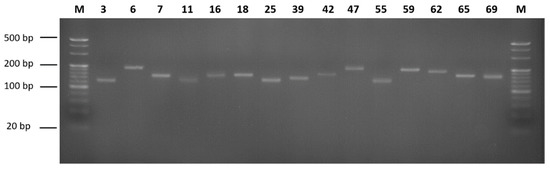
Figure 2.
PCR products corresponding to the microsatellites. M is the 20 bp DNA marker and 4% agarose gel electrophoresis was used. The number is primer pairs order.
With the advance of NGS technology and bioinformatics tools, genome survey sequencing and K-mer analysis have developed rapidly, assisting with the prediction of genome size and characteristics in non-model species without basic genomic information. According to a flow cytometry-based approach, previous studies have estimated that the genome sizes of several species living in Antarctica were 0.7–1.4 Gb [24]. Recent studies using NGS technology estimated the genome sizes of Antarctic fishes at 0.6–1 Gb [25,26,27,28,29]. In this study, the genome size of Patagonian moray cod was 0.7 Gb and it was within the range of the previously reported genome sizes of Antarctic fishes. Therefore, the genome size of Patagonian moray cod is an acceptable result. For the genome assembly, if the heterozygosity rate is more than 0.5%, it is difficult to assemble. The heterozygosity rate of Patagonian moray cod was 0.7%. It might have been affected by the use of short scaffolds based on short read sequencing technology. In addition, the GC content is also one of the factors affecting sequence bias; if the GC content is more than 65% or less than 25%, sequence bias may influence the genome assembly quality [30,31,32]. The GC content of Patagonian moray cod was 45.7%, and this was within the range from 25% to 65%, which was a normal range. Therefore, the assembly result of this study might be of acceptable range, and the GC content of Patagonian moray cod would be not affected by genome sequence quality. This is the first report of a genome survey of Patagonian moray cod, and these data provide a preliminary understanding of the genome characteristics of Patagonian moray cod. However, a further study with long read sequencing technology and chromosomal-level scaffolding technology is needed to obtain more high-quality genome information for Patagonian moray cod. For identifying the microsatellite markers, using genome survey data has cost- and time-effective advantages compared with the traditional microsatellite marker development method. In this study, the most frequent motifs were dinucleotide repeat motifs, except for the mononucleotide repeat motif, and the less abundant dinucleotide repeat motifs were CG/CG. This result was comparable with other previous studies on microsatellite repeats using Danio rerio, Oreochromis latipes, and O. niloticus [33], and this may be because cytosine is methylated with thymidine [34]. The tendency of the overall motif frequency was quite similar to other studies with fishes [35,36]. This data may be useful in identifying the microsatellite markers of Patagonian moray cod. Moreover, if further studies using various Muraenolepis populations are conducted, more meaningful data for molecular marker development would be obtained.
4. Conclusions
In the present study, the genome of Patagonian moray cod was assembled, and the microsatellite motifs were characterized. Therefore, the genome size of Patagonian moray cod was estimated at 748.9 Mb, based on the K-mer analysis. In addition, SSR analysis yielded 4,447,517 SSRs, and the most abundant repeat motif was found to be a dinucleotide, with the most frequent dinucleotide motif of AC/GT.
These genomic data may be useful for verifying taxonomical classifications, and it would be basic information for developing novel molecular markers in various populations. However, further studies, such as a more complete genome assembly at the chromosomal level, and validation experiments using various Muraenolepis populations, would be needed.
Supplementary Materials
The following supporting information can be downloaded at: https://www.mdpi.com/article/10.3390/ani12131608/s1. Table S1: Number and percentage of di- to hexanucleotide repeats in Antarctic fish; Table S2: List of SSR primers of Patagonian moray cod.
Author Contributions
H.P. and J.-H.K. conceived the study. E.C., S.J.L., E.J. and J.K. performed the genome sequencing and assembly. S.J.P. collected and analyzed the samples. E.C., J.-H.K. and H.P. wrote the manuscript. All the authors contributed to writing and editing the manuscript, collating the supplementary information, and preparing the figures. All authors have read and agreed to the published version of the manuscript.
Funding
This study was supported by a grant from the project “Ecosystem Structure and Function of Marine Protected Area (MPA) in Antarctica” (PM21060) and “Conservation Measure Impact on Ecosystem Change in the Ross Sea Region MPA” (PM22060), funded by the Ministry of Oceans and Fisheries (20170336 and 20220547), Korea, and by a grant from Korea University.
Institutional Review Board Statement
The procedures adopted in this study were performed in accordance with the guidelines of the Animal Welfare Ethical Committee and the Animal Experimental Ethics Committee of the Korea Polar Research Institute (KOPRI, Incheon, Korea) (Approval Code MOFA-3903 Date: 2 October 2019).
Informed Consent Statement
Not applicable.
Data Availability Statement
The Patagonian moray cod genome project was registered in NCBI (Bioproject number: PRJNA802969). The whole-genome sequencing data were deposited in the Sequence Read Archive database (accession number: SRR17897366).
Conflicts of Interest
The authors declare no conflict of interest.
References
- Gon, O.; Heemstra, P.C. Fishes of the Southern Ocean; JLB Smith Institute of Ichthyology: Grahamstown, South Africa, 1990; Volume 1. [Google Scholar]
- Cohen, D.M.; Inada, T.; Iwamoto, T.; Scialabba, N.; Whitehead, P.J.P. Gadiform Fishes of the World (Order Gadiformes), an Annotated and Ilustrated Catalogue of Cods. Hakes, Grenadiers and Other Gadiform Fishes Known to Date; FAO species catalogue; FAO: Rome, Italy, 1990; Volume 10. [Google Scholar]
- Gregory, S.; Collins, M.A.; Belchier, M. Demersal fish communities of the shelf and slope of South Georgia and Shag Rocks (Southern Ocean). Polar Biol. 2017, 40, 107–121. [Google Scholar] [CrossRef]
- Collins, M.A.; Ross, K.A.; Belchier, M.; Reid, K. Distribution and diet of juvenile Patagonian toothfish on the South Georgia and Shag Rocks shelves (Southern Ocean). Mar. Biol. 2007, 152, 135–147. [Google Scholar] [CrossRef][Green Version]
- Konstantinidis, P.; Hilton, E.; Matarese, A. New records of larval stages of the eel cod genus Muraenolepis Günther 1880 (Gadiformes: Muraenolepididae) from the western Antarctic Peninsula. J. Fish Biol. 2016, 89, 1494–1500. [Google Scholar] [CrossRef] [PubMed]
- Balushkin, A.; Prirodina, V. A New Species of Eel Cod Muraenolepis andriashevi sp. nova (Muraenolepididae) from the Southern Coast of Africa with Remarks on the Taxonomic Rank of the Family in the System of the Order Gadiformes. J. Ichthyol. 2005, 45, 489–495. [Google Scholar]
- Balushkin, A.; Prirodina, V. A new species of eel cods Muraenolepis trunovi sp. nova (Muraenolepididae) from the Lazarev Sea with redescription of lectotypes Muraenolepis marmorata Günther, 1880 and M. microps (Lönnberg, 1905). J. Ichthyol. 2006, 46, 687–693. [Google Scholar] [CrossRef]
- Balushkin, A.; Prirodina, V. A new species of eel cods Muraenolepis kuderskii sp. nova (fam. Muraenolepididae) from South Georgia (the Scotia Sea). J. Ichthyol. 2007, 47, 683–690. [Google Scholar] [CrossRef]
- Prirodina, V.; Balushkin, A. New species of eel cods Muraenolepis pacifica sp. nova (Muraenolepididae) from the Ridge of Hercules (Pacific-Antarctic Ridge). J. Ichthyol. 2007, 47, 201–206. [Google Scholar] [CrossRef]
- Balushkin, A.; Prirodina, V. A new species of Muraenolepididae (Gadiformes) Muraenolepis evseenkoi sp. nova from continental seas of Antarctica. J. Ichthyol. 2010, 50, 495–502. [Google Scholar] [CrossRef]
- Roa-Varón, A.; Ortí, G. Phylogenetic relationships among families of Gadiformes (Teleostei, Paracanthopterygii) based on nuclear and mitochondrial data. Mol. Phyl. Evol. 2009, 52, 688–704. [Google Scholar] [CrossRef]
- Gordeev, I.; Sokolov, S. Helminths and the feeding habits of the marbled moray cod Muraenolepis marmorata Günther, 1880 (Gadiformes, Muraenolepididae) in the Ross Sea (Southern Ocean). Polar Biol. 2017, 40, 1311–1318. [Google Scholar] [CrossRef]
- Fitzcharles, E.; Hollyman, P.; Goodall-Copestake, W.; Maclaine, J.; Collins, M. The taxonomic identity and distribution of the eel cod Muraenolepis (Gadiformes: Muraenolepididae) around South Georgia and the South Sandwich Islands. Polar Biol. 2021, 44, 637–651. [Google Scholar] [CrossRef]
- Vanhaecke, D.; Garcia de Leaniz, C.; Gajardo, G.; Young, K.; Sanzana, J.; Orellana, G.; Fowler, D.; Howes, P.; Monzon-Arguello, C.; Consuegra, S. DNA barcoding and microsatellites help species delimitation and hybrid identification in endangered galaxiid fishes. PLoS ONE 2012, 7, e32939. [Google Scholar] [CrossRef] [PubMed]
- Choi, E.; Park, S.H.; Lee, S.J.; Jo, E.; Kim, J.; Kim, J.-H.; Kim, J.-H.; Lim, J.S.; Park, H. The complete mitochondrial genome of Patagonian moray cod, Muraenolepis orangiensis Vaillant, 1888 (Gadiformes, Muraenolepididae). Mitochondrial DNA Part B 2020, 5, 2707–2708. [Google Scholar] [CrossRef]
- Marçais, G.; Kingsford, C. A fast, lock-free approach for efficient parallel counting of occurrences of k-mers. Bioinformatics 2011, 27, 764–770. [Google Scholar] [CrossRef]
- Vurture, G.W.; Sedlazeck, F.J.; Nattestad, M.; Underwood, C.J.; Fang, H.; Gurtowski, J.; Schatz, M.C. GenomeScope: Fast reference-free genome profiling from short reads. Bioinformatics 2017, 33, 2202–2204. [Google Scholar] [CrossRef] [PubMed]
- Zimin, A.V.; Marçais, G.; Puiu, D.; Roberts, M.; Salzberg, S.L.; Yorke, J.A. The MaSuRCA genome assembler. Bioinformatics 2013, 29, 2669–2677. [Google Scholar] [CrossRef]
- Meglécz, E.; Pech, N.; Gilles, A.; Dubut, V.; Hingamp, P.; Trilles, A.; Grenier, R.; Martin, J.F. QDD version 3.1: A user-friendly computer program for microsatellite selection and primer design revisited: Experimental validation of variables determining genotyping success rate. Mol. Ecol. Resour. 2014, 14, 1302–1313. [Google Scholar] [CrossRef]
- Sollars, E.S.; Harper, A.L.; Kelly, L.J.; Sambles, C.M.; Ramirez-Gonzalez, R.H.; Swarbreck, D.; Kaithakottil, G.; Cooper, E.D.; Uauy, C.; Havlickova, L. Genome sequence and genetic diversity of European ash trees. Nature 2017, 541, 212–216. [Google Scholar] [CrossRef] [PubMed]
- Li, G.Q.; Song, L.X.; Jin, C.Q.; Li, M.; Gong, S.P.; Wang, Y.F. Genome survey and SSR analysis of Apocynum venetum. Biosci. Rep. 2019, 39, BSR20190146. [Google Scholar] [CrossRef]
- Jo, E.; Cho, Y.H.; Lee, S.J.; Choi, E.; Kim, J.; Kim, J.-H.; Chi, Y.M.; Park, H. Genome survey and microsatellite motif identification of Pogonophryne albipinna. Biosci. Rep. 2021, 41, BSR20210824. [Google Scholar] [CrossRef]
- Choi, E.; Kim, S.H.; Lee, S.J.; Jo, E.; Kim, J.; Kim, J.-H.; Parker, S.J.; Chi, Y.-M.; Park, H. A First Genome Survey and Genomic SSR Marker Analysis of Trematomus loennbergii Regan, 1913. Animals 2021, 11, 3186. [Google Scholar] [CrossRef] [PubMed]
- Amemiya, C. Genome enablement of the notothenioidei: Genome size estimates from 11 species and BAC libraries from 2 Represen. J. Exp. Zool. B Mol. Dev. Evol. 2010, 314, 369–381. [Google Scholar]
- Shin, S.C.; Ahn, D.H.; Kim, S.J.; Pyo, C.W.; Lee, H.; Kim, M.-K.; Lee, J.; Lee, J.E.; Detrich, H.W.; Postlethwait, J.H. The genome sequence of the Antarctic bullhead notothen reveals evolutionary adaptations to a cold environment. Genome Biol. 2014, 15, 468. [Google Scholar] [CrossRef]
- Ahn, D.-H.; Shin, S.C.; Kim, B.-M.; Kang, S.; Kim, J.-H.; Ahn, I.; Park, J.; Park, H. Draft genome of the Antarctic dragonfish, Parachaenichthys charcoti. Gigascience 2017, 6, gix060. [Google Scholar] [CrossRef] [PubMed]
- Chen, L.; Lu, Y.; Li, W.; Ren, Y.; Yu, M.; Jiang, S.; Fu, Y.; Wang, J.; Peng, S.; Bilyk, K.T. The genomic basis for colonizing the freezing Southern Ocean revealed by Antarctic toothfish and Patagonian robalo genomes. Gigascience 2019, 8, giz016. [Google Scholar] [CrossRef]
- Kim, B.-M.; Amores, A.; Kang, S.; Ahn, D.-H.; Kim, J.-H.; Kim, I.-C.; Lee, J.H.; Lee, S.G.; Lee, H.; Lee, J. Antarctic blackfin icefish genome reveals adaptations to extreme environments. Nat. Ecol. Evol. 2019, 3, 469–478. [Google Scholar] [CrossRef] [PubMed]
- Lee, S.J.; Kim, J.-H.; Jo, E.; Choi, E.; Kim, J.; Choi, S.-G.; Chung, S.; Kim, H.-W.; Park, H. Chromosomal assembly of the Antarctic toothfish (Dissostichus mawsoni) genome using third-generation DNA sequencing and Hi-C technology. Zool. Res. 2021, 42, 124. [Google Scholar] [CrossRef] [PubMed]
- Huang, G.; Cao, J.; Chen, C.; Wang, M.; Liu, Z.; Gao, F.; Yi, M.; Chen, G.; Lu, M. Genome survey of Misgurnus anguillicaudatus to identify genomic information, simple sequence repeat (SSR) markers, and mitochondrial genome. Mol. Biol. Rep. 2022, 49, 2185–2196. [Google Scholar] [CrossRef]
- Cheung, M.-S.; Down, T.A.; Latorre, I.; Ahringer, J. Systematic bias in high-throughput sequencing data and its correction by BEADS. Nucleic Acids Res. 2011, 39, e103. [Google Scholar] [CrossRef]
- Aird, D.; Ross, M.G.; Chen, W.-S.; Danielsson, M.; Fennell, T.; Russ, C.; Jaffe, D.B.; Nusbaum, C.; Gnirke, A. Analyzing and minimizing PCR amplification bias in Illumina sequencing libraries. Genome Biol. 2011, 12, R18. [Google Scholar] [CrossRef]
- Lei, Y.; Zhou, Y.; Price, M.; Song, Z. Genome-wide characterization of microsatellite DNA in fishes: Survey and analysis of their abundance and frequency in genome-specific regions. BMC Genom. 2021, 22, 421. [Google Scholar] [CrossRef] [PubMed]
- Schorderet, D.F.; Gartler, S.M. Analysis of CpG suppression in methylated and nonmethylated species. Proc. Natl. Acad. Sci. USA 1992, 89, 957–961. [Google Scholar] [CrossRef] [PubMed]
- Chen, B.; Sun, Z.; Lou, F.; Gao, T.-x.; Song, N. Genomic characteristics and profile of microsatellite primers for Acanthogobius ommaturus by genome survey sequencing. Biosci. Rep. 2020, 40, BSR20201295. [Google Scholar] [CrossRef] [PubMed]
- Xu, S.Y.; Song, N.; Xiao, S.J.; Gao, T.X. Whole genome survey analysis and microsatellite motif identification of Sebastiscus marmoratus. Biosci. Rep. 2020, 40, BSR20192252. [Google Scholar] [CrossRef]
Publisher’s Note: MDPI stays neutral with regard to jurisdictional claims in published maps and institutional affiliations. |
© 2022 by the authors. Licensee MDPI, Basel, Switzerland. This article is an open access article distributed under the terms and conditions of the Creative Commons Attribution (CC BY) license (https://creativecommons.org/licenses/by/4.0/).