Article

Microbiota Composition of Mucosa and Interactions between the Microbes of the Different Gut Segments Could Be a Factor to Modulate the Growth Rate of Broiler Chickens

1
Institute of Physiology and Nutrition, Department of Animal Nutrition and Nutritional Physiology, Georgikon Campus, Deák Ferenc Street 16, Hungarian University of Agriculture and Life Sciences, 8360 Keszthely, Hungary
2
Institute of Mathematics and Basic Science, Georgikon Campus, Deák Ferenc Street 16, Hungarian University of Agriculture and Life Sciences, 8360 Keszthely, Hungary
3
Agrofeed Ltd., Duna Kapu Square 10, 9022 Győr, Hungary
*
Author to whom correspondence should be addressed.
Animals 2022, 12(10), 1296; https://doi.org/10.3390/ani12101296
Submission received: 11 April 2022 / Revised: 5 May 2022 / Accepted: 16 May 2022 / Published: 18 May 2022
(This article belongs to the Special Issue Gut Health in Poultry)

Abstract

:

Simple Summary

The microbial communities inhabiting the gastrointestinal tract (GIT) of chickens are essential for the gut homeostasis, metabolism, and health status of the host animal. Previous studies exploring the relationship between chicken growth performance and gut microbiota focused mostly on gut content and excreta samples, neglecting the mucosa that promotes colonisation by distinct groups of microorganisms. These observations emphasised the importance of studying the variations between the bacterial communities of the lumen and mucosa throughout the different sections of the GIT. The novelty of this study is that we have evaluated the microbial communities of the jejunum chymus, jejunum mucosa, and caecum chymus of broiler chickens with different growth rates. Besides the bacteriota composition, the interactions between the bacteria were also evaluated. We have confirmed that the microbiota composition is influenced mostly by the sampling place. However, some body weight (BW)-related changes and interactions have also been found. In these cases, the mucosa seems to play a crucial role.

Abstract

The study reported here aimed to determine whether correlations can be found between the intestinal segment-related microbiota composition and the different growing intensities of broiler chickens. The bacterial community structures of three intestinal segments (jejunum chymus—JC, jejunum mucosa—JM, caecum chymus—CC) from broiler chickens with low body weight (LBW) and high body weight (HBW) were investigated. Similar to the previous results in most cases, significant differences were found in the bacteriota diversity and composition between the different sampling places. However, fewer body weight (BW)-related differences were detected. In the JM of the HBW birds, the Bacteroidetes/Firmicutes ratio (B/F) was also higher. At the genus level significant differences were observed between the BW groups in the relative abundance of Enterococcus, mainly in the JC; Bacteroides and Ruminococcaceae UCG-010, mainly in the JM; and Ruminococcaceae UCG-013, Negativibacillus, and Alistipes in the CC. These genera and others (e.g., Parabacteroides and Fournierella in the JM; Butyricoccus, Ruminiclostridium-9, and Bilophila in the CC) showed a close correlation with BW. The co-occurrence interaction results in the JC revealed a correlation between the genera of Actinobacteria (mainly with Corynebacterium) and Firmicutes Bacilli classes with different patterns in the two BW groups. In the JM of LBW birds, two co-occurring communities were found that were not identifiable in HBW chickens and their members belonged to the families of Ruminococcaceae and Lachnospiraceae. In the frame of the co-occurrence evaluation between the jejunal content and mucosa, the two genera (Trichococcus and Oligella) in the JC were found to have a significant positive correlation with other genera of the JM only in LBW chickens.

1. Introduction

In recent decades, breeding programs have improved the efficiency of poultry production tremendously. The parameters influencing the performance and efficiency of chicken flocks, such as feed conversion rate (FCR) and body weight gain (BWG), are critical factors for broiler producers. Among other factors gut health also plays an important role as a modulatory factor of the production traits.
The modulation of the gastrointestinal tract (GIT) microbiota (e.g., addition of pre- or probiotics, feed additives) is used widely in poultry production. Several studies have attempted to identify how the intestinal microbes are associated with the production traits (e.g., weight gain, fed conversion ratio) [1,2,3,4]. However, the findings thus far have been inconsistent and sometimes contradictory [5]. Some investigations focusing on the relationship between gut microbiota and obesity suggested that the gut microbiota affects energy utilisation and energy deposition of humans and animals [6,7,8]. Several authors revealed a positive correlation between the increased Firmicutes/Bacteroidetes (F/B) ratio in the colon or caecum and weight gain or obesity [7,9,10]. In opposition to these results, a number of studies did not observe any modifications of this parameter, and even a decreased F/B ratio in obese animals and humans has been found [9,10,11,12]. The F/B ratio can vary significantly due to the age, nutrition, and health status of the host. The relationship between the F/B ratio and obesity is still the subject of intensive research. Different bacterial diversity at different taxonomy levels in obese/lean animals suggests that a more detailed evaluation of bacteriota composition is more relevant than only the F/B ratio [13]. Whole genome sequencing showed that representatives of Bacteroidetes and Firmicutes have the genetic potential to follow different strategies of gut colonisation, which may explain their coexistence in chicken caecum [14]. Members of the phyla Firmicutes and Bacteroidetes also play an important role in the intestinal mucosa, but only a few results are available in this area.
Gut microbes colonise the outer layer of the mucus and use nutrients from the mucus itself. A recent comparison between lumen and mucosa associated microorganisms revealed a much greater microbial community richness in the mucosa, particularly in the ileum and caecum of broiler chickens [15].
An emerging approach is to study the so-called correlation networks between different bacteria. One possibility to infer interactions between bacteria in the gut microbiota is to quantify the co-occurrence of operational taxonomic units (OTUs) across multiple samples [16].
The aim of this study was to determine potential correlations between the intestinal segment-related microbiota and the different growing intensities of broiler chickens. Furthermore, possible interactions between the microbiota of certain gut segments were also investigated with a co-occurrence network analysis.

2. Materials and Methods

2.1. Ethics and Approval Statement

The trial was carried out at the experimental farm of the Institute of Physiology and Nutrition, Hungarian University of Agriculture and Life Sciences (Georgikon Campus, Keszthely, Hungary). All husbandry and euthanasia procedures were performed in accordance with the Hungarian Government Decree 40/2013 and in full consideration of animal welfare ethics. The animal experiment was approved by the Institutional Ethics Committee (Animal Welfare Committee, Georgikon Campus, Hungarian University of Agriculture and Life Sciences) under the license number MÁB-1/2017.

2.2. Animal Handling and Sampling

A total of 160 male broiler chicks (Ross 308) obtained from a commercial hatchery (Gallus Ltd., Devecser, Hungary) were raised in a chopped wheat-straw floor pen. The initial mean body weight (BW) of the chicks was 45.4 ± 0.36 g. Commercial wheat-, corn-, and soybean-based broiler starter (d 1–11), grower (d 12–25), and finisher (d 26–37) diets were fed ad libitum. The composition and nutrient content of the diets can be found in Table S1. The environmental conditions (heating, lighting, and ventilation) were in accordance with the breeder’s instructions [17]. On day 37, all chickens were weighed individually and the average BW (mean ± standard deviation (SD)) was determined. The average BW of the flock was 2696 ± 227 g. The live weight of the birds and the variation coefficient of the flock corresponded to the Ross 308 broiler performance objectives of 37-day-old male chickens [17]. Afterwards, two groups of chickens were defined. Out of the group of the lower body weight (LBW) chicks, 32 birds were selected with a live weight below the average minus the standard deviation (SD) of the whole population. Similarly, 26 chickens of the higher body weight (HBW) treatment were selected from the animals having a live weight above the average plus SD. All selected birds were healthy, without signs of disease or leg problems. The live weight distribution of the randomly selected chickens was 2235 ± 76 g and 3098 ± 173 g in the LBW and HBW treatments, respectively (Figure S1).
Five birds from each group were selected randomly and euthanised with CO2 and slaughtered. The digestive tract was removed immediately, and gut contents and mucosa samples collected. The jejunal chyme was taken from a 10 cm long gut segment, directly proximal to Meckel’s diverticulum. Caecal contents were collected from the left caecal sack. The chyme of the jejunum and the caecal content was gently pushed out. After the gut content collection, the jejunal part was washed with sterile ice-cold phosphate buffer solution (PBS) until the mucosa was completely cleaned from the digesta. Mucosa samples were collected aseptically by scraping off the mucosa from the internal wall of the gut with a glass slide. All samples were homogenised and stored at −80 °C until further processing occurred.

2.3. DNA Extraction, 16S rRNA Gene Amplification and Illumina MiSeq Sequencing

Bacterial DNA was extracted from 15 mg samples using the AquaGenomic Kit (MoBiTec GmbH, Göttingen, Germany) and further purified using KAPA Pure Beads (Roche, Basel, Switzerland) according to the manufacturer’s protocols. The concentration of genomic DNA was measured using a Qubit 3.0 Fluorometer with the Qubit dsDNA HS Assay Kit (Thermo Fisher Scientific Inc., Waltham, MA, USA). Bacterial DNA was amplified with tagged primers (forward, 5′TCGTCGGCAGCGTCAGATGTGTATAAGAGACAGCCTACGGGNGGCWGCAG, and reverse, 5′GTCTCGTGGGCTCGGAGATGTGTATAAGAGACAGGACTACHVGGGTATCTAATCC) covering the V3–V4 region of the bacterial 16S rRNA gene [18]. Polymerase chain reactions (PCRs) and DNA purifications were performed according to Illumina’s demonstrated protocol (Illumina Inc., 2013). The PCR product libraries were quantified and qualified by using the High Sensitivity D1000 ScreenTape on the TapeStation 2200 instrument (Agilent Technologies, Santa Clara, CA, USA). Equimolar concentrations of libraries were pooled and sequenced on an Illumina MiSeq platform using a MiSeq Reagent Kit v3 (600 cycle; Illumina Inc., San Diego, CA, USA) with a 300-bp read length paired-end protocol. Raw sequences data of 16S rRNA gene analysis were deposited at the National Center for Biotechnology Information (NCBI) Sequence Read Archive (SRA) under accession number PRJNA609272.

2.4. Bioinformatics and Statistical Analyses

Microbiome bioinformatics were performed with the Quantitative Insights Into Microbial Ecology 2 (QIIME2) version 2020.2 software package [19]. Raw sequence data were demultiplexed and quality filtered using the q2-demux plugin, followed by denoising with Deblur [20]. Sequences were filtered based on quality scores and the presence of ambiguous base calls using the quality-filter q-score options (QIIME2 default setting). Representative sequences were found using a 16S reference as a positive filter, as implemented in the Deblur denoise-16S method. Sequences were clustered into operational taxonomic units (OTUs) using VSEARCH algorithm open-reference clustering, based on a 97% similarity to the SILVA (release 132) reference database [21]. Alpha diversity metrics (Chao1, Shannon, Simpson, and phylogenetic distance(PD)) and beta diversity metrics (Bray–Curtis dissimilarity) were estimated using the QIIME2 diversity plugin and MicrobiomeAnalyst (https://www.microbiomeanalyst.ca/, accessed on 1 September 2020) online software after samples were rarefied to 10,000 sequences per sample [22]. Only features appearing in at least a minimum of 10 reads across all samples were retained in the resulting feature table. To examine differences in microbial community structures between samples, a principal coordinate analysis (PCoA) with the Bray–Curtis dissimilarity was generated using the MicrobiomeAnalyst online software. Permutational multivariate analysis of variance (PERMANOVA, p < 0.05) was used to analyse spatial variation in beta diversity and the effects of sampling places (JC, JM, and CC) and BW. Canonical correspondence analysis (CCA) was used to evaluate the effect of BW on the intestinal tract microbiota structure. Correlations of the canonical axes with the explanatory matrix were reported and the significance of each correlation was determined by 999 permutations with Calypso online software [23].
Statistical analysis was performed with SPSS statistical software version 23.0 (IBM Corp. Released 2015) and Calypso. Alpha diversity indices and the microbial composition at different taxonomical levels and in different intestinal sampling places (JC, JM and CC) were compared using a two-way ANOVA test with Tukey’s HSD multiple group comparison post hoc test, using the sampling places (SPs) and the BW of chickens (LBW, HBW) as main factors. Although microbial abundance data follow non-normal distribution, the hypothesis testing was conducted by ANOVA rather than its nonparametric counterpart. ANOVA is more powerful to test the interaction and the literature confirmed its robustness to non-normality, especially in cases of equal sample sizes and similar distributional shapes as was valid for our data [24]. The Benjamini–Hochberg false discovery rate (BH-FDR) correction (FDR p-value) was used to adjust for multiple testing. Statistical significance was defined as the FDR of p < 0.05, whereas the FDR p-value between 0.05 and 0.10 was considered as a trend. A Venn diagram was made with the InteractiVenn web-based tool [25]. Correlations between gut microbial composition (relative abundance of genera) and the BW-related change at the different sampling places were evaluated with Spearman’s correlation. The correlations with a p-value less than 0.05 was considered as statistically significant. The analysis was performed between each SP and BW category for all genera representing more than 0.01% of the total microbial population and could be found in at least 8 samples.

2.5. Co-Occurrence Network Analysis

Differences in correlation structure between HBW and LBW chickens were analysed with Spearman’s rank correlation coefficients (rho). The correlation structures were revealed as follows. Only genera with a relative frequency greater than zero in at least four out of five samples were included. A Monte Carlo simulation was used to determine whether the number of correlation connections of a genus was significant or not. Spearman’s correlation was calculated for each pair of series and for each SP and BW combination.
Similar analysis was carried out to reveal the connection between the microbiota composition of the jejunal content and jejunal mucosa.

3. Results

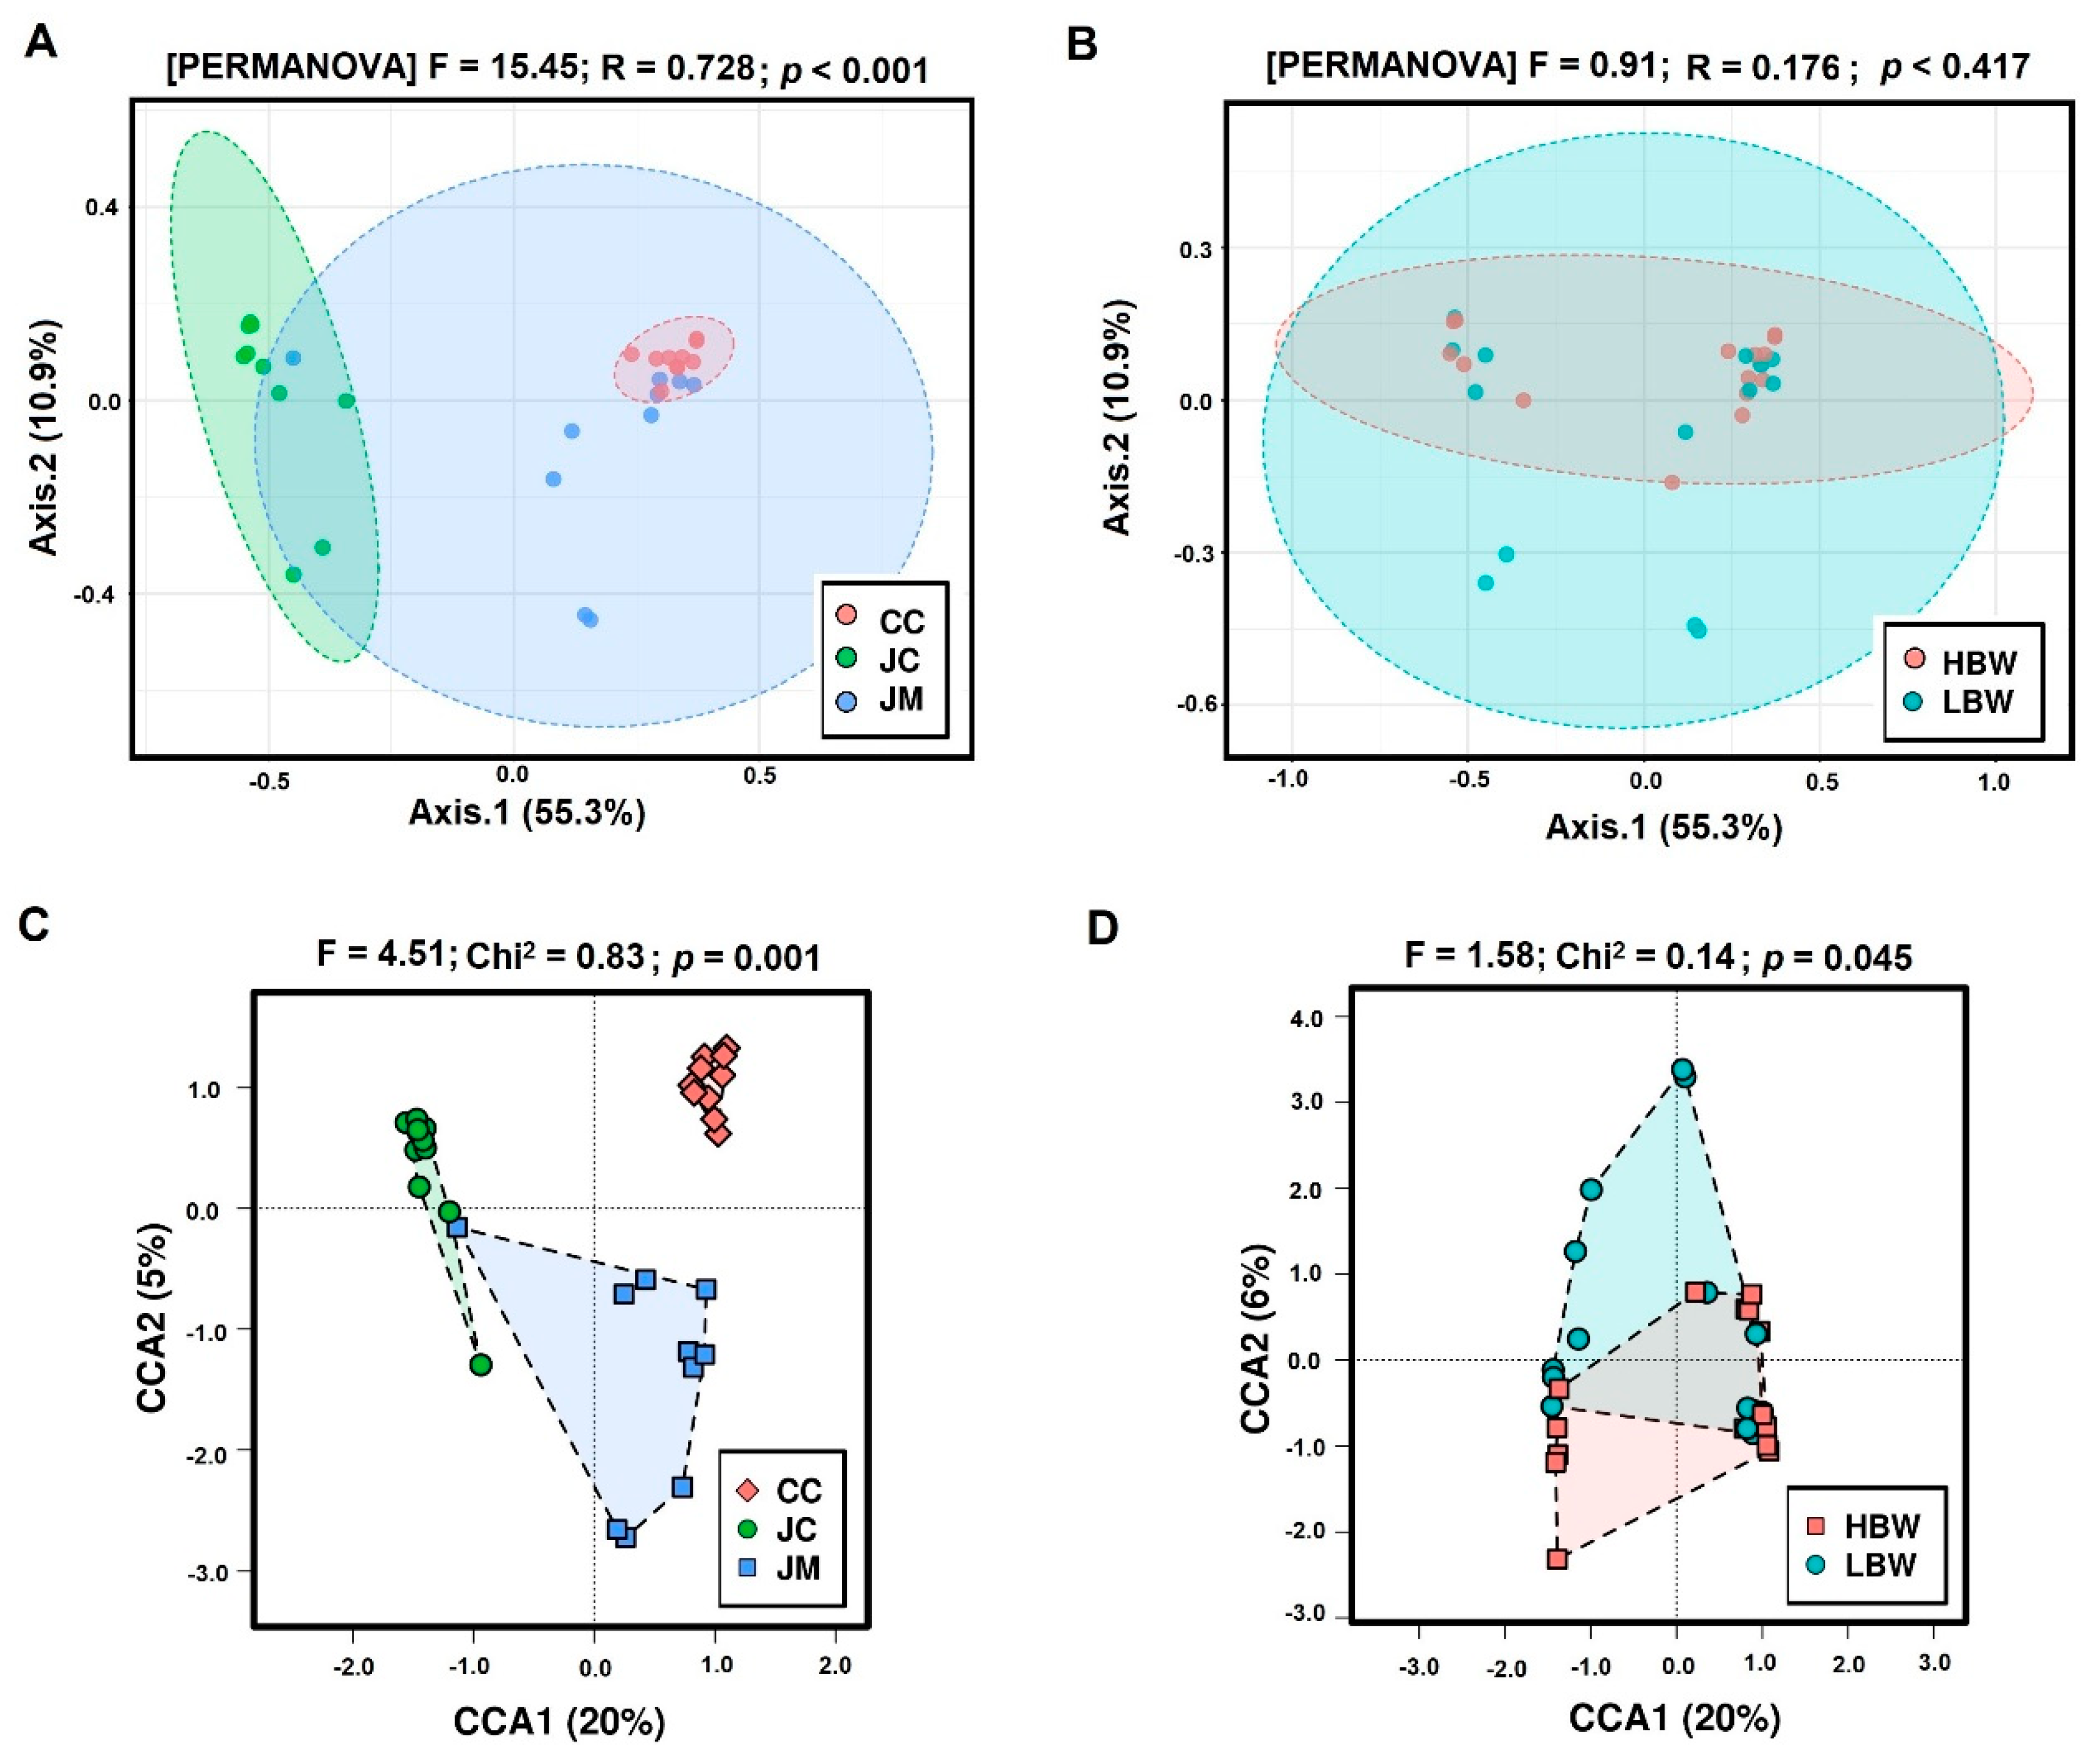
3.1. Sequencing Data and Differences in the Alpha and Beta Diversity

In total, 582,263 quality-controlled sequences were generated with a mean of 208,595 (SD: 4306), 166,088 (SD: 3927), and 207,580 (SD: 3039) reads per JC, JM, and CC samples, respectively. Sequences were classified into 826 OTUs. The efficiency of classification at different taxonomic levels was 80%, 98%, 99%, and 100% for the genus, family, order, and class and phylum, respectively. Rarefaction curves represented lower species richness in the JC and higher in JM and CC samples (Figure S2).
To describe which unique OTUs were present in the three sampling places, an OTU was assumed to be unique if it had at least one count in a given sample belonging to the sampling group. Among the three intestinal SPs, 210 (minimum core microbiota) shared OTUs were identified, whereas the aggregate OTU numbers were the largest in the JM (762 OTUs), and the lowest in the JC (381 OTUs; Figure S3). Shared OTUs among low and high BW chicken microbiota were 189, 526, and 505 in the JC, JM, and CC, respectively, which were more than 95% of the total reads number. The unique OTU number was mostly below 2%. The highest percentage was found in the jejunal mucosa of HBW birds (2.6%) (Figure S4).
All alpha diversity indices were significantly lower (p < 0.001) in the JC samples than in the JM and CC (Table 1). All measures (Chao1, Shannon, and Simpson) were the highest in the CC except PD, where the JM was more diverse. No significant BW effects and SP × BW-interactions were found (p > 0.05).
Beta-diversity was examined with the Bray–Curtis dissimilarity and canonical correspondence analysis (CCA) using the chi-square distance. In the case of a Bray–Curtis dissimilarity which gives equal weights to rare and abundant species, the sampling places were separated significantly (ANOSIM R = 0.741, p < 0.001; Figure 1A) but the BW groups were not (ANOSIM R = −0.01, p = 0.429; Figure 1B). In the case of a chi-square distance which gives more weight to rare species than to common species the separation by sampling places was even more pronounced (p = 0.001; Figure 1C) and in this case the separation by bodyweight was also significant (p = 0.045; Figure 1D).

3.2. Gut Microbiota Composition at Phylum Level

At the phylum level, the dominant phyla in the JC samples were Firmicutes (82.42%), Proteobacteria (6.83%), Cyanobacteria (4.29%), and Actinobacteria (3.47%) (Table 2). These four phyla represented more than 97% of the total bacterial population in the JC. In the JM and CC, the two dominant phyla were Firmicutes (64.77% and 49.35%, respectively), and Bacteroidetes (30.41% and 48.43%, respectively).
The relative abundance of Firmicutes (p < 0.001), Proteobacteria (p = 0.045), and Bacteroidetes (p < 0.001) was different across sampling places. Firmicutes represented significantly higher frequencies in the JC than in the JM and CC. Proteobacteria also represented significantly higher frequencies in the JC than in the JM and CC. On the other hand, the abundance of Bacteroidetes was the highest in the CC and JM.
Comparing the BW effects, Bacteroidetes represented a significantly higher abundance in HBW chickens (p = 0.029). In the jejunal mucosa both Bacteroides and Tenericutes represented a higher ratio in HBW birds. On the opposite hand, the abundance of Firmicutes in the JM was higher in the LBW group. Due to the higher abundance of Bacteroidetes in HBW birds, the Bacteroidetes/Firmicutes (B/F) ratio was also significantly higher in HBW chickens (p = 0.029). This difference was mainly the characteristic of the mucosa. No significant BW × SP interactions were found (p > 0.05).

3.3. Gut Microbiota Composition at Genus Level

At the genus level, 20 genera had about at least 1% relative abundance. The distribution of major bacterial genera is shown in Table S2. Lactobacillus (65.1%), Streptococcus (7.2%), Escherichia-Shigella (4.6%), and Corynebacterium-1 (2.8%) were dominant in the JC, whereas Bacteroides (26.7% and 44.3%), Lactobacillus (14.6% and 3.3%), Ruminococcaceae UCG-014 (3.1% and 4.1%), and Faecalibacterium (2.8% and 2.2%) were dominant in the JM and CC, respectively.
The BW-dependent differences are summarised in Table 3. The relative abundance of Enterococcus in the JC and Bacteroides and Ruminococcaceae UCG-010 in the JM were significantly higher in the HBW group. On the other hand, the abundance of Ruminococcaceae UCG-013 and Negativibacillus in the CC was significantly higher in LBW chickens.
The BW × SP interaction showed significant effects in the case of Enterococcus (p = 0.001), Ruminococcaceae UCG-013 (p = 0.026), and Negativibacillus (p = 0.027). The reason for the interaction was the different trends of the three genera in the different sampling places. It is important to note that, although not significantly, Lactobacillus (LBW: 21.87%; HBW: 7.23%) showed a big difference in the JM.

3.4. Correlation between Gut Microbiota and BW

To identify specific microbial genera significantly associated with BW, Spearman’s rank correlation was performed. We performed the analysis between each sampling place of BW with genera representing >0.01% of the total microbial composition if presented in at least eight samples of birds (Figure S5).
In the JC, only Enterococcus (R = 0.87, p = 0.001) was positively correlated with BW (Figure S5A). In the JM, six correlations were detected. Three of these, assigned to the phylum Bacteroidetes and class Bacteroidia, namely, Parabacteroides (R = 0.66, p = 0.044), Alistipes (R = 0.77, p = 0.01), and Bacteroides (R = 0.65, p = 0.049), correlated positively with the BW. In the phylum Firmicutes, Clostridia (class), Fournierella (R = 0.65, p = 0.049) and Ruminococcaceae UCG-010 (R = 0.77, p = 0.009) were also positively correlated with BW (Figure S5B). CHKCI002 (genus of phylum Actinobacteria) was the only genus with negative significant correlation (R = −0.66, p = 0.038).
In the CC, only seven negative correlations were detected (Figure S5C). Among them, six genera belonged to the Clostridia class (Defluviitaleaceae UCG-011, GCA-900066575, Butyricicoccus, Negativibacillus, Ruminiclostridium-9, and Ruminococcaceae UCG-013) and to the class Deltaproteobacteria (Bilophila).
It was interesting that genera of the Bacteroidetes phylum (Alistipes, Bacteroides, and Parabacteroides) showed correlation mostly in the JM, whereas those of Firmicutes (Butyricicoccus, Negativibacillus, etc.) showed correlation in the CC.

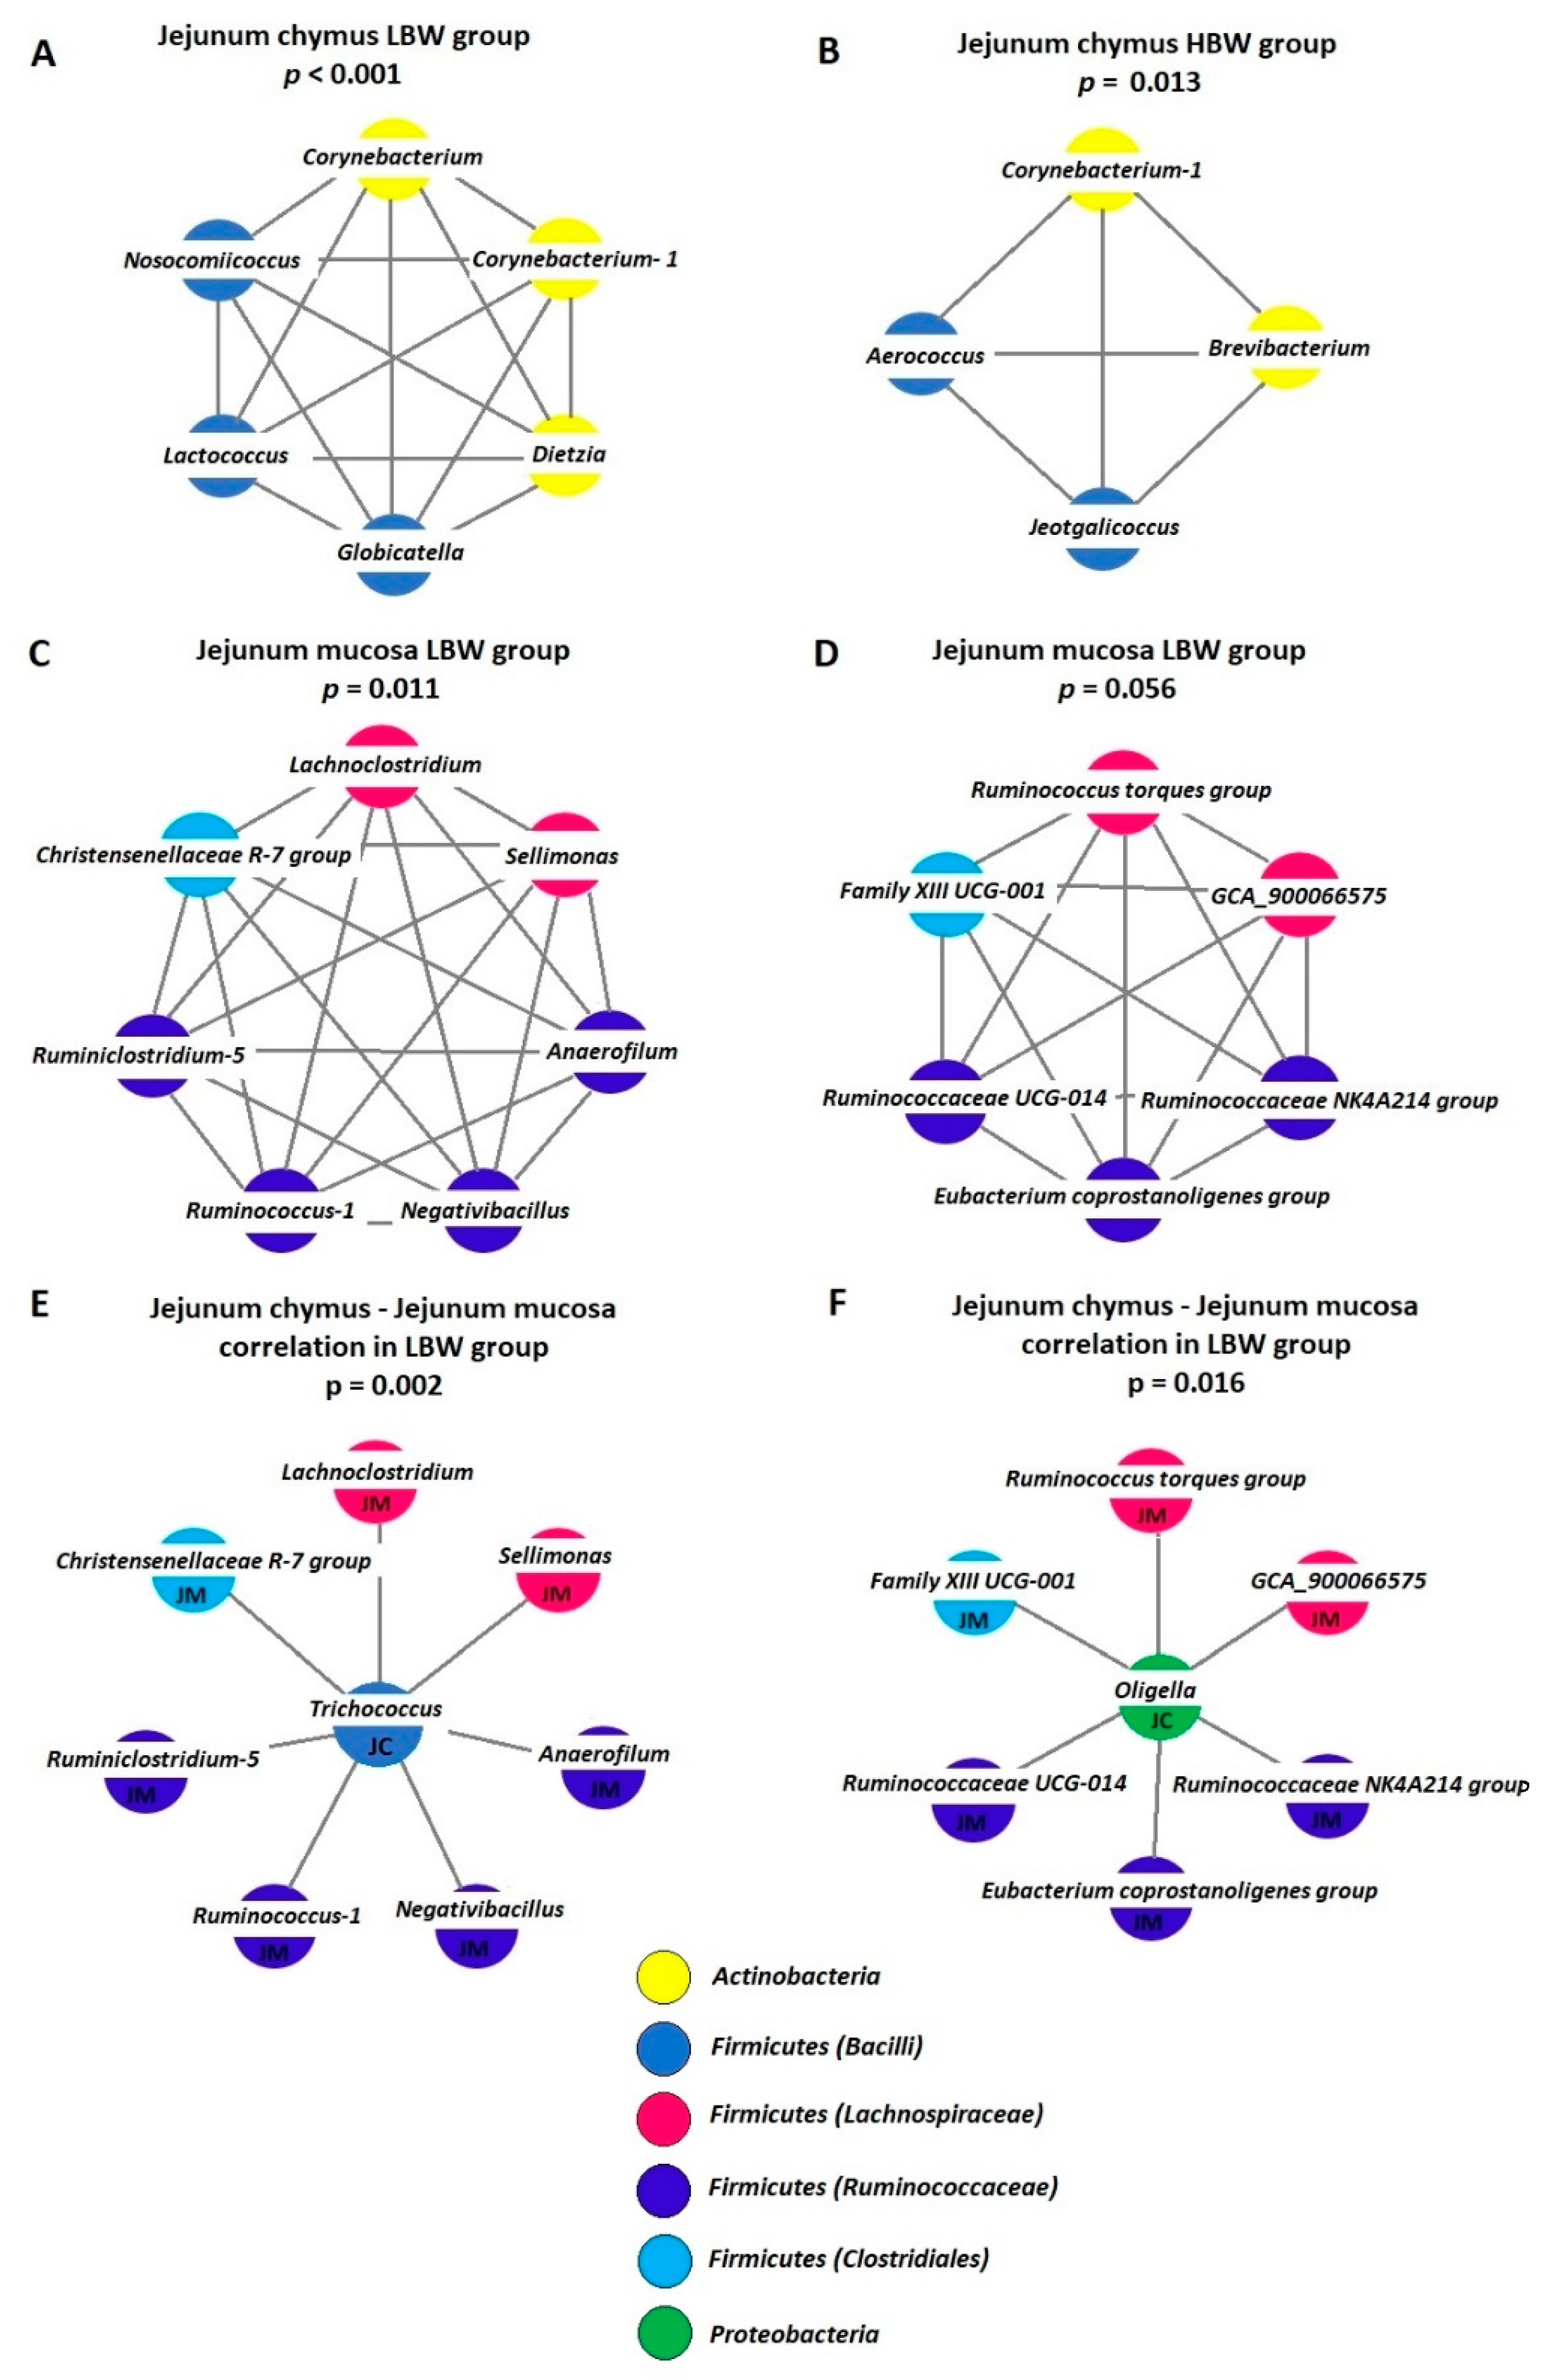
3.5. Analysis of Co-Occurrence Patterns

The aim of this analysis was to infer interactions between bacteria genera in the gut microbiota across different BW groups and sampling places.
In the JC of LBW birds, six genera (Corynebacterium, Corynebacterium-1, Dietzia, Globicatella, Lactococcus and Nosocomiicoccus) had significant positive correlation (p < 0.001) (Figure 2A). In the HBW treatment group, four genera (Corynebacterium-1, Brevibacterium, Aerococcus, and Jeotgalicoccus) showed significant correlations (p = 0.013) (Figure 2B). In both cases, genera of the Actinobacteria phylum were associated with members of the Bacilli class of the Firmicutes phylum.
In the JM, only in the case of LBW chickens were significant correlations found among bacterial genera. Two such interaction matrixes have been detected. In the first network, seven genera (Anaerofilum, Christensenellaceae R-7 group, Lachnoclostridium, Negativibacillus, Ruminiclostridium-5, Ruminococcus-1, and Sellimonas) had positive correlations with each other (p = 0.011) (Figure 2C). The correlation between the other six genera (Eubacterium coprostanoligenes group, Family XIII UCG-001, GCA-900066575, Ruminococcaceae NK4A214 group, Ruminococcaceae UCG-014, and Ruminococcus torques group) in the second group (Figure 2D) was close to the significant level (p = 0.056). Similar to the first network, members of this group also included genera from the Ruminococcaceae and Lachnospiraceae families and the Clostridiales order.
In the case of JM-HBW, CC-LBW, and CC-HBW relations, no significant connections at the genus level were found.
Regarding the connection between the JC and JM, a significant number of correlations were found only in the LBW treatment group. Trichococcus from the JC had positive correlations with seven genera from the JM (p = 0.002; Figure 2E). Oligella from the JC was also positively correlated with six genera from the JM (p = 0.016; Figure 2F). All the correlations between the JC and JM were positive.

4. Discussion

The efficiency of poultry production can be measured with different parameters including the feed conversion ratio (FCR), body weight gain (BWG), or European efficiency index (EEI) [26]. The interaction between gut microbiota and production traits has been widely studied. However, the findings are sometimes contradictory or non-conclusive considering that the cause/effect relationship is still unclear. The factors that impact microbiota composition (age, breed, health status, and farm conditions including type of diet, feed additives, environment, and farm management) can also modify the fed intake and growth rate and may explain the variability in performance.
In our experiment, healthy chickens with the highest and lowest body weight (BW) were selected at day 37. The aim of the study was to determine whether correlations can be found between intestinal microbiota composition and the growing intensity of broiler chickens.

4.1. Diversity of Gut Microbiota

Microbial α diversities were significantly lower in the JC than in the JM and CC. Diversities were not significantly different between the JM and CC. Between the two BW groups no significant differences were found in the alpha diversity at any of the sampling places. Among the observed OTU numbers, the Shannon and Simpson indices tended to show greater diversity in the HBW group in the JM and CC. Our results are similar to those of Liu et al. who also failed to detect differences in the diversity of the ileum and caecal microbial community between chickens with different feed efficiency [27]. Some authors have reported lower species richness in the intestine of chickens with higher feed efficiency, but no differences if the excreta samples were analysed [28,29]. However, several studies found that bacterial diversity in the intestinal tract is higher in the birds with a lower FCR or high feed efficiency [1,2,3,4,26].
In previous studies with broiler chickens, the microbiota analysis focused mostly on gut content samples and less attention has been paid to the bacteria of the mucosa. Similar to our findings, in a recent comparison higher microbial community richness was found in the ileal mucosa and caecum compared with the ileal content of broiler chickens [30]. Although α-diversities of the JM and CC did not differ significantly, β-diversities showed significant separation between the JC, JM, and CC. This finding is in accordance with several others that compared microbial communities of the different GIT sections [31,32,33].

4.2. Composition of Gut Microbiota in the Different Sampling Places

As it has been described before, microbial communities were clearly separated in different sections of the GIT in broiler chickens [31,34,35,36]. In our study Lactobacillus, Escherichia-Shigella, Streptococcus, and Corynebacterium were the dominant genera in the JC. Most of the studies described how bacterial genera colonising the small intestine originate mainly from the phylum Firmicutes and include Lactobacillus, Enterococcus, Streptococcus, Escherichia, and Clostridium clusters [37,38,39,40]. However, the additional presence of Bacteroides and Corynebacterium was also reported [41,42,43].
In our case the major bacterial genera in the JM and CC were quite distinct from that of the JC. Anaerobes such as Bacteroides, Ruminococcaceae UCG-014, and Faecalibacterium and the aerotolerant anaerobic Lactobacillus showed dominancy in the JM and CC. In accordance with several other findings, the most abundant families within the caecum were Clostridiaceae, Bacteroidaceae, Lactobacillaceae, and butyrate producers such as Lachnospiraceae and Ruminococcaceae [17,32,42,44].

4.3. BW-Related Differences of the Gut Microbiota

In the JC, the genus Enterococcus (Firmicutes, Bacilli class) correlated positively with BW and showed significantly higher relative abundance in the HBW group. Members of the Enterococcus genus, especially E. faecalis, are generally considered to be harmful or even pathogenic. However, some species of Enterococcus are used as probiotics, improving gut health and having positive interactions with other members of the microbial community [44,45].
Based on correlation analysis, in the JM positive correlations were detected between body weight and genera Alistipes, Bacteroides, Parabacteroides, Ruminococcaceae UCG-010, and Fournierella. In the JM, only the genus Coriobacteriaceae CHKCI002 (Actinobacteria) correlated with BW negatively. In the mucosa, Parabacteroides, Alistipes, and Bacteroides genera correlated with BW positively. The members of Bacteroidetes are adapted to gut mucosa using the mucin as substrate. The immune-modulatory effect, for example, of B. fragilis, is well known [46]. Their beneficial effects may explain their higher proportion in HBW chickens. Short chain fatty acids can modulate immune responses, and members of Ruminococcaceae are mostly butyrate producers [47]. From a human aspect, a high abundance of Bacteroides and Ruminococcus suggests a more healthy gut microbiota [48,49]. The Ruminococcaceae family is important for degrading pectin and cellulose in the colonic fermentation of dietary fibers [50]. Guo et al. found a similar diversity of bacterial communities in geese fed with different proportions of ryegrass. The ration of ryegrass affected the abundance of cellulose-degrading microbiota (Ruminiclostridium and Ruminococcaceae UCG-010) and enriched the lipid metabolic pathways [51]. Bacteroides maintain a complex and generally beneficial relationship with the host when retained in the gut [52]. Parabacteroides is a relatively new genus with distinctive features shared among other gut commensal bacteria [53]. Recently, studies on P. distasonis have displayed evidence that these bacteria are potentially beneficial [53]. Alistipes are commensal bacteria and their proportion increased with the age of broiler chickens [49]. There is contrasting evidence that Alistipes may have protective effects against some diseases, but other studies indicate Alistipes are pathogenic in humans [54]. Duggett et al. first isolated the genus Coriobacteriaceae CHKCI002 from the chicken caeca and published its draft genome sequence [55]. To the best of our knowledge, there are no known reports of their occurrence in the ileum mucus of the chicken intestine. Their interaction with other microorganisms is unknown, but several species within the Coriobacteriia class have been implicated with human diseases [56,57].
In the CC, the relative abundance of Alistipes was significantly higher, whereas Ruminococcaceae UCG-013 and Negativibacillus were lower in HBW chicken. In the CC, seven genera negatively correlated with BW, namely, Defluviitaleaceae UCG-011, GCA-900066575, Butyricicoccus, Negativibacillus, Ruminiclostridium-9, Ruminococcaceae UCG-013, and Bilophila. Potential performance-related phylotypes were assigned to some bacteria species such as Lactobacillus salivarius, Lactobacillus aviarius, Lactobacillus crispatus, Clostridium lactatifermentans, different members of the family Ruminococcaceae, Bacteroides vulgatus, Akkermansia, and Faecalibacterium, among others [2,3,58]. The relative abundances of four genera of Ruminococcaceae decreased in the HBW group. Ruminococci are generally beneficial key members of the gut ecosystem, having multiple interactions with the other members of gut microbiota [58].
Their decrease in the HBW group is probably due to the shift of the B/F ratio, which was relevant but not significant in the caecum. This is supported by the significant increase in proportion of Alistipes, a member of the phylum Bacteroidetes in the caecum.
In humans, Ley et al. and Turnbaugh et al. found lower relative abundance of Bacteroidetes and reduced biodiversity in the feces microbiota of obese individuals [59,60]. Other authors observed a higher relative abundance of Bacteroidetes in obese or overweight individuals compared with lean controls, and increased Firmicutes and Actinobacteria coupled with decreased Proteobacteria and Fusobacteria in obese individuals compared to normal-weight individuals [14,61,62].
The measured body weight-related differences in gut microbiota composition does not mean that bacteria are the determinant factor in the chicken’s growth potential. However, differences in some bacterial genera and species could generate complex humoral and immunological reactions. The exact mechanism of these bacteria–host interactions is not fully understood yet. On the other hand, the measured differences in the gut microbiota may also be the results of differences in the nutrient digestion of individual animals. Digestion affects not only the absorption rate of nutrients, but also the nutrients available for the microbes.

4.4. Analysis of Co-Occurrence Patterns

Co-occurrence interaction results in the JC revealed a correlation between the genera of Actinobacteria and Firmicutes Bacilli classes; however, their pattern was different in the LBW and HBW groups. More genera and interaction links were found in the LBW group. Similar to our results, Huang et al. have also found positive correlations between some bacteria belonging to the phylum Actinobacteria and to the class Bacilli in the foregut of chickens [61].
The genus Corynebacterium includes Gram-positive aerobic bacteria. They are widely distributed in nature in the gut microbiota of animals and humans and are mostly innocuous, most commonly existing in commensal relationships with their hosts [62,63]. Others can cause human disease, including most notably diphtheria by C. diphtheriae [63].
We found a single reference in the literature that described the interaction between Corynebacterium and the pathogenic species of Staphylococcaceae [64]. According to this research, the Corynebacterium species has a key role of as attenuator of Staphylococcus aureus virulence in the nose microbiota.
In the JM, correlation connections only in the LBW group were found. The network members included the genera of Ruminococcaceae, Lachnospiraceae families, Christensenellaceae R-7 group, and Family XIII UCG-001 from the Clostridia class, and all had positive correlations. In our case in LBW chickens, Lachnospiraceae often showed positive correlations with Ruminococcaceae. Ruminococcus species are defined as strictly anaerobic, Gram-positive, non-motile cocci that do not produce endospores and require fermentable carbohydrates for growth [65]. According to Khoruts et al., Ruminococcaceae are one of the few types of bacteria involved in converting bile acids [66]. Lachnospiraceae belong to the core of gut microbiota, colonising the intestinal lumen from birth. Although members of Lachnospiraceae are among the main producers of short-chain fatty acids, different taxa of this family are also associated with different intra- and extraintestinal diseases in humans, such as ulcerative colitis, Crohn’s, and celiac disease [67]. Genomic analysis of Lachnospiraceae revealed a considerable capacity to utilise diet-derived polysaccharides, including starch, inulin, and arabinoxylan, with substantial variability among species and strains [67]. The seven-member node identified Sellimonas genus includes Gram-positive and anaerobic bacteria species previously considered as uncultivable. Although little is known about this Lachnospiraceae family member, its increased abundance has been reported in patients who recovered intestinal homeostasis after dysbiosis events [68].
As far as the JC-JM microbiota interaction is concerned, a significant number of correlations was found only in the LBW chickens. Trichococcus from the JC had positive correlations with seven genera from the JM. Oligella from the JC was also positively correlated with six genera from the JM. Trichococcus are lactic acid bacteria (LAB) that have the ability to utilise sugars, sugar alcohols, and polysaccharides [69]. It has already been identified from poultry feeds [70]. Oligella species are gram-negative organisms that cause infections primarily of the genitourinary tract. This pathogenic genus could be detected in JC samples only in LBW chickens. There is no information on these bacteria in poultry. Oligella species are described in humans with urological infections and diseases [71]. The mechanism of infection currently remains unclear. In the case of CC, no co-occurrence patterns have been found.
The explanation of these relationships is not easy. Our results highlight the need to investigate the composition and relationship of lumen and mucosa-linked microbiota in the small intestine. Whereas in the lumen the flux of nutrients is continuous, the consistent structure of mucosa provides a longer retention time and more networking chances for the bacterial community. The reason for the absence of bacterial co-occurrence in the caeca remains unclear.
In summary, beta diversity, according to canonical correspondence analysis, showed a significant separation of bacterial groups between the two BW categories. The BW-related changes in microbiota were mostly significant in the jejunal mucosa. The phylum Bacteroidetes was higher, whereas Firmicutes was lower in the JM of HBW chickens. At the genus level, Enterococcus in the JC and Bacteriodes and Ruminococcaceae UCG-010 in the JM showed significantly higher abundance in the HBW animals. On the other hand, Ruminococcaceae UCG-013 and Negativibacillus in the CC of LBW birds was higher. Similar co-occurrence patterns of LBW and HBW chickens were detected in the IC. In the JM, only LBW birds showed significant bacterial interaction between the genera of Firmicutes. Two genera, Trichococcus and Oligella, in the JC of LBW animals had co-occurrence connections with other genera in the JM. No such interactions in HBW chickens and in the CC of both BW groups have been found. According to our results, BW-dependent dominant and low abundant genera could modify the different metabolic pathways and, this way, the growth of the chicken.

5. Conclusions

This study confirmed that the composition of gut microbiota of chickens is influenced mostly by the sampling place. The digesta of the small intestine, the mucosa layer of the gut wall, and the caecal contents have microbiota with different diversities and compositions. The growth rate of birds depends on several nutritional and environmental factors and gut microbiota composition does not seem to be one of the strongest.
In general, caecal chymus and excreta are the most commonly studied sample types when examining the relationship between intestinal microbiota and the efficiency of poultry production. The novelty of this study is that we could prove that the increased Bacteroidetes/Firmicutes ratio in the jejunal mucosa could be a marker of the growth potential. Besides that, several mostly positive interactions have been detected between some genera in the JM and the growth rate of chickens. We could also detect two genera (Trichococcus and Oligella) in the IC of the LBW group that had an impact on the abundance of other bacterial genera in the mucosa. Further research is needed to obtain more of an understanding on how the mechanism works, how bacteria of the gut lumen can modulate the microbiota development of the mucosa, and how the microbes of mucosa can change the metabolism of the host by special metabolomic or gut-associated gene expression mechanisms.

Supplementary Materials

The following are available online at https://www.mdpi.com/article/10.3390/ani12101296/s1. Table S1: Composition of diets (starter, Grower, and finisher) fed to the experimental chicks; Figure S1: Sampling strategy; Figure S2: The rarefaction curves of OTUs; Figure S3: Venn diagram shows the number of OTUs that were shared or not shared in the jejunum mucosa (JM), jejunum content (JC), and caecum content (CC), or overlapped in the three examined groups; Figure S4: Venn diagrams show the number of OTUs in different intestinal sampling places according to the body weight (low and high BW) of chickens; Table S2: Relative abundance of bacterial genera in the different sampling places of broiler chickens as affected by BW (%); Figure S5: Correlation between body weight (g) and genus abundance in the different intestinal samples: (A) correlation in jejunum chymus; (B) in jejunum mucosa; and (C) in caecum chymus.

Author Contributions

Conceptualization, V.F. and K.D.; methodology, V.F., L.M. and G.C.; software, V.F.; validation, V.F.; formal analysis, V.F., L.M. and G.C.; investigation, V.F., M.A.R., Á.M., N.S. and L.P.; resources, K.D.; data curation, V.F.; writing—original draft preparation, V.F.; writing—review and editing, V.F., L.M., G.C., L.P., F.H., M.A.R., Á.M., N.S. and K.D.; visualization, V.F. and L.M.; supervision, K.D.; project administration, V.F.; funding acquisition, K.D. All authors have read and agreed to the published version of the manuscript.

Funding

This research was supported by the Hungarian Government and the European Union, with the co-funding of the European Regional Development Fund in the frame of the Széchenyi 2020 Programme GINOP-2.3.2-15-2016-00054 project.

Institutional Review Board Statement

The animal experiment was approved by the Institutional Ethics Committee (Animal Welfare Committee, Georgikon Campus, Hungarian University of Agriculture and Life Sciences) under the license number MÁB-1/2017.

Informed Consent Statement

Not applicable.

Data Availability Statement

All data generated or analysed during this study are included in this published article (and its supplementary information files). Raw sequence data of the 16S rRNA metagenomics analysis are deposited in the National Center for Biotechnology Information (NCBI) Sequence Read Archive under the BioProject identifier PRJNA609272.

Acknowledgments

The publication is supported by the EFOP-3.6.3-VEKOP-16-2017-00008 project. The project is co-financed by the European Union and the European Social Fund.

Conflicts of Interest

The authors have read the journal’s guideline and have the following competing interests: the co-authors Dr. Ákos Mezőlaki is employees of Agrofeed Ltd. All authors have no competing interest.

References

  1. Stanley, D.; Denman, S.E.; Hughes, R.J.; Geier, M.S.; Crowley, T.M.; Chen, H.; Haring, V.R.; Moore, R.J. Intestinal microbiota associated with differential feed conversion efficiency in chickens. Appl. Microbiol. Biotechnol. 2012, 96, 1361–1369. [Google Scholar] [CrossRef] [PubMed]
  2. Yan, W.; Sun, C.; Yuan, J.; Yang, N. Gut metagenomic analysis reveals prominent roles of Lactobacillus and cecal microbiota in chicken feed efficiency. Sci. Rep. 2017, 7, 1–11. [Google Scholar] [CrossRef] [PubMed]
  3. Torok, V.A.; Allison, G.E.; Percy, N.J.; Ophel-Keller, K.; Hughes, R.J. Influence of antimicrobial feed additives on broiler commensal posthatch gut microbiota development and performance. Appl. Environ. Microbiol. 2011, 77, 3380–3390. [Google Scholar] [CrossRef] [PubMed] [Green Version]
  4. Singh, K.M.; Shah, T.; Deshpande, S.; Jakhesara, S.J.; Koringa, P.G.; Rank, D.N.; Joshi, C.G. High through put 16S rRNA gene-based pyrosequencing analysis of the fecal microbiota of high FCR and low FCR broiler growers. Mol. Biol. Rep. 2012, 39, 10595–10602. [Google Scholar] [CrossRef]
  5. Liu, J.; Stewart, S.N.; Robinson, K.; Yang, Q.; Lyu, W.; Whitmore, M.A.; Zhang, G. Linkage between the intestinal microbiota and residual feed intake in broiler chickens. J. Anim. Sci. Biotechnol. 2021, 12, 1–16. [Google Scholar] [CrossRef]
  6. Bäckhed, F.; Ding, H.; Wang, T.; Hooper, L.V.; Gou, Y.K.; Nagy, A.; Semenkovich, C.F.; Gordon, J.I. The gut microbiota as an environmental factor that regulates fat storage. Proc. Natl. Acad. Sci. USA 2004, 101, 15718–15723. [Google Scholar] [CrossRef] [Green Version]
  7. Turnbaugh, P.J.; Ley, R.E.; Mahowald, M.A.; Magrini, V.; Mardis, E.R.; Gordon, J.I. An obesity-associated gut microbiome with increased capacity for energy harvest. Nature 2006, 444, 1027–1031. [Google Scholar] [CrossRef]
  8. Salaheen, S.; Kim, S.-W.; Haley, B.J.; Van Kessel, J.A.S.; Biswas, D. Alternative Growth Promoters Modulate Broiler Gut Microbiome and Enhance Body Weight Gain. Front. Microbiol. 2017, 8, 2088. [Google Scholar] [CrossRef]
  9. Jumpertz, R.; Le, D.S.; Turnbaugh, P.J.; Trinidad, C.; Bogardus, C.; Gordon, J.I.; Krakoff, J. Energy-balance studies reveal associations between gut microbes, caloric load, and nutrient absorption in humans. Am. J. Clin. Nutr. 2011, 94, 58. [Google Scholar] [CrossRef] [Green Version]
  10. Duncan, S.H.; Lobley, G.E.; Holtrop, G.; Ince, J.; Johnstone, A.M.; Louis, P.; Flint, H.J. Human colonic microbiota associated with diet, obesity and weight loss. Int. J. Obes. 2008, 32, 1720–1724. [Google Scholar] [CrossRef] [Green Version]
  11. Zhang, H.; DiBaise, J.K.; Zuccolo, A.; Kudrna, D.; Braidotti, M.; Yu, Y.; Parameswaran, P.; Crowell, M.D.; Wing, R.; Rittmann, B.E.; et al. Human gut microbiota in obesity and after gastric bypass. Proc. Natl. Acad. Sci. USA 2009, 106, 2365. [Google Scholar] [CrossRef] [PubMed] [Green Version]
  12. Ppatil, D.; Pdhotre, D.; Gchavan, S.; Sultan, A.; Jain, D.S.; Lanjekar, V.B.; Gangawani, J.; Sshah, P.; Stodkar, J.; Shah, S.; et al. Molecular analysis of gut microbiota in obesity among Indian individuals. J. Biosci. 2012, 37, 647–657. [Google Scholar] [CrossRef] [PubMed]
  13. Magne, F.; Gotteland, M.; Gauthier, L.; Zazueta, A.; Pesoa, S.; Navarrete, P.; Balamurugan, R. The Firmicutes/Bacteroidetes Ratio: A Relevant Marker of Gut Dysbiosis in Obese Patients? Nutrients 2020, 12, 1474. [Google Scholar] [CrossRef] [PubMed]
  14. Medvecky, M.; Cejkova, D.; Polansky, O.; Karasova, D.; Kubasova, T.; Rychlik, I.; Cizek, A. Whole genome sequencing and function prediction of 133 gut anaerobes isolated from chicken caecum in pure cultures. BMC Genomics 2018, 19, 1–15. [Google Scholar] [CrossRef] [PubMed] [Green Version]
  15. Borda-Molina, D.; Seifert, J.; Camarinha-Silva, A. Current Perspectives of the Chicken Gastrointestinal Tract and Its Microbiome. Comput. Struct. Biotechnol. J. 2018, 16, 131–139. [Google Scholar] [CrossRef]
  16. Faust, K.; Sathirapongsasuti, J.F.; Izard, J.; Segata, N.; Gevers, D.; Raes, J.; Huttenhower, C. Microbial Co-occurrence Relationships in the Human Microbiome. PLoS Comput. Biol. 2012, 8, e1002606. [Google Scholar] [CrossRef]
  17. Aviagen. Ross Brioler Management Handbook; Aviagen Group, Cummings Research Park, 920 Explorer Boulevard NW: Huntsville, AL, USA, 2018. [Google Scholar]
  18. Klindworth, A.; Pruesse, E.; Schweer, T.; Peplies, J.; Quast, C.; Horn, M.; Glöckner, F.O. Evaluation of general 16S ribosomal RNA gene PCR primers for classical and next-generation sequencing-based diversity studies. Nucleic Acids Res. 2013, 41, e1. [Google Scholar] [CrossRef]
  19. Bolyen, E.; Rideout, J.R.; Dillon, M.R.; Bokulich, N.A.; Abnet, C.C.; Al-Ghalith, G.A.; Alexander, H.; Alm, E.J.; Arumugam, M.; Asnicar, F.; et al. Reproducible, interactive, scalable and extensible microbiome data science using QIIME 2. Nat. Biotechnol. 2019, 37, 852–857. [Google Scholar] [CrossRef]
  20. Amir, A.; McDonald, D.; Navas-Molina, J.A.; Kopylova, E.; Morton, J.T.; Zech Xu, Z.; Kightley, E.P.; Thompson, L.R.; Hyde, E.R.; Gonzalez, A.; et al. Deblur Rapidly Resolves Single-Nucleotide Community Sequence Patterns. mSystems 2017, 2, e00191-16. [Google Scholar] [CrossRef] [Green Version]
  21. Quast, C.; Pruesse, E.; Yilmaz, P.; Gerken, J.; Schweer, T.; Yarza, P.; Peplies, J.; Glöckner, F.O. The SILVA ribosomal RNA gene database project: Improved data processing and web-based tools. Nucleic Acids Res. 2013, 41, D590–D596. [Google Scholar] [CrossRef]
  22. Chong, J.; Liu, P.; Zhou, G.; Xia, J. Using MicrobiomeAnalyst for comprehensive statistical, functional, and meta-analysis of microbiome data. Nat. Protoc. 2020, 15, 799–821. [Google Scholar] [CrossRef] [PubMed]
  23. Zakrzewski, M.; Proietti, C.; Ellis, J.J.; Hasan, S.; Brion, M.J.; Berger, B.; Krause, L. Calypso: A user-friendly web-server for mining and visualizing microbiome-environment interactions. Bioinformatics 2017, 33, 782–783. [Google Scholar] [CrossRef] [PubMed] [Green Version]
  24. Blanca, M.; Alarcón, R.; Arnau, J.; Bono, R.; Bendayan, R. Non-normal data: Is ANOVA still a valid option? Psicothema 2017, 29, 552–557. [Google Scholar] [CrossRef] [PubMed]
  25. Heberle, H.; Meirelles, V.G.; da Silva, F.R.; Telles, G.P.; Minghim, R. InteractiVenn: A web-based tool for the analysis of sets through Venn diagrams. BMC Bioinform. 2015, 16, 1–7. [Google Scholar] [CrossRef]
  26. Stanley, D.; Geier, M.S.; Hughes, R.J.; Denman, S.E.; Moore, R.J. Highly variable microbiota development in the chicken gastrointestinal tract. PLoS ONE 2013, 8, e84290. [Google Scholar] [CrossRef] [Green Version]
  27. Liu, L.; Lin, L.; Zheng, L.; Tang, H.; Fan, X.; Xue, N.; Li, M.; Liu, M.; Li, X. Cecal microbiome profile altered by Salmonella enterica, serovar Enteritidis inoculation in chicken. Gut Pathog. 2018, 10, 1–14. [Google Scholar] [CrossRef]
  28. Siegerstetter, S.-C.; Schmitz-Esser, S.; Magowan, E.; Wetzels, S.U.; Zebeli, Q.; Lawlor, P.G.; O’Connell, N.E.; Metzler-Zebeli, B.U. Intestinal microbiota profiles associated with low and high residual feed intake in chickens across two geographical locations. PLoS ONE 2017, 12, e0187766. [Google Scholar] [CrossRef]
  29. Bae, Y.; Koo, B.; Lee, S.; Mo, J.; Oh, K.; Mo, I.P. Bacterial diversity and its relationship to growth performance of broilers. Korean J. Vet. Res. 2017, 57, 159–167. [Google Scholar] [CrossRef]
  30. Borda-Molina, D.; Vital, M.; Sommerfeld, V.; Rodehutscord, M.; Camarinha-Silva, A. Insights into broilers’ gut microbiota fed with phosphorus, calcium, and phytase supplemented diets. Front. Microbiol. 2016, 7, 2033. [Google Scholar] [CrossRef] [Green Version]
  31. Han, G.G.; Kim, E.B.; Lee, J.; Lee, J.Y.; Jin, G.; Park, J.; Huh, C.S.; Kwon, I.K.; Kil, D.Y.; Choi, Y.J.; et al. Relationship between the microbiota in different sections of the gastrointestinal tract, and the body weight of broiler chickens. Springerplus 2016, 5, 911. [Google Scholar] [CrossRef] [Green Version]
  32. Ranjitkar, S.; Engberg, R.; Lawley, B.; Tannock, G. Bacterial succession in the broiler gastrointestinal tract. Appl. Environ. Microbiol. 2016, 82, 2399–2410. [Google Scholar] [CrossRef] [PubMed] [Green Version]
  33. Glendinning, L.; Watson, K.A.; Watson, M. Development of the duodenal, ileal, jejunal and caecal microbiota in chickens. Anim. Microbiome 2019, 1, 1–11. [Google Scholar] [CrossRef] [PubMed] [Green Version]
  34. Kamada, N.; Chen, G.Y.; Inohara, N.; Núñez, G. Control of pathogens and pathobionts by the gut microbiota. Nat. Immunol. 2013, 14, 685–690. [Google Scholar] [CrossRef] [PubMed]
  35. Sekelja, M.; Rud, I.; Knutsen, S.H.; Denstadli, V.; Westereng, B.; Næs, T.; Rudi, K. Abrupt temporal fluctuations in the chicken fecal microbiota are explained by its gastrointestinal origin. Appl. Environ. Microbiol. 2012, 78, 2941–2948. [Google Scholar] [CrossRef] [PubMed] [Green Version]
  36. Videnska, P.; Faldynova, M.; Juricova, H.; Babak, V.; Sisak, F.; Havlickova, H.; Rychlik, I. Chicken faecal microbiota and disturbances induced by single or repeated therapy with tetracycline and streptomycin. BMC Vet. Res. 2013, 9, 30. [Google Scholar] [CrossRef] [Green Version]
  37. Rychlik, I. Composition and Function of Chicken Gut Microbiota. Animals 2020, 10, 103. [Google Scholar] [CrossRef] [Green Version]
  38. Witzig, M.; Da Silva, A.C.; Green-Engert, R.; Hoelzle, K.; Zeller, E.; Seifert, J.; Hoelzle, L.E.; Rodehutscord, M. Spatial Variation of the Gut Microbiota in Broiler Chickens as Affected by Dietary Available Phosphorus and Assessed by T-RFLP Analysis and 454 Pyrosequencing. PLoS ONE 2015, 10, e0143442. [Google Scholar] [CrossRef]
  39. Stanley, D.; Hughes, R.J.; Moore, R.J. Microbiota of the chicken gastrointestinal tract: Influence on health, productivity and disease. Appl. Microbiol. Biotechnol. 2014, 98, 4301–4310. [Google Scholar] [CrossRef]
  40. Awad, W.A.; Mann, E.; Dzieciol, M.; Hess, C.; Schmitz-Esser, S.; Wagner, M.; Hess, M. Age-Related Differences in the Luminal and Mucosa-Associated Gut Microbiome of Broiler Chickens and Shifts Associated with Campylobacter jejuni Infection. Front. Cell. Infect. Microbiol. 2016, 6, 154. [Google Scholar] [CrossRef] [Green Version]
  41. Xiao, Y.; Xiang, Y.; Zhou, W.; Chen, J.; Li, K.; Yang, H. Microbial community mapping in intestinal tract of broiler chicken. Poult. Sci. 2017, 96, 1387–1393. [Google Scholar] [CrossRef]
  42. Mohd Shaufi, M.A.; Sieo, C.C.; Chong, C.W.; Gan, H.M.; Ho, Y.W. Deciphering chicken gut microbial dynamics based on high-throughput 16S rRNA metagenomics analyses. Gut Pathog. 2015, 7, 4. [Google Scholar] [CrossRef] [PubMed] [Green Version]
  43. Lu, J.; Idris, U.; Harmon, B.; Hofacre, C.; Maurer, J.J.; Lee, M.D. Diversity and Succession of the Intestinal Bacterial Community of the Maturing Broiler Chicken. Appl. Environ. Microbiol. 2003, 69, 6816–6824. [Google Scholar] [CrossRef] [PubMed] [Green Version]
  44. Shehata, A.A.; Schrödl, W.; Aldin, A.A.; Hafez, H.M.; Krüger, M. The Effect of Glyphosate on Potential Pathogens and Beneficial Members of Poultry Microbiota In Vitro. Curr. Microbiol. 2012, 66, 350–358. [Google Scholar] [CrossRef] [PubMed]
  45. Zhang, R.; Chen, M.; Lu, Y.; Guo, X.; Qiao, F.; Wu, L. Antibacterial and residual antimicrobial activities against Enterococcus faecalis biofilm: A comparison between EDTA, chlorhexidine, cetrimide, MTAD and QMix. Sci. Rep. 2015, 5, 1–5. [Google Scholar] [CrossRef] [PubMed] [Green Version]
  46. Belkaid, Y.; Hand, T.W. Role of the Microbiota in Immunity and inflammation. Cell 2014, 157, 121. [Google Scholar] [CrossRef] [Green Version]
  47. Venegas, D.P.; De La Fuente, M.K.; Landskron, G.; González, M.J.; Quera, R.; Dijkstra, G.; Harmsen, H.J.M.; Faber, K.N.; Hermoso, M.A. Short Chain Fatty Acids (SCFAs)-Mediated Gut Epithelial and Immune Regulation and Its Relevance for Inflammatory Bowel Diseases. Front. Immunol. 2019, 10, 277. [Google Scholar] [CrossRef] [Green Version]
  48. Hollister, E.B.; Gao, C.; Versalovic, J. Compositional and Functional Features of the Gastrointestinal Microbiome and Their Effects on Human Health. Gastroenterology 2014, 146, 1449–1458. [Google Scholar] [CrossRef] [Green Version]
  49. Adewole, D.; Akinyemi, F. Gut microbiota dynamics, growth performance, and gut morphology in broiler chickens fed diets varying in energy density with or without bacitracin methylene disalicylate (Bmd). Microorganisms 2021, 9, 787. [Google Scholar] [CrossRef]
  50. Gosalbes, M.J.; Vázquez-Castellanos, J.F.; Angebault, C.; Woerther, P.L.; Ruppé, E.; Ferrús, M.L.; Latorre, A.; Andremont, A.; Moya, A. Carriage of Enterobacteria Producing Extended-Spectrum β-Lactamases and Composition of the Gut Microbiota in an Amerindian Community. Antimicrob. Agents Chemother. 2015, 60, 507–514. [Google Scholar] [CrossRef] [Green Version]
  51. Guo, B.; Li, D.; Zhou, B.; Jiang, Y.; Bai, H.; Zhang, Y.; Xu, Q.; Zhao, W.; Chen, G. Comparative characterization of bacterial communities in geese consuming of different proportions of ryegrass. PLoS ONE 2019, 14, e0223445. [Google Scholar] [CrossRef]
  52. Wexler, H.M. Bacteroides: The good, the bad, and the nitty-gritty. Clin. Microbiol. Rev. 2007, 20, 593–621. [Google Scholar] [CrossRef] [PubMed] [Green Version]
  53. Ezeji, J.C.; Sarikonda, D.K.; Hopperton, A.; Erkkila, H.L.; Cohen, D.E.; Martinez, S.P.; Cominelli, F.; Kuwahara, T.; Dichosa, A.E.K.; Good, C.E.; et al. Parabacteroides distasonis: Intriguing aerotolerant gut anaerobe with emerging antimicrobial resistance and pathogenic and probiotic roles in human health. Gut Microbes 2021, 13, 1922241. [Google Scholar] [CrossRef] [PubMed]
  54. Parker, B.J.; Wearsch, P.A.; Veloo, A.C.M.; Rodriguez-Palacios, A. The Genus Alistipes: Gut Bacteria With Emerging Implications to Inflammation, Cancer, and Mental Health. Front. Immunol. 2020, 11, 906. [Google Scholar] [CrossRef] [PubMed]
  55. Duggett, N.A.; Kay, G.L.; Sergeant, M.J.; Bedford, M.; Constantinidou, C.I.; Penn, C.W.; Millard, A.D.; Pallen, M.J. Draft Genome Sequences of Six Novel Bacterial Isolates from Chicken Ceca. Genome Announc. 2016, 4, e00448-16. [Google Scholar] [CrossRef] [Green Version]
  56. Gardiner, B.J.; Tai, A.Y.; Kotsanas, D.; Francis, M.J.; Roberts, S.A.; Ballard, S.A.; Junckerstorff, R.K.; Kormana, T.M. Clinical and microbiological characteristics of eggerthella lenta bacteremia. J. Clin. Microbiol. 2015, 53, 626–635. [Google Scholar] [CrossRef] [Green Version]
  57. Bisanz, J.E.; Soto-Perez, P.; Noecker, C.; Aksenov, A.A.; Lam, K.N.; Kenney, G.E.; Bess, E.N.; Haiser, H.J.; Kyaw, T.S.; Yu, F.B.; et al. A genomic toolkit for the mechanistic dissection of intractable human gut bacteria. Cell Host Microbe 2020, 27, 1001. [Google Scholar] [CrossRef]
  58. La Reau, A.J.; Suen, G. The Ruminococci: Key symbionts of the gut ecosystem. J. Microbiol. 2018, 56, 199–208. [Google Scholar] [CrossRef]
  59. Ley, R.E.; Turnbaugh, P.J.; Klein, S.; Gordon, J.I. Human gut microbes associated with obesity. Nature 2006, 444, 1022–1023. [Google Scholar] [CrossRef]
  60. Turnbaugh, P.J.; Bäckhed, F.; Fulton, L.; Gordon, J.I. Diet-Induced Obesity Is Linked to Marked but Reversible Alterations in the Mouse Distal Gut Microbiome. Cell Host Microbe 2008, 3, 213–223. [Google Scholar] [CrossRef] [Green Version]
  61. Huang, P.; Zhang, Y.; Xiao, K.; Jiang, F.; Wang, H.; Tang, D.; Liu, D.; Liu, B.; Liu, Y.; He, X.; et al. The chicken gut metagenome and the modulatory effects of plant-derived benzylisoquinoline alkaloids. Microbiome 2018, 6, 1–17. [Google Scholar] [CrossRef] [Green Version]
  62. Collins, M.D.; Hoyles, L.; Foster, G.; Falsen, E. Corynebacterium caspium sp. nov., from a Caspian seal (Phoca caspica). Int. J. Syst. Evol. Microbiol. 2004, 54, 925–928. [Google Scholar] [CrossRef] [PubMed]
  63. Chapartegui-González, I.; Fernández-Martínez, M.; Rodríguez-Fernández, A.; Rocha, D.J.P.; Aguiar, E.R.G.R.; Pacheco, L.G.C.; Ramos-Vivas, J.; Calvo, J.; Martínez-Martínez, L.; Navas, J. Antimicrobial Susceptibility and Characterization of Resistance Mechanisms of Corynebacteriumurealyticum Clinical Isolates. Antibiotics 2020, 9, 404. [Google Scholar] [CrossRef] [PubMed]
  64. Ramsey, M.M.; Freire, M.O.; Gabrilska, R.A.; Rumbaugh, K.P.; Lemon, K.P. Staphylococcus aureus Shifts toward Commensalism in Response to Corynebacterium Species. Front. Microbiol. 2016, 7, 1230. [Google Scholar] [CrossRef] [Green Version]
  65. La Reau, A.J.; Meier-Kolthoff, J.P.; Suen, G. Sequence-based analysis of the genus Ruminococcus resolves its phylogeny and reveals strong host association. Microb. Genomics 2016, 2, e000099. [Google Scholar] [CrossRef] [PubMed]
  66. Khoruts, A.; Sadowsky, M.J. Understanding the mechanisms of faecal microbiota transplantation. Nat. Rev. Gastroenterol. Hepatol. 2016, 13, 508–516. [Google Scholar] [CrossRef] [PubMed] [Green Version]
  67. Vacca, M.; Celano, G.; Calabrese, F.M.; Portincasa, P.; Gobbetti, M.; De Angelis, M. The Controversial Role of Human Gut Lachnospiraceae. Microorganisms 2020, 8, 573. [Google Scholar] [CrossRef] [PubMed]
  68. Muñoz, M.; Guerrero-Araya, E.; Cortés-Tapia, C.; Plaza-Garrido, Á.; Lawley, T.D.; Paredes-Sabja, D. Comprehensive genome analyses of Sellimonas intestinalis, a potential biomarker of homeostasis gut recovery. bioRxiv 2020, 6, 12. [Google Scholar] [CrossRef]
  69. De Vos, W.M. Systems solutions by lactic acid bacteria: From paradigms to practice. Microb. Cell Fact. 2011, 10, 1–13. [Google Scholar] [CrossRef] [Green Version]
  70. Haberecht, S.; Bajagai, Y.S.; Moore, R.J.; Van, T.T.H.; Stanley, D. Poultry feeds carry diverse microbial communities that influence chicken intestinal microbiota colonisation and maturation. AMB Express 2020, 10, 1–10. [Google Scholar] [CrossRef]
  71. Baqi, M.; Mazzulli, T. Oligella infections: Case report and review of the literature. Can. J. Infect. Dis. 1996, 7, 377. [Google Scholar] [CrossRef] [Green Version]
Figure 1. Principal coordinate analysis (PCoA) based on Bray–Curtis dissimilarity matrix on samples: (A) ordination of sampling places (JC, JM, and CC); (B) ordination of BW groups. Significance was examined with permutational multivariate analysis of variance (PERMANOVA) performed with 999 permutations. The differences were considered significant at a level of p < 0.05. (C) Canonical correspondence analysis (CCA) of gut microbiota clustering according to sample sites and (D) BW groups. Legend: JC—jejunum chymus in green; JM—jejunum mucosa in blue; CC—caecum chymus in red; LBW—low body weight; HBW—high body weight.
Animals 12 01296 g001
Figure 2. Co-occurrence patterns in the sampling places and changes in different body weights. (A) Genus correlations in jejunum chymus LBW; (B) jejunum chymus HBW; (C,D) jejunum mucosa LBW groups. (E,F) Jejunum chymus-jejunum mucosa connection in the LBW group.
Animals 12 01296 g002
Table 1. Diversity indices of the intestinal microbiota of broiler chickens.
SPBWDiversity Indices (Mean)
OTUChao1ShannonSimpsonPD
JCLBW1051062.860.7138.0
HBW1221223.170.7241.8
JMLBW3453465.110.82101.6
HBW3603616.450.97109.2
CCLBW3623636.100.96397.9
HBW3503515.980.95597.5
JC 111 b111 b2.08 b0.71 b39.9 b
JM 345 a346 a3.97 a0.89 a105.4 a
CC 355 a357 a4.18 a0.96 a97.7 a
LBW 2692703.240.8379.2
HBW 2722723.590.8882.9
Pooled SEM 23.6723.740.310.036.25
p-ValuesSP<0.001<0.001<0.001<0.001<0.001
BW0.7790.7800.1620.2560.589
SP × BW0.8600.8630.2470.3110.891
a,b Means in the same column with different letters differ significantly (p < 0.05). Legend: JC—jejunum chymus; JM—jejunum mucosa; CC—caecum chymus; OTU—operational taxonomic unit; PD—phylogenetic distance (whole tree).
Table 2. Relative abundance of bacterial phyla in the different sampling places of broiler chickens as affected by BW (%).
Body
Weight
Sampling PlaceMean (BW)FDR p-Values
Jejunal ChymusJejunal MucosaCaecum ChymusSPBWSP × BW
ActinobacteriaLBW2.541.550.381.490.1880.8980.681
HBW4.400.460.171.67
Mean (SP)3.471.000.28
BacteroidetesLBW0.3820.83 B45.2522.15 B<0.0010.0290.109
HBW1.1839.99 A51.6130.93 A
Mean (SP)0.78 c30.41 b48.43 a
CyanobacteriaLBW4.820.470.051.780.1630.9900.878
HBW3.761.470.061.76
Mean (SP)4.290.970.06
Deinococcus ThermusLBW0.040.020.000.020.4060.5320.843
HBW0.020.000.000.01
Mean (SP)0.030.010.00
EpsilonbacteraeotaLBW0.000.000.000.000.5670.5250.580
HBW0.010.110.000.04
Mean (SP)0.010.060.00
FirmicutesLBW88.1674.76 A51.7771.57 A<0.0010.053 T0.532
HBW76.6754.78 B46.9259.46 B
Mean (SP)82.42 a64.77 b49.35 c
PatescibacteriaLBW0.250.050.000.10.5300.5300.559
HBW4.030.120.001.38
Mean (SP)2.140.090.00
ProteobacteriaLBW3.782.252.392.810.0450.3990.170
HBW9.882.720.984.53
Mean (SP)6.83 a2.48 b1.68 b
TenericutesLBW0.010.08 B0.15 B0.08 B0.056 T0.068 T0.406
HBW0.050.34 A0.25 A0.21 A
Mean (SP)0.03 b0.21 a0.20 a
B/F RatioLBW0.000.32 B0.890.40 B<0.0010.0290.188
HBW0.020.76 A1.130.64 A
Mean (SP)0.01 c0.54 b1.01 a
Bacterial phylum differences between groups were assessed using a two-way ANOVA test, with Benjamini–Hochberg false discovery rate (FDR) correction. FDR-corrected p-values below 0.05 were considered as significant and results between 0.05 and 0.1 (0.05 < p < 0.10) were considered a trend (T). Body weight (BW) effects at each sampling place (SP) were also examined with a one-way ANOVA test and the significance of Tukey’s HSD post hoc test was indicated at p < 0.05. a,b,c: values within the mean (SP) rows with different lowercase letters were significantly different (p < 0.05). A,B: values within the mean columns with different capital letter superscripts were significantly different (p < 0.05).
Table 3. Relative abundance of important bacterial genera in the different sampling places of broiler chickens as affected by BW (%).
GenusBody
Weight
Sampling PlaceMean (BW)FDR p-Values
Jejunal ChymusJejunal MucosaCaecum ChymusSPBWSP × BW
AlistipesLBW0.000.640.82 B0.48 B 0.451
HBW0.031.712.48 A1.41 A 0.081 T
Mean (SP)0.01 b1.17 a1.65 a 0.017
BacteroidesLBW0.1119.06 B42.3920.52 B 0.280
HBW0.7634.28 A46.2727.10 A 0.098 T
Mean (SP)0.43 c26.67 b44.33 a 0.000
EnterococcusLBW0.02 B0.030.000.02 B 0.001
HBW0.22 A0.020.000.08 A 0.012
Mean (SP)0.123 a0.025 b0.002 b 0.000
Ruminococcaceae
UCG-010
LBW0.000.09 B0.190.09 B 0.472
HBW0.000.24 A0.290.18 A 0.083 T
Mean (SP)0.00 b0.17 a0.24 a 0.000
Ruminococcaceae
UCG-013
LBW0.010.090.39 A0.17 A 0.026
HBW0.010.060.18 B0.08 B 0.020
Mean (SP)0.010 b0.078 b0.285 a 0.000
Bacterial genera differences between groups were assessed using a two-way ANOVA test, with Benjamini–Hochberg false discovery rate (FDR) correction. FDR-corrected p-values below 0.05 were considered as significant and results between 0.05 and 0.1 (0.05 < p < 0.10) were considered a trend (T). Body weight (BW) effects at each sampling place (SP) were also examined with a one-way ANOVA test and the significance of Tukey’s HSD post hoc test was indicated at p < 0.05. a,b,c: values within the mean (SP) rows with different lowercase letters were significantly different (p < 0.05). A,B: values within the mean columns with different capital letter superscripts were significantly different (p < 0.05).
Publisher’s Note: MDPI stays neutral with regard to jurisdictional claims in published maps and institutional affiliations.

