
A Co-Culture Model of IPEC-J2 and Swine PBMC to Study the Responsiveness of Intestinal Epithelial Cells: The Regulatory Effect of Arginine Deprivation

 , , , , , ,
  and
and
Abstract
Simple Summary
Abstract
1. Introduction
2. Materials and Methods
2.1. Reagents
2.2. Cell Cultures and Culture Conditions
2.3. Transwell Co-Culture Conditions
- IPEC-J2 monoculture in DMEM/Ham’s F-12 medium, containing arginine (IPEC);
- IPEC-J2 monoculture in DMEM/Ham’s F-12 without arginine (IPEC/–Arg);
- IPEC-J2 co-culture with PBMC in DMEM/Ham’s F-12, containing arginine (IPEC+PBMC);
- IPEC-J2 co-culture with PBMC in DMEM/Ham’s F-12 without arginine (IPEC+PBMC/–Arg).
- 5.
- PBMC monoculture in DMEM/Ham’s F-12, containing arginine (PBMC);
- 6.
- PBMC monoculture in DMEM/Ham’s F-12 without arginine (PBMC/–Arg).
2.4. Nitric Oxide Assay
2.5. RNA Extraction and Reverse Transcription (RT)
2.6. Real-Time PCR
2.7. Statistical Analysis
3. Results
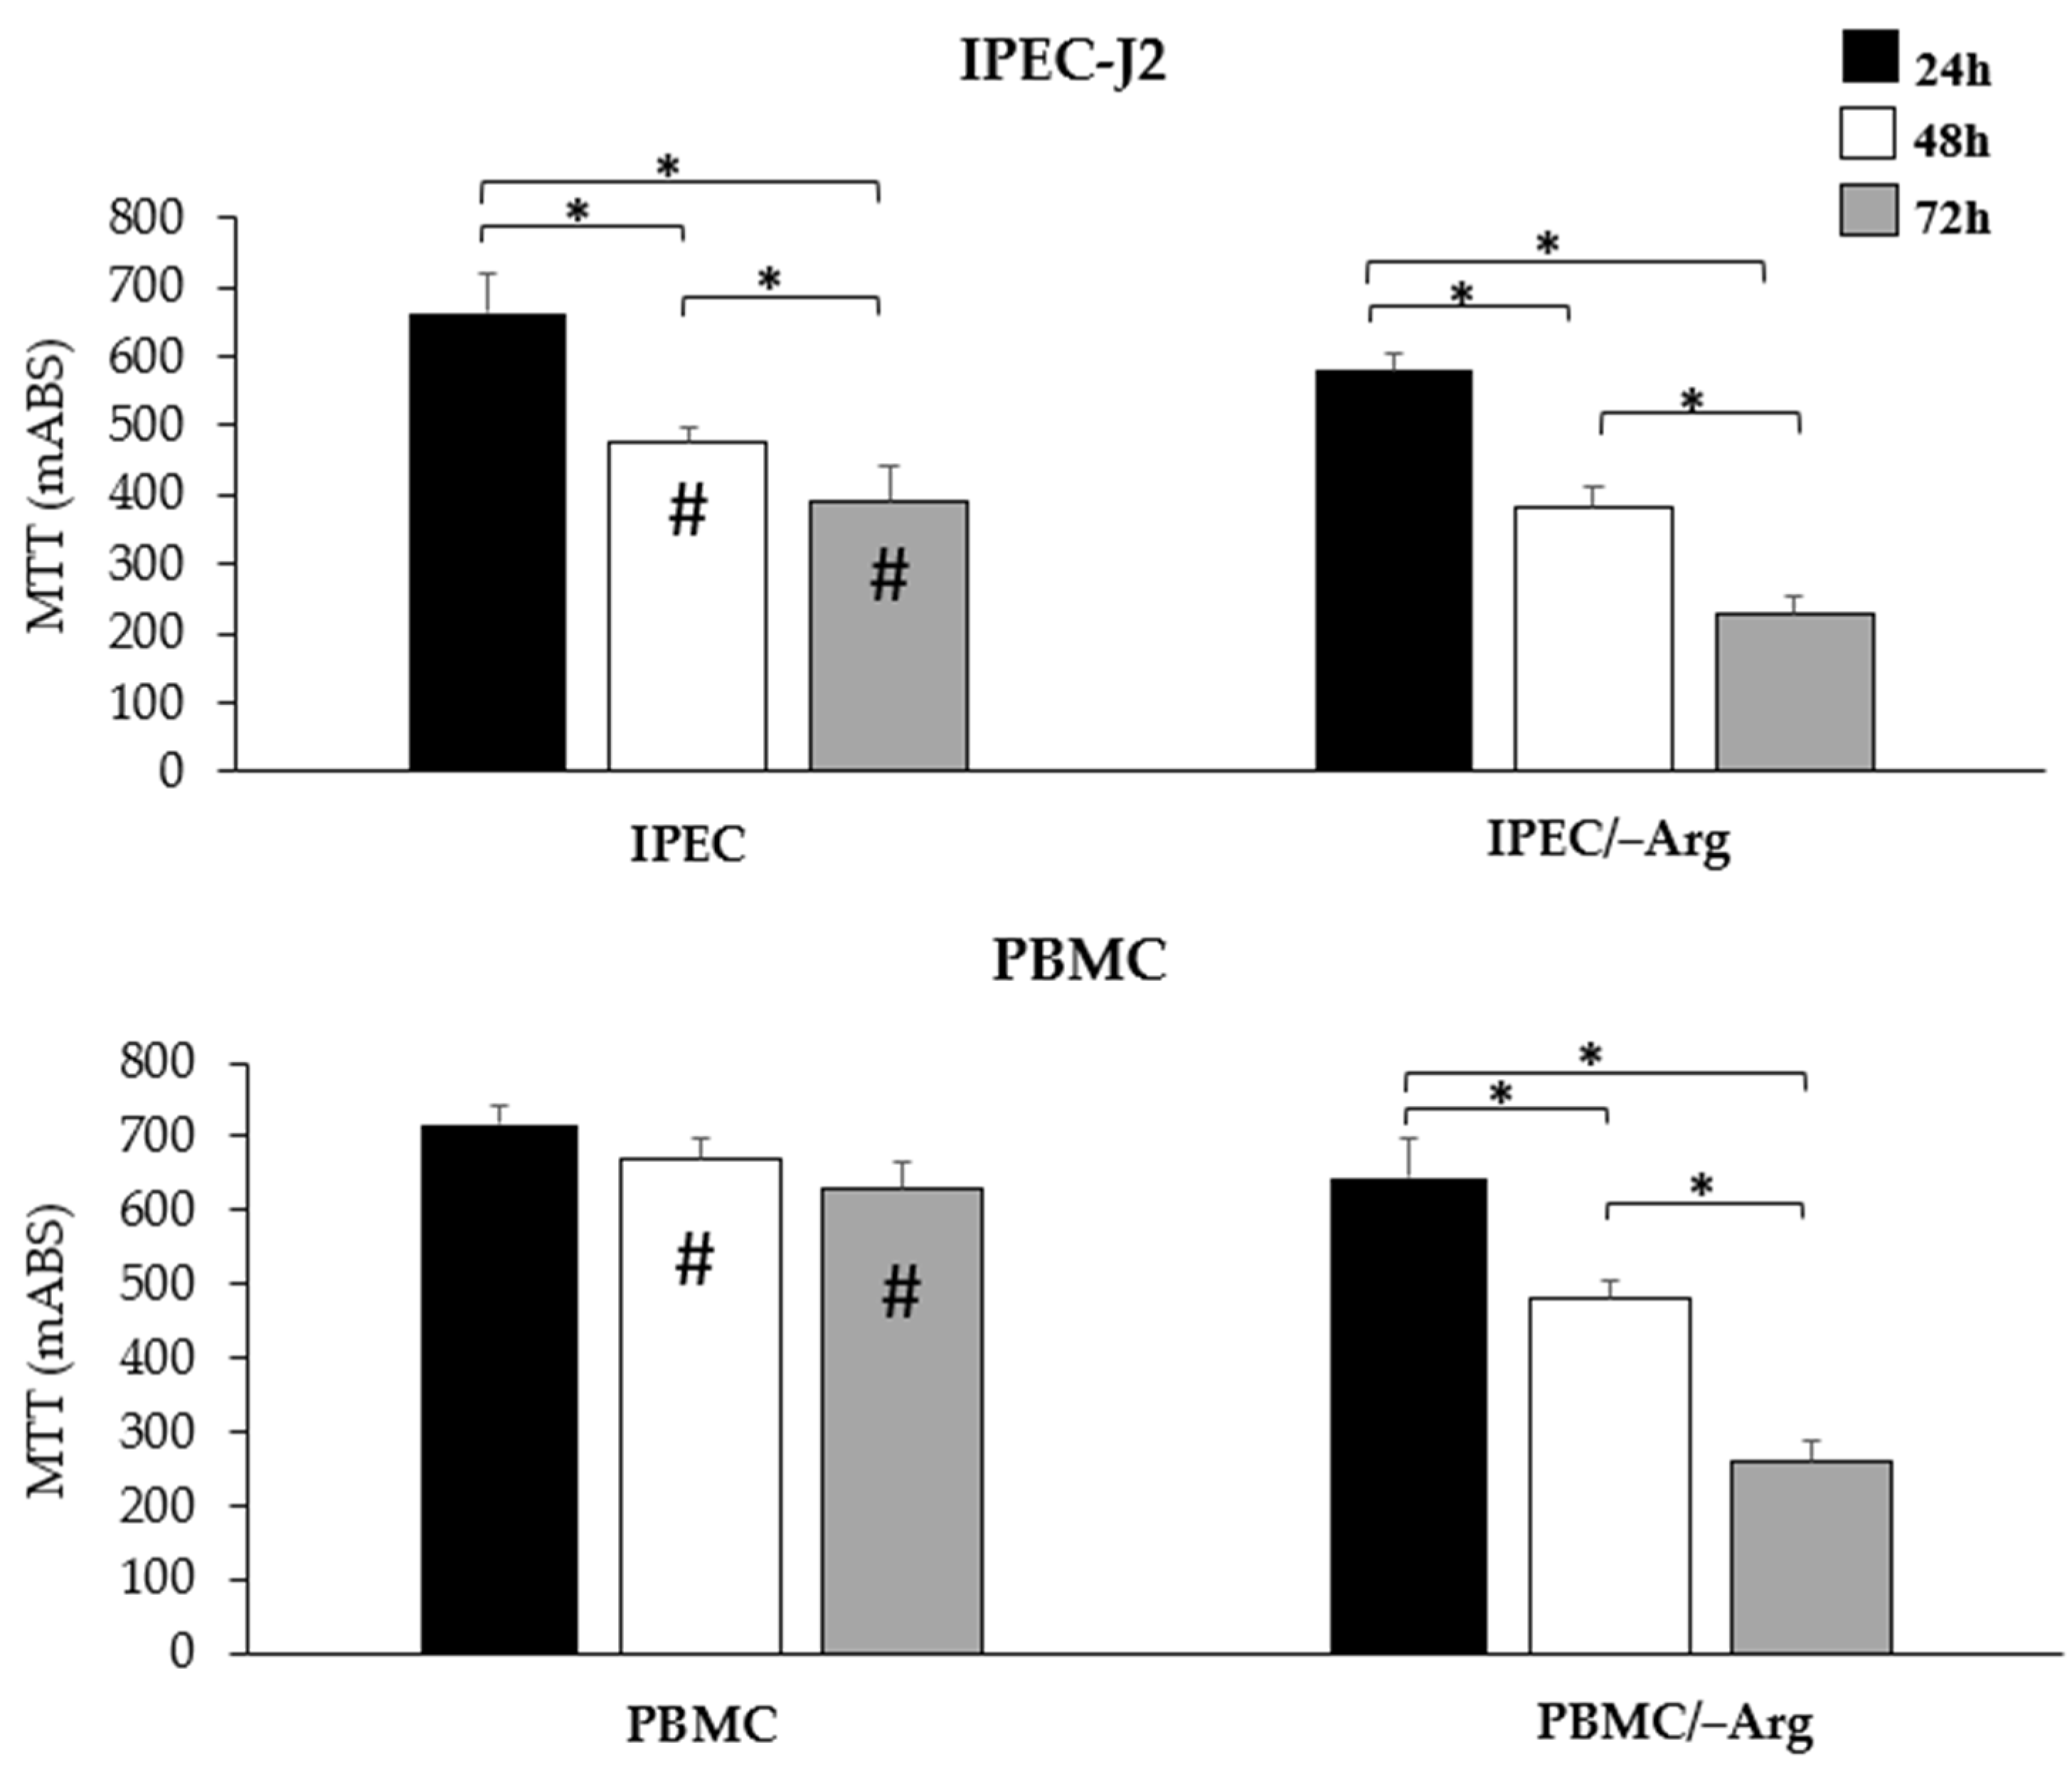
3.1. Cell Viability
3.2. Nitric Oxide Accumulation
3.3. Gene Expression
3.3.1. Cationic Amino Acid Transporter-1 (CAT-1)
3.3.2. Tumour Necrosis Factor-α (TNF-α)
3.3.3. Interleukin-1α (IL-1α)
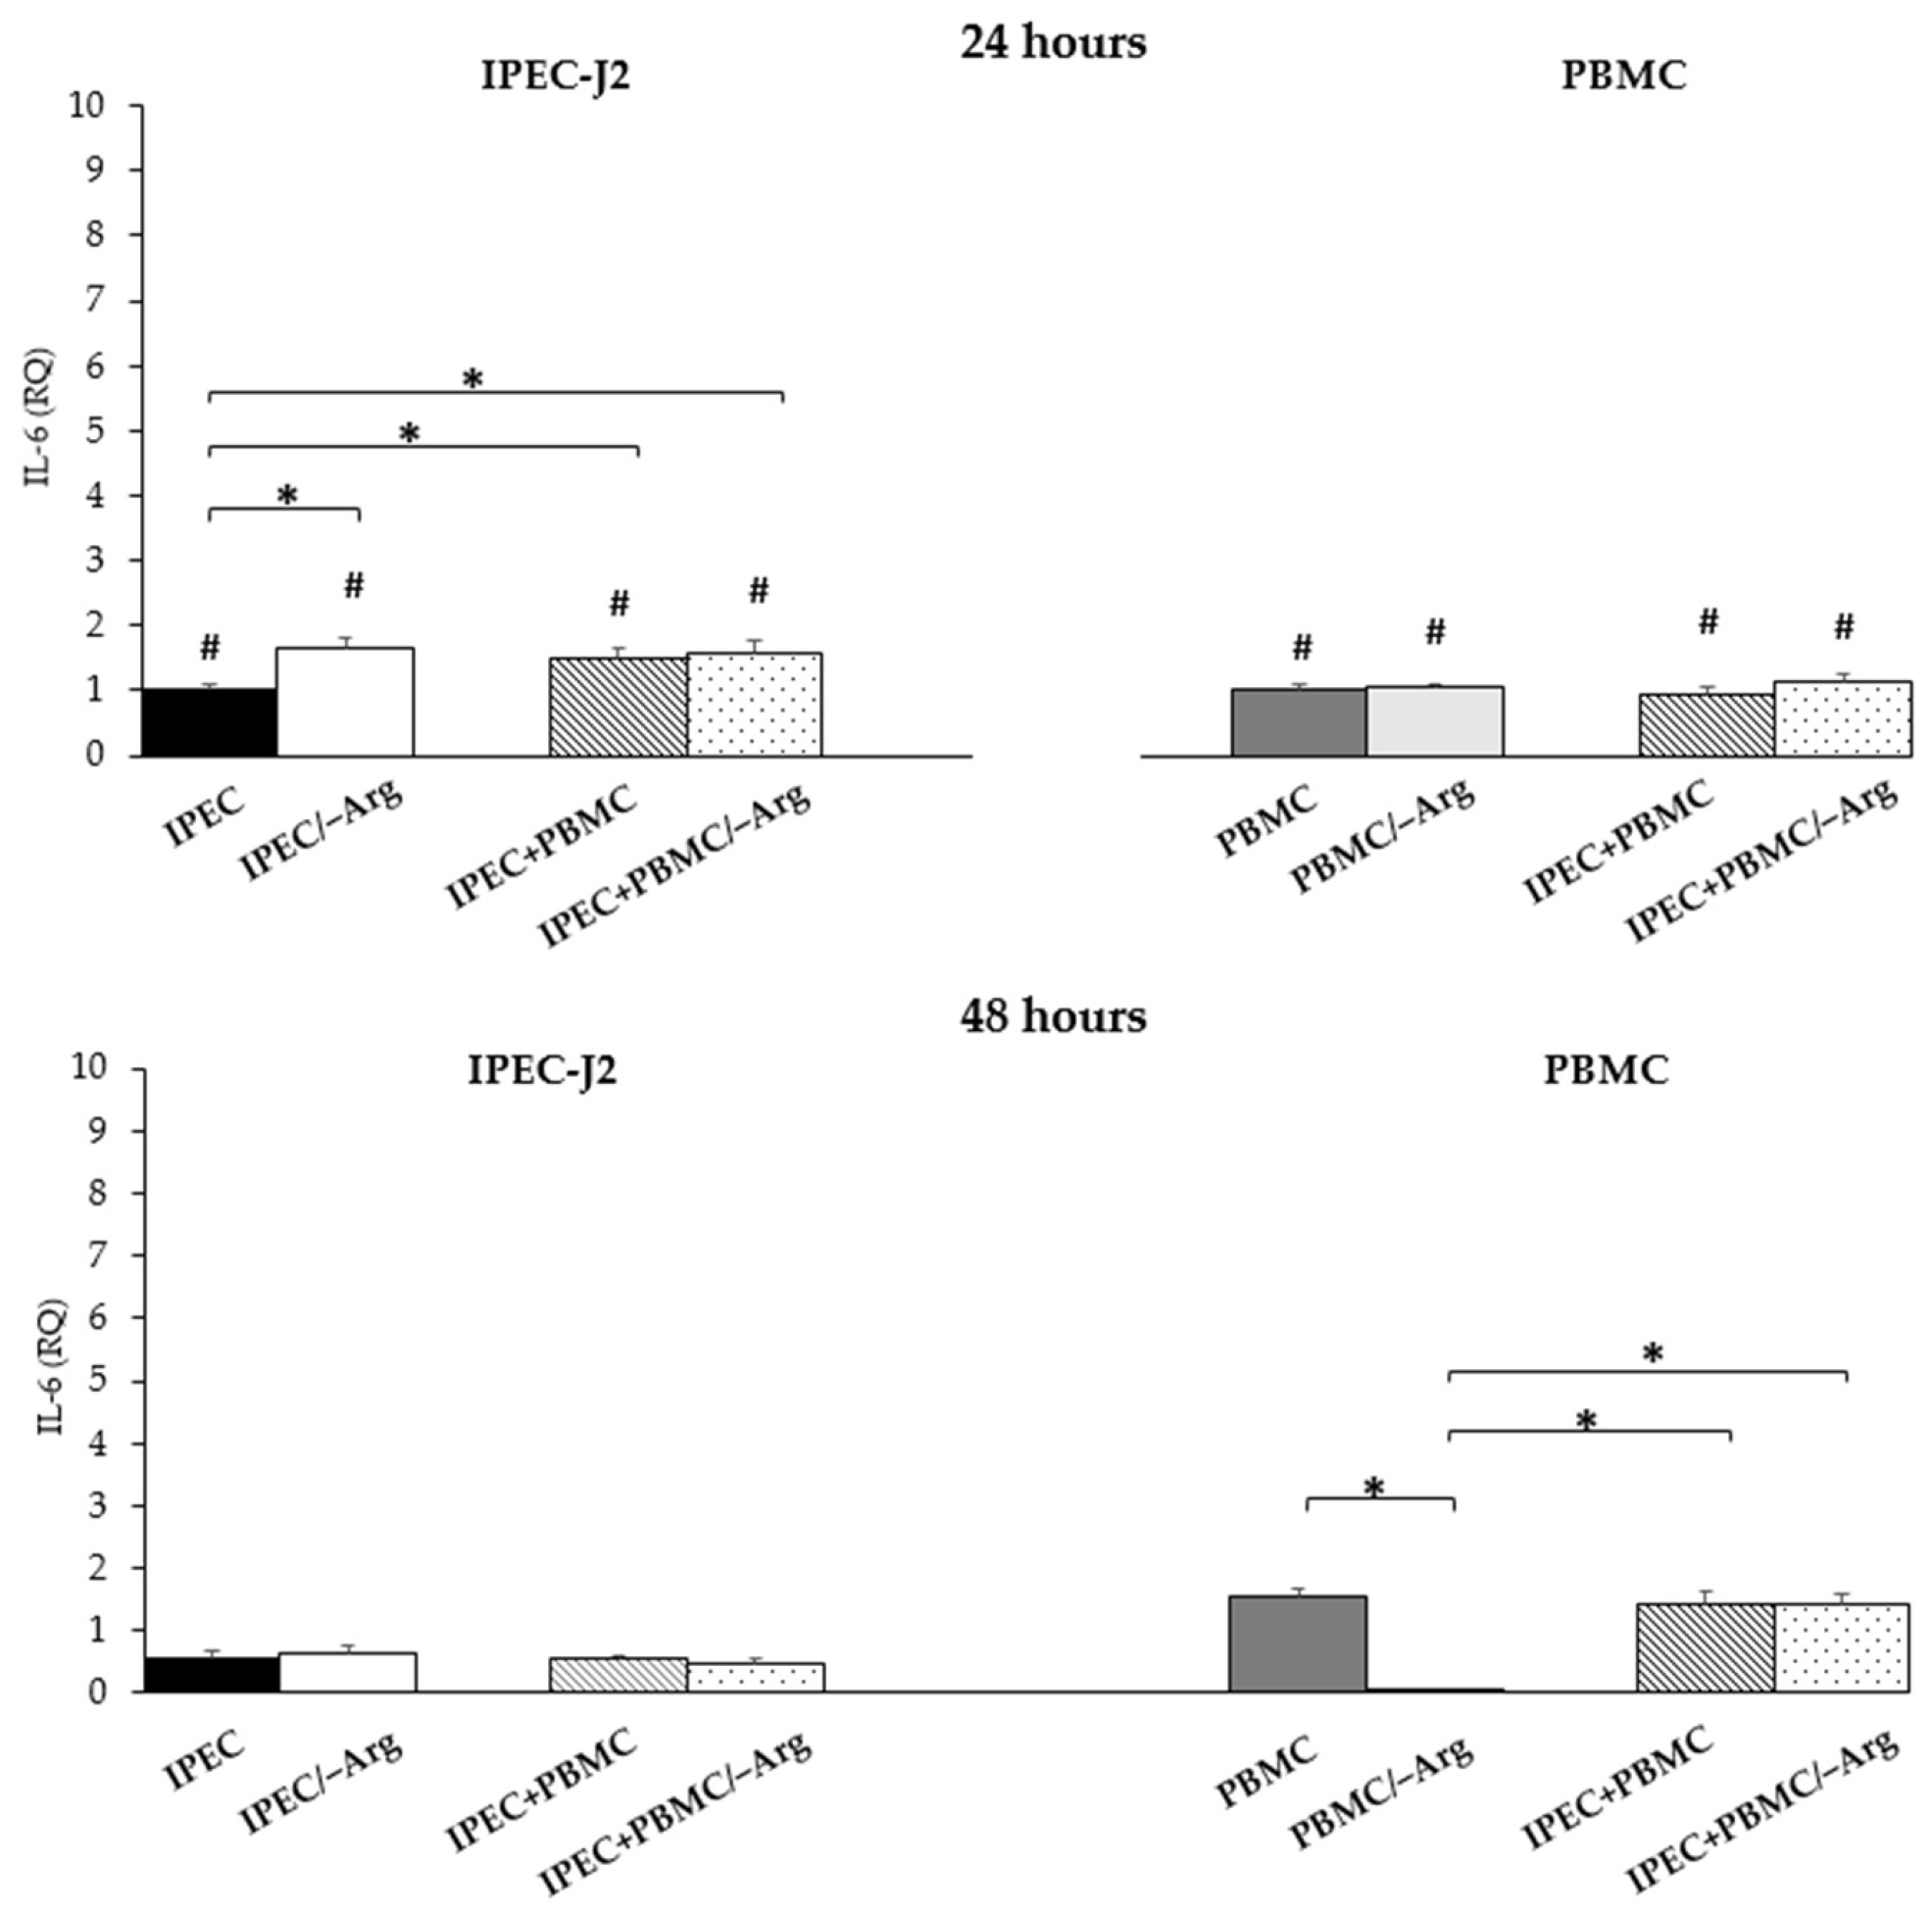
3.3.4. Interleukin-6 (IL-6)
3.3.5. Interleukin-8 (IL-8)
3.3.6. Transforming Growth Factor-β (TGF-β)
4. Discussion
5. Conclusions
- arginine deficiency strongly influences IECs and stimulates their functional response;
- the IPEC-J2/PBMC co-culture model is functional to elucidate the interaction between IEC and immune cells;
- in order to better characterize this model, it will be necessary to investigate how gene expression is associated/correlated with the secretion of these and other mediators involved in the cross-talk between intestinal cells and immune cells.
Author Contributions
Funding
Institutional Review Board Statement
Data Availability Statement
Conflicts of Interest
References
- Chelakkot, C.; Ghim, J.; Ryu, S.H. Mechanisms regulating intestinal barrier integrity and its pathological implications. Exp. Mol. Med. 2018, 16, 1–9. [Google Scholar] [CrossRef] [PubMed]
- Suzuki, T. Regulation of intestinal epithelial permeability by tight junctions. Cell. Mol. Life Sci. 2013, 70, 631–659. [Google Scholar] [CrossRef]
- Peterson, L.W.; Artis, D. Intestinal epithelial cells: Regulators of barrier function and immune homeostasis. Nat. Rev. Immunol. 2014, 14, 141–153. [Google Scholar] [CrossRef]
- Pluske, J.R.; Turpin, D.L.; Kim, J.C. Gastrointestinal tract (gut) health in the young pig. Anim. Nutr. 2018, 4, 187–196. [Google Scholar] [CrossRef]
- Soderholm, A.T.; Pedicord, V.A. Intestinal epithelial cells: At the interface of the microbiota and mucosal immunity. Immunology 2019, 158, 267–280. [Google Scholar] [CrossRef] [PubMed]
- Coombes, J.L.; Powrie, F. Dendritic cells in intestinal immune regulation. Nat. Rev. Immunol. 2008, 8, 435–446. [Google Scholar] [CrossRef] [PubMed]
- Reyer, H.; Oster, M.; Magowan, E.; Muráni, E.; Sauerwein, H.; Dannenberger, D.; Kuhla, B.; Ponsuksili, S.; Wimmers, K. Feed-efficient pigs exhibit molecular patterns allowing a timely circulation of hormones and nutrients. Physiol. Genom. 2018, 50, 726–734. [Google Scholar] [CrossRef] [PubMed]
- Knecht, D.; Cholewińska, P.; Jankowska-Mąkosa, A.; Katarzyna Czyż, K. Development of swine’s digestive tract microbiota and its relation to production indices—A review. Animals 2020, 10, 527. [Google Scholar] [CrossRef]
- Val-Laillet, D. Review: Impact of food, gut-brain signals and metabolic status on brain activity in the pig model: 10 Years of nutrition research using in vivo brain imaging. Animal 2019, 13, 2699–2713. [Google Scholar] [CrossRef]
- Lyte, J.M.; Lyte, M. Review: Microbial endocrinology: Intersection of microbiology and neurobiology matters to swine health from infection to behavior. Animal 2019, 13, 2689–2698. [Google Scholar] [CrossRef]
- Kong, S.; Zhang, Y.H.; Zhang, W. Regulation of intestinal epithelial cells properties and functions by amino acids. Biomed Res. Int. 2018, 9, 2819154. [Google Scholar] [CrossRef] [PubMed]
- Zheng, P.; Yu, B.; He, J.; Yu, J.; Mao, X.; Luo, Y.; Luo, J.; Huang, Z.; Tian, G.; Zeng, Q.; et al. Arginine metabolism and its protective effects on intestinal health and functions in weaned piglets under oxidative stress induced by diquat. Br. J. Nutr. 2017, 117, 1495–1502. [Google Scholar] [CrossRef] [PubMed]
- Zhu, H.L.; Liu, Y.L.; Xie, X.L.; Huang, J.J.; Hou, Y.Q. Effect of L-arginine on intestinal mucosal immune barrier function in weaned pigs after Escherichia coli LPS challenge. Innate Immun. 2013, 19, 242–252. [Google Scholar] [CrossRef]
- Wu, G.; Bazer, F.W.; Davis, T.A.; Jaeger, L.A.; Johnson, G.A.; Kim, S.W.; Knabe, D.A.; Meininger, C.J.; Spencer, T.E.; Yin, Y.L. Important roles for the arginine family of amino acids in swine nutrition and production. Livest. Sci. 2007, 112, 8–22. [Google Scholar] [CrossRef]
- Schierack, P.; Nordhoff, M.; Pollmann, M.; Weyrauch, K.D.; Amasheh, S.; Lodemann, U.; Jores, J.; Tachu, B.; Kleta, S.; Blikslager, A.; et al. Characterization of a porcine intestinal epithelial cell line for in vitro studies of microbial pathogenesis in swine. Histochem. Cell Biol. 2006, 125, 293–305. [Google Scholar] [CrossRef]
- Erkens, T.; Van Poucke, M.; Vandesompele, J.; Goossens, K.; Van Zeveren, A.; Peelman, L.J. Development of a new set of reference genes for normalization of real-time RT-PCR data of porcine backfat and longissimus dorsi muscle, and evaluation with PPARGC1A. BMC Biotechnol. 2006, 6, 41. [Google Scholar] [CrossRef]
- Støy, A.C.F.; Heegaard, P.M.H.; Sangild, P.T.; Østergaard, M.V.; Skovgaard, K. Gene expression analysis of the IPEC-J2 cell line: A simple model for the inflammation-sensitive preterm intestine. ISRN Genom. 2013, 2013, 980651. [Google Scholar] [CrossRef][Green Version]
- Wang, S.; Wang, B.; He, H.; Sun, A.; Guo, C. A new set of reference housekeeping genes for the normalization RT-qPCR data from the intestine of piglets during weaning. PLoS ONE 2018, 13, e0204583. [Google Scholar] [CrossRef]
- Facci, M.R.; Auray, G.; Meurens, F.; Buchanan, R.; van Kessel, J.; Gerdts, V. Stability of expression of reference genes in porcine peripheral blood mononuclear and dendritic cells. Vet. Immunol. Immunopathol. 2011, 141, 11–15. [Google Scholar] [CrossRef]
- Ferrari, L.; Martelli, P.; Saleri, R.; De Angelis, E.; Cavalli, V.; Bresaola, M.; Benetti, M.; Borghetti, P. Lymphocyte activation as cytokine gene expression and secretion is related to the porcine reproductive and respiratory syndrome virus (PRRSV) isolate after in vitro homologous and heterologous recall of peripheral blood mononuclear cells (PBMC) from pigs vaccinated and exposed to natural infection. Vet. Immunol. Immunopathol. 2013, 151, 193–206. [Google Scholar] [PubMed]
- Livak, K.J.; Schmittgen, T.D. Analysis of relative gene expression data using real-time quantitative PCR and the 2−ΔΔCT Method. Methods 2001, 25, 402–408. [Google Scholar] [CrossRef]
- Xia, L.; Dai, L.; Yang, Q. Transmissible gastroenteritis virus infection decreases arginine uptake by downregulating CAT-1 expression. Vet. Res. 2018, 49, 95–103. [Google Scholar] [CrossRef]
- Grenier, B.; Loureiro-Bracarense, A.P.; Lucioli, J.; Drociunas Pacheco, G.; Cossalter, A.M.; Moll, W.D.; Schatzmayr, G.; Oswald, I.P. Individual and combined effects of subclinical doses of deoxynivalenol and fumonisins in piglets. Mol. Nutr. Food Res. 2011, 55, 761–771. [Google Scholar] [CrossRef] [PubMed]
- Meissonnier, G.M.; Pinton, P.; Laffitte, J.; Cossalter, A.M.; Gong, Y.Y.; Wild, C.P.; Bertin, G.; Galtier, P.; Oswald, I.P. Immunotoxicity of aflatoxin B1: Impairment of the cell-mediated response to vaccine antigen and modulation of cytokine expression. Toxicol. Appl. Pharmacol. 2008, 231, 142–149. [Google Scholar] [CrossRef]
- Mastrogiovanni, F.; Mukhopadhya, A.; Lacetera, N.; Ryan, M.T.; Romani, A.; Bernini, R.; Sweeney, T. Anti-inflammatory effects of pomegranate peel extracts on in vitro human intestinal Caco-2 cells and ex vivo porcine colonic tissue explants. Nutrients 2019, 11, 548. [Google Scholar] [CrossRef]
- Mariani, V.; Palermo, S.; Fiorentini, S.; Lanubile, A.; Giuffra, E. Gene expression study of two widely used pig intestinal epithelial cell lines: IPEC-J2 and IPI-2I. Vet. Immunol. Immunopathol. 2009, 131, 278–284. [Google Scholar] [CrossRef]
- Oswald, I.P. Role of intestinal epithelial cells in the innate immune defence of the pig intestine. Vet. Res. 2006, 37, 359–368. [Google Scholar] [CrossRef] [PubMed]
- Ruth, M.R.; Field, C.J. The immune modifying effects of amino acids on gut-associated lymphoid tissue. J. Anim. Sci. Biotechnol. 2013, 4, 27–37. [Google Scholar] [CrossRef] [PubMed]
- Delgado, R.; Abad-Guamán, R.; Nicodemus, N.; Diaz-Perales, A.; García, J.; Carabaño, R.; Menoyo, D. Effect of pre- and post-weaning dietary supplementation with arginine and glutamine on rabbit performance and intestinal health. BMC Vet. Res. 2019, 15, 199–211. [Google Scholar] [CrossRef] [PubMed]
- Zhang, B.; Lv, Z.; Li, Z.; Wang, W.; Li, G.; Guo, Y. Dietary l-arginine supplementation alleviates the intestinal injury and modulates the gut microbiota in broiler chickens challenged by clostridium perfringens. Front. Microbiol. 2018, 9, 1716–1729. [Google Scholar] [CrossRef]
- Tan, B.; Li, X.G.; Kong, X.; Huang, R.; Ruan, Z.; Yao, K.; Deng, Z.; Xie, M.; Shinzato, I.; Yin, Y.; et al. Dietary L-arginine supplementation enhances the immune status in early-weaned piglets. Amino Acids 2009, 37, 323–331. [Google Scholar] [CrossRef] [PubMed]
- Zhu, L.H.; Xu, J.X.; Zhu, S.W.; Cai, X.; Yang, S.F.; Chen, X.L.; Guo, Q. Gene expression profiling analysis reveals weaning-induced cell cycle arrest and apoptosis in the small intestine of pigs. J. Anim. Sci. 2014, 92, 996–1006. [Google Scholar] [CrossRef]
- Wu, M.; Xiao, H.; Shao, F.; Tan, B.; Hu, S. Arginine accelerates intestinal health through cytokines and intestinal microbiota. Int. Immunopharmacol. 2020, 81, 106029–106030. [Google Scholar] [CrossRef]
- Wu, G.; Knabe, D.A.; Kim, S.W. Arginine nutrition in neonatal pigs. J. Nutr. 2004, 134, 2783S–2790S. [Google Scholar] [CrossRef]
- Bauchart-Thevret, C.; Cui, L.; Wu, G.; Burrin, D.G. Arginine-induced stimulation of protein synthesis and survival in IPEC-J2 cells is mediated by mTOR but not nitric oxide. Am. J. Physiol. Endocrinol. Metab. 2010, 299, E899–E909. [Google Scholar] [CrossRef] [PubMed]
- Mann, G.E.; Yudilevich, D.L.; Sobrevia, L. Regulation of amino acid and glucose transporters in endothelial and smooth muscle cells. Physiol. Rev. 2003, 83, 183–252. [Google Scholar] [CrossRef] [PubMed]
- Wu, G.; Morris, S.M., Jr. Arginine metabolism: Nitric oxide and beyond. Biochem. J. 1998, 336, 1–17. [Google Scholar] [CrossRef] [PubMed]
- Blachier, F.; Boutry, C.; Bos, C.; Tomé, D. Metabolism and functions of L-glutamate in the epithelial cells of the small and large intestines. Am. J. Clin. Nutr. 2009, 90, 814S–821S. [Google Scholar] [CrossRef] [PubMed]
- Bredt, D.S. Endogenous nitric oxide synthesis: Biological functions and pathophysiology. Free Radic. Res. 1999, 31, 577–596. [Google Scholar] [CrossRef] [PubMed]
- Geiger, R.; Rieckmann, J.C.; Wolf, T.; Basso, C.; Feng, Y.; Fuhrer, T.; Kogadeeva, M.; Picotti, P.; Meissner, F.; Mann, M.; et al. L-Arginine modulates T cell metabolism and enhances survival and anti-tumor activity. Cell 2016, 167, 829–842. [Google Scholar] [CrossRef]
- Okumura, R.; Takeda, K. Roles of intestinal epithelial cells in the maintenance of gut homeostasis. Exp. Mol. Med. 2017, 49, e338–e346. [Google Scholar] [CrossRef] [PubMed]
- Chowers, Y.; Cahalon, L.; Lahav, M.; Schor, H.; Tal, R.; Bar-Meir, S.; Levite, M. Somatostatin through its specific receptor inhibits spontaneous and TNF-alpha- and bacteria-induced IL-8 and IL-1 beta secretion from intestinal epithelial cells. J. Immunol. 2000, 165, 2955–2961. [Google Scholar] [CrossRef]
- Waters, J.P.; Pober, J.S.; Bradley, J.R. Tumour necrosis factor in infectious disease. J. Pathol. 2013, 230, 132–147. [Google Scholar] [CrossRef]
- Wallach, D.; Kang, T.B.; Kovalenko, A. Concepts of tissue injury and cell death in inflammation: A historical perspective. Nat. Rev. Immunol. 2014, 14, 51–59. [Google Scholar] [CrossRef] [PubMed]
- Leppkes, M.; Roulis, M.; Neurath, M.F.; Kollias, G.; Becker, C. Pleiotropic functions of TNF-α in the regulation of the intestinal epithelial response to inflammation. Int. Immunol. 2014, 26, 509–515. [Google Scholar] [CrossRef]
- Mizoguchi, E.; Mizoguchi, A.; Takedatsu, H.; Cario, E.; de Jong, Y.P.; Ooi, C.J.; Xavier, R.J.; Terhorst, C.; Podolsky, D.K.; Bhan, A.K. Role of tumor necrosis factor receptor 2 (TNFR2) in colonic epithelial hyperplasia and chronic intestinal inflammation in mice. Gastroenterology 2002, 122, 134–144. [Google Scholar] [CrossRef]
- Tan, B.; Yin, Y.L.; Kong, X.F.; Li, P.; Li, X.; Gao, H.; Li, X.; Huang, R.; Wu, G. L-Arginine stimulates proliferation and prevents endotoxin-induced death of intestinal cells. Amino Acids 2010, 38, 1227–1235. [Google Scholar] [CrossRef] [PubMed]
- Xia, M.; Ye, L.; Hou, Q.; Yu, Q. Effects of arginine on intestinal epithelial cell integrity and nutrient uptake. Brit. J. Nutr. 2016, 116, 1675–1681. [Google Scholar] [CrossRef]
- Caldwell, A.B.; Cheng, Z.; Vargas, J.D.; Birnbaum, H.A.; Hoffmann, A. Network dynamics determine the autocrine and paracrine signalling functions of TNF. Genes Dev. 2014, 28, 2120–2133. [Google Scholar] [CrossRef]
- Kim, B.; Lee, Y.; Kim, E.; Kwak, A.; Ryoo, S.; Bae, S.H.; Azam, T.; Kim, S.; Dinarello, C.A. The interleukin-1α precursor is biologically active and is likely a key alarmin in the IL-1 family of cytokines. Front. Immunol. 2013, 4, 391–399. [Google Scholar] [CrossRef] [PubMed]
- Cohen, I.; Rider, P.; Carmi, Y.; Braiman, A.; Dotan, S.; White, M.R.; Voronov, E.; Martin, M.U.; Dinarello, C.A.; Apte, R.N. Differential release of chromatin-bound IL-1alpha discriminates between necrotic and apoptotic cell death by the ability to induce sterile inflammation. Proc. Natl. Acad. Sci. USA 2010, 107, 2574–2579. [Google Scholar] [CrossRef]
- Tanaka, T.; Narazaki, M.; Kishimoto, T. IL-6 in inflammation, immunity, and disease. Cold Spring Harb. Perspect. Biol. 2014, 6, a016295. [Google Scholar] [CrossRef]
- Murakami, M.; Kamimura, D.; Hirano, T. Pleiotropy and Specificity: Insights from the interleukin 6 family of cytokines. Immunity 2019, 50, 812–831. [Google Scholar] [CrossRef]
- Scheller, J.; Chalaris, A.; Schmidt-Arras, D.; Rose-John, S. The pro- and anti-inflammatory properties of the cytokine interleukin-6. Biochim. Biophys. Acta 2011, 1813, 878–888. [Google Scholar] [CrossRef]
- Osawa, Y.; Nagaki, M.; Banno, Y.; Brenner, D.A.; Asano, T.; Nozawa, Y.; Moriwaki, H.; Nakashima, S. Tumor necrosis factor alpha-induced interleukin-8 production via NF-κB and phosphatidylinositol 3-kinase/Akt pathways inhibits cell apoptosis in human hepatocytes. Infect. Immun. 2002, 70, 6294–6301. [Google Scholar] [CrossRef]
- Sonnier, D.I.; Bailey, S.R.; Schuster, R.M.; Lentsch, A.B.; Pritts, T.A. TNF-α induces vectorial secretion of IL-8 in Caco-2 cells. J. Gastrointest. Surg. 2010, 14, 1592–1599. [Google Scholar] [CrossRef]
- Kashiwagi, I.; Morita, R.; Schichita, T.; Komai, K.; Saeki, K.; Matsumoto, M.; Takeda, K.; Nomura, M.; Hayashi, A.; Kanai, T.; et al. Smad2 and Smad3 inversely regulate TGF-β autoinduction in Clostridium butyricum-activated dendritic cells. Immunity 2015, 43, 65–79. [Google Scholar] [CrossRef]
- Bauché, D.; Marie, J.C. Transforming growth factor β: A master regulator of the gut microbiota and immune cell interactions. Clin. Transl. Immunol. 2017, 6, e136–e143. [Google Scholar] [CrossRef]
- Iizuka, M.; Konno, S. Wound healing of intestinal epithelial cells. World J. Gastroenterol. 2011, 17, 2161–2171. [Google Scholar] [CrossRef]
- Yang, X.; Letterio, J.J.; Lechleider, R.J.; Chen, L.; Hayman, R.; Gu, H.; Roberts, A.B.; Deng, C. Targeted disruption of SMAD3 results in impaired mucosal immunity and diminished T cell responsiveness to TGF-beta. EMBO J. 1999, 18, 1280–1291. [Google Scholar] [CrossRef]
- Munoz, N.M.; Upton, M.; Rojas, A.; Washington, M.K.; Lin, L.; Chytil, A.; Sozmen, E.G.; Madison, B.B.; Pozzi, A.; Moon, R.T.; et al. Transforming growth factor beta receptor type II inactivation induces the malignant transformation of intestinal neoplasms initiated by Apc mutation. Cancer Res. 2006, 66, 9837–9844. [Google Scholar] [CrossRef]


| Target Gene | GenBank Accession No | Primer Sequence | [C] (nM) | Efficiency (%) | Slope | r2 | Amplicon Length (bp) |
|---|---|---|---|---|---|---|---|
| CAT-1 [22] | NM_001012613 | F: 5′-AGACGGGCTGCTGTTTAAGT-3′ R: 5′-ACCGTTAAAATACCGGCGTG-3′ | 300 | 100.6 | −3.30 | 0.99 | 131 |
| IL-8 [23] | NM_213867 | F: 5′-CCGTGTCAACATGACTTCCAA-3′ R: 5′-GCCTCACAGAGAGCTGCAGAA-3′ | 300 | 98.9 | −3.29 | 0.99 | 75 |
| IL-6 [24] | NM_214399 | F: 5′-GGCAAAAGGGAAAGAATCCAG-3′ R: 5′-CGTTCTGTGACTGCAGCTTATCC-3′ | 300 | 99.6 | −3.33 | 0.99 | 87 |
| TGF-β1 [25] | NM_214015 | F: 5′-AGGGCTACCATGCCAATTTCT-3′ R: 5′-CCGGGTTGTGCTGGTTGTACA-3′ | 300 | 106.3 | −3.18 | 0.98 | 102 |
| TNF-α [24] | NM_214022 | F: 5′-ACTGCACTTCGAGGTTATCGG-3′ R: 5′-GGCGACGGGCTTATCTGA-3′ | 300 | 98.5 | −3.36 | 0.99 | 118 |
| IL-1α [26] | NM_214029 | F: 5′-GCTCAAAACGAAGACGAACC-3′ R: 5′-TGATGGTTTTGGGTGTCTCA-3′ | 300 | 99.4 | −3.34 | 0.97 | 61 |
| GAPDH (Primer Express) | NM_001206359 | F: 5′-GGTGAAGGTCGGAGTGAACG-3′ R: 5′-GCCAGAGTTAAAAGCAGCCCT-3′ | 300 | 102.0 | −3.27 | 0.99 | 70 |
Publisher’s Note: MDPI stays neutral with regard to jurisdictional claims in published maps and institutional affiliations. |
© 2021 by the authors. Licensee MDPI, Basel, Switzerland. This article is an open access article distributed under the terms and conditions of the Creative Commons Attribution (CC BY) license (https://creativecommons.org/licenses/by/4.0/).
Share and Cite
Saleri, R.; Borghetti, P.; Ravanetti, F.; Andrani, M.; Cavalli, V.; De Angelis, E.; Ferrari, L.; Martelli, P. A Co-Culture Model of IPEC-J2 and Swine PBMC to Study the Responsiveness of Intestinal Epithelial Cells: The Regulatory Effect of Arginine Deprivation. Animals 2021, 11, 2756. https://doi.org/10.3390/ani11092756
Saleri R, Borghetti P, Ravanetti F, Andrani M, Cavalli V, De Angelis E, Ferrari L, Martelli P. A Co-Culture Model of IPEC-J2 and Swine PBMC to Study the Responsiveness of Intestinal Epithelial Cells: The Regulatory Effect of Arginine Deprivation. Animals. 2021; 11(9):2756. https://doi.org/10.3390/ani11092756
Chicago/Turabian StyleSaleri, Roberta, Paolo Borghetti, Francesca Ravanetti, Melania Andrani, Valeria Cavalli, Elena De Angelis, Luca Ferrari, and Paolo Martelli. 2021. "A Co-Culture Model of IPEC-J2 and Swine PBMC to Study the Responsiveness of Intestinal Epithelial Cells: The Regulatory Effect of Arginine Deprivation" Animals 11, no. 9: 2756. https://doi.org/10.3390/ani11092756
APA StyleSaleri, R., Borghetti, P., Ravanetti, F., Andrani, M., Cavalli, V., De Angelis, E., Ferrari, L., & Martelli, P. (2021). A Co-Culture Model of IPEC-J2 and Swine PBMC to Study the Responsiveness of Intestinal Epithelial Cells: The Regulatory Effect of Arginine Deprivation. Animals, 11(9), 2756. https://doi.org/10.3390/ani11092756