
GIS as an Epidemiological Tool to Monitor the Spatial–Temporal Distribution of Tuberculosis in Large Game in a High-Risk Area in Portugal

 ,
,  ,
, 

Abstract
Simple Summary
Abstract
1. Introduction
2. Materials and Methods
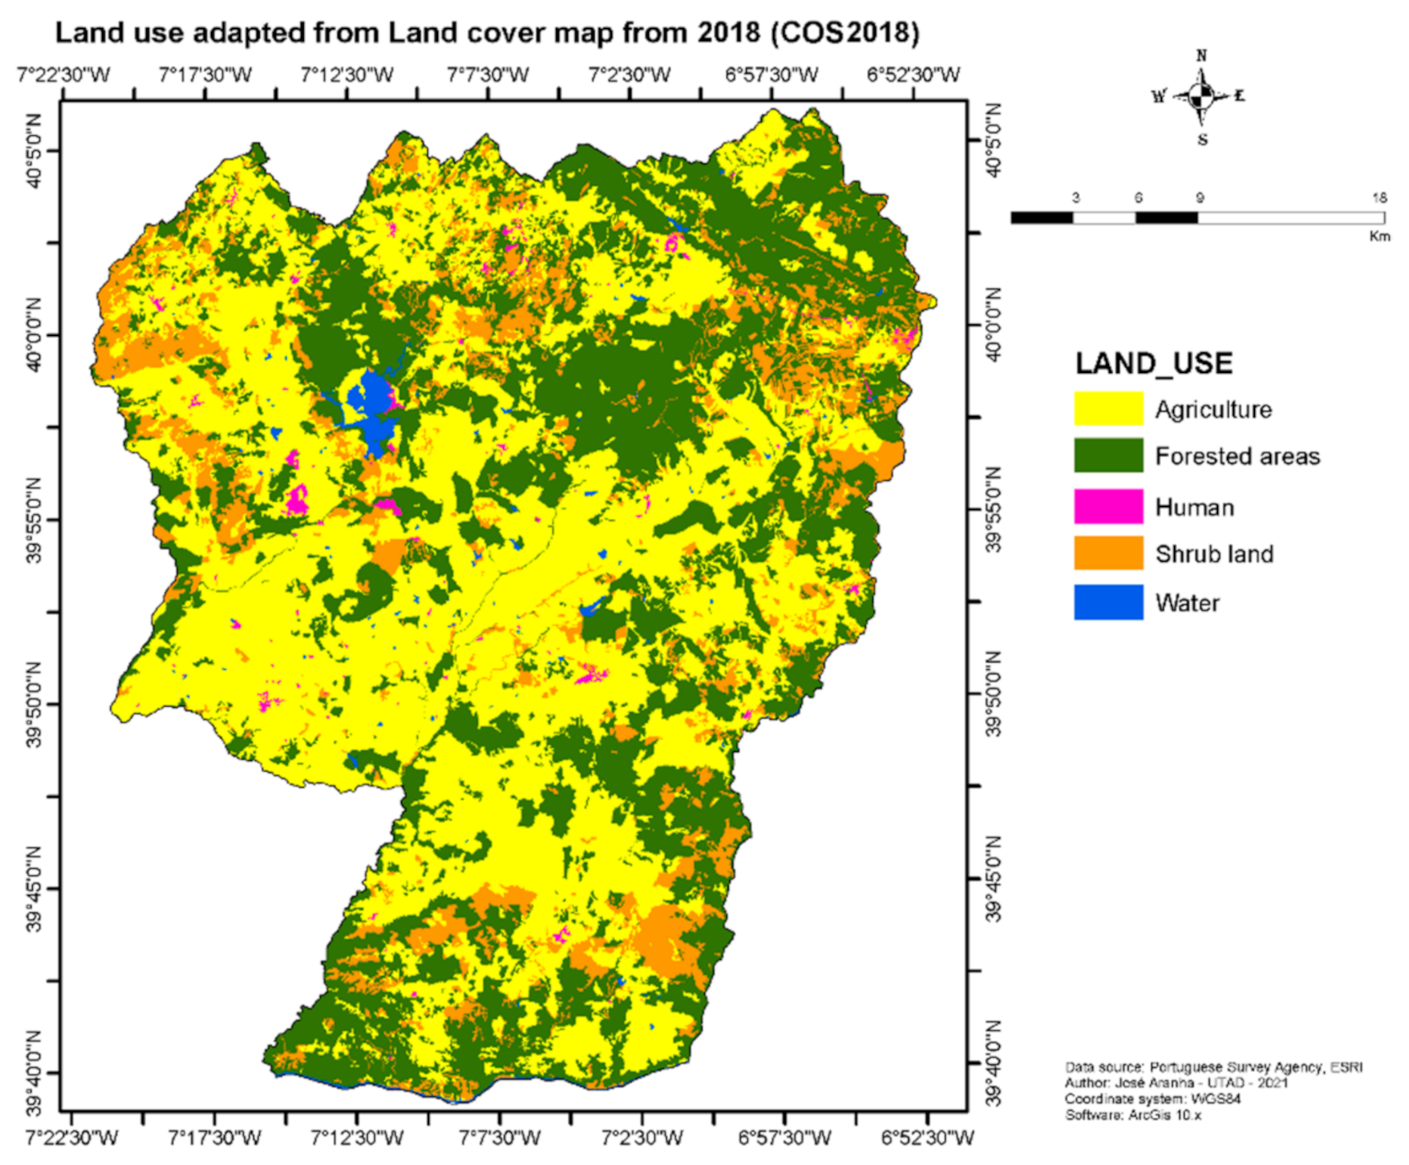
2.1. Study Area Characteristics
2.2. Data Collection and Processing
2.3. GIS Project
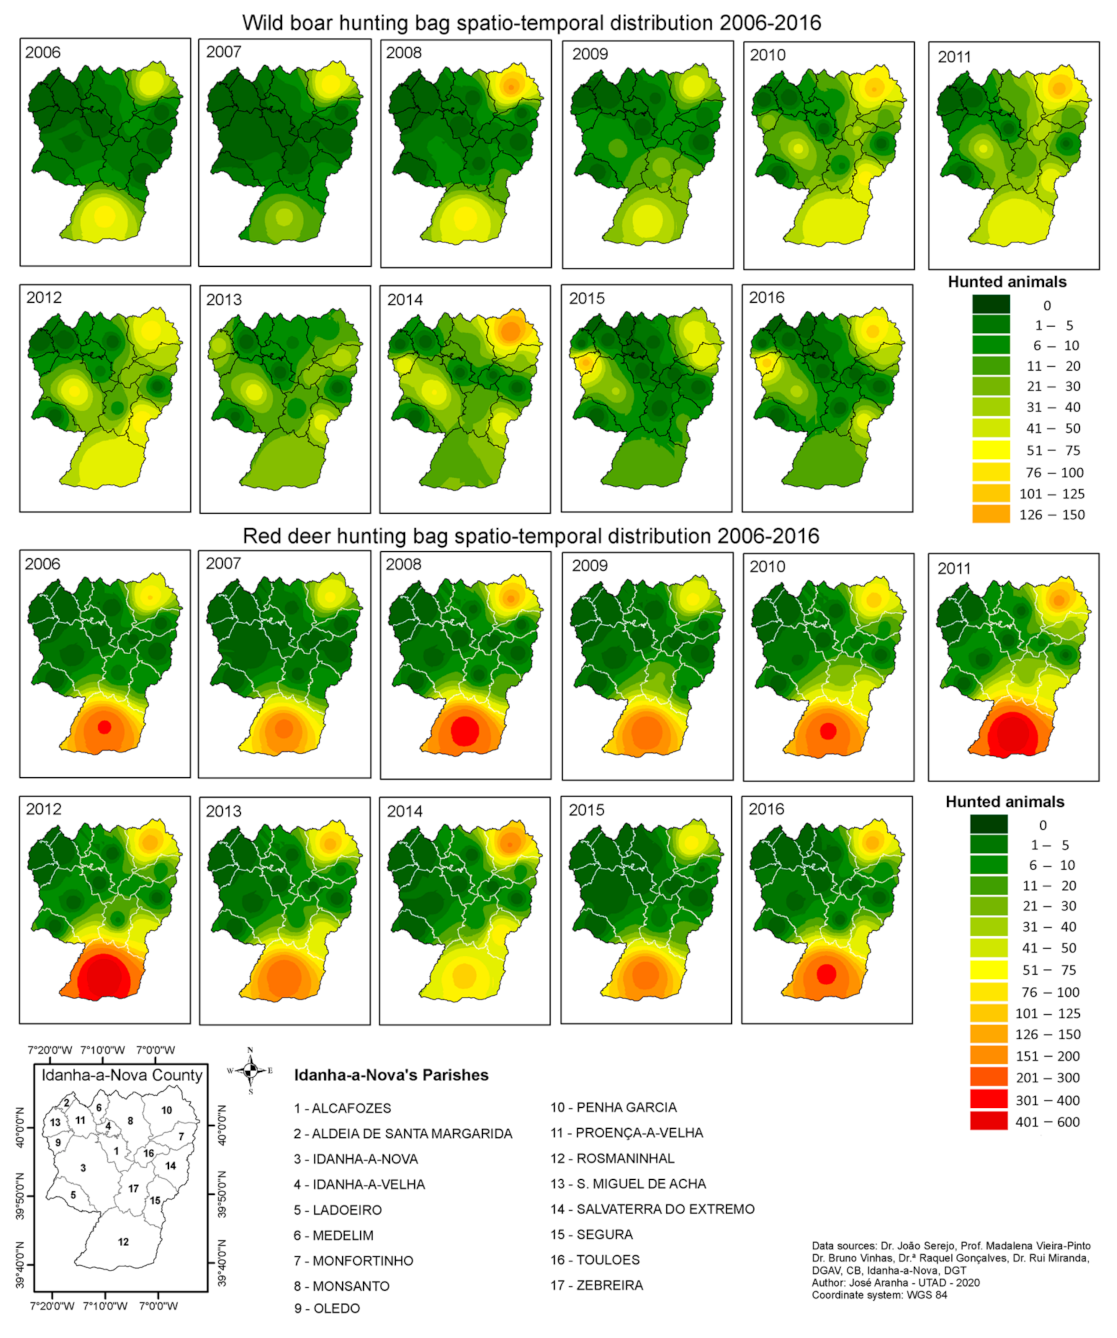
3. Results
4. Discussion
5. Conclusions
Author Contributions
Funding
Institutional Review Board Statement
Data Availability Statement
Conflicts of Interest
References
- Palmer, M.V. Mycobacterium bovis: Characteristics of Wildlife Reservoir Hosts. Transbound. Emerg. Dis. 2013, 60, 1–13. [Google Scholar] [CrossRef]
- Martínez-López, B.; Barasona, J.A.; Gortázar, C.; Rodríguez-Prieto, V.; Sánchez-Vizcaíno, J.M.; Vicente, J. Farm-level risk factors for the occurrence, new infection or persistence of tuberculosis in cattle herds from South-Central Spain. Prev. Vet. Med. 2014, 116, 268–278. [Google Scholar] [CrossRef]
- Durr, P.A.; Gething, P.W.; Atkinson, P.M.; Sayers, A.R.; McDonald, R.M. Geostatistical interpolation of wildlife disease prevalence determined by road casualty surveys. In Proceedings of the 11th International Symposium on Veterinary Epidemiology and Economics, Cairns, Australia, August 2006; Available online: http://www.sciquest.org.nz/node/63774 (accessed on 23 June 2021).
- Gortázar, C.; Ferroglio, E.; Höfle, U.; Frölich, K.; Vicente, J. Diseases shared between wildlife and livestock: A European perspective. Eur. J. Wildl. Res. 2007, 53, 241–256. [Google Scholar] [CrossRef]
- Miller, R.S.; Farnsworth, M.; Malmberg, J. Diseases at the livestock–wildlife interface: Status, challenges, and opportunities in the United States. Prev. Vet. Med. 2013, 110, 119–132. [Google Scholar] [CrossRef] [PubMed]
- Direção Geral de Veterinária. Plano de Controlo e Erradicação da Tuberculose em Caça Maior. Available online: http://srvbamid.dgv.min-gricultura.pt/xeov21/attachfileu.jsp?look_parentBoui=2198974&att_display=n&att_download=y (accessed on 23 June 2021).
- Santos, N.; Correia-Neves, M.; Ghebremichael, S.; Källenius, G.; Svenson, S.B.; Almeida, V. Epidemiology of Mycobacterium bovis infection in wild boar (Sus scrofa) from Portugal. J. Wildl. Dis. 2009, 45, 1048–1061. [Google Scholar] [CrossRef] [PubMed]
- Vieira-Pinto, M.; Alberto, J.; Aranha, J.; Serejo, J.; Canto, A.; Cunha, M.V.; Botelho, A. Combined evaluation of bovine tuberculosis in wild boar (Sus scrofa) and red deer (Cervus elaphus) from Central-East Portugal. Eur. J. Wildl. Res. 2011, 57, 1189–1201. [Google Scholar] [CrossRef]
- Cunha, M.V.; Matos, F.; Canto, A.; Albuquerque, T.; Alberto, J.; Aranha, J.; Vieira-Pinto, M.; Botelho, A. Implications and Challenges of Tuberculosis in Wildlife Ungulates: A Molecular Epidemiology Perspective. Res. Vet. Sci. 2012, 92, 225–235. [Google Scholar] [CrossRef]
- Kitron, U.; Kazmierczak, J.J. Spatial analysis of the distribution of Lyme disease in Wisconsin. Am. J. Epidemiol. 1997, 145, 558–566. [Google Scholar] [CrossRef]
- Brooker, S.; Michael, E. The potential of geographical information systems and remote sensing in the epidemiology and control of human helminth infections. Adv. Parasitol. 2000, 47, 245–288. [Google Scholar] [CrossRef]
- McKenzle, J.S.; Morris, R.S.; Pfeiffer, D.U.; Dymond, J.R. Application of Remote Sensing to Enhance the Control of Wildlife Associated Mycobacterium bovis Infection. Photogramm. Eng. Remote Sens. 2002, 68, 153–159. [Google Scholar]
- Pfeiffer, D.U.; Hugh-Jones, M. Geographical information systems as a tool in epidemiological assessment and wildlife disease management. Rev. Sci. Tech. 2002, 21, 91–102. [Google Scholar] [CrossRef]
- Nusser, S.M.; Clark, W.R.; Otis, D.L.; Huang, L. Sampling Considerations for Disease Surveillance in Wildlife Populations. J. Wildl. Manag. 2008, 72, 52–60. [Google Scholar] [CrossRef]
- Alberto, J.R.; Aranha, J.; Serejo, J.; Amado, A.; Vieira-Pinto, M. The Utility of GIS in Studying the Distribution of Bovine Tuberculosis in Wild Boar (Sus Scrofa) and Red Deer (Cervus Elaphus) in Central Portugal. In Game Meat Hygiene in Focus. Microbiology, Epidemiology, Risk Analysis and Quality Assurance; Paulsen, P., Bauer, A., Vodnansky, M., Winkelmayer, R., Smulders, F.J.M., Eds.; Wageningen Academic Publishers: Wageningen, The Netherlands, 2011; pp. 199–204. [Google Scholar]
- French, N.; White, P. The Use of GIS in Modelling the Spatial and Temporal Spread of Animal Diseases. In GIS and Spatial Analysis in Veterinary Science; Durr, P.A., Gatrell, A.C., Eds.; CABI Publishing: Wallingford, UK, 2004. [Google Scholar]
- Balamurugan, G.; Ro, N.; Samrat, S.; Kurne, V.; Purwar, D.; Siddarth, D. Applications of GIS in Public Health Risk Reduction—ArcGIS Approach. In Proceedings of the 12th ESRI India User Conference, Noida, India, 7–8 December 2011; p. 11. [Google Scholar]
- Pikula, J. GIS as an Epidemiological Tool in the Study of Infectious Diseases. In Proceedings of the World Small Animal Veterinary Association World Congress Proceedings, Prague, Czech Republic, 11–14 October 2006. [Google Scholar]
- Norstrøm, M. Geographical Information System (GIS) as a Tool in Surveillance and Monitoring of Animal Diseases. Acta Vet. Scand. 2011, 42, 79. [Google Scholar] [CrossRef]
- Dhama, K.; Verma, A.K.; Tiwari, R.; Chakraborty, S.; Vora, S.; Kapoor, S.; Deb, R.; Karthik, K.; Singh, R.; Munir, M.; et al. A perspective on applications of Geographical Information System (GIS): An advanced tracking tool for disease surveillance and monitoring in veterinary epidemiology. Adv. Anim. Vet. Sci. 2013, 1, 14–24. [Google Scholar]
- Beard, R.; Wentz, E.; Scotch, M. A systematic review of spatial decision support systems in public health informatics supporting the identification of high risk areas for zoonotic disease outbreaks. Int. J. Health Geogr. 2018, 17, 1–19. [Google Scholar] [CrossRef]
- Direcção Geral do Território. COS15: Carta de Ocupação do Solo Para 2015. 2020. Available online: https://www.dgterritorio.gov.pt/dados-abertos (accessed on 23 June 2021).
- Parra, A.; Larrasa, J.; Garcia, A.; Alonso, J.M.; Hermoso de Mendoza, J. Molecular epidemiology of bovine tuberculosis in wild animals in Spain: A first approach to risk factor analysis. Vet. Microb. 2005, 110, 293–300. [Google Scholar] [CrossRef]
- Vieira-Pinto, M. Game Meat Hygiene and Safety in Portugal. Section 3 Hygiene in Game Meat Production and Associated Legislation, In Trends in Game Meat Hygiene: From Forest to Fork; Paulsen, P., Bauer, A., Smulders, F.J.M., Eds.; Wageningen Academic Publishers: Wageningen, The Netherlands, 2004; pp. 223–240. [Google Scholar]
- Vicente, J.; Höfle, U.; Garrido, J.M.; Fernández-de-Mera, I.G.; Acevedo, P.; Juste, R.; Barral, M.; Gortazar, C. Risk factors associated with the prevalence of tuberculosis-like lesions in fenced wild boar and red deer in south central Spain. Vet. Res. 2007, 38, 451–464. [Google Scholar] [CrossRef]
- Plhal, R.; Kamler, J. Analysis of accuracy of hunting plan in the Czech Republic. Acta Univ. Agric. Silvic. Mendel. Brun. 2012, 19, 165–172. [Google Scholar] [CrossRef]
- Daniel, W.W.; Cross, C. Biostatistics: A Foundation for Analysis in the Health Sciences; John Wiley & Sons: Hoboken, NJ, USA, 1987. [Google Scholar]
- Smith, G.C.; Cheeseman, C.L. A mathematical model for the control of diseases in wildlife populations: Culling, vaccination and fertility control. Ecol. Model. 2002, 150, 45–53. [Google Scholar] [CrossRef]
- Soares, A. Geoestatística Para as Ciências da Terra e do Ambiente; IST Press: Lisboa, Portugal, 2006. [Google Scholar]
- Schröder, W. GIS, geostatistics, metadata banking, and tree-based models for data analysis and mapping in environmental monitoring and epidemiology. Int. J. Med. Microbiol. 2006, 296, 23–36. [Google Scholar] [CrossRef] [PubMed]
- Highfield, L.; Ward, M.; Laffan, S. Representation of animal distributions in space: How geostatistical estimates impact simulation modelling of foot-and-mouth disease spread. Vet. Res. 2008, 39, 17. [Google Scholar] [CrossRef][Green Version]
- Acevedo, P.; Quirós-Fernández, F.; Casal, J.; Vicente, J. Spatial distribution of wild boar population abundance: Basic information for spatial epidemiology and wildlife management. Ecol. Indic. 2014, 36, 594–600. [Google Scholar] [CrossRef]
- Zanella, G.; Duvauchelle, A.; Hars, J.; Moutou, F.; Boschiroli, M.L.; Durand, B. Patterns of lesions of bovine tuberculosis in wild red deer and wild boar. Vet. Rec. 2008, 163, 43–47. [Google Scholar] [CrossRef]
- Vicente, J.; Höfle, U.; Garrido, J.; Fernandez de Mera, I.; Juste, R.; Barral, M.; Gortázar, C. Wild Boar and Red Deer Display High Prevalence of Tuberculosis-Like Lesions in Spain. Vet. Res. 2006, 37, 107–119. [Google Scholar] [CrossRef] [PubMed]
- de Mendoza, J.H.; Parra, A.; Tato, A.; Alonso, J.M.; Rey, J.M.; Peña, J.; García-Sánchez, A.; Larrasa, J.; Teixidó, J.; Manzano, G.; et al. Bovine tuberculosis in wild boar (Sus scrofa), red deer (Cervus elaphus) and cattle (Bos taurus) in a Mediterranean ecosystem (1992–2004). Prev. Vet. Med. 2006, 74, 239–247. [Google Scholar] [CrossRef] [PubMed]
- Gortazar, C.; Vicente, J.; Gavier-Widen, D. Pathology of bovine tuberculosis in the European wild boar (Sus scrofa). Vet. Rec. 2003, 152, 779–780. [Google Scholar] [CrossRef]
- Gortazar, C.; Vicente, J.; Samper, S.; Garrido, J.M.; Fernandez-De-Mera, I.G.; Gavin, P.; Juste, R.A.; Martin, C.; Acevedo, P.; De La Puente, M.; et al. Molecular characterization of Mycobacterium tuberculosis complex isolates from wild ungulates in south-central Spain. Vet. Res. 2005, 36, 43–52. [Google Scholar] [CrossRef]
- Corner, L.A. The role of wild animal populations in the epidemiology of tuberculosis in domestic animals: How to assess the risk. Vet. Microbiol. 2006, 112, 303–312. [Google Scholar] [CrossRef]
- Cowie, C.E.; Hutchings, M.R.; Barasona, J.A.; Gortazar, C.; Vicente, J.; White, P. Interactions between four species in a complex wildlife: Livestock disease community: Implications for Mycobacterium bovis maintenance and transmission. Eur. J. Wildl. Res. 2016, 62, 51–64. [Google Scholar] [CrossRef]
- Moustakas, A.; Evans, M.R. A big-data spatial, temporal and network analysis of bovine tuberculosis between wildlife (badgers) and cattle. Stoch. Env. Res. Risk Assess. 2017, 31, 315–328. [Google Scholar] [CrossRef]
- Nunn, C.L.; Thrall, P.H.; Kappeler, P.M. Shared resources and disease dynamics in spatially structured populations. Ecol. Model. 2014, 272, 198–207. [Google Scholar] [CrossRef]
- Cross, P.; Getz, W. Assessing vaccination as a control strategy in an ongoing epidemic: Bovine tuberculosis in African buffalo. Ecol. Model. 2006, 196, 494–504. [Google Scholar] [CrossRef]
- Cartwright, S.J.; Bowgen, K.M.; Collop, C.; Hyder, K.; Nabe-Nielsen, J.; Stafford, R.; Stillman, R.A.; Thorpe, R.B.; Sibly, R.M. Communicating complex ecological models to non-scientist end users. Ecol. Model. 2016, 338, 51–59. [Google Scholar] [CrossRef]


| Wild Boar | Red Deer | |||||
|---|---|---|---|---|---|---|
| Year | Hunting Bag (N) | (1) Affected Carcasses (N) | (2) Occurrence (95% C.I.) | Hunting Bag (N) | (1) Affected Carcasses (N) | (2) Occurrence (95% C.I.) |
| 2006 | 202 | 20 | 9.9 (±9.37) | 445 | 35 | 7.9 (±6.48) |
| 2007 | 171 | 7 | 4.1 (±9.49) | 324 | 30 | 9.3 (±7.07) |
| 2008 | 287 | 42 | 14.6 (±11.52) | 571 | 45 | 7.9 (±8.86) |
| 2009 | 261 | 56 | 21.5 (±11.88) | 397 | 58 | 14.6 (±11.37) |
| 2010 | 462 | 85 | 18.4 (±14.08) | 563 | 56 | 9.9 (±11.47) |
| 2011 | 452 | 89 | 19.7 (±12.52) | 861 | 107 | 12.4 (±20.12) |
| 2012 | 458 | 99 | 21.6 (±12.30) | 827 | 74 | 8.9 (±14.44) |
| 2013 | 385 | 54 | 14.0 (±7.85) | 514 | 46 | 8.9 (±6.71) |
| 2014 | 506 | 58 | 11.5 (±10.18) | 442 | 20 | 4.5 (±2.63) |
| 2015 | 371 | 64 | 17.3 (±14.22) | 374 | 54 | 14.4 (±9.22) |
| 2016 | 408 | 73 | 17.9 (±10.18) | 563 | 45 | 8.0 (±3.20) |
| Total | 3963 | 647 | - | 5881 | 570 | - |
| Avg. | 360.3 | 58.8 | 16.4 (±15.14) | 534.6 | 51.8 | 9.7 (±8.85) |
| Std. | 113.4 | 28.2 | 173.5 | 23.4 | ||
| Wb_10 | Wb_11 | Wb_12 | Rd_10 | Rd_11 | Rd_12 | Rd_13 | ||
|---|---|---|---|---|---|---|---|---|
| Wb_10 | t-test | 1.243 | ||||||
| p-value | 0.121 | |||||||
| Wb_11 | t-test | 0.869 | 2.647 | |||||
| p-value | 0.199 | 0.011 | ||||||
| Wb_12 | t-test | 0.250 | 2.151 | |||||
| p-value | 0.403 | 0.028 | ||||||
| Wb_13 | t-test | 1.101 | 0.132 | |||||
| p-value | 0.142 | 0.449 | ||||||
| Rd_10 | t-test | |||||||
| p-value | ||||||||
| Rd_11 | t-test | 0.093 | ||||||
| p-value | 0.464 | |||||||
| Rd_12 | t-test | 1.136 | ||||||
| p-value | 0.138 | |||||||
| Rd_13 | t-test | 1.343 | ||||||
| p-value | 0.099 |
| Pearson Correlation | Wb_Ht | Wb_ TBL+ | Rd_Ht | Rd_ TBL+ |
|---|---|---|---|---|
| Wild boar hunted (Wb_Ht) | 1 | |||
| Wild boar TBL positive (Wb_TBL) | 0.854 ** | 1 | ||
| Red deer hunted (Rd_Ht) | 0.569 ns | 0.741 ** | 1 | |
| Red deer TBL positive (Rd_ TBL) | 0.348 ns | 0.683 * | 0.790 ** | 1 |
Publisher’s Note: MDPI stays neutral with regard to jurisdictional claims in published maps and institutional affiliations. |
© 2021 by the authors. Licensee MDPI, Basel, Switzerland. This article is an open access article distributed under the terms and conditions of the Creative Commons Attribution (CC BY) license (https://creativecommons.org/licenses/by/4.0/).
Share and Cite
Aranha, J.; Abrantes, A.C.; Gonçalves, R.; Miranda, R.; Serejo, J.; Vieira-Pinto, M. GIS as an Epidemiological Tool to Monitor the Spatial–Temporal Distribution of Tuberculosis in Large Game in a High-Risk Area in Portugal. Animals 2021, 11, 2374. https://doi.org/10.3390/ani11082374
Aranha J, Abrantes AC, Gonçalves R, Miranda R, Serejo J, Vieira-Pinto M. GIS as an Epidemiological Tool to Monitor the Spatial–Temporal Distribution of Tuberculosis in Large Game in a High-Risk Area in Portugal. Animals. 2021; 11(8):2374. https://doi.org/10.3390/ani11082374
Chicago/Turabian StyleAranha, José, Ana Carolina Abrantes, Raquel Gonçalves, Rui Miranda, João Serejo, and Madalena Vieira-Pinto. 2021. "GIS as an Epidemiological Tool to Monitor the Spatial–Temporal Distribution of Tuberculosis in Large Game in a High-Risk Area in Portugal" Animals 11, no. 8: 2374. https://doi.org/10.3390/ani11082374
APA StyleAranha, J., Abrantes, A. C., Gonçalves, R., Miranda, R., Serejo, J., & Vieira-Pinto, M. (2021). GIS as an Epidemiological Tool to Monitor the Spatial–Temporal Distribution of Tuberculosis in Large Game in a High-Risk Area in Portugal. Animals, 11(8), 2374. https://doi.org/10.3390/ani11082374