
Evaluation of the Conservation Status of the Croatian Posavina Horse Breed Based on Pedigree and Microsatellite Data

 ,
,  ,
, 
 ,
,  and
and 
Abstract
Simple Summary
Abstract
1. Introduction
2. Materials and Methods
2.1. Pedigree Analysis
2.2. Phenotype Analysis
2.3. Genetic Analysis
3. Results
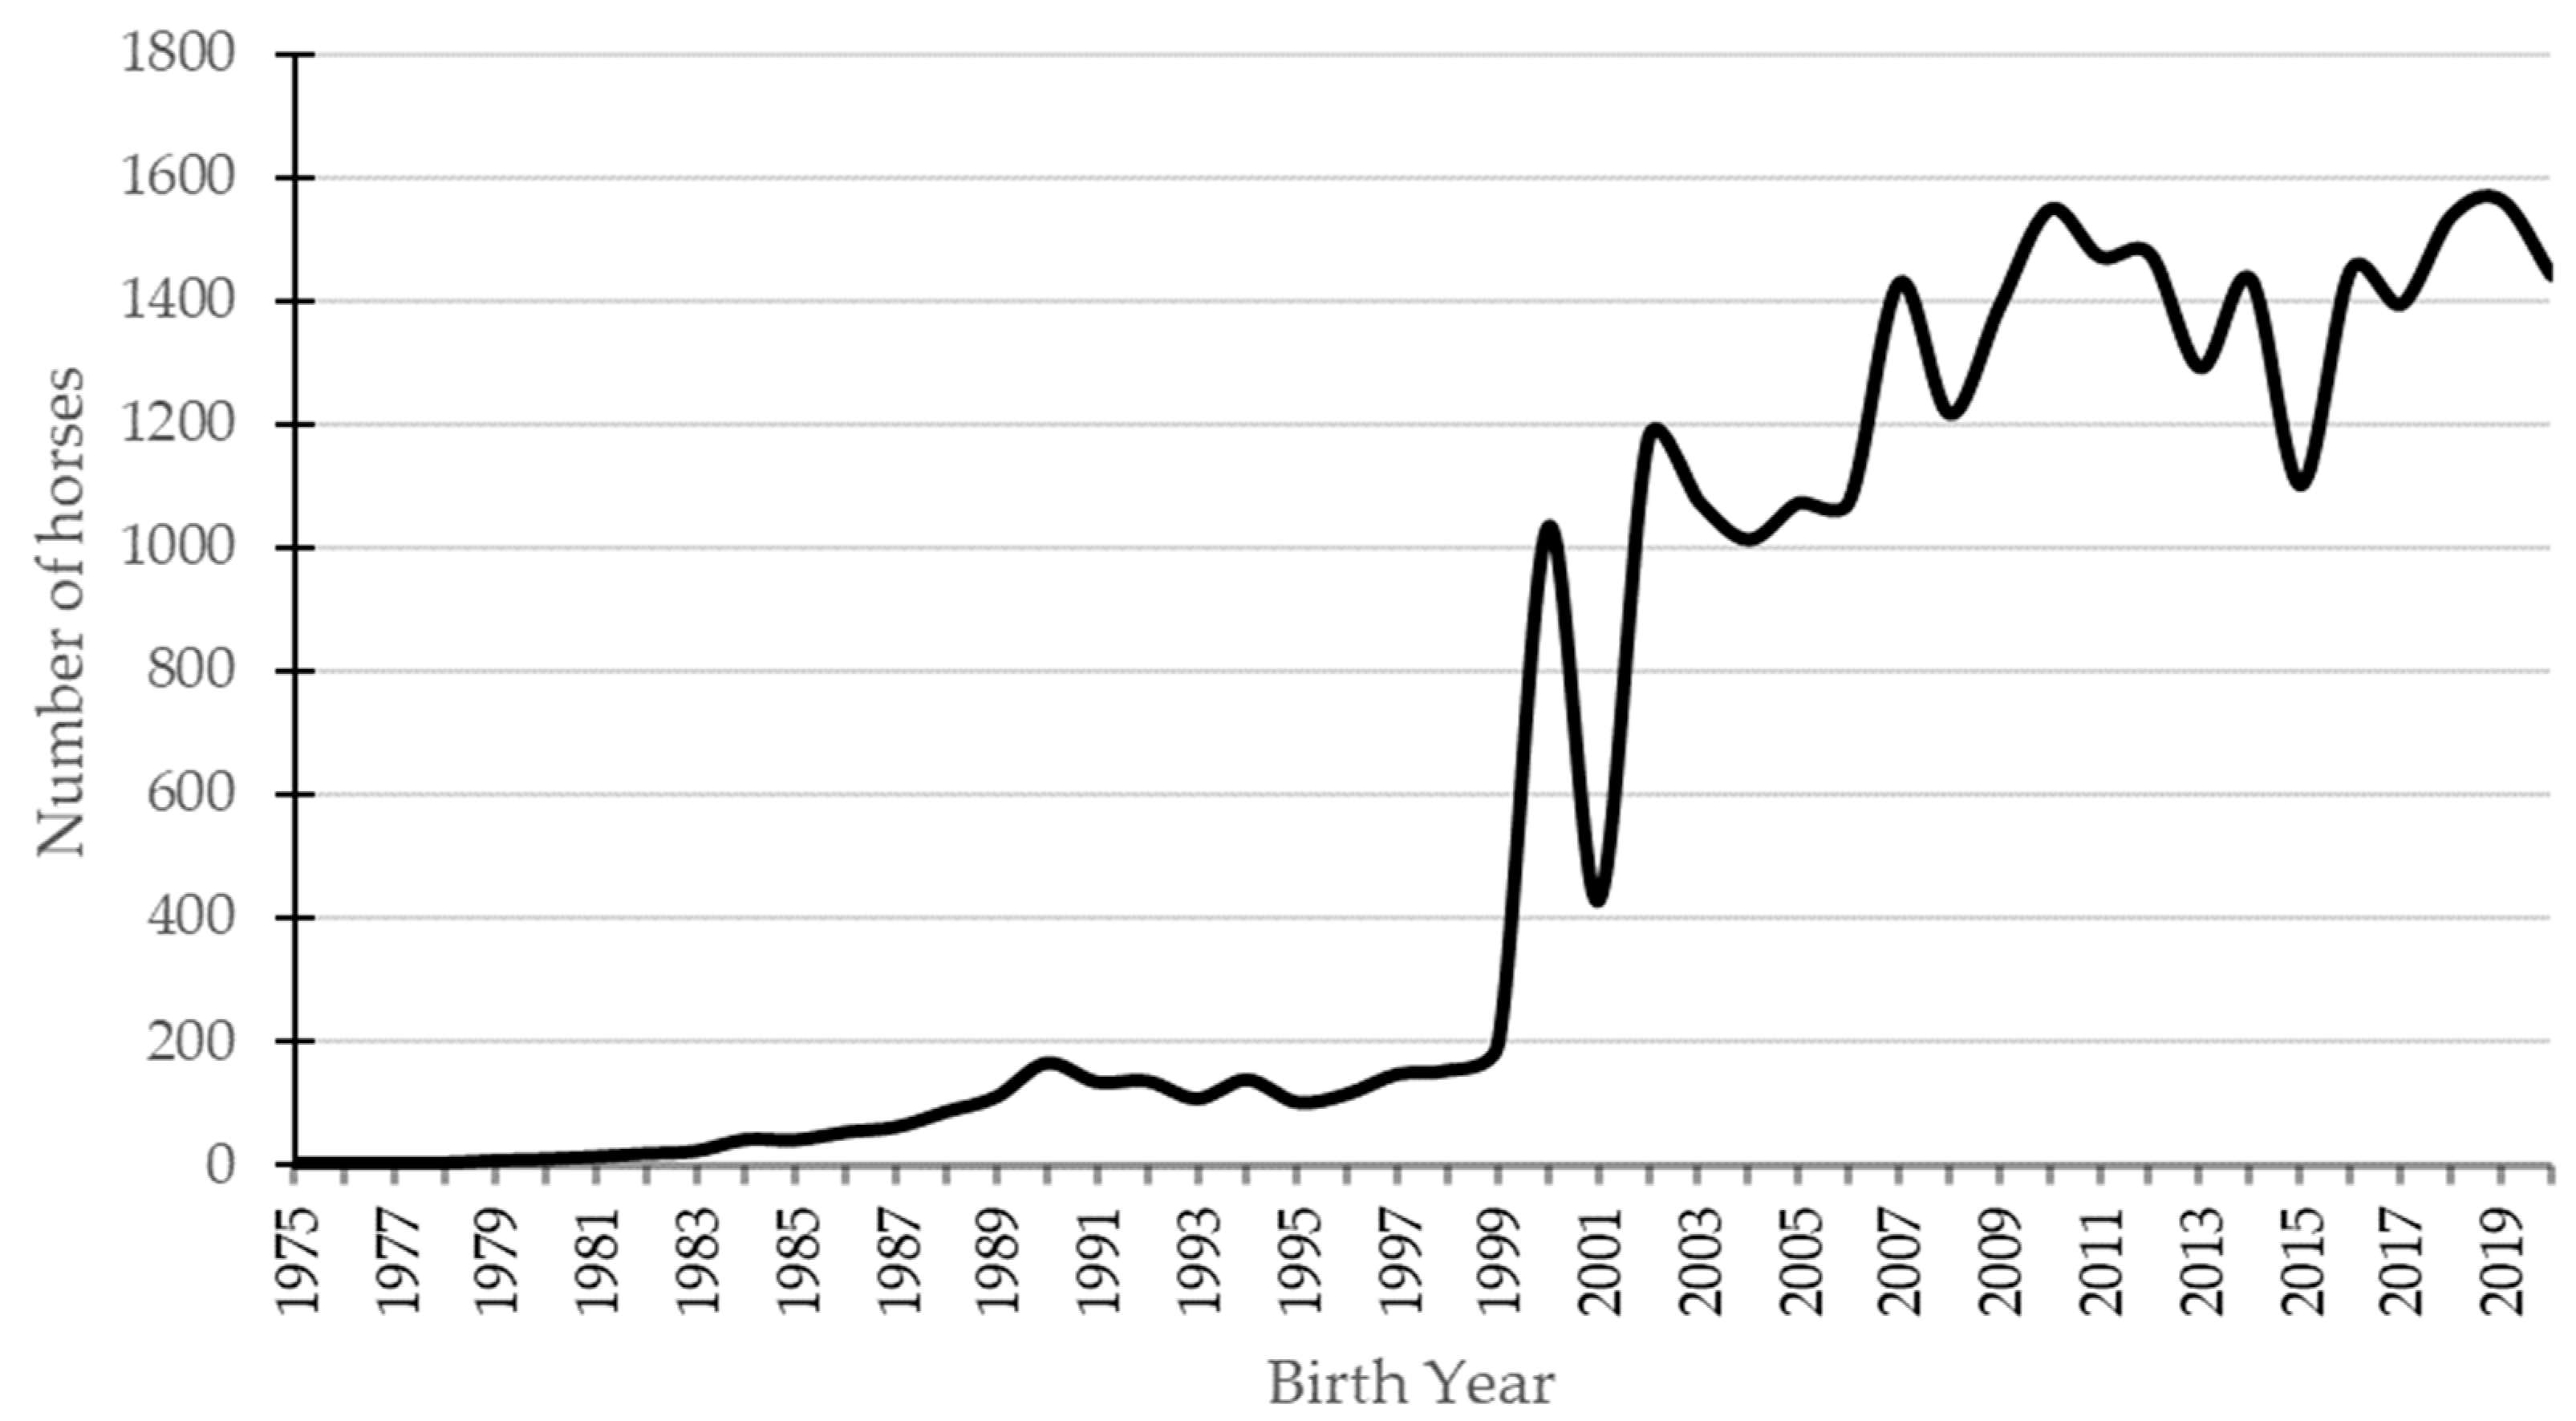
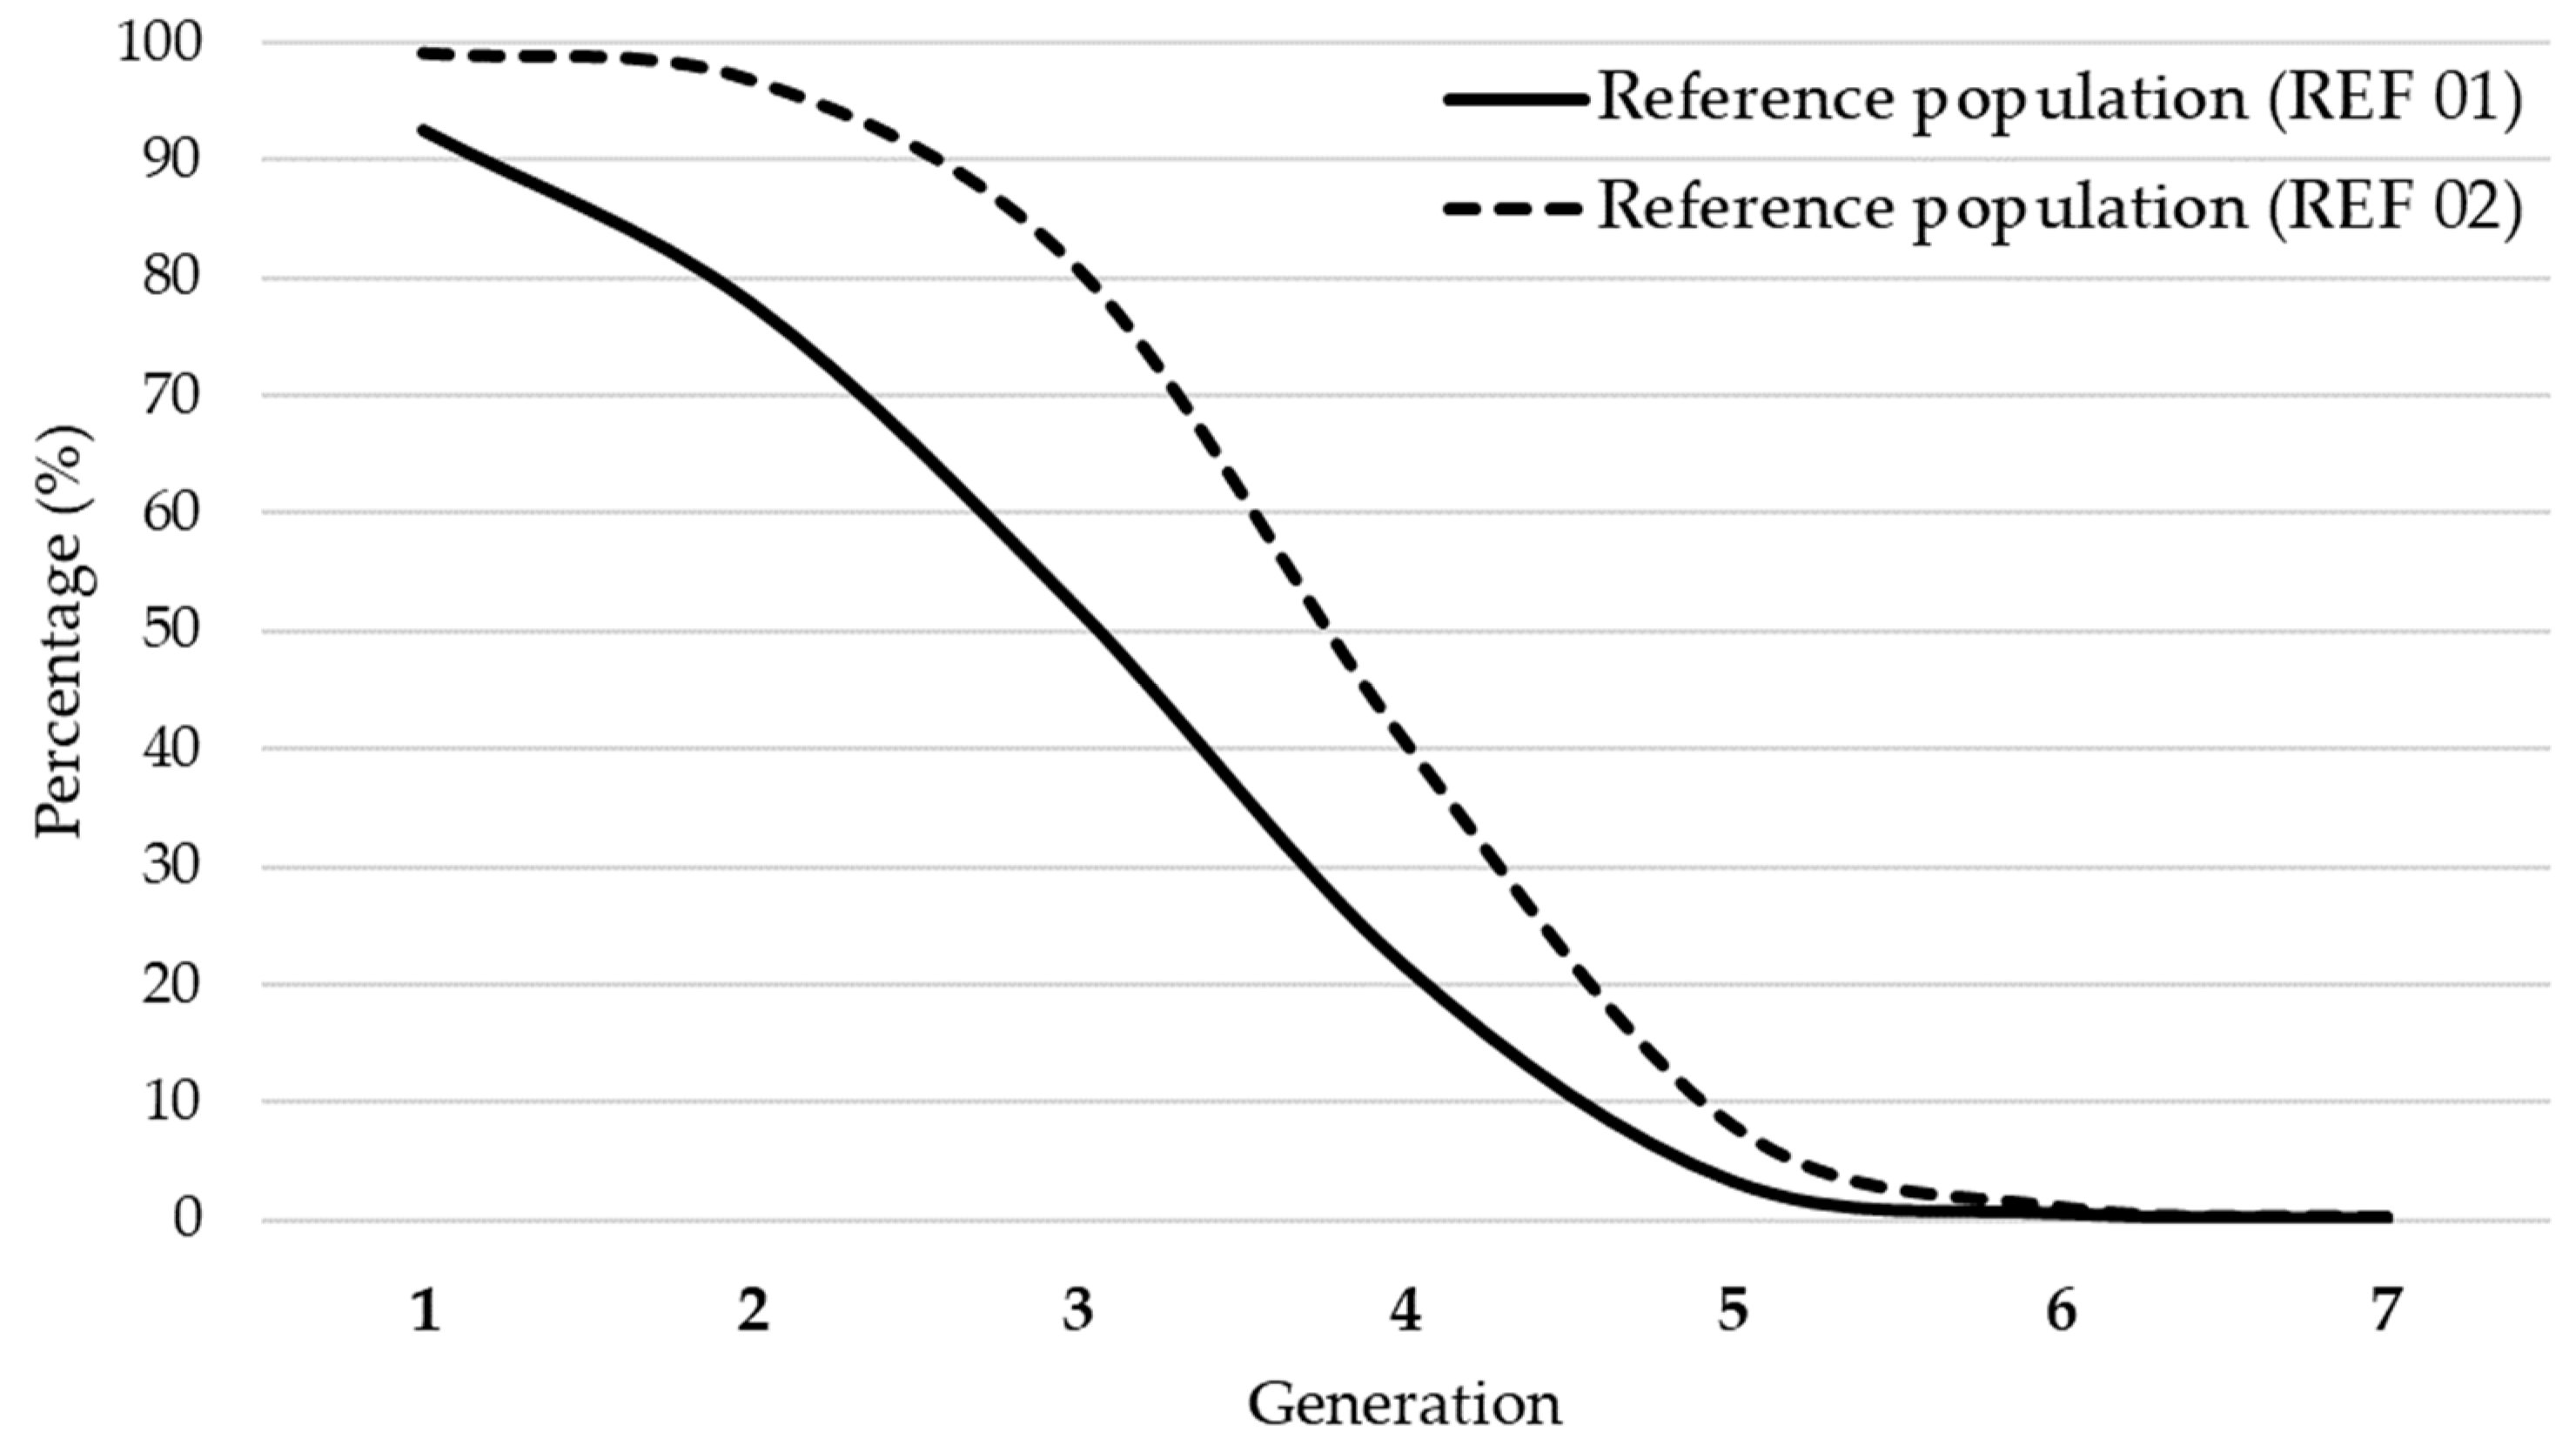
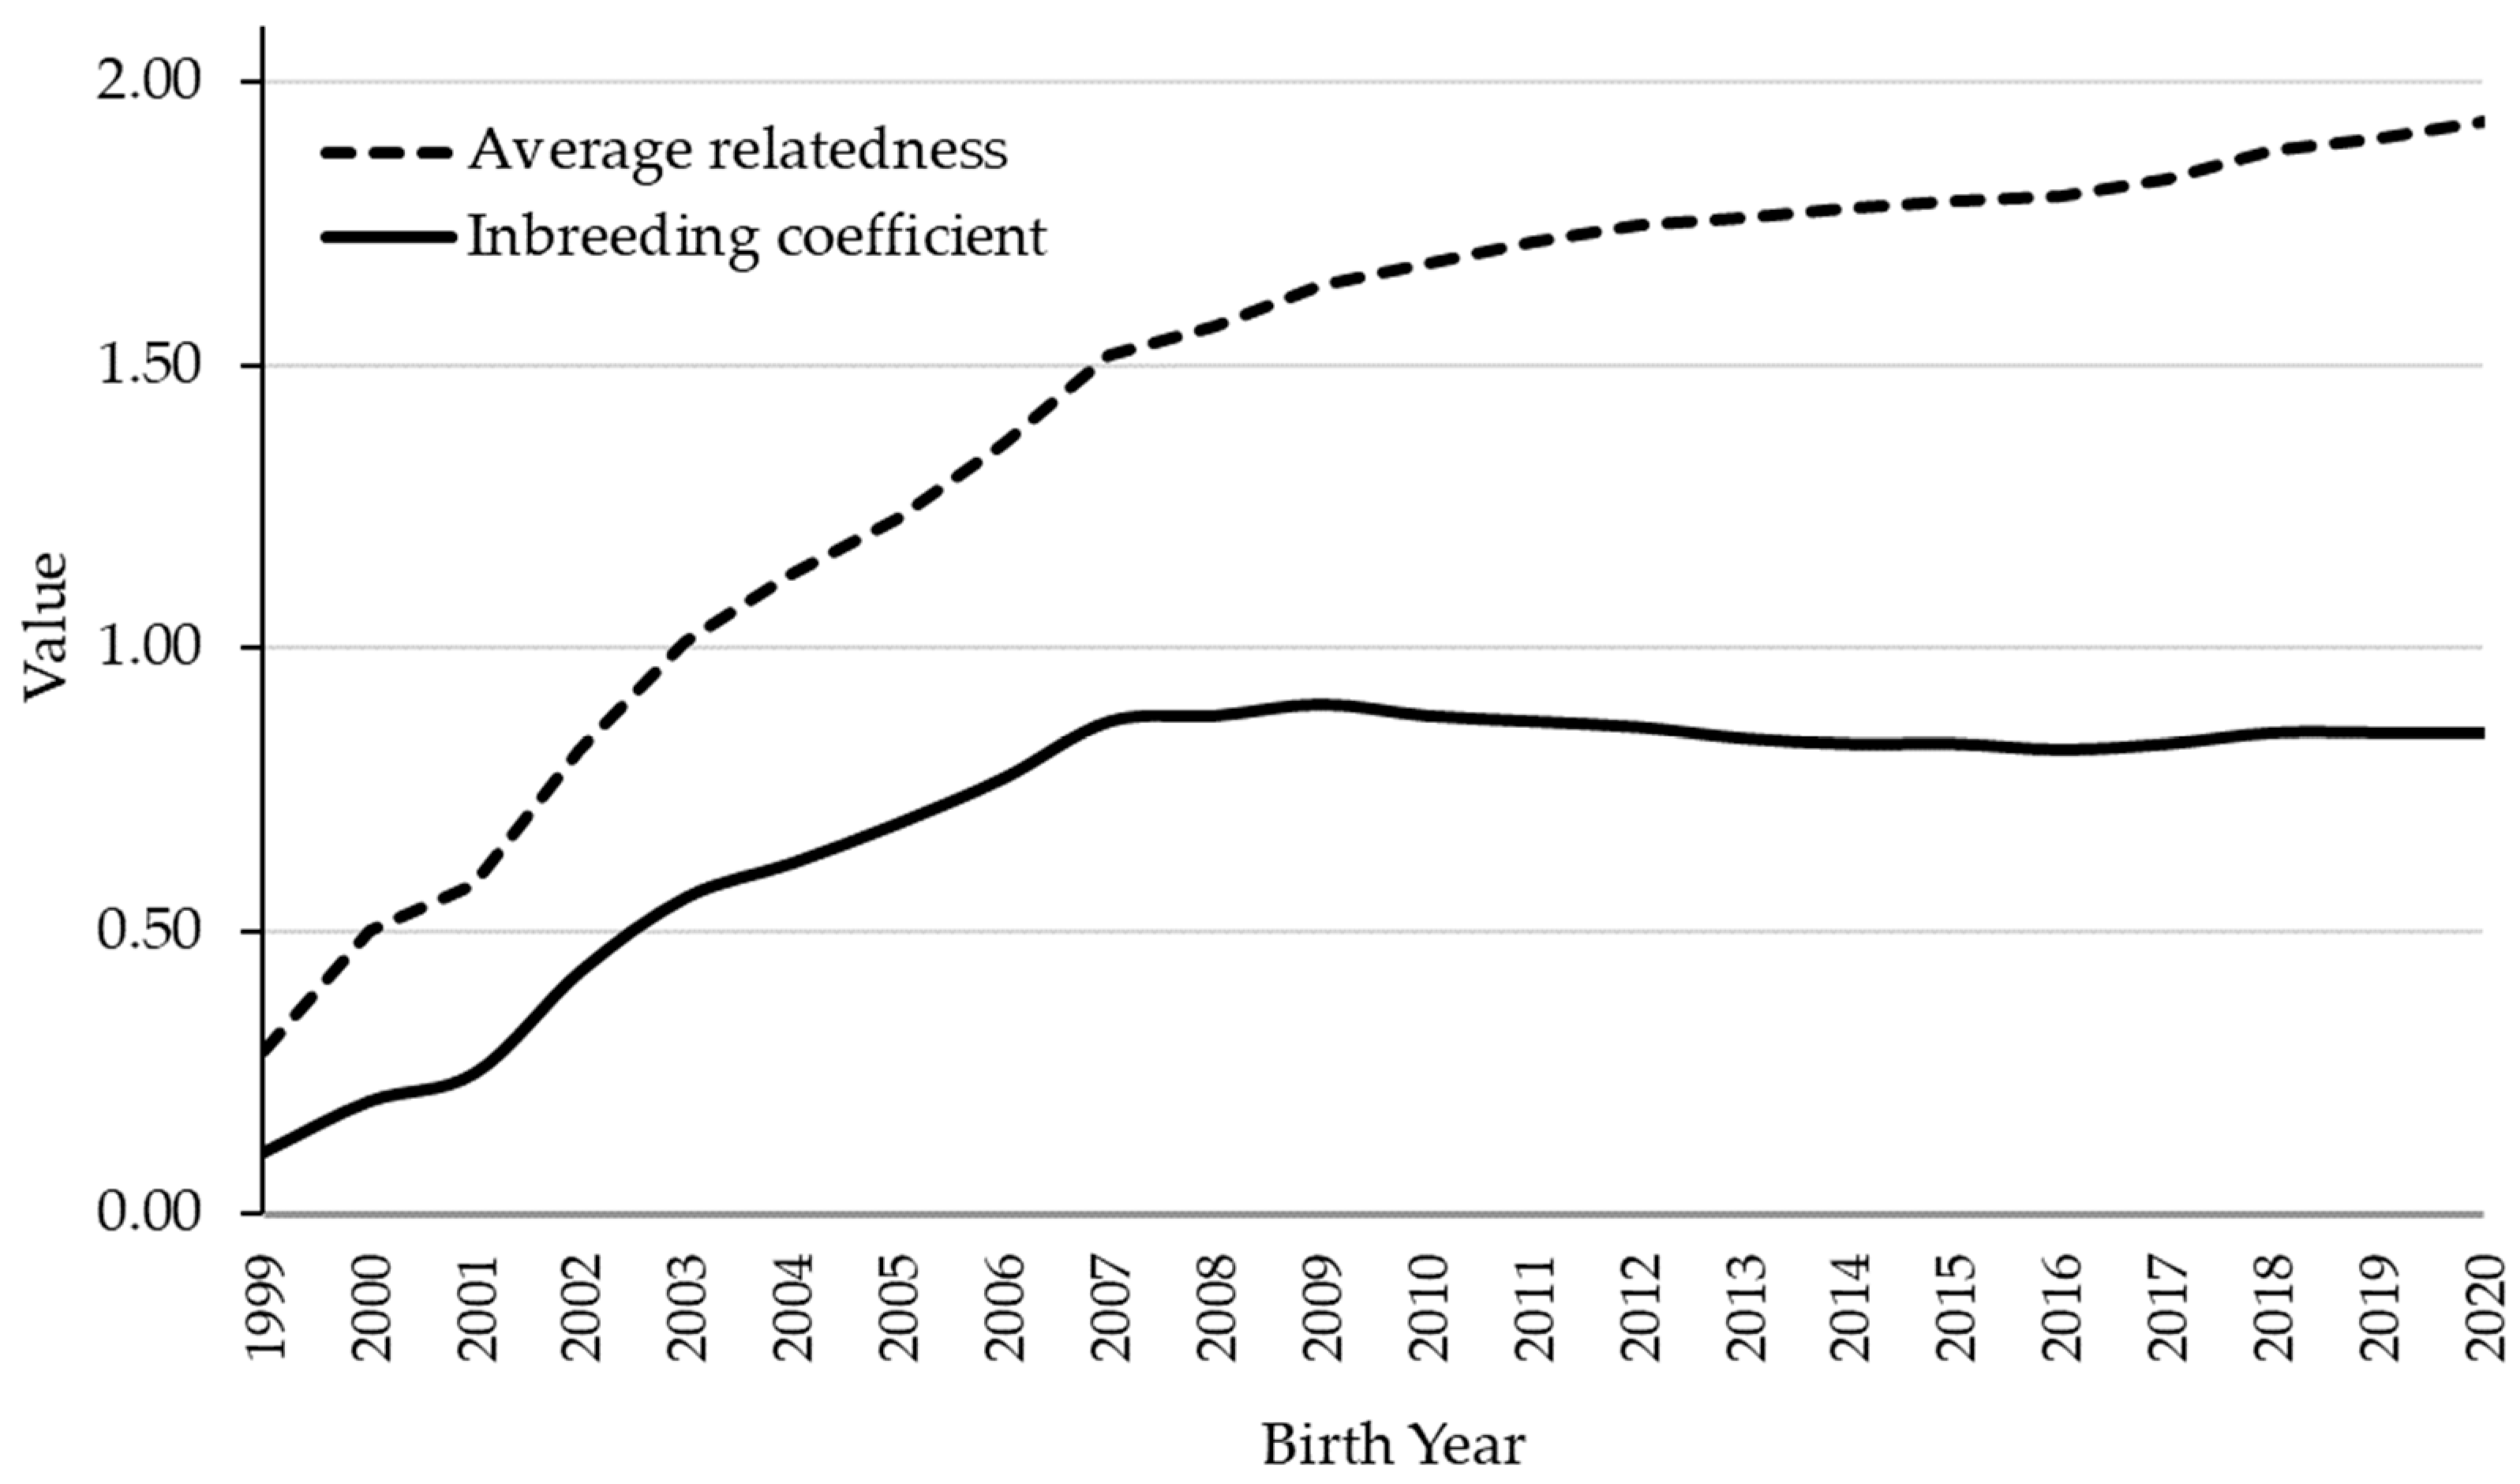
3.1. Pedigree
3.2. Morphometric Variability
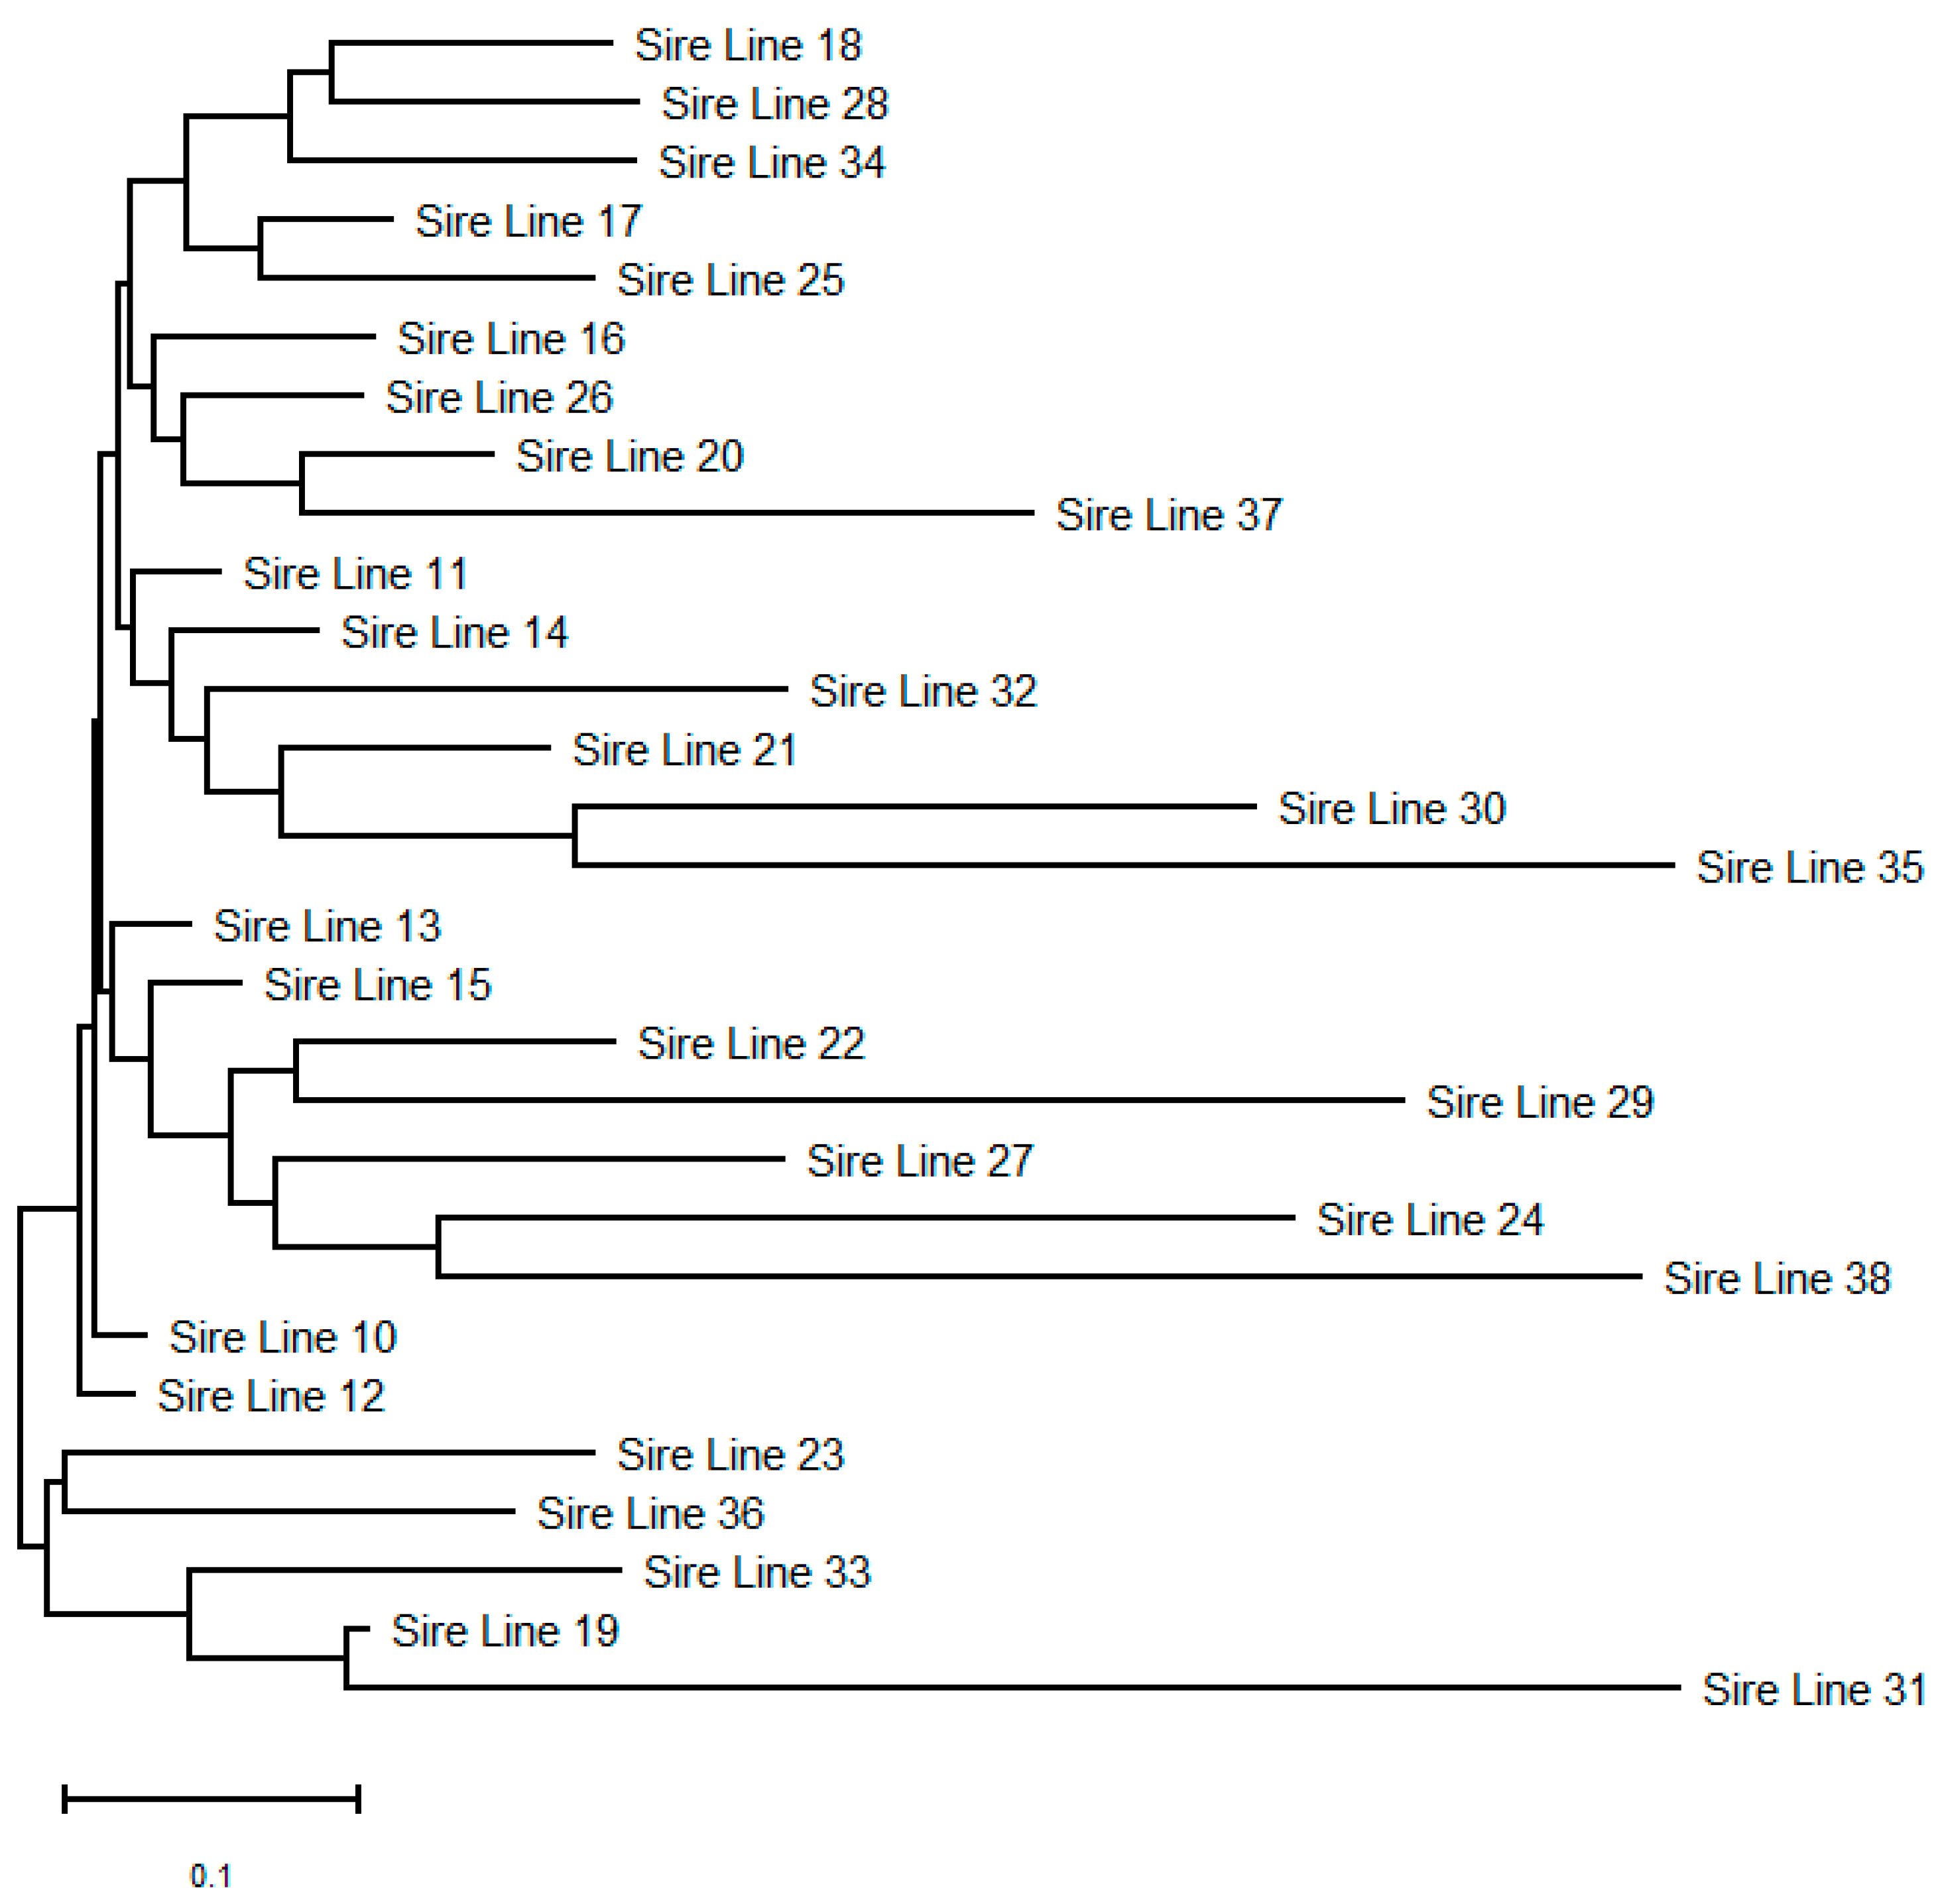
3.3. Microsatellite Variability and Genetic Diversity Indices
4. Discussion
5. Conclusions
Supplementary Materials
Author Contributions
Funding
Institutional Review Board Statement
Informed Consent Statement
Data Availability Statement
Acknowledgments
Conflicts of Interest
References
- FAO (Food and Agriculture Organsations). Status and Trends of Animal Genetic Resources; FAO—Commission on Genetic Resources for Food and Agriculture: Rome, Italy, 2019; Available online: http://www.fao.org/3/my867en/my867en.pdf (accessed on 1 May 2021).
- Ivanković, A.; Caput, P. Exterior features of Croatian autochthonous horse breeds. Stočarstvo 2004, 58, 15–36. [Google Scholar]
- Solis, A.; Jugo, B.M.; Meriaux, J.C.; Iriondo, M.; Mazon, L.I.; Aguirre, A.I.; Vicario, A.; Estomba, A. Genetic Diversity Within and Among Four South European Native Horse Breeds Based on Microsatellite DNA Analysis: Implications for Conservation. J. Hered. 2005, 96, 670–678. [Google Scholar] [CrossRef] [PubMed]
- Vostrý, L.; Capkova, Z.; Pribyl, J.; Hofmanova, B.; Vydrova, H.V.; Mach, K. Population structure of Czech cold-blooded breeds of horses. Arch. Tierz. 2011, 54, 1–9. [Google Scholar] [CrossRef]
- CAAF. Annual Report Equidae Breeding, The Croatian Agency for Agriculture and Food. 2021. Available online: https://www.hapih.hr/wp-content/uploads/2021/05/Godisnje-izvjesce-Kopitari-2020-web-1.pdf (accessed on 28 May 2021).
- Alderson, L. Breeds at risk: Definition and measurement of the factors which determine endangerment. Livest. Sci. 2008, 123, 23–27. [Google Scholar] [CrossRef]
- Zechner, P.; Sölkner, J.; Bodó, I.; Druml, T.; Baumung, R.; Achmann, R.; Marti, E.; Habe, F.; Brem, G. Analysis of diversity and population structure in the Lipizzan horse breed based on pedigree information. Livest. Prod. Sci. 2002, 77, 137–146. [Google Scholar] [CrossRef]
- Valera, M.; Molina, A.; Gutiérrez, J.P.; Gómez, J.; Goyache, F. Pedigree analysis in the Andalusian horse: Population structure, genetic variability and influence of the Carthusian strain. Livest. Prod. Sci. 2005, 95, 57–66. [Google Scholar] [CrossRef]
- Royo, L.J.; Álvarez, I.; Gutiérrez, J.P.; Fernández, I.; Goyache, F. Genetic variability in the endangered Asturcón pony assessed using genealogical and molecular information. Livest. Sci. 2007, 107, 162–169. [Google Scholar] [CrossRef]
- Druml, T.; Baumung, R.; Solkner, J. Pedigree analysis in the Austrian Noriker draught horse: Genetic diversity and the impact of breeding for coat colour on population structure. J. Anim. Breed. Genet. 2009, 126, 348–356. [Google Scholar] [CrossRef]
- Pjontek, J.; Kadlečík, O.; Kasarda, R.; Horný, M. Pedigree analysis in four Slovak endangered horse breeds. Czech J. Anim. Sci. 2012, 57, 54–64. [Google Scholar] [CrossRef]
- Pinheiro, M.; Kjöllerström, H.J.; Oom, M.M. Genetic diversity and demographic structure of the endangered Sorraia horse breed assessed through pedigree analysis. Livest. Sci. 2013, 152, 1–10. [Google Scholar] [CrossRef]
- Duru, S. Pedigree analysis of the Turkish Arab horse population: Structure, inbreeding and genetic variability. Animal 2017, 11, 1–8. [Google Scholar] [CrossRef] [PubMed]
- Posta, J.; Somogyvári, E.; Mihók, S. Historical Changes and Description of the Current Hungarian Hucul Horse Population. Animals 2020, 10, 1242. [Google Scholar] [CrossRef] [PubMed]
- Giontella, A.; Cardinali, I.; Lancioni, H.; Giovannini, S.; Pieramati, C.; Silvestrelli, M.; Sarti, F.M. Mitochondrial DNA Survey Reveals the Lack of Accuracy in Maremmano Horse Studbook Records. Animals 2020, 10, 839. [Google Scholar] [CrossRef]
- Gutiérrez, J.P.; Goyache, F. A note on ENDOG: A computer program for analysing pedigree information. J. Anim. Breed. Genet. 2005, 122, 172–176. [Google Scholar] [CrossRef]
- Goyache, F.; Gutiérrez, J.P.; Fernandez, I.; Gomez, E.; Alvarez, I.; Díez, J.; Royo, L.J. Using pedigree information to monitor genetic variability of endangered populations: The Xalda Sheep breed of Asturias as an example. J. Anim. Breed. Genet. 2003, 120, 95–105. [Google Scholar] [CrossRef]
- Kovač, M. Hrvatski Posavac: Autoktoni Konj Hrvatske; Areagrafika: Zagreb, Croatia, 1994. [Google Scholar]
- Cothran, E.G.; Kovač, M. Genetic analysis of the Croatian Trakehner and Posavina horse breeds. Živočišna Vyroba 1997, 42, 207–212. [Google Scholar]
- Galov, A.; Byrne, K.; Đuras-Gomerčić, M.; Gomerčić, T.; Nushol, Z.; Vincek, D.; Kocijan, I.; Tadić, Z.; Benkocić, V.; Bašić, I.; et al. Effectiveness of nine polymorphic microsatellite markers in parentage testing in Posavina, Croatian Coldblood and Lipizzaner horse breeds in Croatia. Livest. Prod. Sci. 2005, 93, 277–282. [Google Scholar] [CrossRef]
- Ivanković, A.; Dovč, P.; Caput, P.; Mijić, P.; Konjačić, M. Genetic characterisation of the Croatian autochthonous horse breed based on polymorphic blood proteins and mtDNA data. In Conservation Genetics of Endangered Horse Breeds; Bodo, I., Alderson, L., Langlois, B., Eds.; Wageningen Academic Publishers: Wageningen, The Netherlands, 2005; Volume 116, pp. 105–110. [Google Scholar]
- Ivanković, A.; Ramljak, J.; Dovč, P.; Kelava, N.; Konjačić, M. Genetic structure of three Croatian horse breeds: Implications for their conservation strategy. Ital. J. Anim. Sci. 2009, 8, 677–689. [Google Scholar] [CrossRef][Green Version]
- Galov, A.; Byrne, K.; Gomercic, T.; Duras, L.; Arbanasic, H.; Sindicic, M.; Mihelic, D.; Kovacic, A.; Funk, S.M. Genetic structure and admixture between the Posavina and Croatian Coldblood in contrast to Lipizzan horse from Croatia. Czech. J. Anim. Sci. 2013, 58, 71–78. [Google Scholar] [CrossRef]
- Boichard, D.; Maignel, L.; Verrier, E. The value of using probabilities of gene origin to measure genetic variability in a population. Genet. Sel. Evol. 1997, 29, 5–23. [Google Scholar] [CrossRef]
- James, J.W. A note on selection differentials and generation length when generations overlap. Anim. Sci. 1977, 24, 109–112. [Google Scholar] [CrossRef]
- SSHP. Central Breeders Association of Croatian Posavina Horse, 2019 Breeding Program of the Croatian Posavina Horse. Available online: https://www.sshp.hr/regulativa/uzgojna-dokumentacija/ (accessed on 2 June 2021).
- Peakall, R.; Smouse, P.E. GENALEX 6: Genetic analysis in Excel. Population genetic software for teaching and research. Mol. Ecol. Notes 2006, 6, 288–295. [Google Scholar] [CrossRef]
- Peakall, R.; Smouse, P.E. GENALEX 6.5: Genetic analysis in Excel. Population genetic software for teaching and research-an update. Bioinformatics 2012, 28, 2537–2539. [Google Scholar] [CrossRef]
- Gáspárdy, A.; Holly, V.; Zenke, P.; Maróti-Agóts, Á.; Sáfár, L.; Bali Papp, Á.; Kovács, E. The response of prion genic variation to selection for scrapie resistance in Hungarian indigenous sheep breeds. Acta Vet. Hung. 2018, 66, 562–572. [Google Scholar] [CrossRef]
- Kalinowski, S.T.; Taper, M.L.; Marshall, T.C. Revising how the computer program CERVUS accommodates genotyping error increases success in paternity assignment. Mol. Ecol. 2007, 116, 1099–1106. [Google Scholar] [CrossRef]
- Rousset, F. GENEPOP’007: A complete re-implementation of the genepop software for Windows and Linux. Mol. Ecol. 2008, 8, 1103–1106. [Google Scholar] [CrossRef]
- Weir, B.S.; Cockerham, C.C. Estimating F-statistics for the analysis of population structure. Evolution 1984, 38, 1358–1370. [Google Scholar] [CrossRef] [PubMed]
- Belkhir, K.; Borsa, P.; Chikhi, L.; Raufaste, N.; Bonhomme, F. GENETIX 4.05: Logiciel Sous Windows TM Pour la Génétique des Populations. Laboratoire Génome, Populations, Interactions, CNRS UMR 5000; Université de Montpellier II: Montpellier, France, 2004. [Google Scholar]
- Nei, M. Genetic distance and molecular phylogeny. In Population Genetics and Fishery Management; Ryman, N., Utter, F., Eds.; University of Washington Press: Seattle, WA, USA, 1987. [Google Scholar]
- Huson, D.H.; Bryant, D. Application of Phylogenetic Networks in Evolutionary Studies. Mol. Biol. Evol. 2006, 23, 254–267. [Google Scholar] [CrossRef] [PubMed]
- Cornuet, J.M.; Luikart, G. Description and power analysis of two tests for detecting recent population bottlenecks from allele frequency data. Genetics 1996, 144, 2001–2014. [Google Scholar] [CrossRef]
- Piry, S.; Luikart, G.; Cornuet, J.M. Computer note. BOTTLENECK: A computer program for detecting recent reductions in the effective size using allele frequency data. Heredity 1999, 90, 502–503. [Google Scholar] [CrossRef]
- Luikart, G.L.; Allendorf, F.W.; Cornuet, J.M.; Sherwin, W.B. Distortion of allele frequency distributions provides a test for recent population bottlenecks. J. Hered. 1998, 9, 238–247. [Google Scholar] [CrossRef]
- Hale, M.L.; Burg, T.M.; Steeves, T.E. Sampling for Microsatellite-Based Population Genetic Studies: 25 to 30 Individuals per Population Is Enough to Accurately Estimate Allele Frequencies. PLoS ONE. 2012, 7, e45170. [Google Scholar] [CrossRef]
- Vostrá Vydrová, H.; Vostrý, L.; Hofmanová, B.; Veselá, Z.; Schmidová, J.; Majzlík, I. Population Studies of Czech Hucul Horses. Poljoprivreda 2015, 21, 41–43. [Google Scholar] [CrossRef]
- Cervantes, I.; Molina, A.; Goyache, F.; Gutiérrez, J.P.; Valera, M. Population history and genetic variability in the Spanish Arab Horse assessed via pedigree analysis. Livest. Sci. 2008, 113, 24–33. [Google Scholar] [CrossRef]
- Stephens, T.D.; Splan, R.K. Population history and genetic variability of the American Shire horse. Anim. Genet. Resour. 2013, 52, 31–38. [Google Scholar] [CrossRef]
- Giontella, A.; Pieramati, C.; Silvestrelli, M.; Sarti, F.M. Analysis of founders and performance test effects on an autochthonous horse population through pedigree analysis: Structure, genetic variability and inbreeding. Animal 2019, 13, 15–24. [Google Scholar] [CrossRef] [PubMed]
- Mackowski, M.; Mucha, S.; Cholewinski, G.; Cieslak, J. Genetic diversity in Hucul and Polish primitive horse breeds. Arch. Anim. Breed. 2015, 58, 23–31. [Google Scholar] [CrossRef]
- Vostrá Vydrová, H.; Vostrý, L.; Hofmanová, B.; Krupa, E.; Veselá, Z.; Schmidova, J. Genetic diversity within and gene flow between three draught horse breeds using genealogical information. Czech. J. Anim. Sci. 2016, 61, 462–472. [Google Scholar] [CrossRef]
- Romić, S. Posavski konj. Poljoprivredna Znanstvena Smotra 1965, 20, 1–17. [Google Scholar]
- Leroy, G.; Callède, L.; Verrier, E.; Mériaux, J.C.; Ricard, A.; Danchin-Burge, C.; Rognon, X. Genetic diversity of a large set of horse breeds raised in France assessed by microsatellite polymorphism. Genet. Sel. Evol. 2009, 41, 5. [Google Scholar] [CrossRef] [PubMed]
- Silva, A.C.M.; Paiva, S.R.; Albuquerque, M.S.M.; Egito, A.A.; Santos, S.A.; Lima, F.C.; Castro, S.T.; Mariante, A.S.; Correa, P.S.; McManus, C.M. Genetic variability in local Brazilian horse lines using microsatellite markers. Genet. Mol. Res. 2012, 11, 881–890. [Google Scholar] [CrossRef]
- Vostrá Vydrová, H.; Vostrý, L.; Hofmanová, B.; Moravčíková, N.; Veselá, Z.; Vrtková, I.; Novotná, A.; Kasarda, R. Genetic diversity and admixture in three native draught horse breeds assessed using microsatellite markers. Czech. J. Anim. Sci. 2018, 63, 85–93. [Google Scholar] [CrossRef]
- Aberle, K.S.; Hamann, H.; Drögemüller, C.; Distl, O. Genetic diversity in German draught horse breeds compared with a group of primitive, riding and wild horses by means of microsatellite DNA markers. Anim. Genet. 2004, 35, 270–277. [Google Scholar] [CrossRef]
- Khanshour, A.; Juras, R.; Blackburn, R.; Cithran, E.G. The Legend of the Canadian Horse: Genetic Diversity and Breed Origin. J. Hered. 2014, 106, 37–44. [Google Scholar] [CrossRef]
- Juras, R.; Cothran, E.G.; Klimas, R. Genetic Analysis of Three Lithuanian Native Horse Breeds. Acta. Agric. Scand. 2010, 53, 180–185. [Google Scholar] [CrossRef]
- Sild, E.; Rooni, K.; Värv, S.; Røed, K.; Popov, R.; Kantanen, J.; Viinalass, H. Genetic diversity of Estonian horse breeds and their genetic affinity to northern European and some Asian breeds. Livest. Sci. 2018, 220, 57–66. [Google Scholar] [CrossRef]
- Vostrý, L.; Kracíková, O.; Hofmanová, B.; Czerneková, V.; Kott, T.; Přibyl, J. Intra-line and inter-line genetic diversity in sire lines of the Old Kladruber horse based on microsatellite analysis of DNA. Czech. J. Anim. Sci. 2011, 56, 163–175. [Google Scholar] [CrossRef]
- Ogrizek, A.; Hrasnica, F. Specjalno Stočarstvo. I dio. Uzgoj Konja; Poljoprivredni nakladni zavod: Zagreb, Croatia, 1952; pp. 234–236. [Google Scholar]


| Item | Total |
|---|---|
| Original dataset (TP; total population) | 28,483 |
| Reference population 1 (REF 01; animal with both parents known) | 25,263 |
| Reference population 2 (REF 02; live animals) | 5854 |
| Number of founders contributing to reference (REF 01) population | 1486 |
| Effective number of founders (fe) | 138 |
| Effective population size of founders | 162.56 |
| Number of ancestors contributing to reference (REF 01) population | 1435 |
| Effective number of ancestors (fa) | 107 |
| Number of ancestors explaining 50% of genetic variability | 46 |
| Effective number of founders/effective number of ancestors (fe/fa) | 1.29 |
| Number of founder herds in reference population (fh) | 466 |
| Effective number of founder herds for the reference population | 61.90 |
| Effective population size (Ne) | 438.71 |
| Effective population size reference REF 02 population (computed via individual increase in inbreeding) | 170.89 |
| Mean inbreeding (F) | 0.85 |
| Mean Average Relatedness coefficient (AR) | 1.08 |
| Genetic Conservation Index (GCI) | 4.46 |
| Mean number of maximum generations | 3.83 |
| Mean number of equivalent generations | 2.42 |
| Mean number of complete generations | 1.66 |
| Pathway | n | Mean ± SD | SE |
|---|---|---|---|
| Average age | |||
| Father—son | 445 | 6.78 ± 2.565 A | 0.122 |
| Father—daughter | 4734 | 7.17 ± 2.734 B | 0.034 |
| Mother—son | 442 | 8.29 ± 4.079 C | 0.194 |
| Mother—daughter | 4934 | 8.10 ± 4.146 C | 0.059 |
| Overall | 10,555 | 7.63 ± 3.550 | 0.035 |
| Generation interval | |||
| Father—son | 12,074 | 8.07 ± 3.090 a,A | 0.028 |
| Father—daughter | 13,521 | 7.99 ± 3.083 b,A | 0.026 |
| Mother—son | 12,896 | 8.35 ± 4.273 B | 0.038 |
| Mother—daughter | 14,254 | 8.37 ± 4.197 B | 0.035 |
| Overall | 52,745 | 8.20 ± 3.725 | 0.016 |
| Locus | NA | Ho | HE | PIC | I | Irel(%) | HWE | F(null) | FIS |
|---|---|---|---|---|---|---|---|---|---|
| AHT4 | 8 | 0.767 | 0.712 | 0.670 | 1.494 | 71.85 | ns | −0.040 | −0.076 * |
| AHT5 | 7 | 0.774 | 0.768 | 0.740 | 1.655 | 85.09 | ns | −0.009 | −0.006 |
| ASB17 | 13 | 0.884 | 0.837 | 0.822 | 2.096 | 81.75 | ns | −0.029 | −0.054 * |
| ASB2 | 8 | 0.818 | 0.791 | 0.760 | 1.681 | 80.84 | ns | −0.019 | −0.033 |
| ASB23 | 9 | 0.795 | 0.777 | 0.744 | 1.727 | 78.56 | ns | −0.014 | −0.021 |
| HMS2 | 9 | 0.736 | 0.764 | 0.735 | 1.706 | 77.61 | ns | 0.022 | 0.038 |
| HMS3 | 6 | 0.733 | 0.731 | 0.688 | 1.483 | 82.86 | ns | −0.002 | −0.001 |
| HMS6 | 7 | 0.753 | 0.722 | 0.675 | 1.426 | 73.32 | ns | −0.022 | −0.042 |
| HMS7 | 7 | 0.668 | 0.678 | 0.630 | 1.352 | 69.51 | ns | 0.011 | 0.016 |
| HTG10 | 10 | 0.836 | 0.801 | 0.774 | 1.831 | 79.52 | ns | −0.024 | −0.042 |
| HTG4 | 6 | 0.750 | 0.737 | 0.697 | 1.490 | 83.25 | ns | −0.010 | −0.015 |
| HTG6 | 6 | 0.318 | 0.311 | 0.301 | 0.719 | 40.17 | ns | −0.003 | −0.022 |
| HTG7 | 5 | 0.712 | 0.745 | 0.699 | 1.413 | 87.79 | ns | 0.024 | 0.046 |
| VHL20 | 10 | 0.842 | 0.839 | 0.820 | 2.000 | 86.86 | ns | −0.003 | −0.002 |
| Average | 7.9 | 0.730 | 0.731 | 0.697 | 1.577 | 73.78 | −0.015 |
Publisher’s Note: MDPI stays neutral with regard to jurisdictional claims in published maps and institutional affiliations. |
© 2021 by the authors. Licensee MDPI, Basel, Switzerland. This article is an open access article distributed under the terms and conditions of the Creative Commons Attribution (CC BY) license (https://creativecommons.org/licenses/by/4.0/).
Share and Cite
Ivanković, A.; Bittante, G.; Konjačić, M.; Kelava Ugarković, N.; Pećina, M.; Ramljak, J. Evaluation of the Conservation Status of the Croatian Posavina Horse Breed Based on Pedigree and Microsatellite Data. Animals 2021, 11, 2130. https://doi.org/10.3390/ani11072130
Ivanković A, Bittante G, Konjačić M, Kelava Ugarković N, Pećina M, Ramljak J. Evaluation of the Conservation Status of the Croatian Posavina Horse Breed Based on Pedigree and Microsatellite Data. Animals. 2021; 11(7):2130. https://doi.org/10.3390/ani11072130
Chicago/Turabian StyleIvanković, Ante, Giovanni Bittante, Miljenko Konjačić, Nikolina Kelava Ugarković, Mateja Pećina, and Jelena Ramljak. 2021. "Evaluation of the Conservation Status of the Croatian Posavina Horse Breed Based on Pedigree and Microsatellite Data" Animals 11, no. 7: 2130. https://doi.org/10.3390/ani11072130
APA StyleIvanković, A., Bittante, G., Konjačić, M., Kelava Ugarković, N., Pećina, M., & Ramljak, J. (2021). Evaluation of the Conservation Status of the Croatian Posavina Horse Breed Based on Pedigree and Microsatellite Data. Animals, 11(7), 2130. https://doi.org/10.3390/ani11072130