
Characterization of an Ex Vivo Equine Endometrial Tissue Culture Model Using Next-Generation RNA-Sequencing Technology

 ,
,  ,
,
Abstract
:Simple Summary
Abstract
1. Introduction
2. Materials and Methods
2.1. Animals and Sample Collection
2.2. Endometrial Cytology, Histology and Tissue Culture
2.3. RNA Extraction, Quantification and Sequencing
2.4. Data Processing and Gene Expression Analysis
3. Results
4. Discussion
5. Conclusions
Supplementary Materials
Author Contributions
Funding
Institutional Review Board Statement
Data Availability Statement
Acknowledgments
Conflicts of Interest
References
- Watson, E.D. Post-breeding endometritis in the mare. Anim. Reprod. Sci. 2000, 60–61, 221–232. [Google Scholar] [CrossRef]
- Traub-Dargatz, J.L.; Salman, M.D.; Voss, J.L. Medical problems of adult horses, as ranked by equine practitioners. J. Am. Vet. Med. Assoc. 1991, 198, 1745–1747. [Google Scholar]
- Allen, W.R.; Brown, L.; Wright, M.; Wilsher, S. Reproductive efficiency of Flatrace and National Hunt Thoroughbred mares and stallions in England. Equine Vet. J. 2007, 39, 438–445. [Google Scholar] [CrossRef]
- Ball, B.A.; Little, T.V.; Hillman, R.B.; Woods, G.L. Pregnancy rates at Days 2 and 14 and estimated embryonic loss rates prior to day 14 in normal and subfertile mares. Theriogenol. 1986, 26, 611–619. [Google Scholar] [CrossRef]
- Weatherbys. Weatherbys Return of Mares. Available online: https://www.weatherbys.co.uk/news/october-2019/weatherbys-return-of-mares-2019 (accessed on 27 February 2020).
- Zent, W.W.; Troedsson, M.H.; Xue, J.-L. Postbreeding uterine fluid accumulation in a normal population of Thoroughbred mares: A field study. Proc. Am. Assoc. Equine Pract. 1998, 44, 64–65. [Google Scholar]
- Pycock, J.F.; Newcombe, J.R. The relationship between intraluminal uterine fluid, endometritis, and pregnancy rate in the mare. Equine Pract. 1996, 18, 19–22. [Google Scholar]
- Penrod, L.V.; Allen, R.E.; Turner, J.L.; Limesand, S.W.; Arns, M.J. Effects of oxytocin, lipopolysaccharide (LPS), and polyunsaturated fatty acids on prostaglandin secretion and gene expression in equine endometrial explant cultures. Domest. Anim. Endocrinol. 2013, 44, 46–55. [Google Scholar] [CrossRef] [PubMed]
- Ealy, A.D.; Eroh, M.L.; Sharp, D.C., 3rd. Prostaglandin H synthase Type 2 is differentially expressed in endometrium based on pregnancy status in pony mares and responds to oxytocin and conceptus secretions in explant culture. Anim. Reprod. Sci. 2010, 117, 99–105. [Google Scholar] [CrossRef] [PubMed]
- Nash, D.M.; Sheldon, I.M.; Herath, S.; Lane, E.A. Markers of the uterine innate immune response of the mare. Anim. Reprod. Sci. 2010, 119, 31–39. [Google Scholar] [CrossRef] [PubMed]
- Borges, A.M.; Healey, G.D.; Sheldon, I.M. Explants of intact endometrium to model bovine innate immunity and inflammation ex vivo. Am. J. Reprod. Immunol. 2012, 67, 526–539. [Google Scholar] [CrossRef] [PubMed]
- Krysko, D.V.; Agostinis, P.; Krysko, O.; Garg, A.D.; Bachert, C.; Lambrecht, B.N.; Vandenabeele, P. Emerging role of damage-associated molecular patterns derived from mitochondria in inflammation. Trends Immunol. 2011, 32, 157–164. [Google Scholar] [CrossRef]
- Chen, G.Y.; Nuñez, G. Sterile inflammation: Sensing and reacting to damage. Nat. Rev. Immunol. 2010, 10, 826–837. [Google Scholar] [CrossRef] [Green Version]
- Saut, J.P.; Healey, G.D.; Borges, A.M.; Sheldon, I.M. Ovarian steroids do not affect bovine endometrial cytokine or chemokine responses to Escherichia coli or LPS in vitro. Reproduction 2014, 148, 593–606. [Google Scholar] [CrossRef] [Green Version]
- Nash, D.; Lane, E.; Herath, S.; Sheldon, I.M. Endometrial explant culture for characterizing equine endometritis. Am. J. Reprod. Immunol. 2008, 59, 105–117. [Google Scholar] [CrossRef]
- Nash, D.M.; Paddison, J.; Davies Morel, M.C.G.; Barnea, E.R. Preimplantation factor modulates acute inflammatory responses of equine endometrium. Vet. Med. Sci. 2018, 4, 351–356. [Google Scholar] [CrossRef] [Green Version]
- Schwinghamer, R.; Massolo, A.; Knight, C.; Klein, C. Equine Endometrial Explants Undergo Significant Degenerative Changes in Culture. Anat. Rec. 2018, 301, 148–153. [Google Scholar] [CrossRef] [Green Version]
- Squires, E.L.; McKinnon, A.O.; Shideler, R.K. Use of ultrasonography in reproductive management of mares. Theriogenology 1988, 29, 55–70. [Google Scholar] [CrossRef]
- Ginther, O.J.; Pierson, R.A. Ultrasonic evaluation of the reproductive tract of the mare; principles, equipment, and techniques. J. Equine Vet. Sci. 1983, 3, 195–201. [Google Scholar] [CrossRef]
- De Amorim, M.D.; Gartley, C.J.; Foster, R.A.; Hill, A.; Scholtz, E.L.; Hayes, A.; Chenier, T.S. Comparison of Clinical Signs, Endometrial Culture, Endometrial Cytology, Uterine Low-Volume Lavage, and Uterine Biopsy and Combinations in the Diagnosis of Equine Endometritis. J. Equine Vet. Sci. 2016, 44, 54–61. [Google Scholar] [CrossRef]
- LeBlanc, M.M. Uterine Citology. In Equine Reproduction; McKinnon, A.O., Squires, E.L., Vaala, E., Varner, D.D., Eds.; Wiley-Blackwell: London, UK, 2011; pp. 1922–1928. [Google Scholar]
- Brook, D. Uterine culture in mares. Mod. Vet. Pract. 1984, 65, A3–A8. [Google Scholar]
- Knudsen, O. Endometrial cytology as a diagnostic aid in mares. Cornell Vet. 1964, 54, 415–422. [Google Scholar]
- Riddle, W.T.; LeBlanc, M.M.; Stromberg, A.J. Relationships between uterine culture, cytology and pregnancy rates in a Thoroughbred practice. Theriogenology 2007, 68, 395–402. [Google Scholar] [CrossRef]
- Kenney, R.; Doig, P. Equine endometrial biopsy. Curr. Ther. Theriogenol. 1986, 2, 723–729. [Google Scholar]
- Andrews, S. A Quality Control Tool for High Throughput Sequence Data. 2010. Available online: http://www.bioinformatics.babraham.ac.uk/projects/fastqc/ (accessed on 21 June 2021).
- Bolger, A.M.; Lohse, M.; Usadel, B. Trimmomatic: A flexible trimmer for Illumina sequence data. Bioinformatics 2014, 30, 2114–2120. [Google Scholar] [CrossRef] [Green Version]
- Langmead, B.; Salzberg, S.L. Fast gapped-read alignment with Bowtie 2. Nat. Methods 2012, 9, 357–359. [Google Scholar] [CrossRef] [Green Version]
- Trapnell, C.; Pachter, L.; Salzberg, S.L. TopHat: Discovering splice junctions with RNA-Seq. Bioinformatics 2009, 25, 1105–1111. [Google Scholar] [CrossRef]
- Liao, Y.; Smyth, G.K.; Shi, W. featureCounts: An efficient general purpose program for assigning sequence reads to genomic features. Bioinformatics 2014, 30, 923–930. [Google Scholar] [CrossRef] [Green Version]
- Love, M.I.; Huber, W.; Anders, S. Moderated estimation of fold change and dispersion for RNA-seq data with DESeq2. Genome Biol. 2014, 15, 550. [Google Scholar] [CrossRef] [Green Version]
- Anders, S.; Huber, W. Differential expression analysis for sequence count data. Genome Biol. 2010, 11, 1–13. [Google Scholar] [CrossRef] [Green Version]
- Benjamini, Y.; Hochberg, Y. Controlling the False Discovery Rate: A Practical and Powerful Approach to Multiple Testing. J. R. Stat. Soc. Ser. B 1995, 57, 289–300. [Google Scholar] [CrossRef]
- Szklarczyk, D.; Franceschini, A.; Wyder, S.; Forslund, K.; Heller, D.; Huerta-Cepas, J.; Simonovic, M.; Roth, A.; Santos, A.; Tsafou, K.P.; et al. STRING v10: Protein-protein interaction networks, integrated over the tree of life. Nucleic Acids Res. 2015, 43, D447–D452. [Google Scholar] [CrossRef] [PubMed]
- Kanehisa, M.; Goto, S. KEGG: Kyoto encyclopedia of genes and genomes. Nucleic Acids Res. 2000, 28, 27–30. [Google Scholar] [CrossRef] [PubMed]
- Hla, T.; Neilson, K. Human cyclooxygenase-2 cDNA. Proc. Natl. Acad. Sci. USA 1992, 89, 7384–7388. [Google Scholar] [CrossRef] [PubMed] [Green Version]
- Tamura, R.E.; de Vasconcellos, J.F.; Sarkar, D.; Libermann, T.A.; Fisher, P.B.; Zerbini, L.F. GADD45 proteins: Central players in tumorigenesis. Curr. Mol. Med. 2012, 12, 634–651. [Google Scholar] [CrossRef]
- Oda, E.; Ohki, R.; Murasawa, H.; Nemoto, J.; Shibue, T.; Yamashita, T.; Tokino, T.; Taniguchi, T.; Tanaka, N. Noxa, a BH3-only member of the Bcl-2 family and candidate mediator of p53-induced apoptosis. Science 2000, 288, 1053–1058. [Google Scholar] [CrossRef]
- Balkwill, F. Tumour necrosis factor and cancer. Nat. Rev. Cancer 2009, 9, 361–371. [Google Scholar] [CrossRef]
- Leeuwenberg, J.F.; Smeets, E.F.; Neefjes, J.J.; Shaffer, M.A.; Cinek, T.; Jeunhomme, T.M.; Ahern, T.J.; Buurman, W.A. E-selectin and intercellular adhesion molecule-1 are released by activated human endothelial cells in vitro. Immunology 1992, 77, 543–549. [Google Scholar]
- Redl, H.; Dinges, H.P.; Buurman, W.A.; van der Linden, C.J.; Pober, J.S.; Cotran, R.S.; Schlag, G. Expression of endothelial leukocyte adhesion molecule-1 in septic but not traumatic/hypovolemic shock in the baboon. Am. J. Pathol. 1991, 139, 461–466. [Google Scholar]
- Kobayashi, T.; Kim, H.; Liu, X.; Sugiura, H.; Kohyama, T.; Fang, Q.; Wen, F.Q.; Abe, S.; Wang, X.; Atkinson, J.J.; et al. Matrix metalloproteinase-9 activates TGF-β and stimulates fibroblast contraction of collagen gels. Am. J. Physiol. Lung Cell Mol. Physiol. 2014, 306, L1006–L1015. [Google Scholar] [CrossRef] [Green Version]
- Vandooren, J.; Van den Steen, P.E.; Opdenakker, G. Biochemistry and molecular biology of gelatinase B or matrix metalloproteinase-9 (MMP-9): The next decade. Crit. Rev. Biochem. Mol. Biol. 2013, 48, 222–272. [Google Scholar] [CrossRef]
- Hirose, Y.; Chiba, K.; Karasugi, T.; Nakajima, M.; Kawaguchi, Y.; Mikami, Y.; Furuichi, T.; Mio, F.; Miyake, A.; Miyamoto, T.; et al. A functional polymorphism in THBS2 that affects alternative splicing and MMP binding is associated with lumbar-disc herniation. Am. J. Hum. Genet. 2008, 82, 1122–1129. [Google Scholar] [CrossRef] [Green Version]
- Gargioli, C.; Coletta, M.; De Grandis, F.; Cannata, S.M.; Cossu, G. PlGF-MMP-9-expressing cells restore microcirculation and efficacy of cell therapy in aged dystrophic muscle. Nat. Med. 2008, 14, 973–978. [Google Scholar] [CrossRef]
- Mohan, R.; Chintala, S.K.; Jung, J.C.; Villar, W.V.; McCabe, F.; Russo, L.A.; Lee, Y.; McCarthy, B.E.; Wollenberg, K.R.; Jester, J.V.; et al. Matrix metalloproteinase gelatinase B (MMP-9) coordinates and effects epithelial regeneration. J. Biol. Chem. 2002, 277, 2065–2072. [Google Scholar] [CrossRef] [Green Version]
- Theocharis, A.D.; Skandalis, S.S.; Gialeli, C.; Karamanos, N.K. Extracellular matrix structure. Adv. Drug Deliv. Rev. 2016, 97, 4–27. [Google Scholar] [CrossRef]
- Bonnans, C.; Chou, J.; Werb, Z. Remodelling the extracellular matrix in development and disease. Nat. Rev. Mol. Cell Biol. 2014, 15, 786–801. [Google Scholar] [CrossRef]
- Michel, G.; Tonon, T.; Scornet, D.; Cock, J.M.; Kloareg, B. The cell wall polysaccharide metabolism of the brown alga Ectocarpus siliculosus. Insights into the evolution of extracellular matrix polysaccharides in Eukaryotes. New Phytol. 2010, 188, 82–97. [Google Scholar] [CrossRef]
- Clause, K.C.; Barker, T.H. Extracellular matrix signaling in morphogenesis and repair. Curr. Opin. Biotechnol. 2013, 24, 830–833. [Google Scholar] [CrossRef] [Green Version]
- Frantz, C.; Stewart, K.M.; Weaver, V.M. The extracellular matrix at a glance. J. Cell Sci. 2010, 123, 4195–4200. [Google Scholar] [CrossRef] [Green Version]
- Gaudet, A.D.; Popovich, P.G. Extracellular matrix regulation of inflammation in the healthy and injured spinal cord. Exp. Neurol 2014, 258, 24–34. [Google Scholar] [CrossRef] [Green Version]
- Piccinini, A.M.; Midwood, K.S. DAMPening inflammation by modulating TLR signalling. Mediat. Inflamm. 2010, 2010. [Google Scholar] [CrossRef] [Green Version]
- Bianchi, M.E. DAMPs, PAMPs and alarmins: All we need to know about danger. J. Leukoc. Biol. 2007, 81, 1–5. [Google Scholar] [CrossRef] [PubMed]
- Imagawa, K.; de Andrés, M.C.; Hashimoto, K.; Itoi, E.; Otero, M.; Roach, H.I.; Goldring, M.B.; Oreffo, R.O. Association of reduced type IX collagen gene expression in human osteoarthritic chondrocytes with epigenetic silencing by DNA hypermethylation. Arthritis Rheumatol. 2014, 66, 3040–3051. [Google Scholar] [CrossRef] [Green Version]
- Ma, J.; Chen, T.; Mandelin, J.; Ceponis, A.; Miller, N.E.; Hukkanen, M.; Ma, G.F.; Konttinen, Y.T. Regulation of macrophage activation. Cell Mol. Life Sci. 2003, 60, 2334–2346. [Google Scholar] [CrossRef]
- Posthumus, M.; September, A.V.; O’Cuinneagain, D.; van der Merwe, W.; Schwellnus, M.P.; Collins, M. The COL5A1 gene is associated with increased risk of anterior cruciate ligament ruptures in female participants. Am. J. Sports Med. 2009, 37, 2234–2240. [Google Scholar] [CrossRef]
- Willumsen, N.; Karsdal, M.A. Type XX Collagen. In Biochemistry of Collagens, Laminins and Elastin; Karsdal, M.A., Ed.; Academic Press: Cambridge, MA, USA, 2016; Chapter 20; pp. 127–129. [Google Scholar]
- Fina, D.; Franzè, E.; Rovedatti, L.; Corazza, G.R.; Biancone, L.; Sileri, P.P.; Sica, G.; MacDonald, T.T.; Pallone, F.; Di Sabatino, A.; et al. Interleukin-25 production is differently regulated by TNF-α and TGF-β1 in the human gut. Mucosal Immunol. 2011, 4, 239–244. [Google Scholar] [CrossRef] [Green Version]
- Dinarello, C.A. Interleukin-1 in the pathogenesis and treatment of inflammatory diseases. Blood 2011, 117, 3720–3732. [Google Scholar] [CrossRef] [PubMed] [Green Version]
- Poindexter, N.J.; Walch, E.T.; Chada, S.; Grimm, E.A. Cytokine induction of interleukin-24 in human peripheral blood mononuclear cells. J. Leukoc. Biol. 2005, 78, 745–752. [Google Scholar] [CrossRef]
- Wang, M.; Liang, P. Interleukin-24 and its receptors. Immunology 2005, 114, 166–170. [Google Scholar] [CrossRef] [PubMed]
- Memari, B.; Bouttier, M.; Dimitrov, V.; Ouellette, M.; Behr, M.A.; Fritz, J.H.; White, J.H. Engagement of the Aryl Hydrocarbon Receptor in Mycobacterium tuberculosis—Infected Macrophages Has Pleiotropic Effects on Innate Immune Signaling. J. Immunol. 2015, 195, 4479–4491. [Google Scholar] [CrossRef] [Green Version]
- Garlet, G.P.; Martins, W., Jr.; Ferreira, B.R.; Milanezi, C.M.; Silva, J.S. Patterns of chemokines and chemokine receptors expression in different forms of human periodontal disease. J. Periodontal Res. 2003, 38, 210–217. [Google Scholar] [CrossRef] [PubMed]
- Mor, A.; Salto, M.S.; Katav, A.; Barashi, N.; Edelshtein, V.; Manetti, M.; Levi, Y.; George, J.; Matucci-Cerinic, M. Blockade of CCL24 with a monoclonal antibody ameliorates experimental dermal and pulmonary fibrosis. Ann. Rheum Dis. 2019, 78, 1260–1268. [Google Scholar] [CrossRef] [PubMed]
- Raposo, C.G.; Marín, A.P.; Barón, M.G. Colony-stimulating factors: Clinical evidence for treatment and prophylaxis of chemotherapy-induced febrile neutropenia. Clin. Transl. Oncol. 2006, 8, 729–734. [Google Scholar] [CrossRef]
- Liu, X.L.; Hu, X.; Cai, W.X.; Lu, W.W.; Zheng, L.W. Effect of Granulocyte-Colony Stimulating Factor on Endothelial Cells and Osteoblasts. BioMed Res. Int. 2016, 2016, 8485721. [Google Scholar] [CrossRef] [Green Version]
- Pankov, R.; Yamada, K.M. Fibronectin at a glance. J. Cell Sci. 2002, 115, 3861–3863. [Google Scholar] [CrossRef] [PubMed] [Green Version]
- Williams, C.M.; Engler, A.J.; Slone, R.D.; Galante, L.L.; Schwarzbauer, J.E. Fibronectin expression modulates mammary epithelial cell proliferation during acinar differentiation. Cancer Res. 2008, 68, 3185–3192. [Google Scholar] [CrossRef] [Green Version]


| Time Point Comparison | Number of Genes Expressed | Number of DEGs | Upregulated Genes | Downregulated Genes |
|---|---|---|---|---|
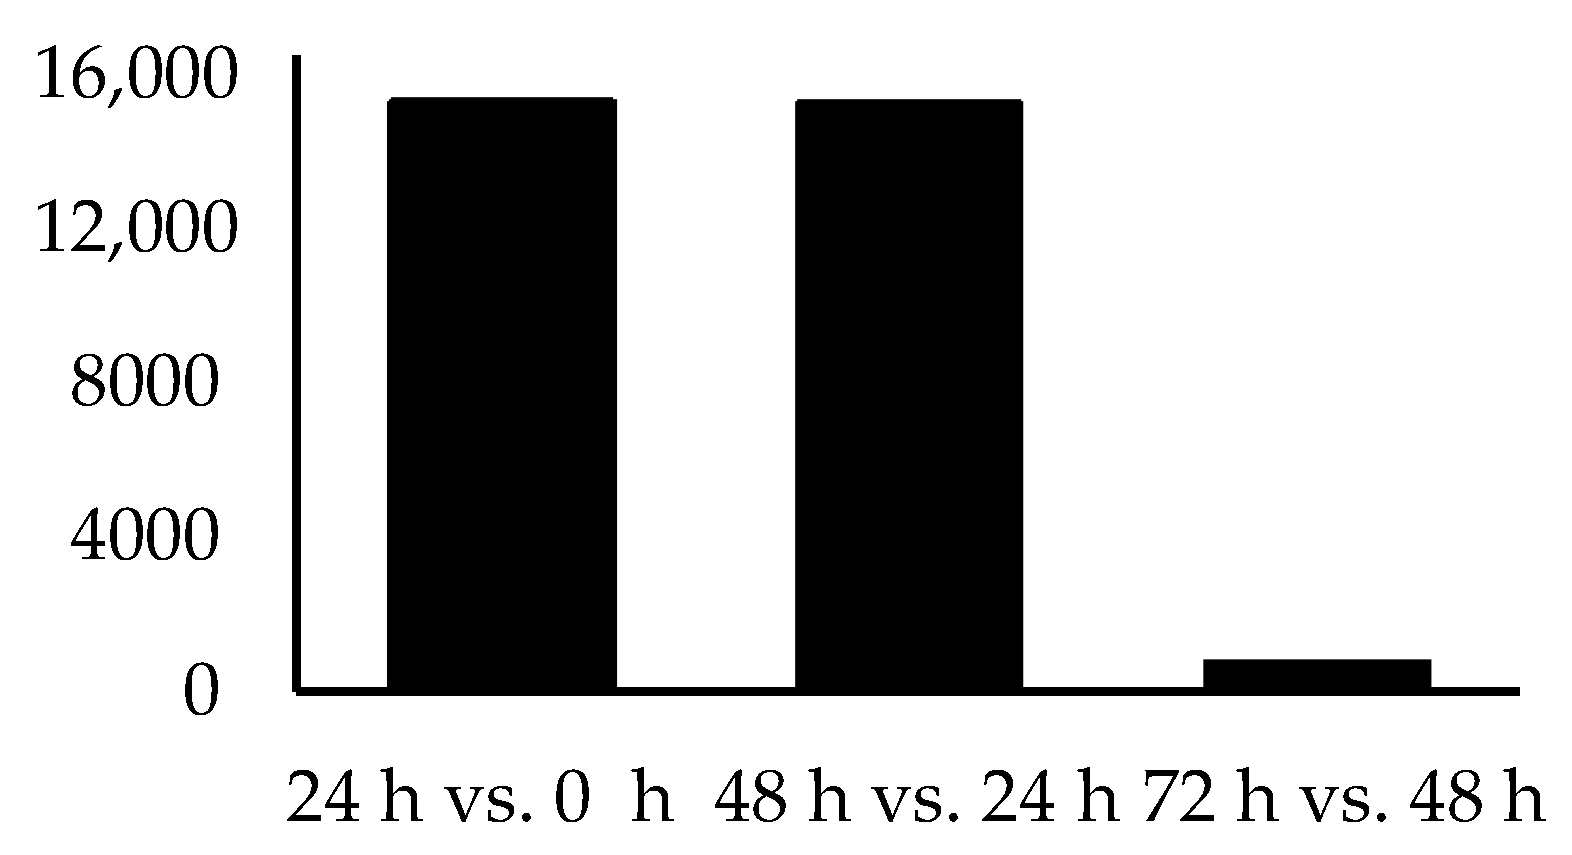
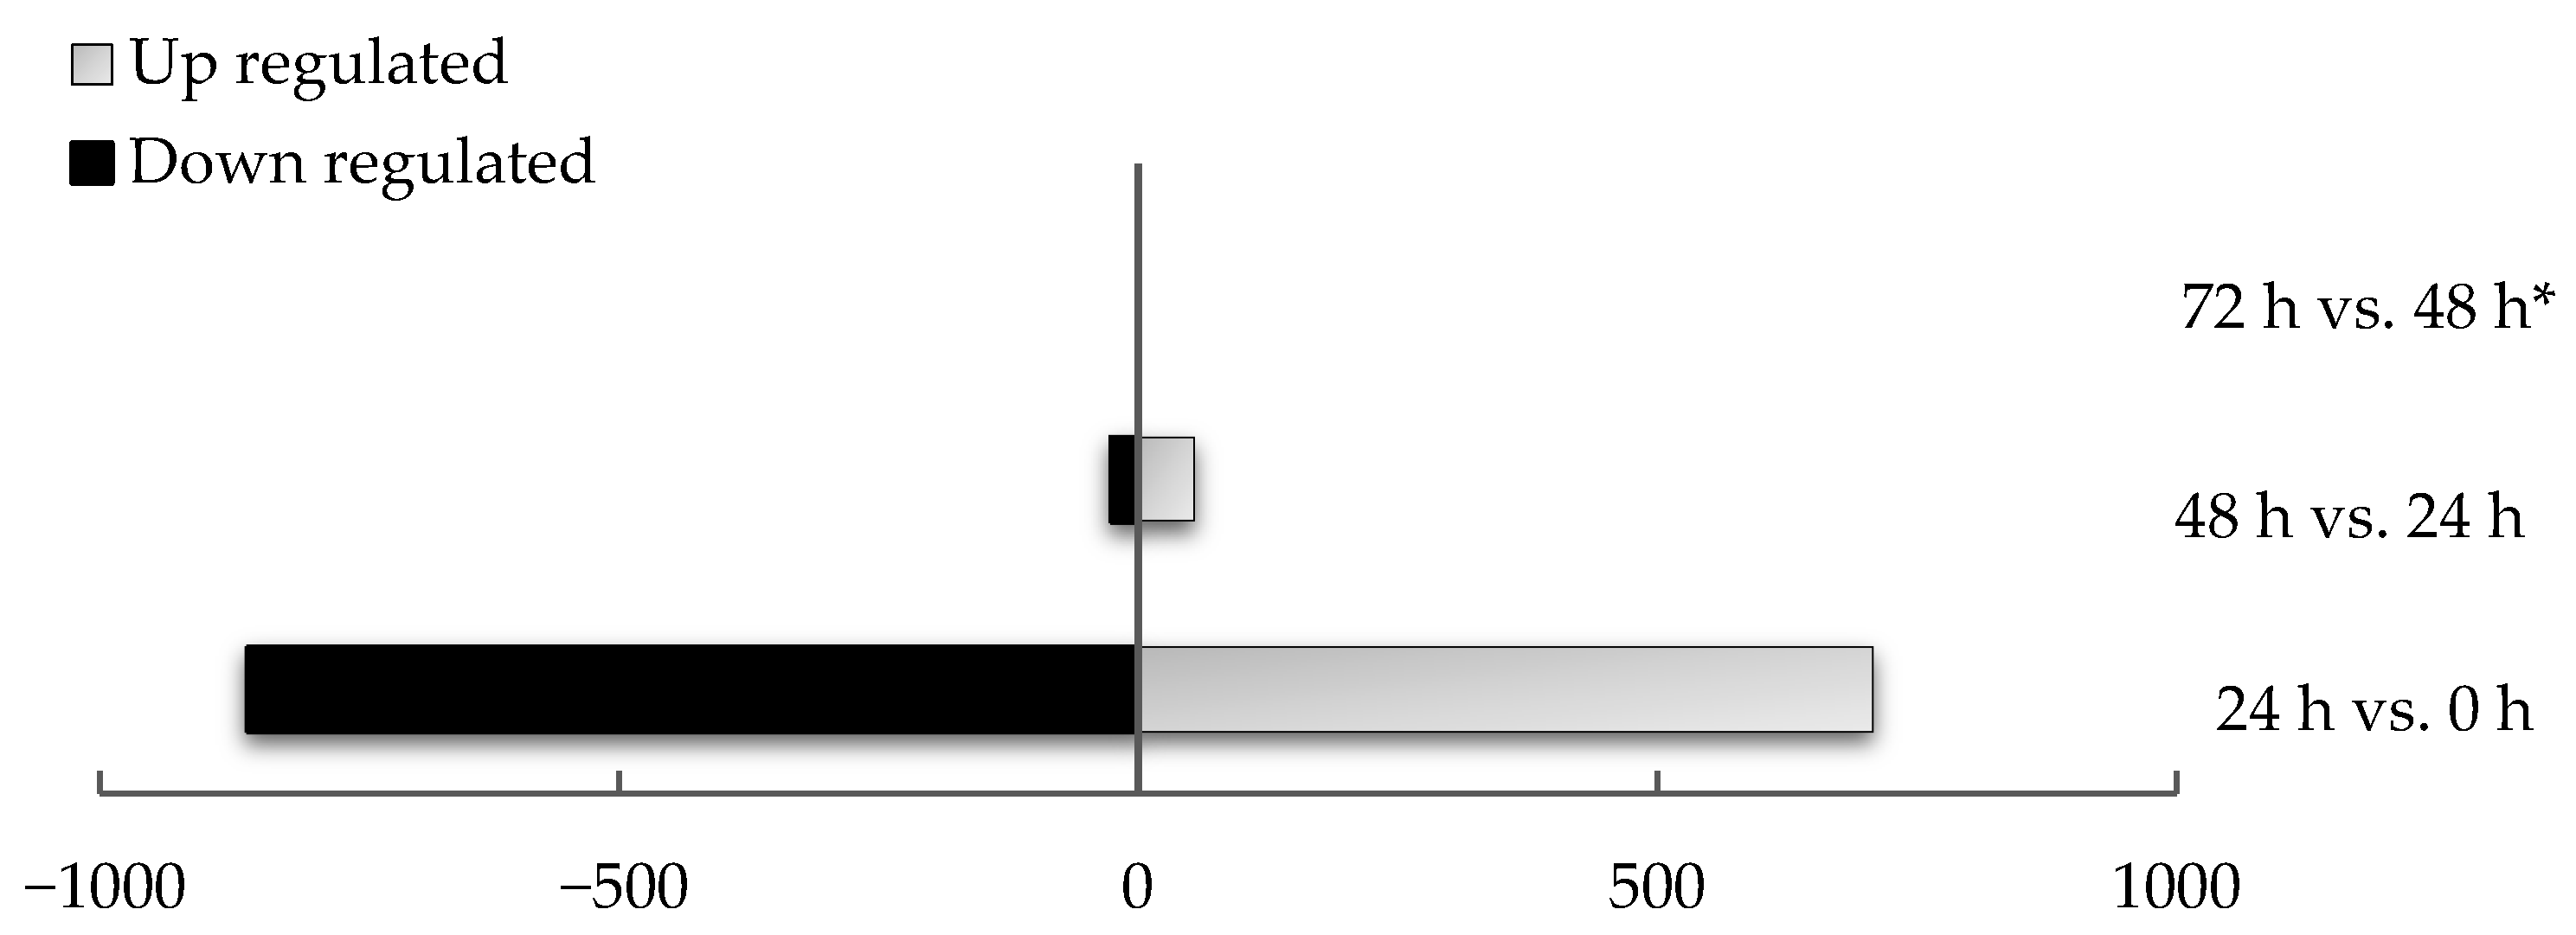
| 24 h vs. 0 h | 15,326 | 1566 | 707 | 859 |
| 48 h vs. 24 h | 15,290 | 80 | 53 | 27 |
| 72 h vs. 48 h | 804 | 0 | 0 | 0 |
| Pathway Code a | Description b | Count c | FDR p-Value d |
|---|---|---|---|
| 4610 | Complement and coagulation cascades | 27 | 1.27 × 10⁻⁹ |
| 4512 | ECM-receptor interaction | 27 | 3.74 × 10⁻⁷ |
| 4066 | HIF-1 signaling pathway | 29 | 5.20 × 10⁻⁷ |
| 4060 | Cytokine-cytokine receptor interaction | 43 | 7.61 × 10⁻⁷ |
| 4151 | PI3K-Akt signaling pathway | 55 | 2.48 × 10⁻⁵ |
| 4510 | Focal adhesion | 39 | 1.58 × 10⁻⁴ |
| 4668 | TNF signaling pathway | 22 | 2.12 ×10⁻³ |
| Pathway Code a | Description b | Count c | FDR p-Value d |
|---|---|---|---|
| 4110 | Cell cycle | 6 | 0.007 |
| 4114 | Oocyte meiosis | 5 | 0.016 |
| 4630 | Jak-STAT signalling pathway | 5 | 0.036 |
| 4512 | ECM-receptor interaction | 4 | 0.040 |
| 4914 | Progesterone-mediated oocyte maturation | 4 | 0.040 |
Publisher’s Note: MDPI stays neutral with regard to jurisdictional claims in published maps and institutional affiliations. |
© 2021 by the authors. Licensee MDPI, Basel, Switzerland. This article is an open access article distributed under the terms and conditions of the Creative Commons Attribution (CC BY) license (https://creativecommons.org/licenses/by/4.0/).
Share and Cite
Monteiro de Barros, M.R.; Davies-Morel, M.C.G.; Mur, L.A.J.; Creevey, C.J.; Alison, R.H.; Nash, D.M. Characterization of an Ex Vivo Equine Endometrial Tissue Culture Model Using Next-Generation RNA-Sequencing Technology. Animals 2021, 11, 1995. https://doi.org/10.3390/ani11071995
Monteiro de Barros MR, Davies-Morel MCG, Mur LAJ, Creevey CJ, Alison RH, Nash DM. Characterization of an Ex Vivo Equine Endometrial Tissue Culture Model Using Next-Generation RNA-Sequencing Technology. Animals. 2021; 11(7):1995. https://doi.org/10.3390/ani11071995
Chicago/Turabian StyleMonteiro de Barros, Maithê R., Mina C. G. Davies-Morel, Luis A. J. Mur, Christopher J. Creevey, Roger H. Alison, and Deborah M. Nash. 2021. "Characterization of an Ex Vivo Equine Endometrial Tissue Culture Model Using Next-Generation RNA-Sequencing Technology" Animals 11, no. 7: 1995. https://doi.org/10.3390/ani11071995
APA StyleMonteiro de Barros, M. R., Davies-Morel, M. C. G., Mur, L. A. J., Creevey, C. J., Alison, R. H., & Nash, D. M. (2021). Characterization of an Ex Vivo Equine Endometrial Tissue Culture Model Using Next-Generation RNA-Sequencing Technology. Animals, 11(7), 1995. https://doi.org/10.3390/ani11071995