
Evaluation of TiO2 Based Photocatalytic Treatment of Odor and Gaseous Emissions from Swine Manure with UV-A and UV-C

 ,
,  , , and
Abstract
Simple Summary
Abstract

1. Introduction
2. Materials and Methods
2.1. Materials and Methods
2.2. Generation of Odorous Gas Emissions from Swine Manure
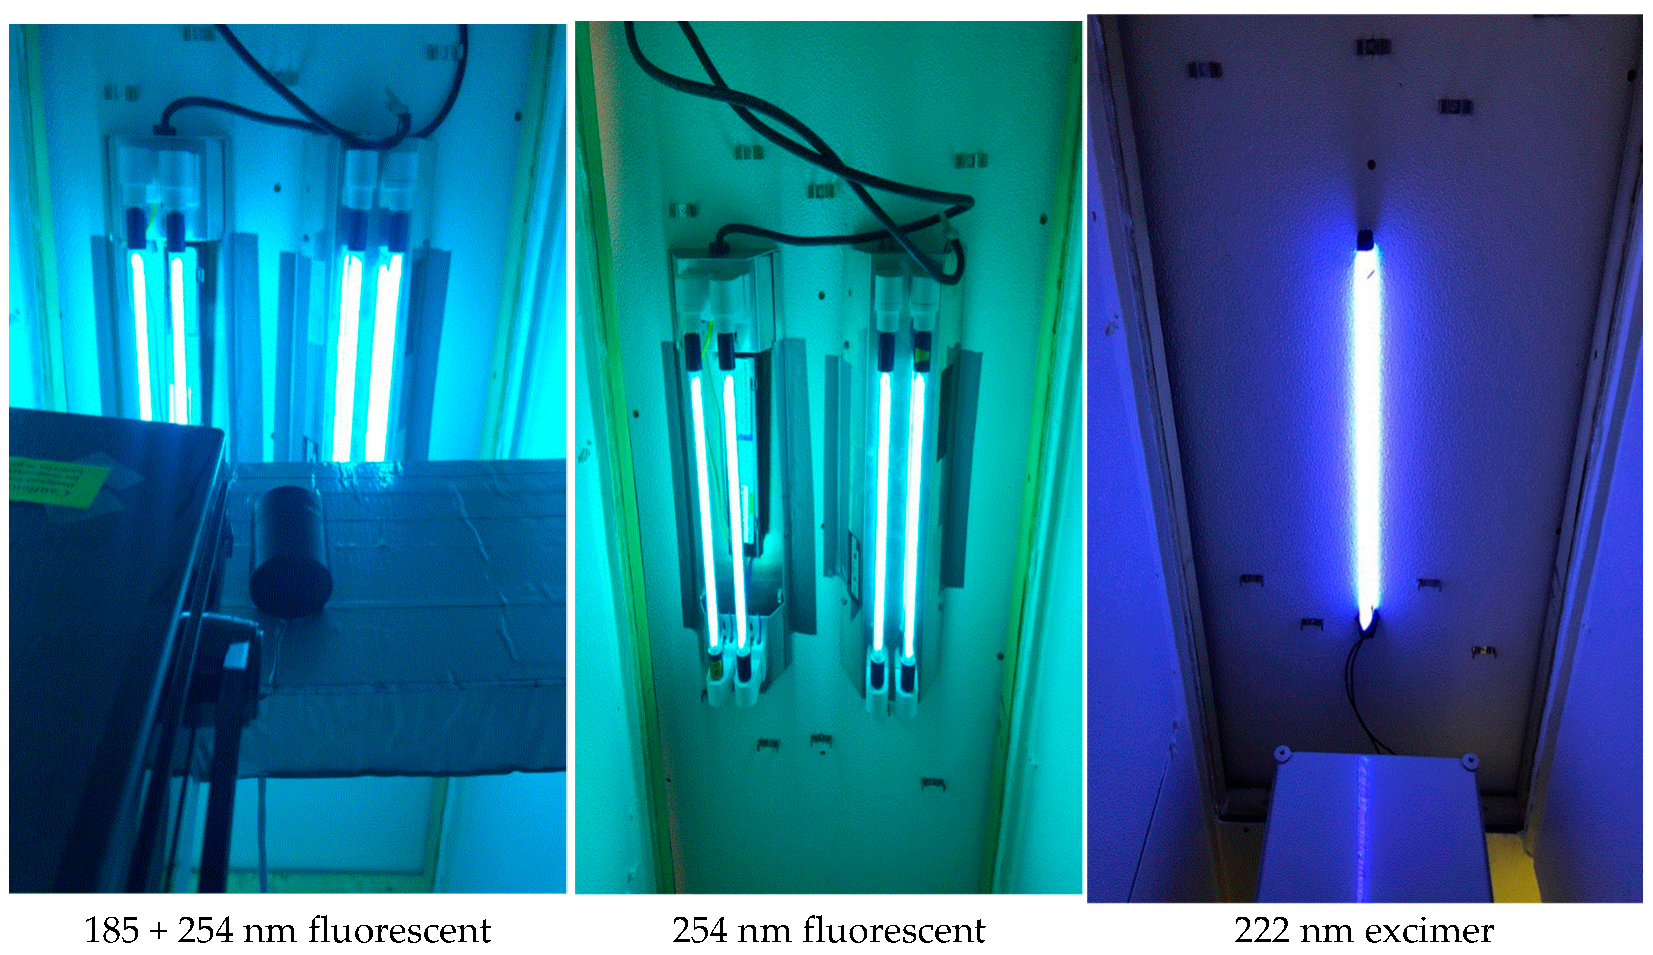
2.3. Tested UV Sources
2.4. The Light Intensity of Different UV Wavelength Lamps
2.5. Measurement of Odor
2.6. Measurement of Odorous Volatile Organic Compounds
2.7. Measurement of Ozone Concentrations
2.8. Measurement of Greenhouse Gas Concentrations
2.9. Measurement of Ammonia and Hydrogen Sulfide Concentrations
2.10. Evaluation of Treatment Effectiveness and Data Analysis
2.11. Statistical Analysis
3. Results
3.1. Mitigation of Targeted Gases as a Function of UV-A Dose Controlled by Light Intensity and Airflow Rate
3.1.1. Odor—Effects of UV-A Dose
3.1.2. Volatile Organic Compounds—Effects of UV-A Dose
3.1.3. Ozone—Effects of UV-A Dose
3.1.4. Greenhouse Gases—Effects of UV-A Dose
3.1.5. Ammonia and Hydrogen Sulfide—Effects of UV-A Dose
3.2. Comparison of the Mitigation of Targeted Gases as a Function of UV Wavelength
3.2.1. Odor—Effects of UV Wavelength
3.2.2. Volatile Organic Compounds—Effects of UV Wavelength
3.2.3. Ozone—Effects of UV Wavelength
3.2.4. Greenhouse Gases—Effects of UV Wavelength
3.2.5. Ammonia and Hydrogen Sulfide—Effects of UV Wavelength
4. Discussion
4.1. Summary of the UV-A Photocatalysis—Comparison with Previous Research
4.2. Summary of the UV-C Photocatalysis
4.3. Evaluation of UV Photocatalysis Based on TiO2 in the Livestock Environment
5. Conclusions
- 63% of odor,
- 51%, 51%, 53%, 67%, and 32% of acetic acid, propanoic acid, butanoic acid, p-cresol, and indole, respectively,
- 14% of nitrous oxide (N2O),
- 100% of O3, 6% of NH3, and
- 26% generation of CO2.
- 54% and 47% for p-cresol and indole, respectively,
- 25% of N2O,
- 71% of CH4, and
- 46% and 139% generation of CO2 and O3, respectively.
Supplementary Materials
Author Contributions
Funding
Institutional Review Board Statement
Informed Consent Statement
Data Availability Statement
Acknowledgments
Conflicts of Interest
Appendix A


References
- Maurer, D.L.; Koziel, J.A.; Harmon, J.D.; Hoff, S.J.; Rieck-Hinz, A.M.; Andersen, D.S. Summary of performance data for technologies to control gaseous, odor, and particulate emissions from livestock operations: Air management practices assessment tool (AMPAT). Data Brief 2016, 7, 1413–1429. [Google Scholar] [CrossRef] [PubMed]
- Air Management Practices Assessment Tool. Available online: https://www.extension.iastate.edu/ampat/animal-housing (accessed on 24 February 2021).
- Costa, A.; Chiarello, G.L.; Selli, E.; Guarino, M. Effects of TiO2 based photocatalytic paint on concentrations and emissions of pollutants and on animal performance in a swine weaning unit. J. Environ. Manag. 2012, 96, 86–90. [Google Scholar] [CrossRef] [PubMed]
- Guarino, M.; Costa, A.; Porro, M. Photocatalytic TiO2 coating—To reduce ammonia and greenhouse gases concentration and emission from animal husbandries. Bioresour. Technol. 2008, 99, 2650–2658. [Google Scholar] [CrossRef] [PubMed]
- Zhu, W.; Koziel, J.A.; Maurer, D.L. Mitigation of livestock odors using black light and a new titanium dioxide-based catalyst: Proof-of-concept. Atmosphere 2017, 8, 103. [Google Scholar] [CrossRef]
- Koziel, J.A.; Yang, X.; Cutler, T.; Zhang, S.; Zimmerman, J.J.; Hoff, S.J.; Jenks, W.S.; Laor, Y.; Ravid, U.; Armon, R. Mitigation of odor and pathogens from CAFOs with UV/TiO2: Exploring the cost effectiveness. In Proceedings of the Mitigating Air Emissions from Animal Feeding Operations Conference, Des Moines, IA, USA, 19–21 May 2008; pp. 169–173. [Google Scholar]
- Rockafellow, E.M.; Koziel, J.A.; Jenks, W.S. Laboratory-Scale Investigation of UV Treatment of Ammonia for Livestock and Poultry Barn Exhaust Applications. J. Environ. Qual. 2012, 41, 281–288. [Google Scholar] [CrossRef] [PubMed]
- Yang, X.; Koziel, J.A.; Laor, Y.; Zhu, W.; van Leeuwen, J.H.; Jenks, W.S.; Hoff, S.J.; Zimmerman, J.; Zhang, S.; Ravid, U. VOC Removal from Manure Gaseous Emissions with UV Photolysis and UV-TiO2 Photocatalysis. Catalysts 2020, 10, 607. [Google Scholar] [CrossRef]
- Lee, M.; Li, P.; Koziel, J.A.; Ahn, H.; Wi, J.; Chen, B.; Meiirkhanuly, Z.; Banik, C.; Jenks, W.S. Pilot-scale testing of UV-A light treatment for mitigation of NH3, H2S, GHGs, VOCs, odor, and O3 inside the poultry barn. Front. Chem. 2020, 8, 613. [Google Scholar] [CrossRef] [PubMed]
- Lee, M.; Wi, J.; Koziel, J.A.; Ahn, H.; Li, P.; Chen, B.; Meiirkhanuly, Z.; Banik, C.; Jenks, W. Effects of UV-A Light Treatment on Ammonia, Hydrogen Sulfide, Greenhouse Gases, and Ozone in Simulated Poultry Barn Conditions. Atmosphere 2020, 11, 283. [Google Scholar] [CrossRef]
- Maurer, D.L.; Koziel, J.A. On-farm pilot-scale testing of black ultraviolet light and photocatalytic coating for mitigation of odor, odorous VOCs, and greenhouse gases. Chemosphere 2019, 221, 778–784. [Google Scholar] [CrossRef] [PubMed]
- Li, P.; Koziel, J.A.; Zimmerman, J.J.; Zhang, J.; Cheng, T.Y.; Yim-Im, W.; Hoff, S.J. Mitigation of Airborne PRRSV Transmission with UV Light Treatment: Proof-of-Concept. Agriculture 2021, 11, 259. [Google Scholar] [CrossRef]
- Lee, M.; Koziel, J.A.; Murphy, W.; Jenks, W.S.; Fonken, B.; Storjohann, R.; Chen, B.; Li, P.; Banik, C.; Wahe, L. Design and testing of mobile laboratory for mitigation of gaseous emissions from livestock agriculture with photocatalysis. Int. J. Environ. Res. Public Health 2021, 18, 1523. [Google Scholar] [CrossRef] [PubMed]
- Lo, Y.C.M.; Koziel, J.A.; Cai, L.; Hoff, S.J.; Jenks, W.S.; Xin, H. Simultaneous Chemical and Sensory Characterization of Volatile Organic Compounds and Semi-Volatile Organic Compounds Emitted from Swine Manure using Solid Phase Microextraction and Multidimensional Gas Chromatography–Mass Spectrometry–Olfactometry. J. Environ. Qual. 2008, 37, 521–534. [Google Scholar] [CrossRef] [PubMed]
- Chen, B.; Koziel, J.A.; Banik, C.; Ma, H.; Lee, M.; Wi, J.; Meiirkhanuly, Z.; Andersen, D.S.; Białowiec, A.; Parker, D.B. Emissions from swine manure treated with current products for mitigation of odors and reduction of NH3, H2S, VOC, and GHG emissions. Data 2020, 5, 54. [Google Scholar] [CrossRef]
- Lee, M.; Koziel, J.A.; Murphy, W.; Jenks, W.S.; Chen, B.; Li, P.; Banik, C. Mitigation of Odor and Gaseous Emissions from Swine Barn with UV-A and UV-C Photocatalysis. Preprints 2021, 2021030629. [Google Scholar] [CrossRef]
- Yao, H.; Feilberg, A. Characterisation of photocatalytic degradation of odorous compounds associated with livestock facilities by means of PTR-MS. Chem. Eng. J. 2015, 277, 341–351. [Google Scholar] [CrossRef]
- Liu, Z.; Murphy, P.; Maghirang, R.; DeRouchey, J. Mitigation of air emissions from swine buildings through the photocatalytic technology using UV/TiO2. In Proceedings of the 2015 ASABE Annual International Meeting, New Orleans, LA, USA, 26–29 July 2015. [Google Scholar] [CrossRef]


| UV-A Dose (mJ/cm2) | Light Intensity (mW/cm2) | Treatment Time (s) | Control (OUE/m3) | Treatment (OUE/m3) | % Reduction (p-Value) |
|---|---|---|---|---|---|
| UV dose control with light intensity | |||||
| 1.3 | 0.14 | 9.5 | 378 ± 13 | 229 ± 75 | 39.4 (0.12) |
| 2.5 | 0.26 | 9.5 | 352 ± 8.0 | 239 ± 24 | 32.2 (0.04) |
| 3.9 | 0.41 | 9.5 | 653 ± 32 | 277 ± 22 | 57.5 (0.01) |
| UV dose control with treatment time | |||||
| 1.3 | 0.41 | 3.2 | 198 ± 59 | 234 ± 60 | −18.6 (0.61) |
| 2.0 | 0.41 | 4.8 | 212 ± 31 | 206 ± 75 | 2.9 (0.93) |
| UV dose control with light intensity and treatment time | |||||
| 5.8 * | 0.41 and 0.04 | 9.5 and 47.6 | 653 ± 9.2 | 243 ± 64 | 62.7 (<0.01) |
| Targeted VOCs | Percent Reduction (p-Value) | |||||
|---|---|---|---|---|---|---|
| UV-A Dose (mJ/cm2) (UV Light Intensity, mW/cm2 and Treatment Time, s) | ||||||
| 1.3 (0.14 and 9.5) | 1.3 (0.41 and 3.2) | 2.0 (0.41 and 4.8) | 2.5 (0.26 and 9.5) | 3.9 (0.41 and 9.5) | 5.8 * (0.41 + 0.04 & 9.5 + 47.6) | |
| DMDS | 29.3 (0.36) | 54.3 (0.12) | 41.9 (0.46) | 59.2 (0.07) | −21.8 (0.51) | 8.3 (0.92) |
| DMTS | −5.8 (0.96) | −5.6 (0.84) | −0.9 (0.99) | 11.5 (0.35) | 42.9 (0.07) | 49.4 (0.22) |
| Acetic acid | −1.3 (0.97) | −10.8 (0.85) | 23.9 (0.69) | −4.0 (0.91) | 48.6 (0.04) | 50.5 (0.04) |
| Propanoic acid | 12.7 (0.36) | 21.1 (0.07) | 72.9 (0.30) | 50.7 (0.01) | 76.7 (0.40) | 66.8 (0.45) |
| Isopentanoic acid | 29.4 (0.39) | 49.4 (0.27) | 54.2 (0.23) | 24.2 (0.70) | 41.9 (0.10) | 37.7 (0.27) |
| Butanoic acid | 1.5 (0.95) | 36.3 (0.04) | 35.8 (0.01) | 44.8 (<0.01) | 52.6 (0.04) | 47.9 (0.04) |
| Phenol | 39.1 (0.15) | 34.0 (0.07) | 63.1 (0.26) | −7.9 (0.86) | −28.1 (0.13) | −32.1 (0.44) |
| p-Cresol | −3.2 (0.96) | 36.1 (0.05) | −15.9 (0.84) | 41.3 (0.03) | 66.5 (0.03) | 58.6 (0.05) |
| Indole | 0.2 (0.99) | 4.0 (0.89) | 23.3 (0.61) | 21.5 (0.58) | 32.3 (0.02) | 20.0 (0.03) |
| Skatole | −9.2 (0.89) | 17.6 (0.06) | 6.4 (0.93) | 6.4 (0.93) | 70.0 (0.37) | 64.6 (0.45) |
| UV-A Dose (mJ/cm2) | Light Intensity (mW/cm2) | Treatment Time (s) | Control (ppb) | Treatment (ppb) | % Reduction (p-Value) |
|---|---|---|---|---|---|
| UV dose control with UV light intensity | |||||
| 1.3 | 0.14 | 9.5 | 2.9 ± 0.3 | 0.0 ± 0.0 | 100 (<0.01) |
| 2.5 | 0.26 | 9.5 | 3.8 ± 0.1 | 0.0 ± 0.0 | 100 (<0.01) |
| 3.9 | 0.41 | 9.5 | 9.5 ± 1.2 | 0.0 ± 0.0 | 100 (<0.01) |
| UV dose control with treatment time | |||||
| 1.3 | 0.41 | 3.2 | 5.8 ± 2.0 | 0.0 ± 0.0 | 100 (<0.01) |
| 2.0 | 0.41 | 4.8 | 2.3 ± 0.2 | 0.0 ± 0.0 | 100 (<0.01) |
| UV dose control with UV light intensity and treatment time | |||||
| 5.8 * | 0.41 and 0.04 | 9.5 and 47.6 | 3.0 ± 0.2 | 0.0 ± 0.0 | 100 (<0.01) |
| UV-A Dose (mJ/cm2) | Light Intensity (mW/cm2) | Treatment Time (s) | Control (ppm) | Treatment (ppm) | % Reduction (p-Value) |
|---|---|---|---|---|---|
| UV dose control with UV light intensity | |||||
| 1.3 | 0.14 | 9.5 | 0.4 ± 0.0 | 0.4 ± 0.0 | 3.5 (0.22) |
| 2.5 | 0.26 | 9.5 | 0.4 ± 0.0 | 0.3 ± 0.0 | 9.0 (<0.01) |
| 3.9 | 0.41 | 9.5 | 0.3 ± 0.0 | 0.3 ± 0.0 | 4.3 (0.02) |
| UV dose control with treatment time | |||||
| 1.3 | 0.41 | 3.2 | 0.3 ± 0.0 | 0.3 ± 0.0 | 0.4 (0.85) |
| 2.0 | 0.41 | 4.8 | 0.3 ± 0.0 | 0.2 ± 0.0 | 17.1 (0.09) |
| UV dose control with UV light intensity and treatment time | |||||
| 5.8 * | 0.41 and 0.04 | 9.5 and 47.6 | 0.3 ± 0.0 | 0.2 ± 0.0 | 14.2 (0.03) |
| UV-A Dose (mJ/cm2) | Light Intensity (mW/cm2) | Treatment Time (s) | Control (ppm) | Treatment (ppm) | % Reduction (p-Value) |
|---|---|---|---|---|---|
| UV dose control with UV light intensity | |||||
| 1.3 | 0.14 | 9.5 | 4.6 ± 0.1 | 4.5 ±0.1 | 1.0 (0.33) |
| 2.5 | 0.26 | 9.5 | 5.8 ± 0.1 | 5.7 ±0.1 | 1.3 (0.21) |
| 3.9 | 0.41 | 9.5 | 5.5 ± 0.2 | 5.3 ±0.2 | 2.1 (0.38) |
| UV dose control with treatment time | |||||
| 1.3 | 0.41 | 3.2 | 4.3 ± 0.4 | 4.2 ± 0.4 | 4.3 (0.41) |
| 2.0 | 0.41 | 4.8 | 6.3 ± 0.1 | 6.2 ± 0.1 | 2.9 (0.93) |
| UV dose control with UV light intensity and treatment time | |||||
| 5.8 * | 0.41 and 0.04 | 9.5 and 47.6 | 6.0 ± 0.3 | 5.6 ± 0.3 | 6.1 (0.04) |
| UV Wavelengths (nm) | UV Dose (µJ/cm2) | Light Intensity (µW/cm2) | Control (OUE/m3) | Treatment (OUE/m3) | % Reduction (p-Value) |
|---|---|---|---|---|---|
| 185 + 254 | 0.03 | 0.01 | 325 ± 78 | 182 ± 73 | 43.9 (0.09) |
| 222 | 2.83 | 0.59 | 262 ± 22 | 19.5 (0.30) | |
| 254 | 1.78 | 0.37 | 290 ± 55 | 10.6 (0.19) | |
| 367 | 192 | 40 | 332 ± 58 | −2.2 (0.94) | |
| 1968 | 410 | 270 ± 38 | 17.0 (0.11) |
| Targeted VOCs | Percent Reduction (p-Value) | ||||
|---|---|---|---|---|---|
| UV-C Dose, µJ/cm2 (Light Intensity, µW/cm2) | UV-A Dose (Light Intensity, µW/cm2) | ||||
| 185 + 254 nm 0.03 (0.01) | 222 nm 2.83 (0.59) | 254 nm 1.78 (0.37) | 367 nm 192 (40) | 367 nm 1968 (410) | |
| DMDS | 59.3 (0.14) | 59.8 (0.27) | 14.8 (0.70) | −14.7 (0.87) | −4.1 (0.93) |
| DMTS | 56.4 (0.15) | 67.1 (0.12) | 21.7 (0.50) | −6.2 (0.63) | 5.8 (0.86) |
| Acetic acid | 10.0 (0.68) | −12.2 (0.72) | −12.1 (0.70) | 0.4 (0.99) | 57.2 (0.04) |
| Propanoic acid | 13.3 (0.83) | 37.4 (0.47) | 23.1 (0.64) | −32.6 (0.54) | 36.2 (0.49) |
| Isopentanoic acid | 24.9 (0.72) | 60.5 (0.39) | 70.0 (0.33) | −13.6 (0.85) | 18.1 (0.80) |
| Butanoic acid | 10.3 (0.66) | 27.8 (0.08) | −15.5 (0.79) | 21.8 (0.39) | 33.4 (0.03) |
| Phenol | 43.4 (0.08) | 32.4 (0.26) | 7.8 (0.79) | 23.2 (0.53) | 24.7 (0.52) |
| p-Cresol | 47.1 (0.04) | 46.9 (0.09) | 29.2 (0.32) | 8.9 (0.75) | 46.8 (0.05) |
| Indole | 54.2 (0.01) | 19.2 (0.48) | 16.9 (0.51) | −14.5 (0.64) | 46.6 (0.17) |
| Skatole | 35.1 (0.35) | 55.8 (0.14) | 64.6 (0.11) | 3.7 (0.83) | 56.5 (0.09) |
| UV Wavelength (nm) | UV Dose (µJ/cm2) | Light Intensity (µW/cm2) | Control (ppb) | UV Treatment (ppb) | % Reduction (p-Value) |
|---|---|---|---|---|---|
| 185 + 254 | 0.03 | 0.01 | 14.6 ± 4.2 | 34.8 ± 5.7 | −139 (<0.01) |
| 222 | 2.83 | 0.59 | 18.6 ± 2.2 | 0.0 ± 0.0 | 100 (<0.01) |
| 254 | 1.78 | 0.37 | 16.8 ± 2.9 | 0.0 ± 0.0 | 100 (<0.01) |
| 367 | 192 | 40 | 10.9 ± 2.1 | 7.7 ± 2.4 | 30 (0.02) |
| 1968 | 410 | 6.4 ± 1.6 | 0.2 ± 0.7 | 97 (<0.01) |
| UV Wavelength (nm) | UV Dose (µJ/cm2) | Light Intensity (µW/cm2) | Control (ppm) | Treatment (ppm) | % Reduction (p-Value) |
|---|---|---|---|---|---|
| 185 + 254 | 0.03 | 0.01 | 3.7 ± 0.9 | 1.1 ± 0.0 | 70.9 (0.04) |
| 222 | 2.83 | 0.59 | 1.7 ± 0.0 | 55.7 (0.06) | |
| 254 | 1.78 | 0.37 | 1.4 ± 0.2 | 63.6 (0.06) | |
| 367 | 192 | 40 | 3.9 ± 0.5 | −3.7 (0.77) | |
| 1968 | 410 | 3.2 ± 1.3 | 15.9 (0.59) |
| UV Wavelength (nm) | UV Dose (µJ/cm2) | Light Intensity (µW/cm2) | Control (ppm) | Treatment (ppm) | % Reduction (p-Value) |
|---|---|---|---|---|---|
| 185 + 254 | 0.03 | 0.01 | 0.24 ± 0.01 | 0.18 ± 0.00 | 25.4 (<0.01) |
| 222 | 2.83 | 0.59 | 0.22 ± 0.00 | 8.1 (0.01) | |
| 254 | 1.78 | 0.37 | 0.21 ± 0.01 | 13.6 (0.01) | |
| 367 | 192 | 40 | 0.23 ± 0.01 | 5.9 (0.17) | |
| 1968 | 410 | 0.21 ± 0.00 | 13.5 (0.02) |
| UV Wavelength (nm) | UV Dose (µJ/cm2) | Light Intensity (µW/cm2) | Control (ppm) | Treatment (ppm) | % Reduction (p-Value) |
|---|---|---|---|---|---|
| 185 + 254 | 0.03 | 0.01 | 3.3 ± 0.1 | 3.3 ± 0.0 | 0.5 (0.55) |
| 222 | 2.83 | 0.59 | 3.2 ± 0.1 | 3.2 ± 0.1 | 1.3 (0.35) |
| 254 | 1.78 | 0.37 | 3.1 ± 0.1 | 3.0 ± 0.1 | 1.4 (0.22) |
| 367 | 192 | 40 | 2.5 ± 0.1 | 2.5 ± 0.1 | 0.3 (0.71) |
| 1968 | 410 | 2.6 ± 0.1 | 2.6 ± 0.1 | 2.1 (0.16) |
| Reference | Targeted Gas | UV Dose (mJ/cm2) | Target Gas Concentration (ppm, O3 = ppb, Odor = OUE/m3) | % Reduction | |
|---|---|---|---|---|---|
| Control | UV Treatment | ||||
| [13] (pilot-scale treating standard gases) | NH3 | 3.9 | 67.4 ± 0.36 | 61.1 ± 0.30 | 9 |
| 5.8 | 68.9 ± 0.68 | 61.1 ± 0.70 | 11 | ||
| Butan-1-ol | 2.5 | 0.66 ± 0.02 | 0.53 ± 0.06 | 19 | |
| 3.9 | 0.65 ± 0.03 | 0.43 ± 0.04 | 34 | ||
| 5.8 | 0.69 ± 0.02 | 0.41 ± 0.07 | 41 | ||
| This study (pilot-scale with swine manure) | NH3 | 5.8 | 5.98 ± 0.28 | 5.62 ± 0.34 | 6 |
| N2O | 3.9 | 0.29 ± 0.01 | 0.28 ± 0.00 | 4 | |
| N2O | 5.8 | 0.29 ± 0.00 | 0.25 ± 0.01 | 14 | |
| O3 | 1.3 | 0.34 ± 0.03 | 0 | 100 | |
| O3 | 5.8 | 0.31 ± 0.02 | 0 | 100 | |
| VOCs | 2.5 | N/A | N/A | PA(51), BA(45), p-Cresol(41) | |
| 3.9 | N/A | N/A | AA(49), BA(53), p-Cresol (67), Indole(32) | ||
| 5.8 | N/A | N/A | AA(51), BA(48), Indole(20) | ||
| Odor | 2.5 | 352 ± 7.98 | 239 ± 24.4 | 32 | |
| 3.9 | 653 ± 32.1 | 277 ± 21.7 | 58 | ||
| 5.8 | 653 ± 9.25 | 243 ± 64.4 | 63 | ||
| Reference | Targeted Gas | UV Dose (mJ/cm2) | Target Gas Emission (E, mg/min, Odor, OUE/min) | Cost 1 (USD/kg for NH3, USD/g for butan-1-ol, N2O, O3 USD/ton of OUE for Odor) | |
|---|---|---|---|---|---|
| Control | UV Treatment | ||||
| [13] (pilot-scale treating standard gases) | NH3 | 3.9 | 746 | 676 | 53.4 |
| NH3 | 5.8 | 763 | 676 | 62.5 | |
| Butan-1-ol | 2.5 | 31.5 | 25.3 | 442 | |
| 3.9 | 30.9 | 20.3 | 352 | ||
| 5.8 | 32.9 | 19.4 | 403 | ||
| This study (pilot-scale treating emissions from swine manure) | NH3 | 5.8 | 64.2 | 60.2 | 1260 |
| N2O | 3.9 | 8.14 | 7.79 | 10.6 | |
| N2O | 5.8 | 8.06 | 6.92 | 4.72 | |
| O3 | 1.3 | 0.01 | 0.00 | 18.9 | |
| O3 | 5.8 | 0.01 | 0.00 | 60.0 | |
| Odor | 3.9 | 9200 | 3910 | 0.71 | |
| 5.8 | 9200 | 3430 | 0.94 | ||
| UV Wavelength, nm (UV dose, µJ/cm2) | Targeted Gas | Target Gas Concentration (ppm; O3 = ppb) | % Reduction | |
|---|---|---|---|---|
| b | UV Treatment | |||
| 185 + 254 (0.03) | VOCs | N/A | N/A | p-Cresol (47); Indole (54) |
| CH4 | 3.7 ± 0.9 | 1.1 ± 0.0 | 71 | |
| N2O | 0.2 ± 0.0 | 0.2 ± 0.0 | 25 | |
| 222 (2.80) | N2O | 0.2 ± 0.0 | 0.2 ± 0.0 | 8 |
| O3 | 18.6 ± 2.2 | 0.0 ± 0.0 | 100 | |
| 254 (1.76) | N2O | 0.2 ± 0.0 | 0.2 ± 0.0 | 14 |
| O3 | 16.8 ± 2.9 | 0.0 ± 0.0 | 100 | |
Publisher’s Note: MDPI stays neutral with regard to jurisdictional claims in published maps and institutional affiliations. |
© 2021 by the authors. Licensee MDPI, Basel, Switzerland. This article is an open access article distributed under the terms and conditions of the Creative Commons Attribution (CC BY) license (https://creativecommons.org/licenses/by/4.0/).
Share and Cite
Lee, M.; Koziel, J.A.; Murphy, W.; Jenks, W.S.; Chen, B.; Li, P.; Banik, C. Evaluation of TiO2 Based Photocatalytic Treatment of Odor and Gaseous Emissions from Swine Manure with UV-A and UV-C. Animals 2021, 11, 1289. https://doi.org/10.3390/ani11051289
Lee M, Koziel JA, Murphy W, Jenks WS, Chen B, Li P, Banik C. Evaluation of TiO2 Based Photocatalytic Treatment of Odor and Gaseous Emissions from Swine Manure with UV-A and UV-C. Animals. 2021; 11(5):1289. https://doi.org/10.3390/ani11051289
Chicago/Turabian StyleLee, Myeongseong, Jacek A. Koziel, Wyatt Murphy, William S. Jenks, Baitong Chen, Peiyang Li, and Chumki Banik. 2021. "Evaluation of TiO2 Based Photocatalytic Treatment of Odor and Gaseous Emissions from Swine Manure with UV-A and UV-C" Animals 11, no. 5: 1289. https://doi.org/10.3390/ani11051289
APA StyleLee, M., Koziel, J. A., Murphy, W., Jenks, W. S., Chen, B., Li, P., & Banik, C. (2021). Evaluation of TiO2 Based Photocatalytic Treatment of Odor and Gaseous Emissions from Swine Manure with UV-A and UV-C. Animals, 11(5), 1289. https://doi.org/10.3390/ani11051289