1. Introduction
Johne’s disease (JD) is clinically defined by chronic diarrhoea due to a granulomatous enteritis in ruminants and the pathogen responsible for JD is
Mycobacterium avium subspecies
paratuberculosis (MAP) [
1,
2]. In dairy cattle, the herd economic consequences include shortened lifespans, restocking costs, lower milk yields, decreased feed conversion rate, fertility issues, reduced monetary returns at slaughter and higher prevalence of subclinical disease [
3]. JD is also a significant welfare issue at the terminal stage, but in practice, most MAP-infected animals are sent for slaughter before reaching this point [
1]. In order to reduce the impact on the dairy sector, JD control programmes are being put in place, for instance in Denmark and Canada [
4,
5]. In the United Kingdom (UK), the National Action Group on Johne’s aims to control JD in the dairy sector, coordinated by DairyUK and recently incorporated in the British dairy farm assurance scheme [
6].
In these monitoring programmes, enzyme-linked immunosorbent assays (ELISA) in milk are used to screen cows at risk of being MAP infected as a cheap and quick alternative to faecal culture [
7]. The sensitivity of these tests is limited, but with repeat tests every three months, this allows an assessment of the probability of MAP infection [
8]. The repeat antibody testing allows categorising the cows as at ‘low’, ‘medium’ and ‘high’ risk of being affected by MAP infection and therefore the likelihood of shedding MAP in the faeces [
9].
In the UK, another mycobacterium infection is present:
Mycobacterium bovis, the causative agent of bovine tuberculosis (bTB) [
10], is also a zoonosis and cattle in England are regularly tested using the single intradermal cervical comparative test (SICCT) [
11,
12,
13]. The SICCT involves inoculation of
Mycobacterium bovis and
Mycobacterium avium subspecies
avium purified protein derivatives (PPD) intradermally at two locations in the cervical region which are measured and compared at 72 h post-inoculation [
14,
15]. Cows reacting positive on SICCT are culled, herd movement restrictions are applied and a 60 day SICCT testing interval is introduced until the herd test repeatedly negative for bTB [
16]. To regain Officially TB Free status, the whole herd must test negative on SICCT on two occasions within a short interval [
17].
MAP and
Mycobacterium bovis share multiple antigens [
18].
Mycobacterium bovis antibody cross interference can reduce the specificity of MAP ELISA testing [
19]. It is unlikely that intradermal injections with
Mycobacterium bovis and
Mycobacterium avium subspecies
avium PPD result in a humoral (antibody) response. However, this cannot be fully dismissed either in sensitised cows as Casal et al. described an increased level of antibodies to
Mycobacterium bovis 15 days after intradermal PPD injection and the
Mycobacterium avium subspecies
avium PPD component of the SICCT alone is likely to be sufficient to increase MAP milk ELISA titres due to an anamnestic response [
20]. For this reason, National Milk Records (NMR) recommends to MAP milk ELISA test 42 days or more post-SICCT [
21]. In an effort to measure the impact, May et al. showed the MAP milk ELISA titres at specific intervals over four months of 129 SICCT tested and 111 control animals [
22]. They found that the MAP milk ELISA titres were significantly higher in the SICCT tested group compared to the control group when testing at 33 days post-SICCT. No significant difference was found at 53 days, 82 days or 110 days post-SICCT. They therefore recommended avoiding MAP milk ELISA testing until 53 days post-SICCT.
Similarly, Kennedy et al. compared the prevalence of MAP seropositive cows using milk and serum ELISA pre-SICCT and approximately every 14 days post-SICCT in a 139 cow herd [
23]. Seroprevalence was 8% pre-SICCT, whilst 6% of the herd were positive on MAP milk ELISA pre-SICCT. They found MAP milk ELISA titres to be significantly higher at 30 days post-SICCT, and MAP serum ELISA titres at 58 days post-SICCT. No significant difference in milk ELISA titres was found at 43 days post-SICCT, or serum ELISA titres at 71 days post-SICCT. They therefore recommended postponing MAP milk ELISA testing for 43 days and MAP serum ELISA testing for 71 days post-SICCT. Similarly, Barden et al. showed an increased rate of a positive JD test result up to 30 days (odds ratio (OR) = 2.08) and 31–60 days (OR = 1.15) after bTB testing [
24].
The current literature, however, is lacking more detailed time resolution as well as clarification on the importance of herds being infected with bTB in relation to the test (apparent) prevalence of JD-positive cows. In addition, it would be useful to know whether a farmer who has submitted an early JD test once would improve on their practices in subsequent submissions by ensuring a longer bTB–JD testing interval. This study aims to further clarify the relationship between the time interval between SICCT and MAP milk ELISA testing and the test prevalence of JD-positive cows. The objectives of this study were (1) to identify the odds for testing positive at 14 day bTB–JD testing interval increments, (2) to estimate the importance of being co-infected with bTB in relation to the odds for testing positive for JD on MAP milk ELISA and (3) to evaluate whether submitting once at a short bTB–JD testing interval has an effect on subsequent submission intervals. The authors anticipate that the findings will help farmers and veterinary surgeons to optimise the timing of their JD testing protocols.
2. Materials and Methods
Data were collected from a pool stored at National Milk Records, Wolverhampton. The JD test results were from herds testing between 1st January 2016 and 2nd February 2018. The milk pool consisted mostly of herds JD testing every quarter. Herds from the milk pool were selected to participate in this study based on two criteria to ensure data accuracy: (1) the herd must have exact SICCT and MAP milk ELISA testing dates and (2) the time interval between SICCT and MAP milk ELISA testing must be between 1 and 200 days inclusive.
Each milk recording reported whether a cow was regarded as at ‘low’, ‘medium’ and ‘high’ risk of being affected by MAP infection. Testing for antibodies was performed by milk ELISA (IDEXX Paratuberculosis Screening Ab Test, IDEXX Laboratories, Westbrook ME, USA). The test interpretation followed the instructions of the manufacturer. Tests with a sample-to-positive ratio (S/P) of 0.3 or above were considered positive. Based on the repeat test results, cows were considered ‘low’ risk when tests returned negative or one positive out of the last three tests, but not the most recent test. ‘Medium’ risk cows returned alternating positive and negative results, or have the most recent test report positive and ‘high’ risk cows have repeatedly positive test results [
25]. The SICCT consisted of PPDs of
Mycobacterium bovis and
Mycobacterium avium subspecies
avium.The following data were transferred to Microsoft Excel 2017: herd ID, herd size, date of SICCT, date of MAP milk ELISA, herd bTB status and numbers of ‘low’, ‘medium’ and ‘high’ risk cows. The bTB–JD testing interval was calculated as the number of days between SICCT and MAP milk ELISA testing. Based on the date of JD testing, year and quarter (Q) of testing was defined: Q1 consisted of tests from January to March, Q2 from April to June, Q3 from July to September, and Q4 from October to December. The bTB history was based on whether the farm was under bTB restrictions at any point in 2016.
Statistical Analyses
Herd ID was considered a nominal categorical variable, as was quarter in the year. The bTB–JD testing interval was used as a continuous variable as well as grouped in an ordinal distribution of 14 day intervals: 0–14, 15–28, 29–42, 43–56, 57–70, 71–84, and 85 plus days. A short bTB–JD testing interval was considered to be shorter than 60 days. Year and herd size were deemed continuous variables, and bTB status (positive or negative) was considered a dichotomous categorical variable.
A mixed linear model was used, with herd ID as a random factor, to evaluate whether the bTB–JD testing interval varied per year, quarter, herd size, JD prevalence, or bTB status. A multivariate backward stepwise approach was performed to finalise an optimally descriptive model. Q–Q plots and normality of residuals were used to evaluate the models. In order to evaluate whether the bTB–JD testing interval was affected by an occurrence of a short (<60 day) testing interval, coded events of pre- and post-intervals were introduced to the final mixed linear model [
24]. Finally, in case repeat events of a short bTB–JD testing interval occurred, these were coded and put in the final mixed linear model to enable evaluation of whether a repeat event had a different bTB–JD testing interval.
A mixed linear model with the Poisson distribution was used to evaluate the occurrence of a ‘medium’ or ‘high’ risk JD recording. Herd ID was a random effect and explanatory variables used were: year, quarter, herd size, ordinal categorised (14 day increments) bTB–JD testing intervals and bTB herd status. As the residuals were not normally distributed, one recording per herd was selected and the generalised linear model with a Poisson distribution was used with each farm represented in the data once. Which farm data point was used was based on a selection stratified on bTB–JD testing interval, with comparable observations in each category. Q–Q plots and normality of residuals were used to evaluate the models.
All the analyses were performed using IBM SPSS Statistics (Version 29, 2019 IBM Corp; Armonk, NY, USA) and an alpha error of less than 0.05 was considered statistically significant.
3. Results
Based on the selection criteria, data on 51 herds were obtained. The median herd size was 233, with an interquartile range (IQR) of 177 to 345. This totalled 46,738 cow observations, including multiple observations recorded from individual cows. Of the 46,738 cow observations, 41,769 were at ‘low’, 2563 at ‘medium’ and 2406 at ‘high’ risk of being affected by MAP infection. Per herd, there were on average 221 (median, IQR: 164–336), 12 (IQR: 5–22) and 9 (IQR: 5–21) in each respective risk category.
Most herds (45/51; 88%) had repeat observations. The median number of recordings was 2 (IQR: 1–3). This provided a total of 163 herd observations. The mean bTB–JD testing interval was 100 days (95% confidence interval: 92–107) and the multivariate mixed linear model revealed that year and quarter were significantly associated with the length of bTB–JD testing interval. With progressing years, the bTB–JD testing interval on average increased by 24 days per year (p = 0.001); compared to the first quarter (January–March) the second quarter was 39 days longer (p < 0.001), the third quarter was 34 days longer (p = 0.002) and the fourth quarter was 14 days longer, which was not significant (p = 0.237).
In 31 of the herds, there was at least one recording with a bTB–JD test interval shorter than 60 days. In total, there were 38 short intervals, three herds each had a single repeat short (<60 day) bTB–JD testing interval, and two herds had two repeats each. The repeat short intervals were on average 12 days shorter than the initial short interval (average 39 days, p = 0.190). The bTB–JD testing interval was on average 6 days longer after a short interval, but this was not significant (p = 0.457).
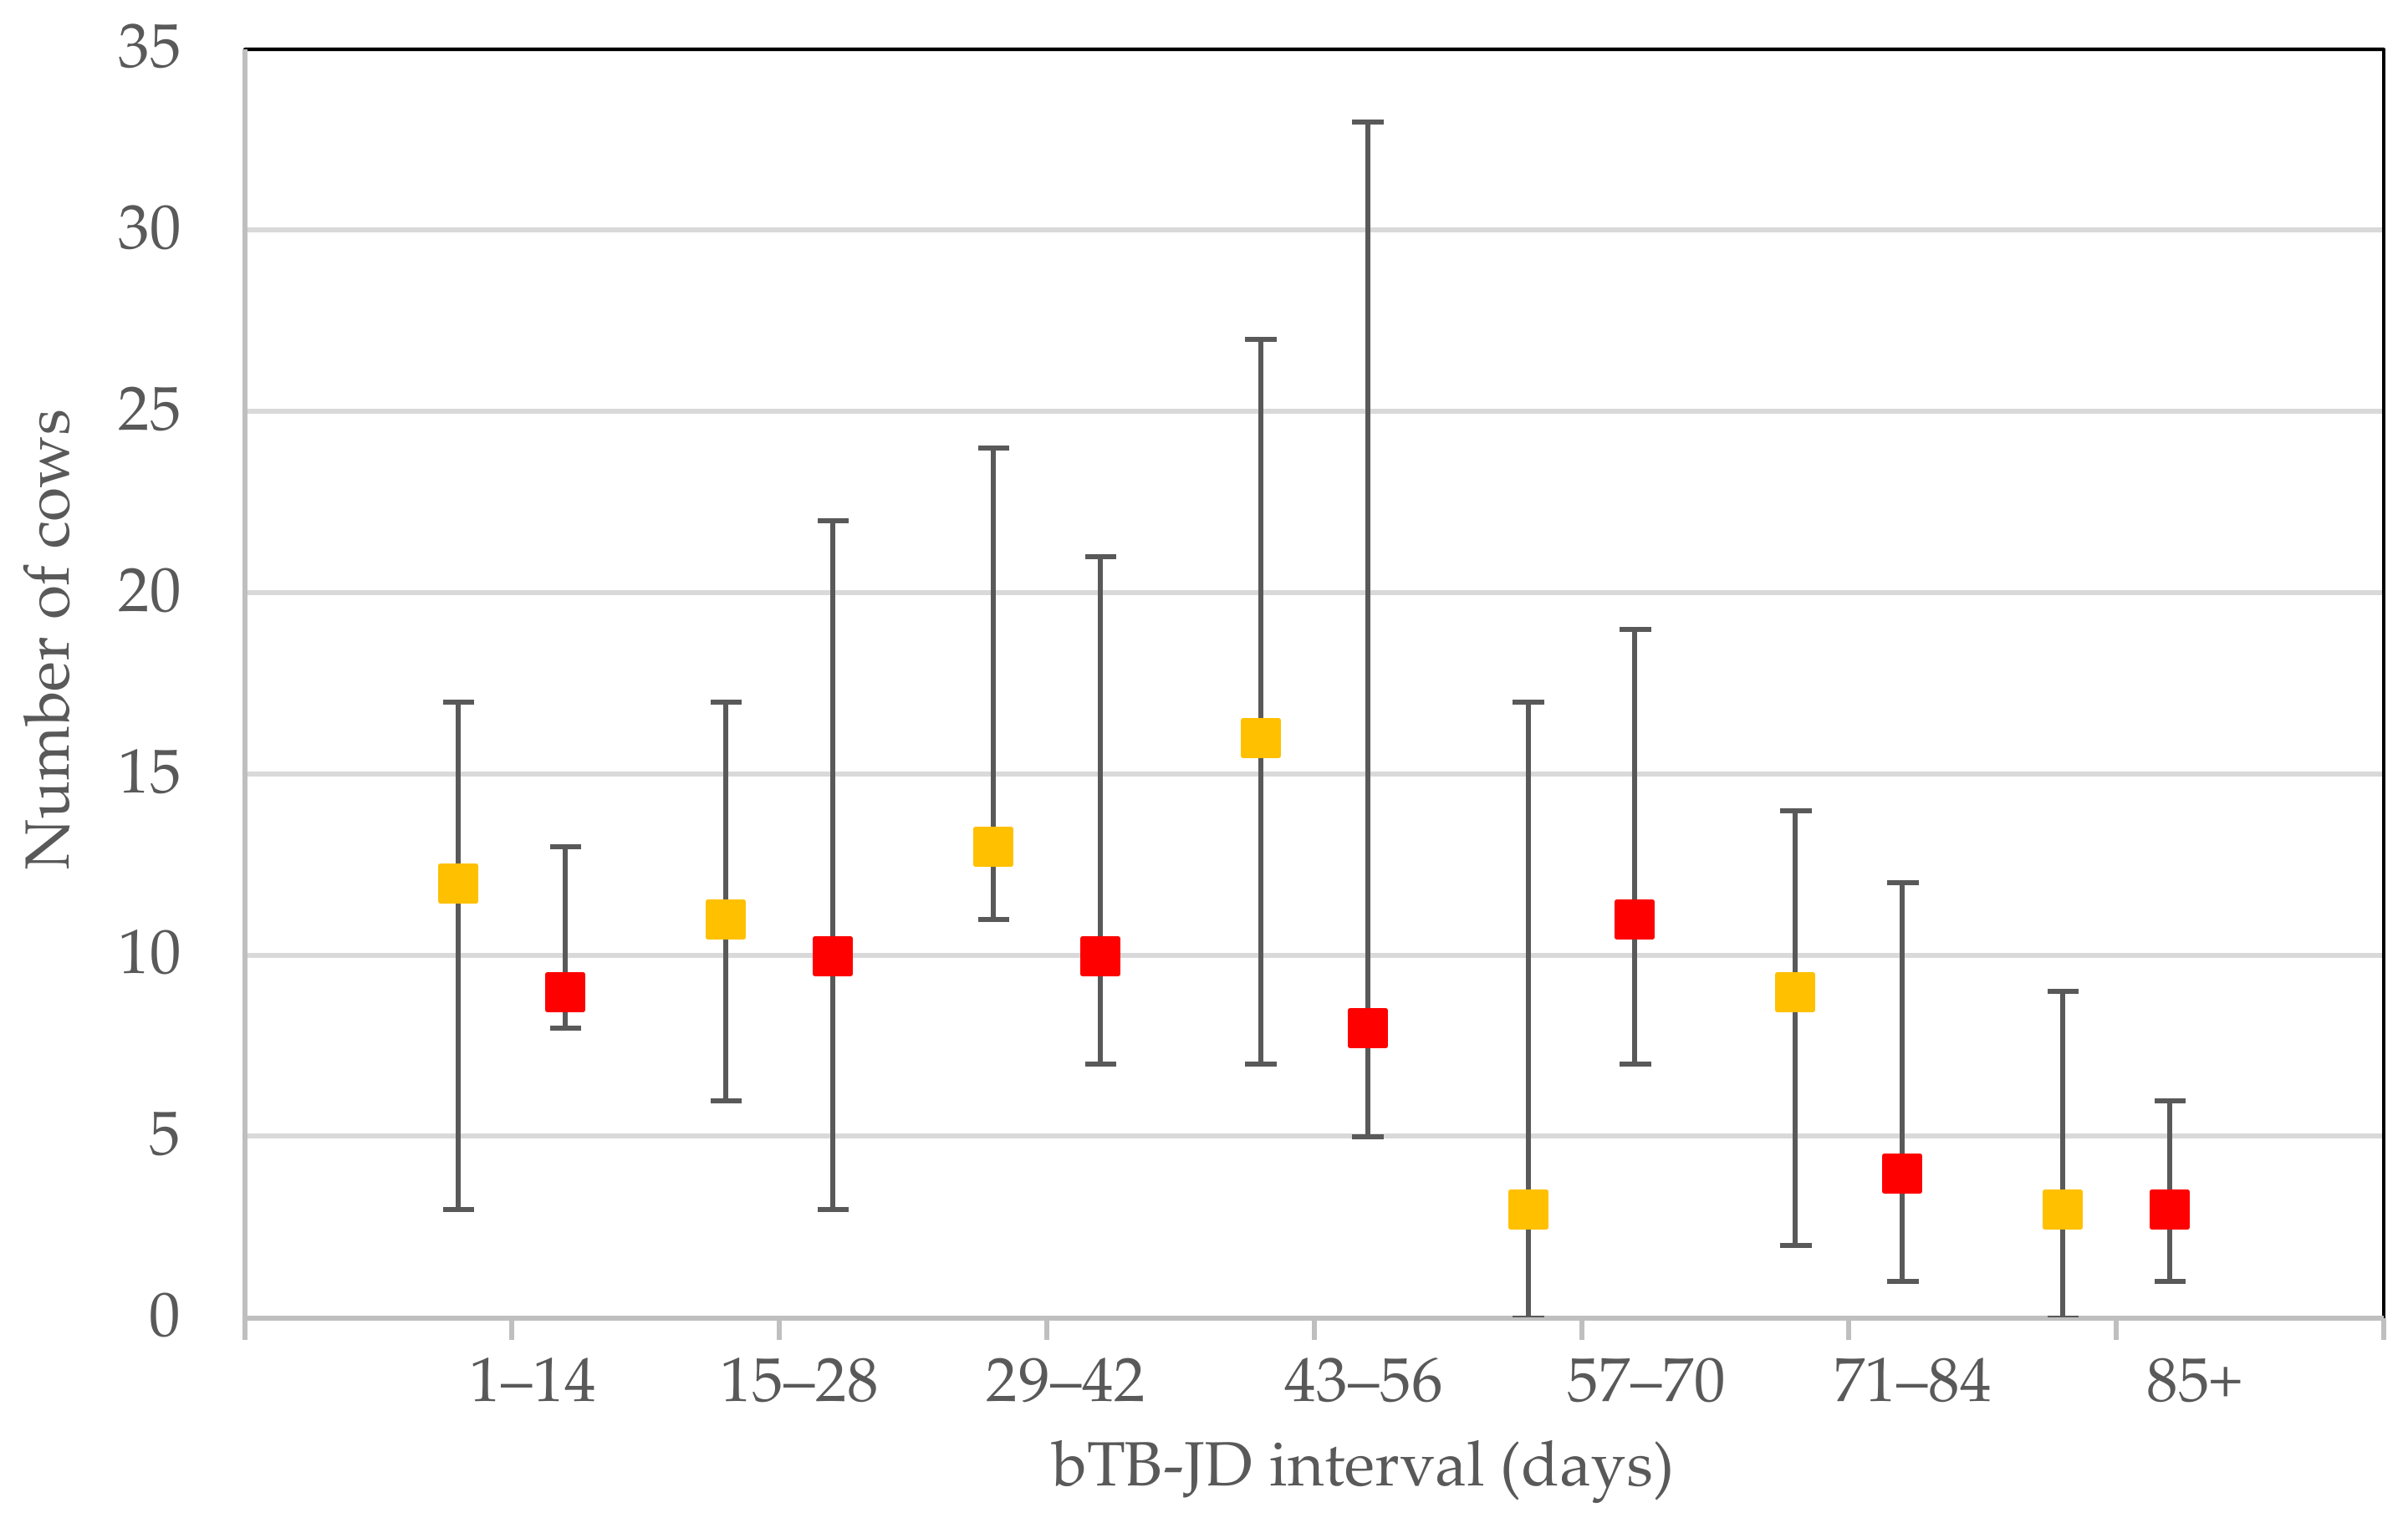
For each milk recording that reported a cow regarded as at ‘low’, ‘medium’ and ‘high’ risk of being affected by MAP infection, the individual stratified test resulted in a median (IQR) number of 212 (156–296), 9 (3–17) and 8 (4–5), respectively. In the time categories 0–14, 15–28 and 29–42, the number of reporting herds were: 5, 4 and 6, respectively. The other time periods all had 9 observations. The numbers of ‘medium’ and ‘high’ risk cows in each of the 14 day bTB–JD testing interval categories are depicted in
Figure 1.
The final models for the ‘medium’ and ‘high’ risk cows had a respective R
2 of 0.525 and 0.467. In both models, herd size, year, quarter, and bTB–JD testing interval were significant. In the ‘high’ risk cow model, a herd history of presence of bTB contributed to the number of cows testing positive for JD (
p = 0.042). The results of the final multivariate Poisson model are shown in
Table 1.
Controlled for year, quarter and herd size, the odds of detecting ‘medium’ risk cows are significantly different in half of the testing interval categories, whereas the chance of detecting ‘high’ risk cows is significantly different in all of the testing interval categories. Additionally, the impact (OR estimates) is higher for the ‘high’ risk cows than the ‘medium’ risk cows, particularly given the lower overall prevalence of cows at ‘high’ risk of being affected by MAP infection.
For the original non-stratified dataset, the weighted average parameter estimate for the bTB–JD testing interval was 0.23 for ‘medium’ risk cows and 0.47 for ‘high’ risk cows, which equates to an additional 1.26 and 1.60 cows, respectively. Anticipating an extended bTB–JD testing interval of on average 24 additional days in the following year, this would equate to an additional 1.11 ‘medium’ risk and 1.26 ‘high’ risk cows, respectively.
4. Discussion
In the sample of herds, there are temporal variations that are similar with respect to the bTB–JD testing interval as well as the detection of JD-positive cows, labelled as at ‘medium’ and ‘high’ risk of being affected by MAP infection. This suggests that JD control is effective at driving the prevalence down, in line with the findings of Camanes et al. [
26]. Part of the lowered apparent prevalence is explained by an extended bTB–JD testing interval: with on average an extra 24 days per year, the JD tests are less likely to be affected by the previous bTB test. Over the years, the odds for a positive JD test are declining, with the lowest apparent prevalence in the quarters that the cows are able to graze outside (quarter 2 and 3). The bTB–JD testing interval follows a similar trajectory; it is increasing over time and longer in summer months. As farmers are made aware of the importance of a bTB–JD testing interval of at least 42 days and preferably 60 days, they seem to get better at achieving this over time. There is, however, little evidence of learning from past events: when a farmer submits after a short bTB–JD testing interval, subsequent bTB–JD testing intervals are not necessarily extended. They were not likely to repeat the short bTB–JD testing interval, but the ones who do have a short interval of similar length suggest that the negative impact of a shortened interval is not fully recognised.
The Poisson regression results, however, do suggest that there is a diagnostic benefit in not JD testing too closely to the previous bTB test. This is in line with the observations of May et al. and Barden et al. [
22,
24]. The findings of the current study further clarify the effect of bTB–JD testing intervals: for ‘medium’ risk cows, the largest increase in probability of a positive JD test is with testing interval categories of 29–42 days (OR = 2.4) and 43–56 days (OR = 2.6). This is very similar to the findings of May et al., whilst Barden et al. reported an earlier (0–30 days post-bTB test) rise in odds for testing positive for JD [
22,
24]. The ‘high’ risk cows are more likely to be identified in the bTB–JD testing interval categories 43–56 and 57–70 days (OR = 3.2 and 4.0, respectively). The current study suggests that the relation of the previous bTB test to the JD test performance lasts for longer than previously thought. This is of particular importance for herds that have a history of bTB: the current study data show that this increases the chance of finding ‘high’ risk cows but also the farms are more likely to encounter bTB testing in close time proximity to JD testing, as they are testing at a shorter bTB testing interval (typically 60 days when an active infection is on the farm).
The finding of a higher positive test rate for JD in herds that have bTB is similar to what is reported by Picasso-Risso et al., with a similar OR of 1.47 [
27]. A herd history of bTB raises the odds for finding ‘high’ risk cows (OR = 1.2) but also puts a ceiling on the maximum possible length of bTB–JD testing interval. The latter has a larger impact on detecting JD-positive cows based on the current study data (OR = 1.6). At a 60 day testing interval for bTB, this would put the bTB–JD testing interval in the 57–70 days bracket (OR = 4.0). To best avoid falsely detecting ‘high’ risk cows, there could perhaps be an argument for JD testing in the two weeks after bTB testing (OR = 2.5 for 0–14 days) rather than just before bTB testing, but further studies are required to investigate this. The authors speculate that this finding may be due to the time taken to mount a humoral (antibody) response. One would expect a continual rise in antibody production between day 1 and day 14, particularly in those cows infected with MAP who are therefore already sensitised to the antigen, with primed (memory) B cells enabling a more rapid humoral response. Further studies to investigate this prediction should analyse the dataset using the bTB–JD testing interval as a continuous variable, as opposed to grouped in an ordinal distribution of 14 day intervals. Further investigation of the relationship between the herd bTB results of the most recent bTB test and the numbers of ‘high’ risk cows would also be beneficial. In this study, the bTB history was based on whether the farm was under bTB restrictions at any point in 2016, so a more complete dataset providing herd bTB results for every bTB test would enable further evaluation. With this more detailed approach, the authors would expect a smaller
p-Value and a greater effect size to be observed.
The question is whether this observed variation is due to an increased sensitivity of the MAP milk ELISA test, or whether more false positives are being detected due to a reduction in specificity with other cross-reacting antigens from related mycobacterial species. Natural infection with bTB elicits a Th1-type cell-mediated delayed hypersensitivity response [
28]. The effect of PPD inoculation on bTB humoral immunity, responsible for cross reactions in MAP milk ELISA tests, is disputed, varying with antigen and stage of infection [
29]. Interestingly, Kennedy et al. found a significant increase in MAP antibodies post-PPD administration [
30]. This is in line with the findings of Casal et al. who found a significant increase in bTB antibodies after intradermal PPD injection during bTB testing [
20]. The current study findings suggest that an increase in bTB antibodies not only lasts longer, but the odds of testing positive for JD also increase further as time progresses. This is similar to the response observed in bTB and the serologic response following PPD inoculation in infected cattle—the antibody rise is noticeable after two weeks, peaks in the next two weeks, and wanes but remains high the following weeks [
31].
Equally, there could be
Mycobacterium avium subspecies
avium infections occurring during the housing period; this would explain a higher rate of ‘medium’ and ‘high’ risk cows in quarter 1 and 4, compared to the grazing period. Kennedy et al. proposed that cows housed overwinter are more likely to be exposed to mycobacterial antigens in avian droppings [
23]. Thom et al., found that previous exposure to the environmental mycobacterium
Mycobacterium avium subspecies
avium increased IFN-gamma serum levels compared to control calves with no previous exposure [
32]. Continual environmental exposure to various mycobacterial antigens such as
Mycobacterium avium subspecies
avium may also elicit a continual low level of plasma cell-mediated mycobacterial antibody production. The grazing period also coincides with early lactation for spring calving dairy herds. Higher milk yields during peak lactation have been shown to reduce MAP milk ELISA antibody titres due to an antibody dilution effect [
33], which would explain a lower rate of ‘medium’ and ‘high’ risk cows during quarter 2 and 3.
In addition to the two reasons for a false-positive JD test result due to stimulation of the immune system (mycobacterial coinfection or bTB testing) reducing the specificity of the MAP milk ELISA, it could be that the sensitivity of the test is raised. This is specifically the case for ‘high’ risk cows, as this JD risk status requires repeat positive test results. This is particularly relevant for the proximity to the bTB test as the probability of multiple repeated positive test results being false positives is very low [
8]. The ‘medium’ risk cows will require a single positive test, which is more easily influenced by a temporary reduction in specificity due to a recent bTB test. To be graded as a ‘high’ risk cow, however, requires repeated positive milk MAP ELISA tests, which is poorly explained by a one-off short bTB–JD testing interval. The observation that the association with the bTB–JD testing interval is more pronounced and more sustained suggests a possible increase in sensitivity of the MAP milk ELISA. Subsequent exploration of this notion was beyond the scope of the current study.
5. Conclusions
This study shows the impact of external events on the likelihood of detecting cows at ‘medium’ and ‘high’ risk of being affected by MAP infection. These external events are showing a decreased JD-positive case detection as the years progress and increased apparent prevalence of JD-positive cows over the housing period. The bTB–JD testing intervals showed similar trends, getting longer over the years and during grazing. Both suggest that the JD control programme is having an effect. The multivariate Poisson model also showed a sustained increase in detection of JD-positive cows in milk recordings that have a shorter bTB–JD testing interval. This is particularly the case for cows that are categorised as ‘high’ risk, as these cows have repeatedly tested positive, and are therefore likely to represent an increased sensitivity of the MAP ELISA test. More detailed, longitudinal studies are required to provide more definitive insight into the interaction of both tests used to control mycobacterial infections in the UK cattle population.
Author Contributions
Conceptualization, N.B. and S.v.W.; methodology, N.B. and S.v.W.; formal analysis, S.v.W.; writing—original draft preparation, N.B.; writing—review and editing, S.v.W. All authors have read and agreed to the published version of the manuscript.
Funding
This research received no external funding.
Institutional Review Board Statement
This study was conducted according to the guidelines of the Declaration of Helsinki and approved by the Social Sciences Research Ethical Review Board of the Royal Veterinary College (URN:SR2017-1524, 20th March 2018).
Informed Consent Statement
Not applicable.
Data Availability Statement
Third-Party Data: Restrictions apply to the availability of these data. Data were obtained from National Milk Records and are available from the authors with the permission of National Milk Records.
Acknowledgments
Many thanks to National Milk Records for kindly providing the data.
Conflicts of Interest
The authors declare no conflict of interest.
References
- Stabel, J.R. Johne’s Disease: A Hidden Threat. J. Dairy Sci. 1998, 81, 283–288. [Google Scholar] [CrossRef]
- Li, L.; Wagner, B.; Freer, H.; Schilling, M.; Bannantine, J.P.; Campo, J.J.; Katani, R.; Grohn, Y.T.; Radzio-Basu, J.; Kapur, V. Early detection of Mycobacterium avium subsp. paratuberculosis infection in cattle with multiplex-bead based immunoassays. PLoS ONE 2017, 12. [Google Scholar] [CrossRef] [PubMed]
- Garcia, A.B.; Shalloo, L. Invited review: The economic impact and control of paratuberculosis in cattle. J. Dairy Sci. 2015, 98, 5019–5039. [Google Scholar] [CrossRef] [PubMed]
- Nielsen, S.S. Danish control programme for bovine paratuberculosis. Cattle Pr. 2007, 15, 161–168. [Google Scholar]
- Arango-Sabogal, J.C.; Paré, J.; Labrecque, O.; Côté, G.; Roy, J.P.; Buczinski, S.; Wellemans, V.; Fecteau, G. Incidence of fecal excretion of Mycobacterium avium subsp. paratuberculosis in dairy cows before and after the enrolment in the Québec voluntary program. Prev. Vet. Med. 2017, 148, 94–105. [Google Scholar] [CrossRef] [PubMed]
- Red Tractor Assurance Changes to Dairy Standards Version 4.1—October 2019. Available online: http://assurance.redtractor.org.uk/contentfiles/Farmers-7032.pdf?_=637007928013074058/ (accessed on 22 February 2021).
- O’Brien, R.; Hughes, A.; Liggett, S.; Griffin, F. Composite testing for ante-mortem diagnosis of Johne’s disease in farmed New Zealand deer: Correlations between bacteriological culture, histopathology, serological reactivity and faecal shedding as determined by quantitative PCR. BMC Vet. Res. 2013, 9, 72. [Google Scholar] [CrossRef]
- Meyer, A.; Bond, K.; Van Winden, S.; Green, M.; Guitian, J. A probabilistic approach to the interpretation of milk antibody results for diagnosis of Johne’s disease in dairy cattle. Prev. Vet. Med. 2018, 150, 30–37. [Google Scholar] [CrossRef] [PubMed]
- Hanks, J.D.; Taylor, N.M.; Kossaibati, M.A. Is targeted milk sampling an effective means of detecting Johne’s disease in dairy herds? Cattle Pr. 2013, 22, 26–34. [Google Scholar]
- Byrne, A.W.; Graham, J.; Brown, C.; Donaghy, A.; Guelbenzu-Gonzalo, M.; McNair, J.; Skuce, R.; Allen, A.; McDowell, S. Bovine tuberculosis visible lesions in cattle culled during herd breakdowns: The effects of individual characteristics, trade movement and co-infection. BMC Vet. Res. 2017, 13, 400. [Google Scholar] [CrossRef] [PubMed]
- Thoen, C.; LoBue, P.; de Kantor, I. The importance of Mycobacterium bovis as a zoonosis. Vet. Microbiol. 2006, 112, 339–345. [Google Scholar] [CrossRef] [PubMed]
- Domingo, M.; Vidal, E.; Marco, A. Pathology of bovine tuberculosis. Res. Vet. Sci. 2014, 97, 20–29. [Google Scholar] [CrossRef]
- Council Directive 64/432/EEC of 26 June 1964 on Animal Health Problems Affecting Intra-Community Trade in Bovine Animals and Swine. Available online: http://eur-lex.europa.eu/legal-content/en/ALL/?uri=CELEX%3A31964L0432 (accessed on 19 March 2021).
- Coad, M.; Clifford, D.; Rhodes, S.G.; Hewinson, G.R.; Vordermeier, M.H.; Whelan, A.O. Repeat tuberculin skin testing leads to desensitisation in naturally infected tuberculous cattle which is associated with elevated interleukin-10 and decreased interleukin-1 beta responses. Vet. Res. 2009, 41, 14. [Google Scholar] [CrossRef] [PubMed]
- Flament-Saillour, M.; Perronne, C. The natural history of tuberculosis infection and skin tuberculin reaction. Rev. Mal. Respir. 1997, 14, 27–32. [Google Scholar]
- Brooks-Pollock, E.; Roberts, G.O.; Keeling, M.J. A dynamic model of bovine tuberculosis spread and control in Great Britain. Nature 2014, 511, 228–231. [Google Scholar] [CrossRef]
- GOV. UK Guidance Bovine TB: Get Your Cattle Tested in England. Available online: http://www.gov.uk/guidance/bovine-tb-getting-your-cattle-tested-in-england#how-to-regain-officially-tb-free-status (accessed on 9 April 2021).
- Olsen, I.; Tryland, M.; Wiker, H.; Reitan, L.J. AhpC, AhpD, and a secreted 14-kilodalton antigen from Mycobacterium avium subsp. paratuberculosis distinguish between paratuberculosis and bovine tuberculosis in an enzyme-linked immunosorbent assay. Clin. Diagn. Lab. Immunol. 2001, 8, 797–801. [Google Scholar] [CrossRef] [PubMed]
- Marassi, C.D.; Fráguas, S.; Gonzaga, J.S.; Ristow, P.; Ferreira, R.; Oelemann, W.M.R.; Fonseca, L.S.; Lilenbaum, W. Interference of anti-M. bovis antibodies in serological tests for paratuberculosis. In Proceedings of the 8th International Colloquium of Paratuberculosis, Copenhagen, Denmark, 14–17 August 2005. [Google Scholar]
- Casal, C.; Díez-Guerrier, A.; Álvarez, J.; Rodriguez-Campos, S.; Mateos, A.; Linscott, R.; Martel, E.; Lawrence, J.C.; Whelan, C.; Clarke, J.; et al. Strategic use of serology for the diagnosis of bovine tuberculosis after intradermal skin testing. Vet. Microbiol. 2014, 170, 342–351. [Google Scholar] [CrossRef] [PubMed]
- National Milk Records HerdWise. Available online: http://www.nmr.co.uk/disease/herdwise (accessed on 19 March 2021).
- May, H.; Orpin, P.G.; Pearse, H.L.; Jones, P.H.; Clough, H.E. The influence of tuberculosis testing in dairy cattle on milk ELISA tests for Johne’s disease. 2016. Available online: http://citeseerx.ist.psu.edu/viewdoc/download?doi=10.1.1.564.9325&rep=rep1&type=pdf (accessed on 27 February 2021).
- Kennedy, A.E.; Da Silva, A.T.; Byrne, N.; Govender, R.; MacSharry, J.; O’Mahony, J.; Sayers, R.G. The single intradermal cervical comparative test interferes with Johne’s disease ELISA diagnostics. Front. Immunol. 2014, 5, 564. [Google Scholar] [CrossRef] [PubMed]
- Barden, M.; Smith, R.F.; Higgins, H.M. The interpretation of serial Johne’s disease milk antibody results is affected by test characteristics, pattern of test results and parallel bovine tuberculosis testing. Prev. Vet. Med. 2020, 183, 105–134. [Google Scholar] [CrossRef] [PubMed]
- National Milk Records HerdWise Rule Change. Available online: http://www.nmr.co.uk/uploads/files/files/HW%20Classification%20change%20farmer(1).pdf (accessed on 17 March 2021).
- Camanes, G.; Joly, A.; Fourichon, C.; Ben Romdhane, R.; Ezanno, P. Control measures to prevent the increase of paratuberculosis prevalence in dairy cattle herds: An individual-based modelling approach. Vet. Res. 2018, 49, 60. [Google Scholar] [CrossRef] [PubMed]
- Picasso-Risso, C.; Grau, A.; Bakker, D.; Nacar, J.; Mínguez, O.; Perez, A.; Alvarez, J. Association between results of diagnostic tests for bovine tuberculosis and Johne’s disease in cattle. Vet. Rec. 2019, 185, 693. [Google Scholar] [CrossRef] [PubMed]
- Thom, M.L.; Hope, J.C.; McAulay, M.; Villarreal-Ramos, B.; Coffey, T.J.; Stephens, S.; Vordermeier, H.M.; Howard, C.J. The effect of tuberculin testing on the development of cell-mediated immune responses during Mycobacterium bovis infection. Vet. Immunol. Immunopathol. 2006, 114, 25–36. [Google Scholar] [CrossRef] [PubMed]
- Marassi, C.D.; Zarden, C.; Oelemann, W.; Lilenbaum, W. Detection of specific antibodies in cows after injection of PPD. Pesqui. Vet. Bras. 2014, 34, 241–243. [Google Scholar] [CrossRef][Green Version]
- Kennedy, A.E.; O’Mahony, J.; Byrne, N.; MacSharry, J.; Sayers, R.G. Is TB testing associated with increased blood interferon-gamma levels? Front. Vet. Sci. 2017, 4, 176. [Google Scholar] [CrossRef]
- Thom, M.; Morgan, J.H.; Hope, J.C.; Villarreal-Ramos, B.; Martin, M.; Howard, C.J. The effect of repeated tuberculin skin testing of cattle on immune responses and disease following experimental infection with Mycobacterium bovis. Vet. Immunol. Immunopathol. 2004, 102, 399–412. [Google Scholar] [CrossRef] [PubMed]
- Thom, M.L.; Howard, C.; Villarreal-Ramos, B.; Mead, E.; Vordermeier, M.; Hope, J. Consequence of prior exposure to environmental mycobacteria on BCG vaccination and diagnosis of tuberculosis infection. Tuberculosis 2008, 88, 324–334. [Google Scholar] [CrossRef] [PubMed]
- Nielsen, S.S.; Toft, N. Effect of days in milk and milk yield on testing positive in milk antibody ELISA to Mycobacterium avium subsp. paratuberculosis in dairy cattle. Vet. Immunol. Immunopathol. 2012, 149, 6–10. [Google Scholar] [CrossRef]
| Publisher’s Note: MDPI stays neutral with regard to jurisdictional claims in published maps and institutional affiliations. |
© 2021 by the authors. Licensee MDPI, Basel, Switzerland. This article is an open access article distributed under the terms and conditions of the Creative Commons Attribution (CC BY) license (https://creativecommons.org/licenses/by/4.0/).


