Article

Integration of Metabolomics and Transcriptomicsto Comprehensively Evaluate the Metabolic Effects of Gelsemium elegans on Pigs

1
College of Veterinary Medicine, Hunan Agricultural University, Changsha 410128, China
2
Hunan Engineering Technology Research Center of Veterinary Drugs, Hunan Agricultural University, Changsha 410128, China
*
Author to whom correspondence should be addressed.
Animals 2021, 11(5), 1192; https://doi.org/10.3390/ani11051192
Submission received: 8 March 2021 / Revised: 14 April 2021 / Accepted: 15 April 2021 / Published: 21 April 2021
(This article belongs to the Section Pigs)

Abstract

:

Simply Summary

Some natural phytogenic feed additives, which contain several active compounds, have been shown to be effective alternatives to traditional antibiotics. Gelsemium elegans (G. elegans) has been used as a traditional Chinese herbal medicine for many years, and it has an obvious growth-promoting effect on animals such as pigs. To our knowledge, the internal mechanism of the influence of G. elegans on the animal body is still unclear. Here, the plasma metabolomics and liver transcriptional profile of crude extract of G. elegans in pigs were reported for the first time and the metabolic consequences of feeding piglets G. elegans for 45 days were evaluated. The results showed that the addition of 2% G. elegans powder to feed is nontoxic to pigs. In addition, G. elegans could be used as a phytogenic feed additive, which could improve the immune function of piglets, and the latent mechanism of G. elegans may be related to various signaling pathways, including the MAPK signaling pathway and PPAR signaling pathway. Collectively, results of the current provide a clearer understanding of the molecular mechanism of the pharmacological effects of G. elegans, which is of great significance for a safer and more rational application of this phytogenic feed additives.

Abstract

Some naturalphytogenic feed additives, which contain several active compounds, have been shown to be effective alternatives to traditional antibiotics. Gelsemium elegans (G. elegans) is a whole grass in the family Loganiaceae. It is a known toxic plant widely distributed in China and has been used as a traditional Chinese herbal medicine for many years to treat neuropathic pain, rheumatoid pain, inflammation, skin ulcers, and cancer. However, G. elegans not only is nontoxic to animals such as pigs and sheep but also has an obvious growth-promoting effect. To our knowledge, the internal mechanism of the influence of G. elegans on the animal body is still unclear. The goal of this work is to evaluate the metabolic consequences of feeding piglets G. elegans for 45 days based on the combination of transcriptomics and metabolomics. According to growth measurement and evaluation, compared with piglets fed a complete diet, adding 20 g/kg G. elegans powder to the basal diet of piglets significantly reduced the feed conversion ratio. Results of the liver transcriptome suggest that glycine and cysteine-related regulatory pathways, including the MAPK signaling pathway and the mTOR signaling pathway, were extensively altered in G. elegans-induced piglets. Plasma metabolomics identified 21 and 18 differential metabolites (p < 0.05) in the plasma of piglets in the positive and negative ion modes, respectively, between G. elegans exposure and complete diet groups. The concentrations of glycine and its derivatives and N-acetylcysteine were higher in the G. elegans exposure group than in the complete diet group.This study demonstrated that G. elegans could be an alternative to antibiotics that improves the immune function of piglets, and the latent mechanism of G. elegans may be related to various signaling pathways, including the MAPK signaling pathway and the PPAR signaling pathway.

1. Introduction

In the current trend of “restricted feeding antibiotics” or even “no feeding antibiotics” in livestock and poultry production, phytogenic feed additives (PFAs), as plant-derived products, are often used in animal feed to improve the performance of livestock. PFAs have complex compositions and complex mechanisms of action. Thus, the study of the mechanisms of PFAs is important in the rational and scientific development of PFAs for livestock.
Gelsemium elegans (G. elegans), one of three species of Gelsemium, is a genus of flowering plants belonging to the family Loganiaceae [1]. G. elegans is mainly distributed in Southeast Asia and has been used as a traditional Chinese medicine for treating neuropathic pain, rheumatoid pain, spasms, skin ulcers, and cancer for many years [2,3]. G. elegans is a known toxic plant, and its toxicity limits its appropriate dosage and clinical use. However, interestingly, G. elegans is not toxic to pigs, sheep, and other animals and has an obvious growth-promoting effect. Liu et al. discovered and reported in 1994 that the average weight of pigs fed a diet with G. elegans was 11.6 kg higher than that of pigs fed a diet without G. elegans, and the weight gain-promoting effect of G. elegans was obvious [4]. The combined use of ginseng (with G. elegans) as a feed additive can increase the daily weight gain of pigs by 16.6% and the feed conversion rate by 18.2%, improving economic benefits for farmers [5].Chen et al. fed G. elegans extract to pigs for 49 day, and the average daily gain and feed intake of pigs was improved significantly (p < 0.05), and the feed conversion ratio was reduced significantly (p < 0.05) [6]. All these results suggest that G. elegans has a good effect on promoting animal growth. At present, Cao et al. found that gelsedine-type alkaloids were the major active ingredients that predict and explain the efficacy and toxicity of G. elegans [7]. However, the underlying mechanism of the influence of G. elegans on the animal body is still unclear.
The absence of an appropriate research method makes it difficult to clarify the mechanisms of most PFAs. However, the advent of omics technologies has made these analyses possible. Metabolomics is an important branch of systems biology. It is based on the analysis of the endogenous metabolites of various biofluids and tissue extracts and aims to identify latent relationships between changed metabolic profiles and the physiological status of the biosystem [8]. Consequently, it is reasonable to use metabolomics to explore the mechanism of PFAs and evaluate their safety. In contrast to metabolomics, transcriptomics studies gene expression, regulatory systems, and regulatory changes at the level of mRNA. By associating transcriptomics with metabolomics and by combining their respective advantages, a deeper truth of life can be revealed, and its wholeness can be known.
Recently, studies have shown that CYP3A4/5 in liver microsomes mediated the metabolism of G. elegans [9], and G. elegans has remarkable effects on lipid metabolism, such as attenuation of liver steatosis [10]. In addition, blood is the main carrier of oxygen, nutrient, and metabolite transport in the animal body. Largely unexplained effects of G. elegans were found using screening techniques, such as transcriptomics and metabolomics, on several other metabolic pathways, such as metabolism of amino acids and cellular stress response [11], overall indicating a multifaceted influence of G. elegans on metabolism. At present, there are few studies on the effect of G. elegans on pig liver and its molecular mechanism, and there are no metabolomic reports regarding the effects of G. elegans on pigs. Thus, in order to investigate the effects of G. elegans on the pigs’ metabolism as comprehensively as possible, several omics-techniques, such as transcriptomics and metabolomics, were applied on key metabolic tissues, such as liver and plasma of pigs.

2. Materials and Methods

2.1. Materials and Reagents

Wild G. elegans were collected from Fujian province in China, which were collected during the vegetative period. Associate Professor Qi Tang at Hunan Agricultural University authenticated the samples. The samples were stored at our laboratory and the voucher number was No. 1537201809. The crude samples of G. elegans were dried and milled into a powder.
Methanol (MeOH), water (H2O), formic acid, and acetonitrile (ACN) were purchased from Thermo Fisher Scientific (Waltham, MA, USA), and the purity of the above reagents was LC–MS grade. AmpureBeads was purchased from Beckman Coulter Co. (Brea, CA, USA). Quant—iTPicoGreen dsDNA Assay Kit was purchased from Life Technologies (Carlsbad, CA, USA). TruSeq RNA LT Sample Prep Kit v2, TruSeq PE Cluster Kit v3-cBot-HS, TruSeq SBS Kit v3-HS (200-cycles) were provided by Illumina Co. (San Diego, CA, USA). Hunan Xinwufeng, Yong’an branch (Changsha, China) kindly provided the piglets.

2.2. Animals and Treatments

We used in the present study 20 healthy castrated male ternary hybrid piglets (initial BW = 20 ± 2 kg, 60 day old) fed a complete diet (the control group, n = 10) or a complete diet with 20 g/kg G. elegans powder (the G. elegans-treated group, n = 30). The formulations and nutrient levels of each diet have previously been reported [12]. The piglets were in a healthy condition and the living environment was provided in accordance with animal welfare standards in the whole experimental period. The experimental period lasted for 45d, and the weight and feed intake of piglets were recorded every two weeks. After the end of the experiment, the administration was stopped, and all piglets fasted for 24 h. The piglets were slaughtered within one day after stopping drug administration. Blood and urine were collected for clinical chemistry and hematology analyses. The ileum and liver were surgically removed and weighed. Details of the organization’s storage have been previously reported [13]. Briefly, a fraction of the livers were fixed with a 75% alcohol solution for histopathological examination; the remaining tissue sample was immediately placed in a centrifuge tube, sealed with a sealing membrane, quick-frozen in liquid nitrogen, and stored at −80 °C until the RNA was extracted from the tissue.

2.3. Plasma Biochemical and Immunity Parameters

A hematologic analyzer (Mindray bc—2800vet, Shenzhen, China) was used to analyze routine blood parameters such as red blood cells (RBS), hemoglobin (HGB), mean red blood cell hemoglobin (MCH) content, mean red blood cell hemoglobin concentration (MCHC), and white blood cell (WBC) count in whole blood. Liver tissues were embedded in paraffin, stained with hematoxylin and eosin, and examined under a light microscope (Aoxiang Optoelectronic UB103I, Chongqing, China).

2.4. Transcriptome Analysis

Livers from three pigs in each treatment group were randomly selected for transcriptomic analysis. RNA extraction and quality inspection were carried out on the sample tissue according to the TRIzol extraction kit instructions. After passing the quality inspection, double-ended (PE) sequencing was carried out to construct an RNA library using the Illumina HiSeq sequencing platform (Illumina, San Diego, CA, USA). The protocols were performed exactly as described in our previous publications [13].
Six important differentially expressed genes (DEGs) (ATP2B3, MAT2A, CHDH, SLC20A2, SLC28A1, MT3) were selected. Quantitative real-time PCR (qRT-PCR) verification was performed using a Tianlong TL988 fluorescence quantitative PCR instrument (Xi’an Tianlong Technology Limited). PCR data were analyzed using the comparative Ct (2−ΔΔCt) method.

2.5. Metabolomic Analysis

2.5.1. Plasma Sample Collection and Preparation

Plasma samples (100 μL) were placed in 1.5 mL centrifuge tubes, and then 400 μL of an 80% methanol–water solution was added, vortexed, stored at −20 °C for 60 min, and centrifuged at 14,000 rpm and 4 °C for 20 min. Then, a certain amount of supernatant was placed in a 1.5 mL centrifuge tube, the mixture was lyophilized in vacuo, and the residue was reconstituted in 100 μL of solvent, vortexed, and centrifuged at 14,000 rpm and 4 °C for 15 min. The supernatant was then subjected to LC–MS/MS analysis.

2.5.2. UPLC–MS/MS Conditions

Sufficient chromatographic separation was achieved with mobile phase A (positive ion mode: 0.1% formic acid–water, 95% acetonitrile, and 10 mM ammonium acetate; negative ion mode: 0.1% formic acid–water, 95% acetonitrile, and pH 9.0) and mobile phase B (positive ion mode: 0.1% formic acid–water, 50% acetonitrile, and 10 mM ammonium acetate; negative ion mode: 50% acetonitrile, 10 mM ammonium acetate, and pH 9.0). The gradient elution was as follows: 0–1.0 min, 98% A; 1–17.5 min, 50% A; and 17.5–20 min, 98% A. The sample injection volume was 20.0 μL. The MS/MS analytical conditions were as follows: The Turbo Spray source voltage and temperature were set to 3.2 kV and 320 °C, respectively.

2.5.3. Metabolomics Data Processing

Raw data were collected using Thermo Scientific Exact Finder workstation software (Waltham, MA, USA), and the obtained data required preliminary screening by importing them into the Compound Discoverer (CD) database under conditions of retention time and m/z parameters. The XCMS software was for retention time correction, peak identification, peak extraction, peak integration, and peak alignment. The combination of supervised partial least squares-discriminant analysis (PLS-DA) and univariate statistical analysis was used to screen different metabolites. Qualitative analysis of metabolites was carried out by software-built secondary mass spectrometry database and a common database, such as mzCloud.

3. Results

3.1. Growth Performance and Routine Blood Analysis

Throughout this study period, no abnormality, no disease, and no death of piglets was observed. According to the growth measurement and evaluation, a week was selected for weighing and calculating the feed conversion ratio (Table 1). The results indicate that adding 20 g/kg G. elegans powder to the basal diet of piglets could significantly reduce the feed conversion ratio, but the feed intake was lower and the growth rate was lower as well. The results of routine blood examination (Table 2) suggest that there was no significant difference in most indexes between the G. elegans-treated and control groups (p > 0.05), but the number of neutrophils and leukocytes in the G. elegans-treated group increased. The mean corpuscular volume in the G. elegans-treated group was significantly lower than that in the control group (p < 0.05).

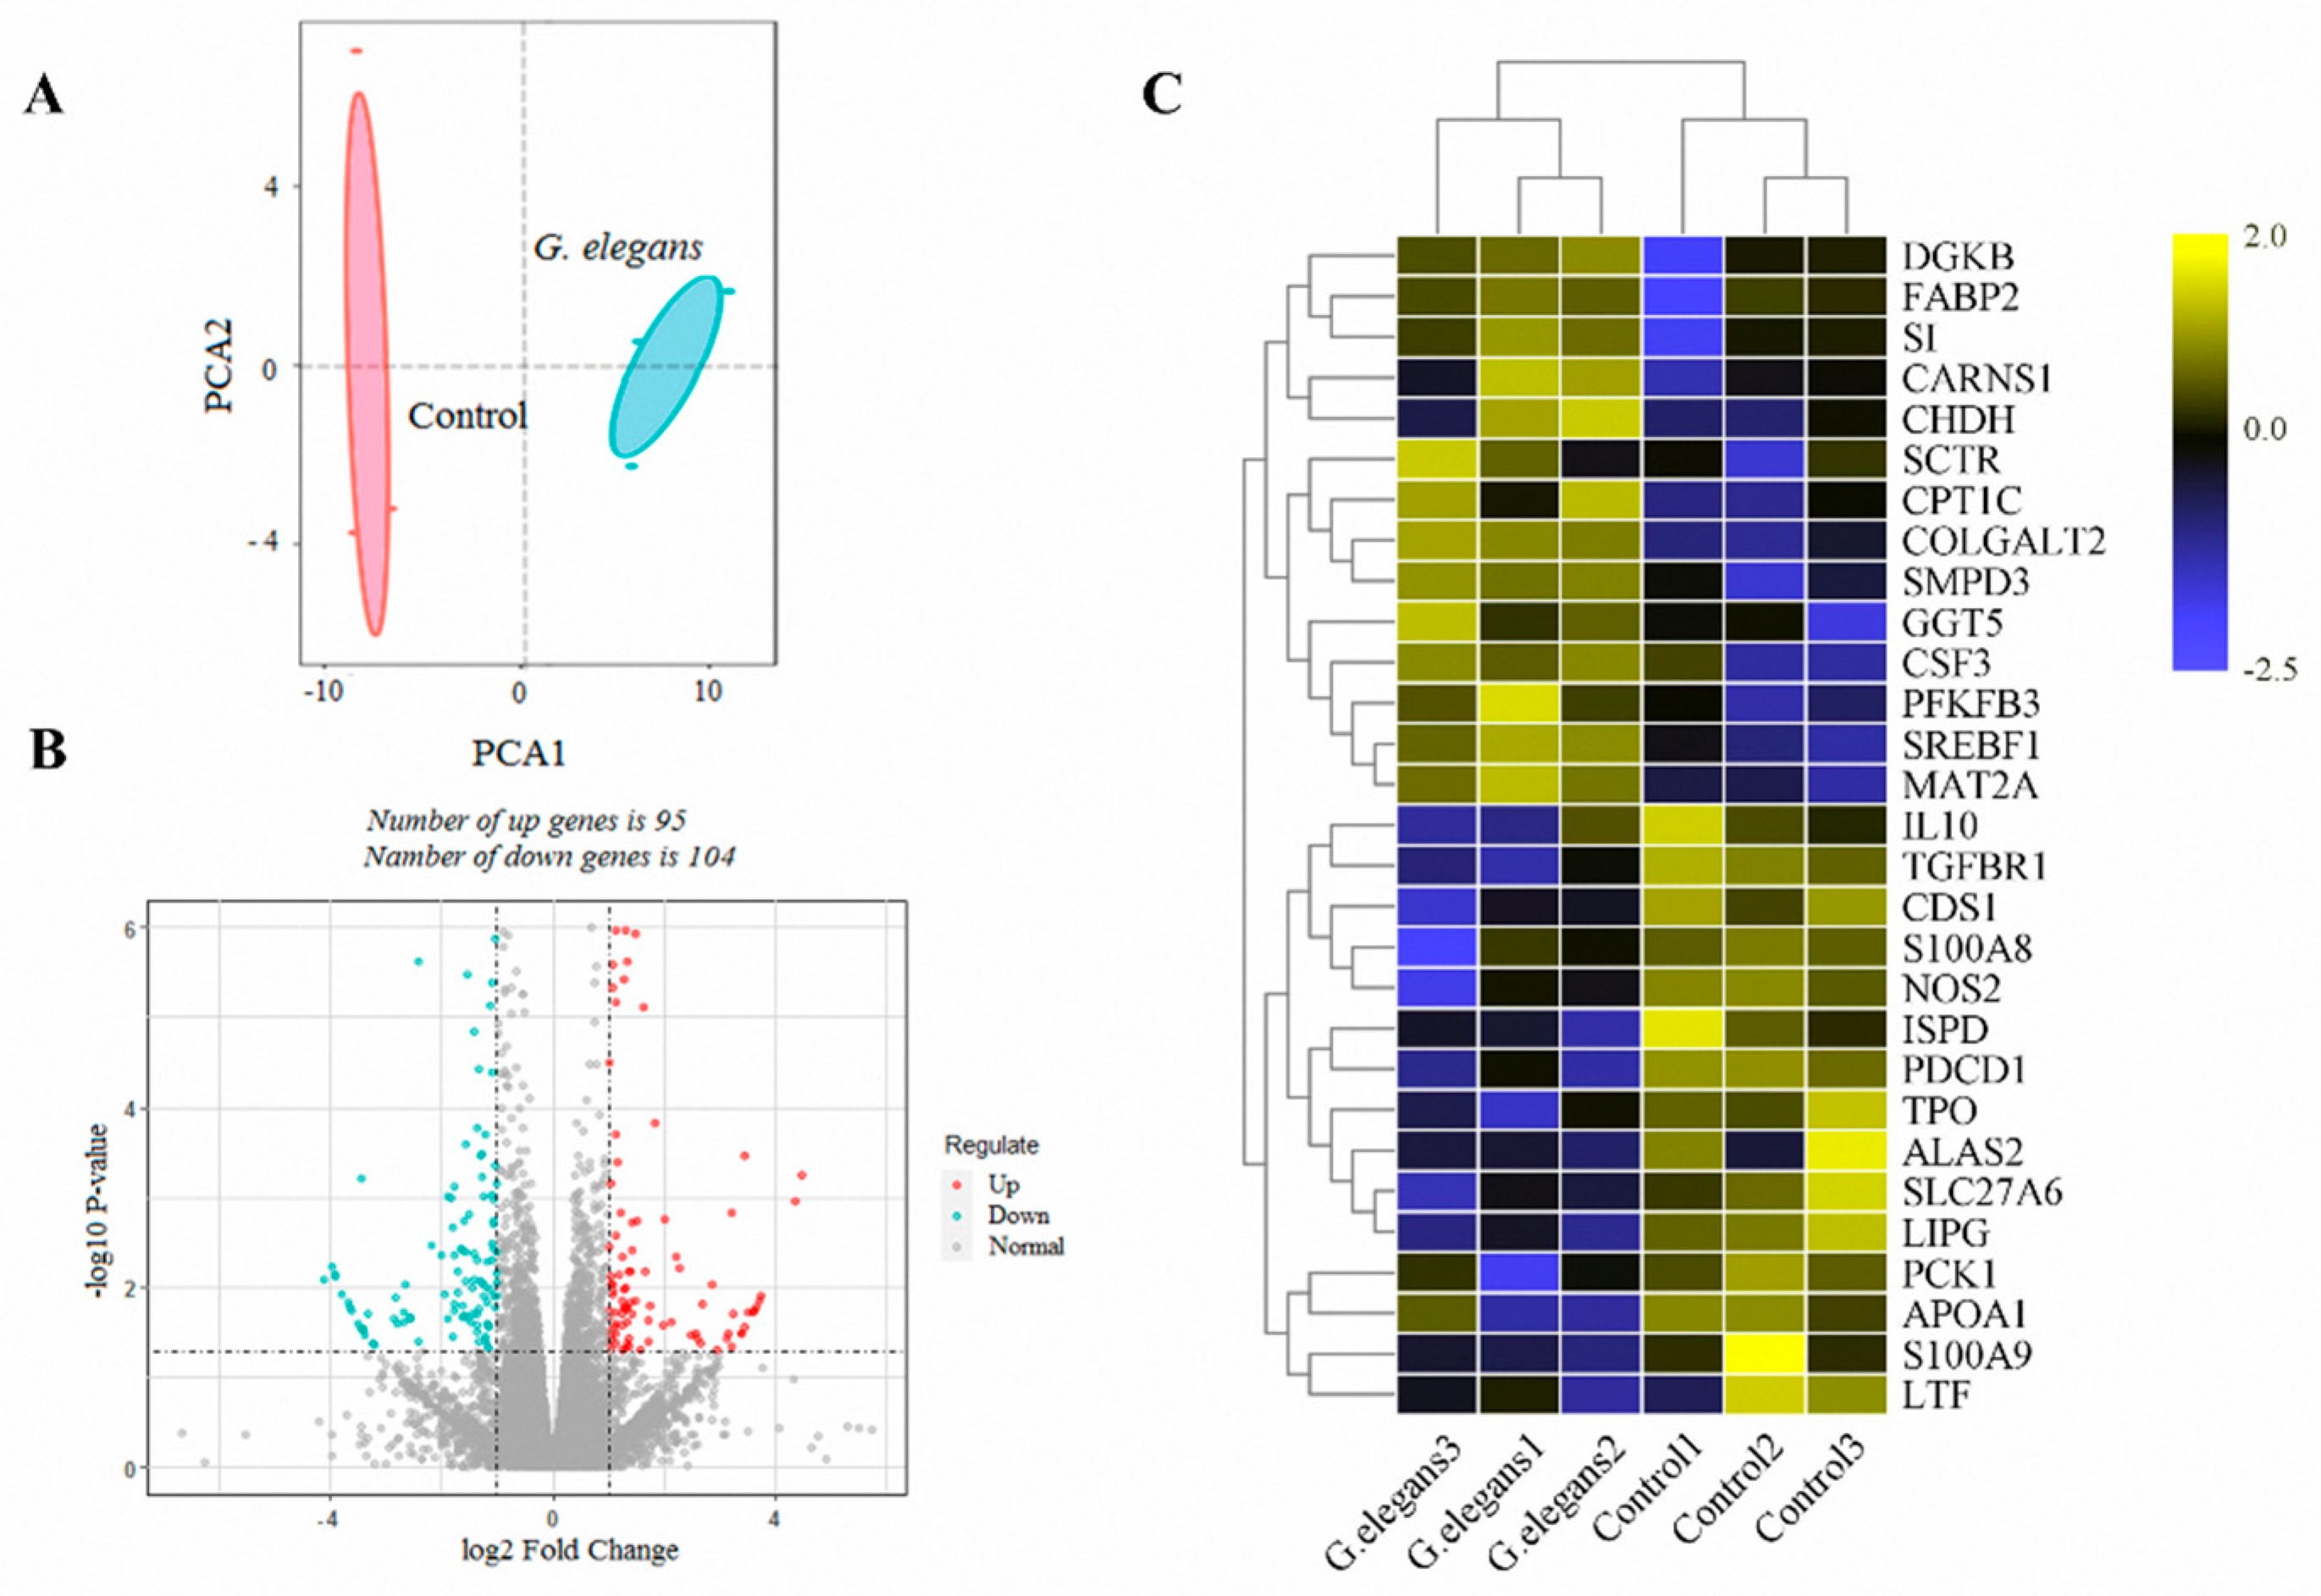
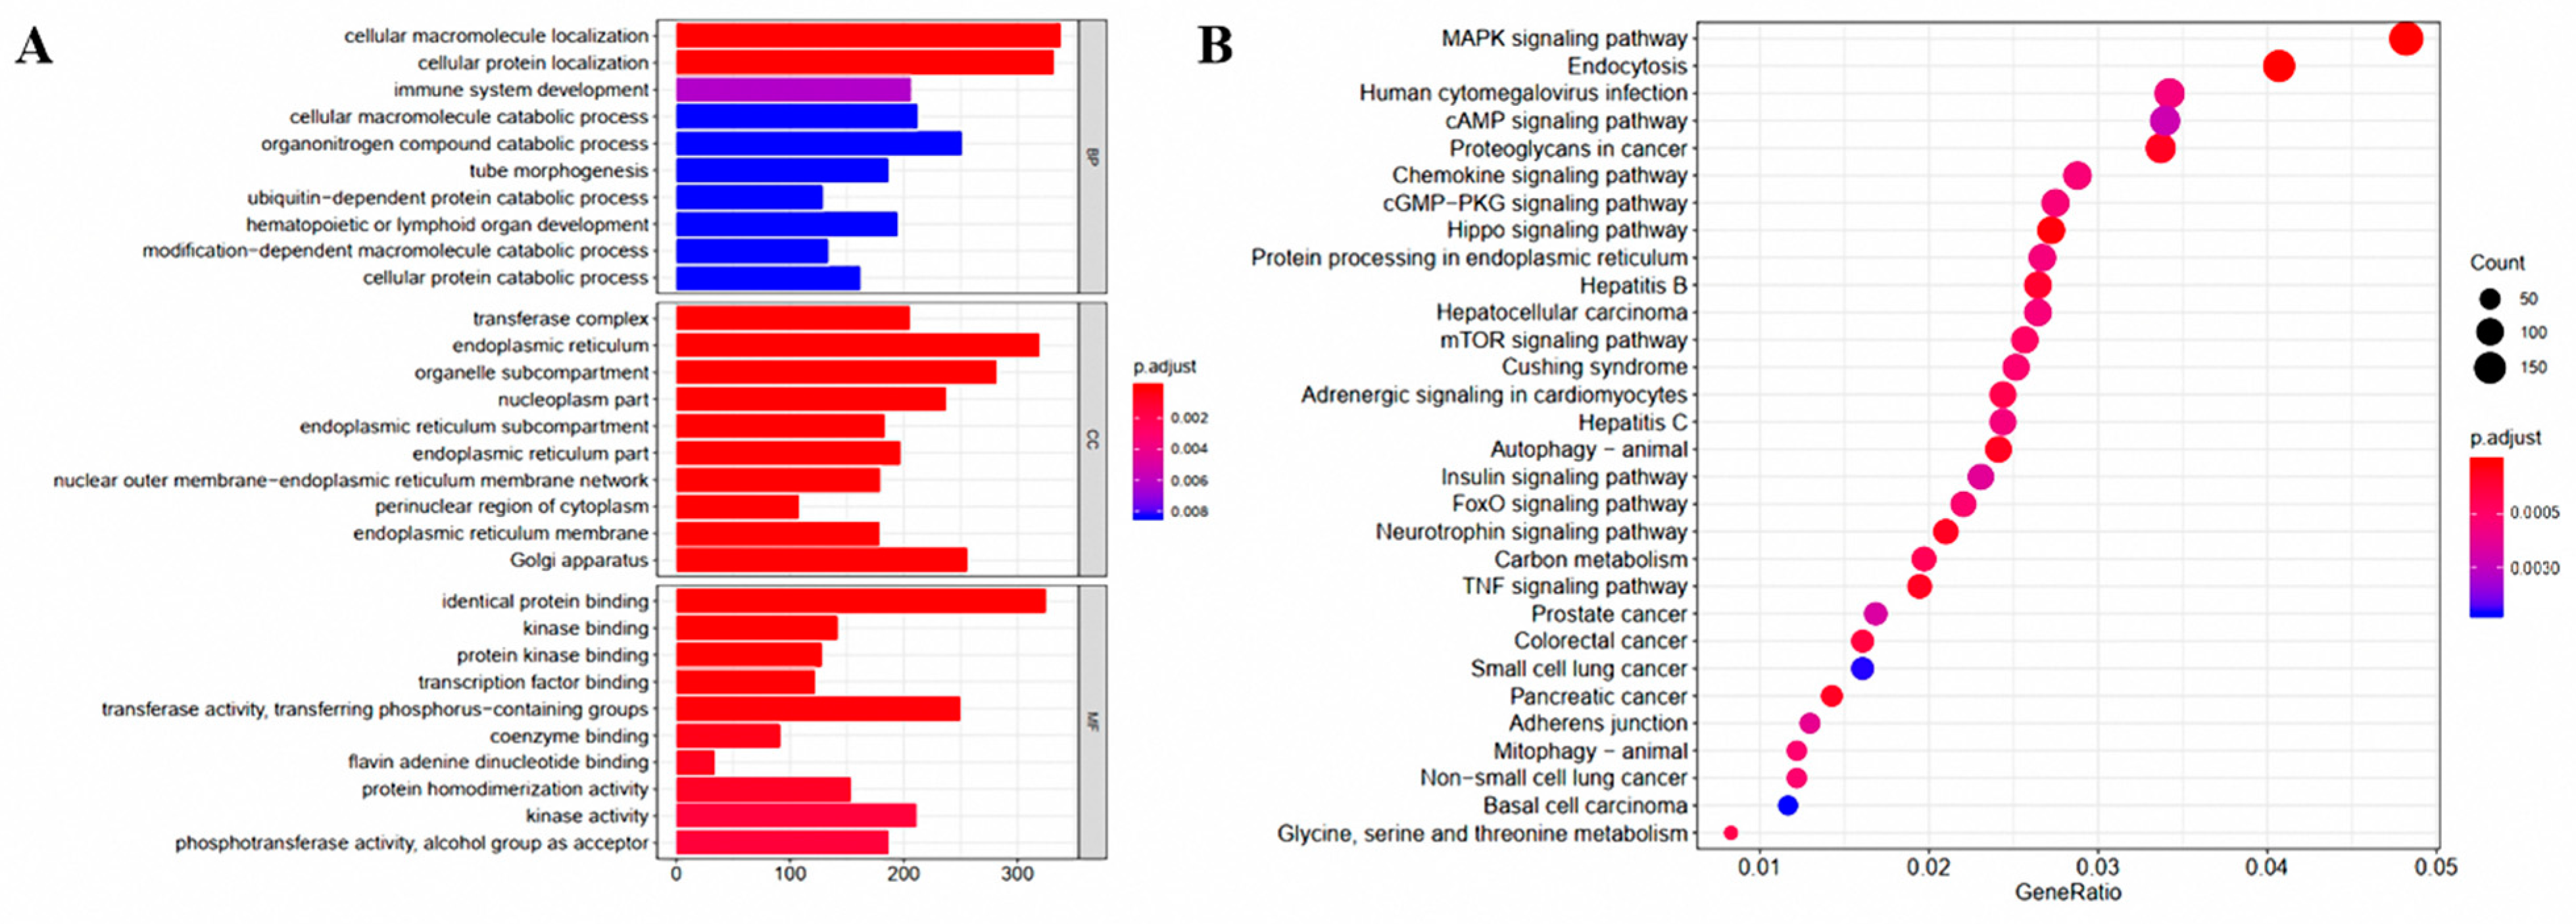
3.2. Analysis of the Liver Transcriptome under the Influence of G. elegans

By analyzing the liver transcriptome of male piglets, we found a total of 199 DEGs, among which 95 were up-regulated and 104 were downregulated (Figure 1B). Subsequently, PCA was used to examine gene expression differences between groups. As shown in Figure 1A, the G. elegans-treated group was obviously separated from the control group by the first component (PCA1), and the results were consistent with the heat map. The differences in metabolism and immune-related genes according to the hierarchical clustering analysis heat map also indicate the differences between the two groups (Figure 1C). Results of RNA-seq analysis indicate that the expression levels of the lipid metabolism-related genes GGT5, SMPD3, CPT1C, FABP2, and DGKB; the carbohydrate metabolism-related genes SI and PFKFB3; and the amino acid metabolism-related genes MAT2A, CARNS1, COLGALT2, and GGT5 were all up-regulated; and the expression levels of immune-related regulatory genes S100A8 and S100A9 were significantly decreased. Analysis of the enriched GO (genetic ontology) terms among DEGs was performed to assess the effects of feeding G. elegans (Figure 2A). The most important terms in the biological processes (BP) category were “cellular protein localization” and “immune system development”. In the molecular function (MF) category, most catalytic gene binding functions (identical protein binding, kinase binding, protein kinase binding, transcription factor binding, etc.) were abundant, and the results suggest that the metabolic activities of animals were effectively activated by exposure to G. elegans. Functional enrichment analyses using the Kyoto Encyclopedia of Genes and Genomes (KEGG) pathways revealed the significant enrichment of several major metabolic pathways (Figure 2B). Glycine and cysteine-related regulatory pathways, including the MAPK signaling pathway and the mTOR signaling pathway, were extensively altered in G. elegans-treated piglets. Furthermore, the pathways associated with hepatitis B were significantly changed by exposure to G. elegans. Results of this study suggest that G. elegans induced changes in gene expression related to amino acid, lipid, and carbohydrate metabolism and immune regulatory pathways.
The ileum transcriptome results of male piglets were analyzed. The G. elegans-treated and control groups were compared and analyzed by using |log2 fold change| ≥ 1 and p ≤ 0.05 as the screening conditions. A total of 446 DEGs were identified in this study, of which 237 genes were up-regulated, and 209 genes were down-regulated. In general, a mixture of up-regulated and down-regulated DEGs was observed in the immune and inflammatory response pathways.
To verify the transcriptome analysis results of the liver and ileum, 6 important DEGs were selected for verification and quantification by qRT-PCR. As shown in Table 3, the results showed that the expression profiles of these genes as evidenced by qRT-PCR were consistent with those evidenced by the transcriptome analysis, which confirmed the reliability of our RNA sequencing data.

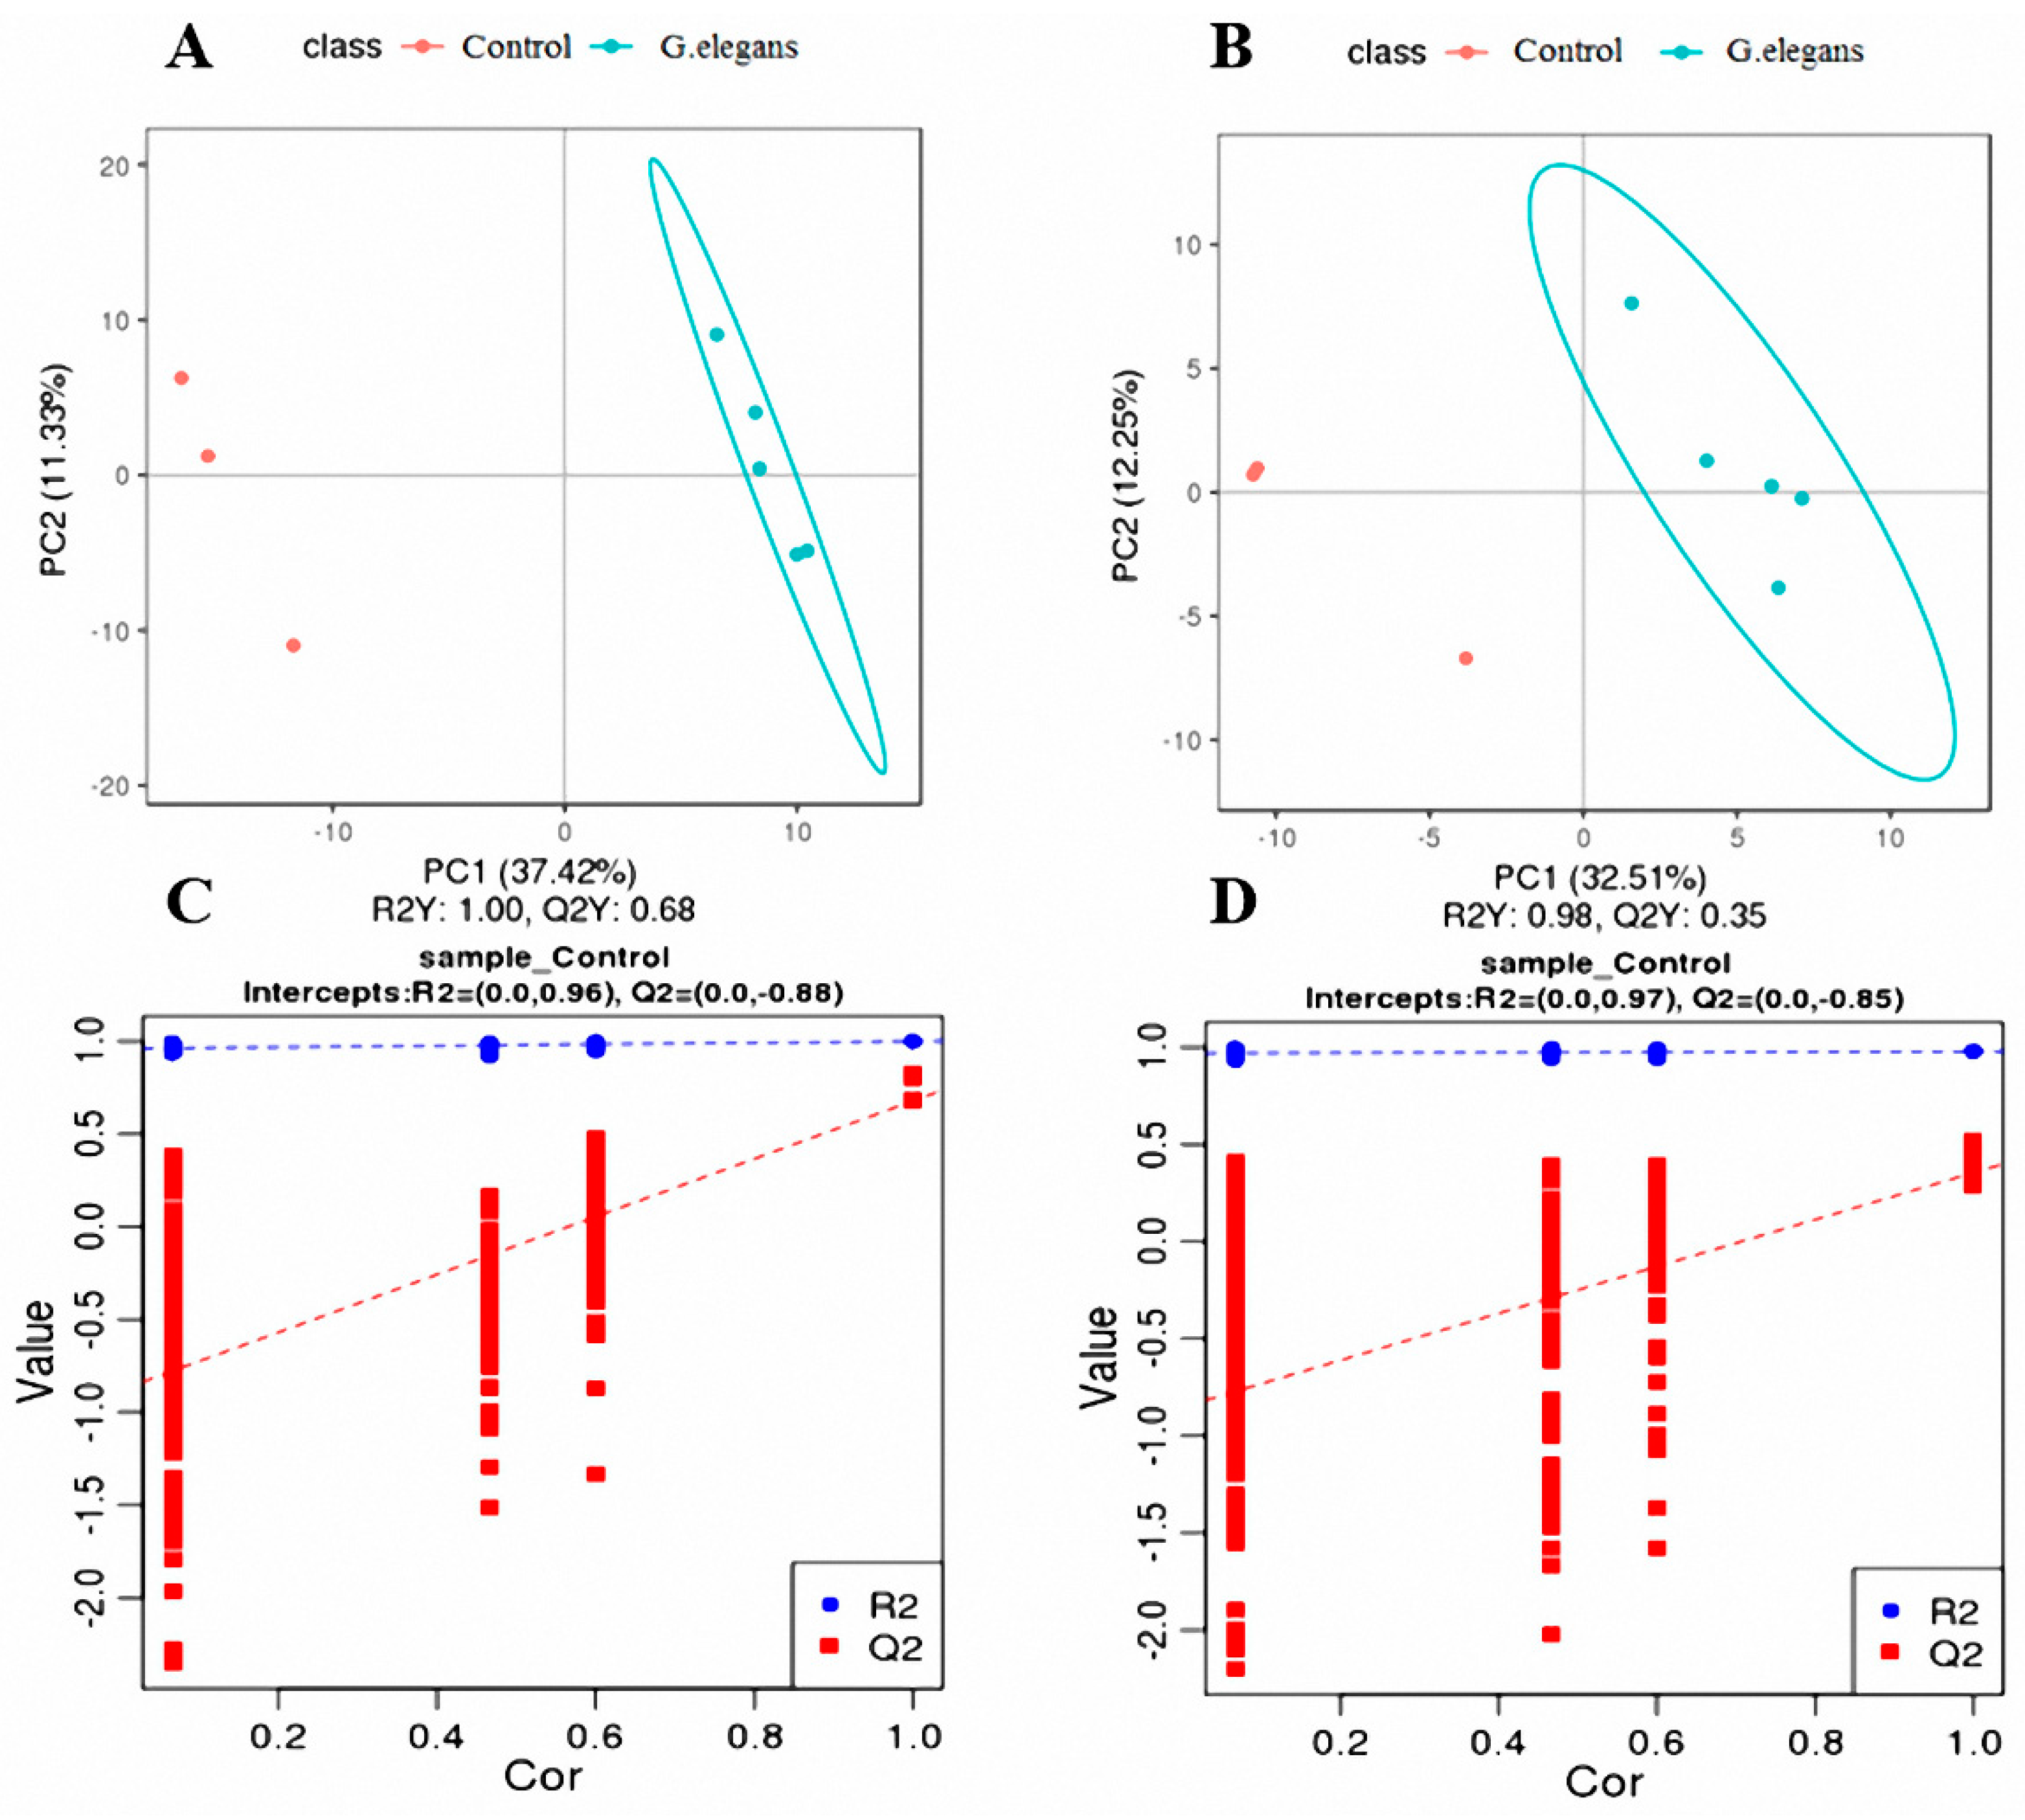
3.3. Analysis of the Plasma Metabolome under the Influence of G. elegans

PLS-DA analysis was performed on all metabolites analyzed in the positive and negative ion modes to estimate the metabolic changes in piglets caused by different feeding conditions. In the positive ion mode, R2 = 0.96 and Q2 = 0.88, and in the negative ion mode, R2 = 0.97 and Q2 = 0.85, indicating that the model described the samples well and could be used to search for biomarkers in the next step. In the PLS-DA scatter plot (Figure 3), the G. elegans-treated and control groups were clearly separated, indicating that G. elegans could regulate normal metabolic pathways.
A total of 498 metabolites in positive ion mode and 293 metabolites in negative ion mode showed statistically significant differences, as evidenced by variable importance in the projection (VIP) value > 1.0 and p-value (T-test) < 0.05. Among these metabolites, 21 and 18 differential metabolites were identified in the plasma of piglets in the positive and negative ion modes, respectively, in the G. elegans-treated and control groups (Table 4 and Table 5).

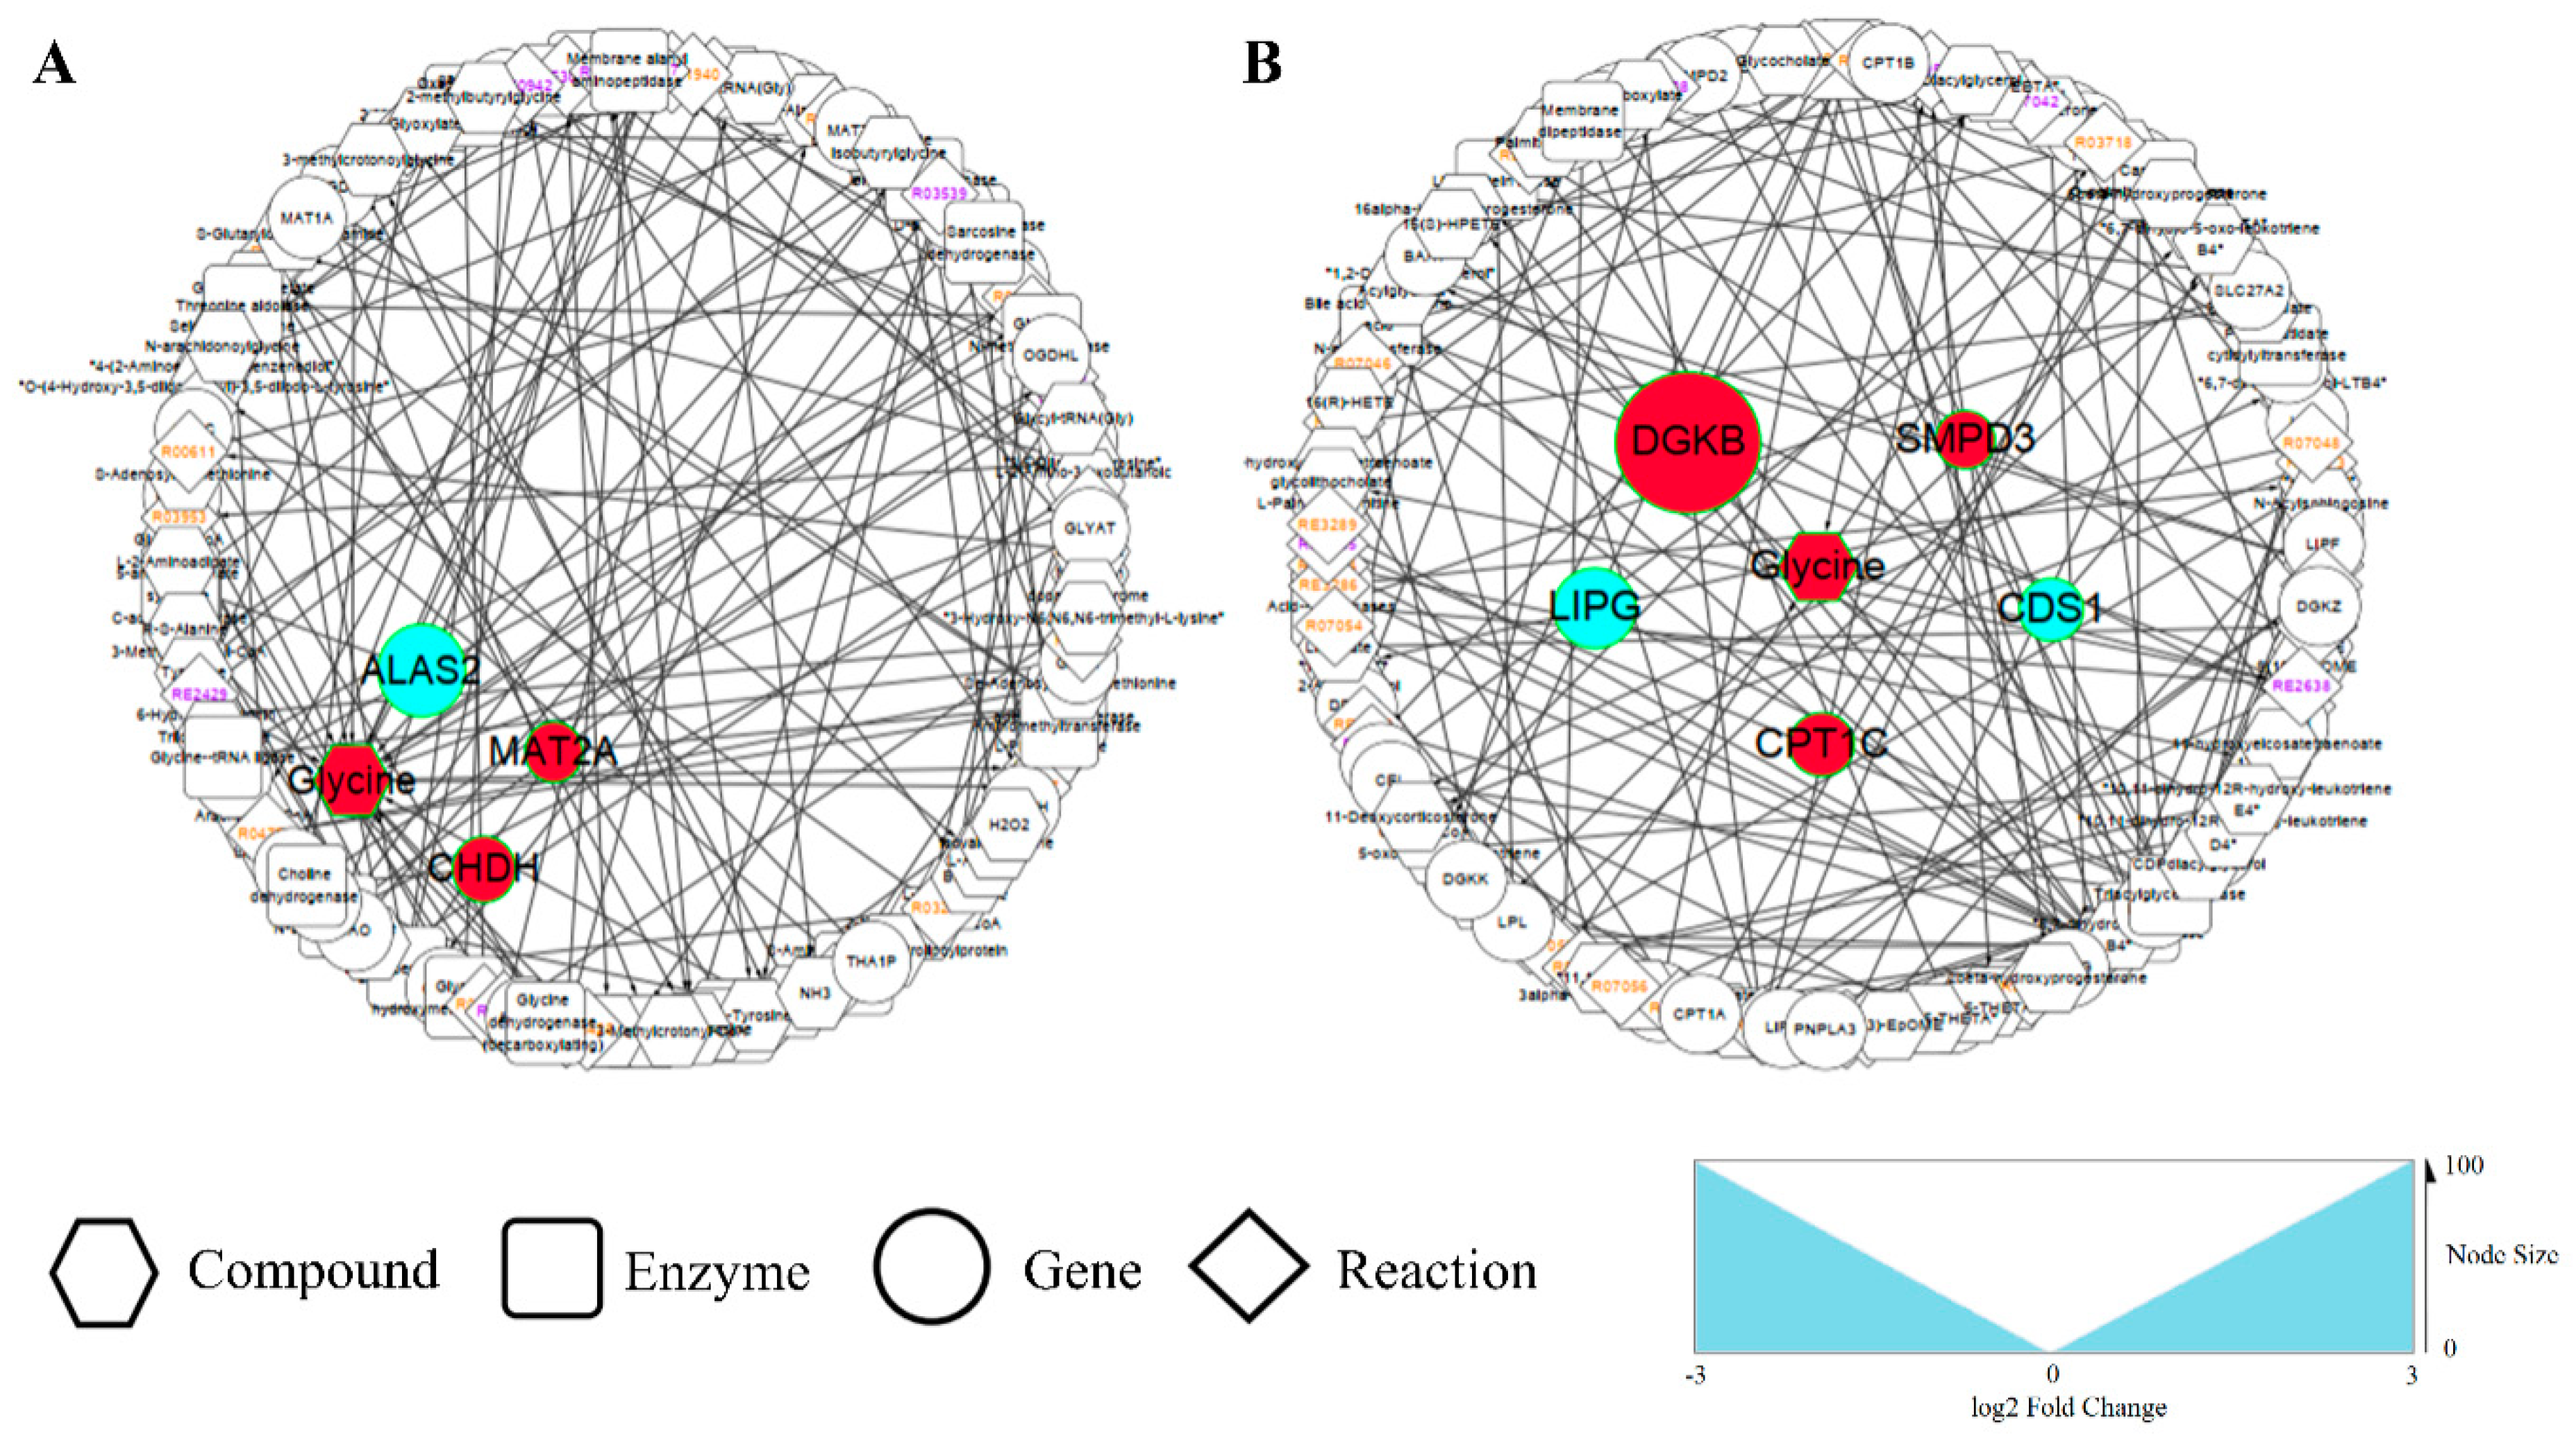
3.4. Integrated Enrichment Analysis of Transcript and Metabolite Profiles

Integrated enrichment analysis indicated that G. elegans supplementation could affect lipid metabolism, sugar metabolism, and amino acid metabolism, such as glutathione metabolism and glycine, serine, and threonine metabolism. Specifically, amino acid and lipid metabolic changes were mainly identified by the transcriptome and metabolome analyses (Figure 4), and sugar metabolism changes were mainly identified in the transcriptome analysis.

3.4.1. Amino Acid Metabolism Alterations

Metabolomic and transcriptomic analysis confirmed the effect of G. elegans on amino acid metabolism. The most relevant pathways were glutathione metabolism and glycine, serine, and threonine metabolism. The increase in plasma glycine in piglets exposed to G. elegans may be related to bile acid synthesis and metabolism. Bile acid is an endogenous molecule synthesized by cholesterol in the liver. The liver combines bile acid with glycine or taurine in a two-step reaction, and then the combined bile acid is actively transported to bile and stored in the gallbladder. Until bile acid is released into the duodenum after eating, conjugated bile acid is reabsorbed into the ileum and circulated to the liver through the portal vein; this process is called enterohepatic circulation [14]. Results of the ileum transcriptomics analysis indicate that the expression level of the SLC51A gene was increased in the G. elegans-treated group, compared to the controls. Due to the induction of the ileum transporter encoded by this gene, the reabsorption of conjugated bile acid by the intestinal tract was enhanced [14], and the content of conjugated bile acid in the liver was increased through intestinal-hepatic circulation, which may lead to a decrease in the feedback of liver bile acid metabolism and a decrease in glycine binding reaction, leading to an upregulation of glycine in the plasma metabolite analysis.
N-acetylcysteine (NAC), the precursor of cysteine, is rapidly metabolized by the gut to generate GSH. Glycine can be converted into GSH by binding with l-glutamylcysteine. Although G. elegans exhibited no significant effect on the concentration of glutathione in the plasma of piglets, the metabolomic analysis results suggest that NAC and glycine derivatives were significantly up-regulated in the plasma of piglets exposed to G. elegans, compared to the controls. In addition, the expression level of the GGT5 gene encoding gamma-glutamyl transferase was up-regulated in the liver of piglets exposed to G. elegans.

3.4.2. Lipid Metabolism Alterations

Results of transcriptomic analysis indicate that G. elegans induced a large number of changes in hepatic lipid metabolism genes in piglets. In the study, although G. elegans exhibit no significant effect on the lipid concentration in the plasma of piglets, koumine, an indole alkaloid isolated from G. elegans, significantly reduced the levels of triglycerides (TG), cholesterol (TC), low-density lipoprotein (LDL-C), alanine aminotransferase (ALT), and aspartate carbamoyl transferase (AST) in the serum of nonalcoholic fatty liver disease (NAFLD) rats [10] and increased the level of high-density lipoprotein (HDL-C). The expression level of the lipase gene associated hydrolyzed HDL-C, LIPG, was significantly lower in the livers of piglets exposed to G. elegans than in those of piglets fed the control diet. The expression levels of the sphingomyelin metabolic hydrolase-related gene SMPD3 and the lipid metabolism-related genes DGKB and CPT1C were up-regulated.

4. Discussion

4.1. Effect of G. elegans on Intake and Average Gain

Wu et al. [15] fed piglets with a basal diet containing 0.3% and 0.5% G. elegans powder for 30 days. The results showed that the weight gains of the experimental groups fed with 0.3% and 0.5% G. elegans powder were higher than those of the control group, and the feed conversion ratio was significantly reduced by 3.81% and 10.59%, respectively.
In this study, G. elegans could significantly reduce the material to weight ratio and promote the digestion and absorption of animals which is consistent with the previous report. However, contrary to the discovery of Wang et al. [16], the additional dose of 20 g/kg G. elegans whole grass did not significantly improve the growth of piglets, which might be due to the bitter taste of the G. elegans whole grass dosage form and poor palatability, which may affect the appetite of piglets. The whole grass dosage form should be avoided as much as possible, and the G. elegans extract form should be used for feeding in actual production and application. According to reports, at the dose of 50 mg/kg, G. elegans showed remarkable growth-promoting effects but had no significant effect on the average daily feed intake of piglets [17]. However, G. elegans has some kind of toxicity [18], so the residues in blood and muscle are a concern of people. It is reported that Gelsemium alkaloids are absorbed rapidly in pigs, and the T1/2 values of most Gelsemium alkaloids ranged from 8 h to 12 h, suggesting that the elimination was slow and there may still be residual levels in pigs [19]. Our team will further study the residue depletion of G. elegans in pigs for food safety.

4.2. Effect of G. elegans on Physiological Function of Weaned Piglets

Routine blood tests can effectively reflect the body’s resistance to diseases. The reduction of white blood cells and hemoglobin in the blood can be regarded as the signs of decreased antibody resistance and reactivity. T lymphocytes can not only mediate the cellular immune response of the animal body, but also, the cytokines secreted in the immune response have important regulatory effects on the immune response of the body, including the proliferation, differentiation, and function of immune cells.
Many studies reported that G. elegans alkaloids triggered the immune response by promoting the expression of pro-inflammatory factors [20] and affect the activation and proliferation of T lymphocytes [10]. The results of the present study showed that compared with the control group, the counts of neutrophils and leukocytes in the blood of the G. elegans-treated group increased, which indicates that G. elegans improved the cellular immune function and disease resistance of the weaned piglets. In addition, the mean red blood cell volumes in the G. elegans-treated pigs, although significantly reduced, remained within the normal reference range without adverse effects.

4.3. Evidence That G. elegans Regulates Amino Acid Metabolism and Decreases p38 Activation

In the study, the results of which are presented here, the metabolomics results emphasize a series of metabolites related to amino acids, including glycine and its derivatives and NAC, which suggests that the regulation of amino acid metabolism plays an important role in the immune stimulation of G. elegans. Glycine has recently been classified as a nutritionally essential amino acid for maximal growth in young pigs. If glycine is insufficient in the body, amino acid metabolism will be affected, resulting in intestinal dysfunction. Studies have shown that glycine can protect a variety of organs, such as the liver, skeletal muscle, and small intestine, from certain harmful substances [17]. Wang et al. [21] investigated the cellular protective effects of glycine and indicated that glycine stimulates protein synthesis in IPEC-1 cells and inhibits oxidative stress by increasing intracellular glutathione concentrations. Moreover, various studies have shown that glycine can produce anti-inflammatory effects by decreasing reactive oxygen species and inflammatory mediator levels [19], inhibiting inflammatory cell aggregation, and reducing lipid peroxidation [22]. NAC can protect intestinal health and has a therapeutic effect in the treatment of colitis [23] and hepatitis [24]. The effects of NAC have been reported to be associated with decreases in the proinflammatory cytokines TNF-α, IL1β, and IL-6 [23,25]. As G. elegans contains many active ingredients, it is difficult to directly attribute the specific metabolic effects of these active ingredients. However, drug effects and other exogenous stimulation always lead to variations in the metabolic network of endogenous metabolites, mainly reflected in the types and quantities of metabolites present. Metabolomics can be used to investigate the overall effect of stimulation on the body through comprehensive and systematic detection and analysis of endogenous small molecule metabolites in biological samples [26]. Therefore, there is no doubt that the discovery of amino acid-related metabolites may provide new insights into the mechanisms of the immune stimulation of G. elegans.
Results of the transcriptome analyses identified 199 DEGs in the liver, and through GO enrichment analysis, it was found that these transcripts were mainly enriched in the biological processes of proteins and amino acid metabolism and immune responses. Peptidyl-cysteinenitrosylation and peptidyl-cysteine modification were directly related to cysteine. Four of the down-regulated genes, including NOS2, LTF, S100A9, and S100A8, are well-known to be involved in multiple processes of cysteine regulation. NOS2 encodes a type of oxide synthase that is expressed in the liver and is inducible by a combination of lipopolysaccharide and certain cytokines. It mediates the nitrogenation of cysteine, participates in the inflammatory response, and enhances the production of NO and proinflammatory mediators such as IL-6 and IL-8 [27]. Thus, G. elegans can reduce the synthesis of proinflammatory mediators by regulating the expression of nitric oxide synthase. According to previous reports, koumine can inhibit the secretion of NO, ROS, TNF-α, IL-6, and IL-1β and significantly reduce the mRNA and protein levels of iNOS [1], which is consistent with our observations. S100A9 and S100A8 are both members of the S100 family of proteins. This family of proteins has a wide range of intracellular and extracellular functions and is considered an important regulator of macrophage inflammation, tissue damage, and regulatory stress [28]. Similarly, the decreased expression of LTF supports the anti-inflammatory effect, as the gene encoding lactoferrin is up-regulated during inflammation, activating the innate immune system through surface receptors, producing immune complexes containing LTF, and triggering the infiltration of monocytes and macrophages [29]. Consequently, results of the gene expression profile indicate that G. elegans can significantly regulate the expression of genes related to cysteine metabolism and achieve anti-inflammatory effects.
It is worth mentioning that our previous study reported the same batch of experimental ileum transcriptional spectrum data [12], and the results suggest that the inflammation-related genes (such as C3, C5, S100A8, IL-8/CXCL-8, CSF2, IL-1/IL1A) were generally down-regulated, and the intestinal inflammatory response was inhibited in the G. elegans-treated group, compared to the controls, which was similar to the results of the liver transcriptome results in the present study.
With respect to oxidative stress, there is increasing evidence that glycine enhances the intestinal mucosal barrier, reduces intestinal inflammation, and inhibits oxidative stress by inhibiting NF-κβ and TNF-α activation and IL-1 and IL-6 production [30]. In addition, both glycine and NAC protect the lipopolysaccharide (LPS)-induced intestinal barrier in piglets through the mTOR and MAPK signaling pathways [17,31,32]. MAPK signaling in mammals mainly includes MAPKs, extracellular signal-regulated kinase (ERK), c-Jun N-terminal kinase (JNK), and p38, which play important roles in cell growth, proliferation, differentiation, migration, inflammation, and survival [33,34,35,36]. P38 mitogen-activated protein kinases are activated primarily in response to inflammatory cytokines and cellular stress. In the ileum transcriptomes, the p38 gene was down-regulated in the G. elegans-treated group compared to the controls. It was speculated that G. elegans could reduce the activation of p38 in the MAPK signaling pathway by regulating glycine and NAC-related metabolism and could play a role in protecting intestinal cells from oxidative stress. In some pharmacological mechanism studies of G. elegans, koumine has been observed to significantly reduce phosphorylation of p38 and ERK in the LPS-mediated MAPK signaling pathway in mouse cells, all of which are consistent with the reduction in p38 activation [1].

4.4. G. elegans Regulates Lipid Metabolism

To explore the influence of G. elegans on other metabolic pathways, this study conducted a comprehensive network analysis based on the transcriptomics and metabolomics analyses results. In the MetScape analysis [37], we identified seven metabolic pathways directly related to lipids. These pathways include unsaturated fatty acid metabolism pathways: linoleic acid metabolism and arachidonic acid metabolism, saturated fatty acid metabolism, glycerolipid metabolism, sphingolipid metabolism, steroid hormone biosynthesis, and metabolic pathways. The liver is the main site of fatty acid synthesis in animals. It first synthesizes palmitate and then produces other saturated fatty acids and unsaturated fatty acids. Unsaturated fatty acids exist mainly in the form of phospholipids in cell membranes. Under the action of phospholipase, unsaturated fatty acids produce free arachidonic acid, which is then converted into leukotrienes or prostaglandins by lipoxygenase or cyclooxygenase. The balance of these two substances plays an important role in regulating lipid metabolism [38].
Additionally, glycosphingolipids are membrane components that can affect numerous cellular events, including homeostasis, adhesion growth, motility, apoptosis, proliferation, stress, and inflammatory responses [39]. Interestingly, the alteration of lipid metabolites was also reported to be associated with type 2 diabetes risk in metabolomics studies [40,41]. In the transcriptome studies, we found that PPAR signaling pathways are involved in the lipid metabolism regulation of G. elegans in pigs. PPAR ligands activate nuclear hormone receptor family receptors, control many cell metabolism pathways, and play an important role in regulating cell differentiation, growth, and metabolism in higher organisms [42]. Three subtypes, namely PPAR alpha, PPAR beta, and PPAR-gamma, have been reported. PPAR alpha is expressed in the liver, kidney, heart, muscle, fat, and other organs [43] and is involved in the fatty acid metabolism and lipid transport in the liver, in lipoprotein oxidation and combination, and the uptake of fatty acids and assembly [44], and plays an important role in regulate hepatic fat metabolism. DEGs, including CPT-1, PCK1, and PATP, were enriched in the PPAR signaling pathway, andCPT-1 and PCK1 are downstream genes regulated by PPAR.
CPT-1 expression was increased by G. elegans supplementation. CPT-1 is a mitochondrial enzyme that plays an important role in regulating fatty acid metabolism. Lipid consumption is mainly oxidized by FAO through transport to the mitochondrial matrix, and the transport process is mediated by the CPT system, which is composed of CPT-1, acylcarnitine translocation enzyme, and CPT2 [45]. The activation of CPT-1 in an obesity (DIO) model has been reported to increase energy utilization and fatty acid oxidation [46]. Additionally, according to the RNA-seq results, the expression of CPT-1 was increased, and it was speculated that G. elegans could regulate the lipid metabolism process through CPT-1, thus improving the hepatic function. PCK1 catalyzes gluconeogenesis, that is, the synthesis of glucose, and plays an important role in maintaining glucose homeostasis. By regulating the expression of this gene, blood glucose levels can be maintained within a well-defined range. According to the report, the excessive expression of PCK1 can result in type II diabetes symptoms [47], and excessive sugar dysplasia may also lead to the occurrence of metabolic diseases such as insulin resistance and hyperglycemia, indicating that PCK1 is important in glucose homeostasis. In the present study, the PPAR pathway inhibited the expression of PCK1, suggesting that G. elegans could be used to inhibit the excessive production of glycogen via PCK1-mediated regulation of sugar dysplasia, thus improving metabolic diseases such as type II diabetes.

5. Conclusions

The addition of 20 g/kg G. elegans powder to feed is nontoxic to pigs. G. elegans mediates the MAPK signaling pathway through glycine and NAC metabolism regulation-related gene expression, reduces p38 activation, and exerts antioxidant and anti-inflammatory effects. The PPAR signaling pathway mediates lipid metabolism, including the expression of important genes such as PCK1 and CPT-1, to regulate hepatic lipid metabolism and gluconeogenesis and improve hepatic function. Collectively, results of the current study provide a clearer understanding of the molecular mechanism of the pharmacological effects of G. elegans, which is of great significance for a safer and more rational application of this herbal medicine.

Author Contributions

C.-Y.H.: Investigation, Writing—Original Draft. K.Y.: Conceptualization, Methodology. J.-J.C.: Methodology. Z.-Y.W.: Investigation. Y.W.: Conceptualization. Z.-L.S.: Conceptualization. Z.-Y.L.: Conceptualization, Resources, Supervision, Writing—Review and Editing. All authors have read and agreed to the published version of the manuscript.

Funding

This work was supported by the National Natural Science Foundation of China (Grant No. 31972737).

Institutional Review Board Statement

This study was carried out in accordance with the Guidelines for the Care and Use of Laboratory Animals of China and was approved by the Animal Care and Use Committee of the Institute of Subtropical Agriculture, Chinese Academy of Sciences (IACUC# 201302).

Data Availability Statement

The data used to support the findings of this study are available from the corresponding author upon reasonable request.

Acknowledgments

Acknowledgments to Hunan Xinwufeng, Yong’an branch (Hunan, China), which kindly provided samples of piglets.

Conflicts of Interest

The authors declare no conflict of interest.

Abbreviations

BPbiological processes
CDCompound Discoverer
DEGsdifferentially expressed genes
ERKextracellular signal-regulated kinase
G. elegansGelsemium elegans
GOgenetic ontology
JNKc-Jun N-terminal kinase
KEGGKyoto Encyclopedia of Genes and Genomes
LPSlipopolysaccharide
MFmolecular function
MAPKsmitogen-activated protein kinases
NACN-acetylcysteine
NAFLDNonalcoholic fatty liver disease
PCAprincipal component analysis
PLS-DApartial least squares-discriminant analysis

References

  1. Yuan, Z.; Matias, F.B.; Wu, J.; Liang, Z.; Sun, Z. Koumine Attenuates Lipopolysaccaride-Stimulated Inflammation in RAW264.7 Macrophages, Coincidentally Associated with Inhibition of NF-κB, ERK and p38 Pathways. Int. J. Mol. Sci. 2016, 17, 430. [Google Scholar] [CrossRef] [PubMed] [Green Version]
  2. Rujjanawate, C.; Kanjanapothi, D.; Panthong, A. Pharmacological effect and toxicity of alkaloids from Gelsemium elegans Benth. J. Ethnopharmacol. 2003, 89, 91–95. [Google Scholar] [CrossRef]
  3. Xu, Y.; Qiu, H.-Q.; Liu, H.; Liu, M.; Huang, Z.-Y.; Yang, J.; Su, Y.-P.; Yu, C.-X. Effects of koumine, an alkaloid of Gelsemium elegans Benth., on inflammatory and neuropathic pain models and possible mechanism with allopregnanolone. Pharm. Biochem. Behav. 2012, 101, 504–514. [Google Scholar] [CrossRef] [PubMed]
  4. Dao-Rong, L.; Tai-Kang, H.; You-Shun, W.; Yu-Min, F.; Fu-Qing, Z.; Qi-An, L. Experimental study on feeding ginseng to pigs. Chin. Anim. Husb. Vet. Med. 1994, 02, 67–68. [Google Scholar]
  5. Lin, Q.-Y. Compound pig ginseng feed additive fattening test report. Chin. Anim. Husb. Vet. Med. 1993, 05, 207–208. [Google Scholar]
  6. Chen, X.J.; Wang, Y.; Wang, S.S.; Wu, Y.; Li, Y.Y.; Sun, Z.L. Effects of Gelsemium elegans Extract on Growth Performance, Intestinal Morphology and Cecal Flora of Growing Pigs. Chin. J. Anim. Nutr. 2018, 30, 3626–3633. [Google Scholar]
  7. Cao, J.J.; Yang, K.; Huang, C.Y.; Li, Y.J.; Yu, H.; Wu, Y.; Sun, Z.L.; Liu, Z.Y. Pharmacokinetic Study of Multiple Components of Gelsemium elegans in Goats by Ultra-Performance Liquid Chromatography Coupled to Tandem Mass Spectrometry. J. Anal. Toxicol. 2020, 44, 378–390. [Google Scholar] [CrossRef]
  8. Xin, H.; YiFei, G.; Ke, Y.; YiYu, C. Gas Chromatography-Mass Spectrometry Based on Metabonomics Study of Carbon Tetrachloride-Induced Acute Liver Injury in Mice. Chin. J. Anal. Chem. 2007, 35, 1736–1740. [Google Scholar] [CrossRef]
  9. Sun, R.; Chen, M.; Hu, Y.; Lan, Y.; Gan, L.; You, G.; Yue, M.; Wang, H.; Xia, B.; Zhao, J.; et al. CYP3A4/5 mediates the metabolic detoxification of humantenmine, a highly toxic alkaloid from Gelsemium elegans Benth. J. Appl. Toxicol. JAT 2019, 39, 1283–1292. [Google Scholar] [CrossRef]
  10. Yue, R.; Jin, G.; Wei, S.; Huang, H.; Su, L.; Zhang, C.; Xu, Y.; Yang, J.; Liu, M.; Chu, Z.; et al. Immunoregulatory Effect of Koumine on Nonalcoholic Fatty Liver Disease Rats. J. Immunol. Res. 2019, 2019, 8325102. [Google Scholar] [CrossRef] [Green Version]
  11. Gessner, D.K.; Schwarz, A.; Meyer, S.; Wen, G.; Most, E.; Zorn, H.; Ringseis, R.; Eder, K. Insect Meal as Alternative Protein Source Exerts Pronounced Lipid-Lowering Effects in Hyperlipidemic Obese Zucker Rats. J. Nutr. 2019, 149, 566–577. [Google Scholar] [CrossRef]
  12. Huang, C.-Y.; Yang, K.; Cao, J.-J.; Li, Y.-J.; Wang, Z.-Y.; Yu, H.; Sun, Z.-L.; Zhang, X.; Liu, Z.-Y. Gene expression profile analysis of ileum transcriptomes in pigs fed Gelsemium elegans plants. Sci. Rep. 2019, 9, 1–8. [Google Scholar]
  13. Cabañas-García, E.; Areche, C.; Jáuregui-Rincón, J.; Cruz-Sosa, F.; Pérez-Molphe Balch, E. Phytochemical Profiling of (Cactaceae) Growing in Greenhouse Conditions Using Ultra-High-Performance Liquid Chromatography⁻Tandem Mass Spectrometry. Molecules 2019, 24, 705. [Google Scholar] [CrossRef] [PubMed] [Green Version]
  14. Bennett, B.J.; Vallim, T.Q.d.A.; Wang, Z.; Shih, D.M.; Meng, Y.; Gregory, J.; Allayee, H.; Lee, R.; Graham, M.; Crooke, R. Trimethylamine-N-Oxide, a Metabolite Associated with Atherosclerosis, Exhibits Complex Genetic and Dietary Regulation. Cell Metab. 2013, 17, 49–60. [Google Scholar] [CrossRef] [PubMed] [Green Version]
  15. Wu, J. Experimental study on promoting pig growth by Gelsemium elegans Benth. Chin. Fujian Agric. For. Univ. 2015, 828, 5. [Google Scholar]
  16. Wang, J.; Sun, Z.L. Effect and mechanism of adding Gelsemium elegans dry powder to feed on growth performance of piglets. Chin. J. Tradit. Vet. Sci. 2019, 002, 3–4. [Google Scholar]
  17. Wu, G. Glycine Stimulates Protein Synthesis and Inhibits Oxidative Stress in Pig Small Intestinal Epithelial Cells. J. Nutr. 2014, 144, 1540–1548. [Google Scholar]
  18. Jin, G.-L.; Su, Y.-P.; Liu, M.; Xu, Y.; Yang, J.; Liao, K.-J.; Yu, C.-X. Medicinal plants of the genus Gelsemium (Gelsemiaceae, Gentianales)--a review of their phytochemistry, pharmacology, toxicology and traditional use. J. Ethnopharmacol. 2014, 152, 33–52. [Google Scholar] [CrossRef]
  19. Yang, K.; Long, X.-M.; Cao, J.-J.; Li, Y.-J.; Wu, Y.; Bai, X.; Sun, Z.-L.; Liu, Z.-Y. An analytical strategy to explore the multicomponent pharmacokinetics of herbal medicine independently of standards: Application in Gelsemium elegans extracts. J. Pharm. Biomed. Anal. 2019, 176, 112833. [Google Scholar] [CrossRef] [PubMed]
  20. Ye, Q.; Feng, Y.; Wang, Z.; Zhou, A.; Xie, S.; Zhang, Y.; Xiang, Q.; Song, E.; Zou, J. Effects of dietary Gelsemium elegans alkaloids on growth performance, immune responses and disease resistance of Megalobrama amblycephala. Fish Shellfish. Immunol. 2019, 91, 29–39. [Google Scholar] [CrossRef]
  21. Legendre, P.; Förstera, B.; Jüttner, R.; Meier, J.C. Glycine Receptors Caught between Genome and Proteome-Functional Implications of RNA Editing and Splicing. Front. Mol. Neurosci. 2009, 2, 23. [Google Scholar] [CrossRef] [PubMed] [Green Version]
  22. Grotz, M.R.; Pape, H.C.; van Griensven, M.; Stalp, M.; Rohde, F.; Bock, D.; Krettek, C. Glycine reduces the inflammatory response and organ damage in a two-hit sepsis model in rats. Shock 2001, 16, 116–121. [Google Scholar] [CrossRef] [PubMed]
  23. Uraz, S.; Tahan, G.; Aytekin, H.; Tahan, V. N-acetylcysteine expresses powerful anti-inflammatory and antioxidant activities resulting in complete improvement of acetic acid-induced colitis in rats. Scand. J. Clin. Lab. Investig. 2013, 73, 61–66. [Google Scholar] [CrossRef] [PubMed]
  24. Harrison, P.; Wendon, J.; Williams, R. Evidence of increased guanylate cyclase activation by acetylcysteine in fulminant hepatic failure. Hepatology 1996, 23, 1067–1072. [Google Scholar] [CrossRef] [PubMed]
  25. Wang, Q.; Hou, Y.; Yi, D.; Wang, L.; Ding, B.; Chen, X.; Long, M.; Liu, Y.; Wu, G. Protective effects of N-acetylcysteine on acetic acid-induced colitis in a porcine model. BMC Gastroenterol. 2013, 13, 1–11. [Google Scholar] [CrossRef] [PubMed] [Green Version]
  26. Zhou, N.; Sun, Y.-P.; Zheng, X.-K.; Wang, Q.-H.; Yang, Y.-Y.; Bai, Z.-Y.; Kuang, H.-X.; Feng, W.-S. A Metabolomics-Based Strategy for the Mechanism Exploration of Traditional Chinese Medicine: Seeds Extract and Fractions as a Case Study. Evid.-Based Complement. Altern. Med. 2017, 2017, 2845173. [Google Scholar] [CrossRef] [Green Version]
  27. Vuolteenaho, K.; Koskinen, A.; Kukkonen, M.; Nieminen, R.; Päivärinta, U.; Moilanen, T.; Moilanen, E. Leptin enhances synthesis of proinflammatory mediators in human osteoarthritic cartilage--mediator role of NO in leptin-induced PGE2, IL-6, and IL-8 production. Mediat. Inflamm. 2009, 2009, 345838. [Google Scholar] [CrossRef] [Green Version]
  28. Xia, C.; Braunstein, Z.; Toomey, A.C.; Zhong, J.; Rao, X. S100 Proteins As an Important Regulator of Macrophage Inflammation. Front. Immunol. 2017, 8, 1908. [Google Scholar] [CrossRef] [PubMed] [Green Version]
  29. Hu, L.; Hu, X.; Long, K.; Gao, C.; Dong, H.-L.; Zhong, Q.; Gao, X.-M.; Gong, F.-Y. Extraordinarily potent proinflammatory properties of lactoferrin-containing immunocomplexes against human monocytes and macrophages. Sci. Rep. 2017, 7, 4230. [Google Scholar] [CrossRef]
  30. He, F.; Wu, C.; Li, P.; Li, N.; Zhang, D.; Zhu, Q.; Ren, W.; Peng, Y. Functions and Signaling Pathways of Amino Acids in Intestinal Inflammation. Biomed. Res. Int. 2018, 2018, 9171905. [Google Scholar] [CrossRef]
  31. Wang, L.; Zhou, J.; Hou, Y.; Yi, D.; Ding, B.; Xie, J.; Zhang, Y.; Chen, H.; Wu, T.; Zhao, D.; et al. N-Acetylcysteine supplementation alleviates intestinal injury in piglets infected by porcine epidemic diarrhea virus. Amino. Acids 2017, 49, 1931–1943. [Google Scholar] [CrossRef]
  32. Yi, D.; Hou, Y.; Xiao, H.; Wang, L.; Zhang, Y.; Chen, H.; Wu, T.; Ding, B.; Hu, C.-A.A.; Wu, G. N-Acetylcysteine improves intestinal function in lipopolysaccharides-challenged piglets through multiple signaling pathways. Amino. Acids 2017, 49, 1915–1929. [Google Scholar] [CrossRef] [PubMed]
  33. Docena, G.; Rovedatti, L.; Kruidenier, L.; Fanning, A.; Leakey, N.A.B.; Knowles, C.H.; Lee, K.; Shanahan, F.; Nally, K.; McLean, P.G.; et al. Down-regulation of p38 mitogen-activated protein kinase activation and proinflammatory cytokine production by mitogen-activated protein kinase inhibitors in inflammatory bowel disease. Clin. Exp. Immunol. 2010, 162, 108–115. [Google Scholar] [CrossRef] [PubMed]
  34. Coskun, M.; Olsen, J.; Seidelin, J.B.; Nielsen, O.H. MAP kinases in inflammatory bowel disease. Clin. Chim Acta 2011, 412, 513–520. [Google Scholar] [CrossRef] [PubMed]
  35. Raza, A.; Crothers, J.W.; McGill, M.M.; Mawe, G.M.; Teuscher, C.; Krementsov, D.N. Anti-inflammatory roles of p38α MAPK in macrophages are context dependent and require IL-10. J. Leukoc. Biol. 2017, 102, 1219–1227. [Google Scholar] [CrossRef] [PubMed] [Green Version]
  36. You, B.H.; Chae, H.-S.; Song, J.; Ko, H.W.; Chin, Y.-W.; Choi, Y.H. α-Mangostin ameliorates dextran sulfate sodium-induced colitis through inhibition of NF-κB and MAPK pathways. Int. Immunopharmacol. 2017, 49, 212–221. [Google Scholar] [CrossRef]
  37. Karnovsky, A.; Weymouth, T.; Hull, T.; Tarcea, V.G.; Scardoni, G.; Laudanna, C.; Sartor, M.A.; Stringer, K.A.; Jagadish, H.V.; Burant, C. Metscape 2 bioinformatics tool for the analysis and visualization of metabolomics and gene expression data. Bioinformatics 2012, 28, 373–380. [Google Scholar] [CrossRef] [PubMed] [Green Version]
  38. Maclouf, J.; Fltzpatrlck, F.; Murphy, R. Transcellular biosynthesis of eicosanoids. Pharmacol. Res. Off. J. Ital. Pharmacol. Soc. 1989, 21, 1–7. [Google Scholar] [CrossRef] [Green Version]
  39. Ilan, Y. Compounds of the sphingomyelin-ceramide-glycosphingolipid pathways as secondary messenger molecules: New targets for novel therapies for fatty liver disease and insulin resistance. Am. J. Physiol.-Gastrointest. Liver Physiol. 2016, 310, G1102–G1117. [Google Scholar] [CrossRef] [Green Version]
  40. Padberg, I.; Peter, E.; González-Maldonado, S.; Witt, H.; Mueller, M.; Weis, T.; Bethan, B.; Liebenberg, V.; Wiemer, J.; Katus, H.A.; et al. A new metabolomic signature in type-2 diabetes mellitus and its pathophysiology. PLoS ONE 2014, 9, e85082. [Google Scholar] [CrossRef] [PubMed]
  41. Guasch-Ferré, M.; Hruby, A.; Toledo, E.; Clish, C.B.; Martínez-González, M.A.; Salas-Salvadó, J.; Hu, F.B. Metabolomics in Prediabetes and Diabetes: A Systematic Review and Meta-analysis. Diabetes Care 2016, 39, 833–846. [Google Scholar] [CrossRef] [PubMed] [Green Version]
  42. Dunning, K.R.; Anastasi, M.R.; Zhang, V.J.; Russell, D.L.; Robker, R.L. Regulation of fatty acid oxidation in mouse cumulus-oocyte complexes during maturation and modulation by PPAR agonists. PLoS ONE 2014, 9, e87327. [Google Scholar] [CrossRef] [PubMed] [Green Version]
  43. Kaushal, C. The peroxisome proliferator-activated receptor: A family of nuclear receptors role in various diseases. J. Adv. Pharm. Technol. Res. 1999, 2, 236. [Google Scholar]
  44. Sander, K. Integrated physiology and systems biology of PPARα. Mol. Metab. 2014, 3, 354–371. [Google Scholar]
  45. McGarry, J.D.; Brown, N.F. The mitochondrial carnitine palmitoyltransferase system. From concept to molecular analysis. Eur. J. Biochem. 1997, 244, 1–14. [Google Scholar] [CrossRef]
  46. Thupari, J.N.; Landree, L.E.; Ronnett, G.V.; Kuhajda, F.P. C75 increases peripheral energy utilization and fatty acid oxidation in diet-induced obesity. Proc. Natl. Acad. Sci. USA 2002, 99, 9498–9502. [Google Scholar] [CrossRef] [PubMed] [Green Version]
  47. Zong, J.-Y.; Sun, R.-X.; Yu, M. Regulation of gluconeogenesis by adipose tissue. Chin. Chem. life 2017, 37, 842–848. [Google Scholar]
Figure 1. Differences in the expression levels of genes and metabolism-related alterations at the transcriptional level in piglet liver after G. elegans feeding. (A) PCA score plot of the genes identified from the control and G. elegans-treated group comparison. (B) Volcano plot of differentially expressed genes. Log2 fold changes in gene expression based on RNA-seq in the control and G. elegans-treated groups, and the corresponding significance values are displayed as log10 (p value). The transverse and vertical dotted lines indicate the cutoff value for differential expression (p < 0.05 and |log2 fold changes| > 1). In total, 95 and 104 genes with increased (red) or decreased (blue) expression levels induced by G. elegans exposure were identified. (C) Hierarchical clustering based on the DEGs related to metabolism.
Animals 11 01192 g001
Figure 2. GO classification and pathway enrichment results of differentially expressed genes (DEGs) between liver tissues of the G. elegans-treated group and the control group. (A) GO classification of the DEGs. (B) Pathway enrichment results of the DEGs. The X axis represents the enrichment factor value, and the Y axis represents the pathway name. The color represents the corrected p value (p adjust < 0.05), and the size of the dots represents the number of genes. GeneRatio represents the proportion of enriched genes to background genes.
Animals 11 01192 g002
Figure 3. The PLS-DA for scatterplot and sorting verification plot in positive and negative mode. The scatterplot (A,B) was obtained. The abscissa is the score of the sample on the first principal component. The ordinate is the score of the sample on the second principal component. R2Y represents the interpretation rate of the second principal component of the model, and Q2Y represents the prediction rate of the model. In the sorting test (C,D), the abscissa represents the correlation between the random group Y and the original group Y, and the ordinate represents the score of R2 and Q2.
Animals 11 01192 g003
Figure 4. Network of genes and metabolites regulated by G. elegans. Network visualization of the amino acid metabolism (A) and lipid metabolism pathways (B) was performed using Cytoscape software (version 3.5.1) and MetScape software (version 3.1.3). The node colors in this figure correspond to absolute maximum log2 fold changes; significant increases and decreases in differential metabolites and differentially expressed genes are highlighted in red and blue, respectively.
Animals 11 01192 g004
Table 1. Effect of G. elegans powder on the growth performance of piglets.
ItemsTreatmentSEM 1p-Value 2
ControlG. elegans-TreatedL
Num1030--
Average feed intake, kg13.589.020.165<0.001
Average gain, kg5.324.060.038<0.001
Feed conversion ratio2.552.221.176<0.001
1 SEM = Standard error of mean. 2 L = Linear effect of G. elegans.
Table 2. Serum chemical parameters of the control group and the G. elegans-treated group.
ItemsTreatmentp-Value
ControlG. elegans-Treated
WBC, 109/L18.1325.220.040
LYMPH, 109/L8.5112.130.023
EOS, 109/L1.141.760.058
LYMPH, %47.0148.630.304
EOS, %8.077.070.667
RBC, 1012/L7.9199.1880.852
HGB, g/L122.331400.504
MCV, fL81.7578.580.027
MCH, pg16.318.70.611
MCHC, g/L202236.50.287
RDW_CV, %16.0916.620.413
RDW_SD, fL52.652.10.077
HCT, %64.8271.770.163
PLT, 109/L256.29840.785
MPV, fL10.5611.230.096
PDW14.2415.080.106
PCT, %0.2731.1110.186
WBC (white blood cell count), LYMPH (lymphocyte count), EOS (eosinophil count), RBC (red blood cell count), HGB (hemoglobin concentration), MCV (mean corpuscular volume), MCH (mean corpuscular hemoglobin), MCHC (mean corpuscular hemoglobin concentration), RDW (red cell distribution width), HCT (hematocrits), PLT (platelet count), MPV (mean platelet volume), PDW (platelet distribution width), PCT (plateletcrit).
Table 3. Results of quantitative qRT-PCR validation.
Gene SymbolTissueRNA-SeqqRT-PCR
p-ValueFold Changep-ValueFold Change
Atp2b3Liver<0.0013.570.0142.39
Mat2aLiver<0.0012.180.0081.70
ChdhLiver0.0262.350.0241.48
Slc20a2Ileum0.0062.050.0101.89
Slc28a1Ileum0.0082.020.0282.02
Mt3Ileum<0.0013.490.0083.75
Table 4. The positive ion pattern of differentially expressed metabolites with VIP > 1 and p < 0.05 in the plasma of piglets exposed to G. elegans based on ANOVA.
MetabolitesVIPlog2(Fold Change)p-Value
Methylsulfonylmethane2.242.44<0.001
3-(4-Hydroxy-5-oxo-3-phenyl-2,5-dihydro-2-furanyl) propanoic acid1.461.58<0.001
Visnagin1.531.66<0.001
Beta-Naphthoxyacetic Acid1.571.70<0.001
Menadiol1.411.52<0.001
N-Feruloylserotonin2.292.52<0.001
Dibenzo-1,4-dioxin1.451.550.001
(-)-Akuammicine1.982.200.001
1-Naphthol1.381.510.002
4-Methylene-2-oxoglutarate1.451.580.002
5-Formyl-2-furoic acid1.451.600.003
N-Acetyl-L-phenylalanine1.661.750.003
Menadione1.181.320.005
Phenylacetylglycine1.181.250.006
Indole-3-carbidol1.471.530.010
Furathiazole1.321.390.016
1-Stearoyl-2-arachidonoyl-sn-glycero-3-phosphoserine1.441.720.023
Spirodiclofen2.352.350.028
Pelargonidin1.19−1.200.030
2,5-Dimethyl-4-ethoxy-3(2H)-furanone1.111.350.041
7-alpha-Hydroxy-3-oxochol-4-en-24-oic acid1.311.470.047
Table 5. The results of differentially expressed metabolites in negative ion mode with VIP > 1 and p < 0.05 in plasma of piglets exposed to G. elegans based on ANOVA.
MetabolitesVIPlog2(Fold Change)p-Value
Maslinic acid2.542.190.001
10-Acetyl-9-hydroxy-7,7-dimethyl-2,6,6a,7,11a,11b-hexahydro-11H-pyrrolo[1′,2′:2,3]isoindolo[4,5,6-cd]indol-11-one2.231.990.003
Adipic acid2.171.940.004
4-[(2-Isopropyl-5-methylcyclohexyl)oxy]-4-oxobutanoic acid1.14−0.900.008
Glycine1.231.020.009
Imazamethabenz1.391.130.009
p-Tolyl beta-d-glucuronide1.501.230.011
Phenylacetylglycine1.451.180.011
(+)-CP 55,9401.711.420.011
d-(-)-Quinic acid2.081.890.013
(-)-CP 55,9402.001.650.013
Cascarillin1.07−0.810.020
Picrasin C1.14−0.840.026
10-[4-(2,4,4-Trimethyl-2-pentanyl) phenoxy]-1-decanol2.08−1.480.038
N-Acetyl-L-cysteine1.060.950.041
4-Methylphenol1.471.160.043
Actinoquinol1.11−0.810.046
Glycol stearate2.35−1.790.49
Publisher’s Note: MDPI stays neutral with regard to jurisdictional claims in published maps and institutional affiliations.

