Article

Effects of L-Glutamine Supplementation during the Gestation of Gilts and Sows on the Offspring Development in a Traditional Swine Breed

by
Marta Vázquez-Gómez
1,2,
Consolación García-Contreras
3,
Susana Astiz
3,
Laura Torres-Rovira
3,
José Luis Pesantez-Pacheco
3,4,
Ana Heras-Molina
3,
Teresa Castro Madrigal
1,
Clemente López-Bote
1,
Cristina Óvilo
3,
Antonio González-Bulnes
3,5 and
Beatriz Isabel
1,*
1
Faculty of Veterinary Medicine, UCM, Av. Puerta de Hierro s/n, 28040 Madrid, Spain
2
Facultat de Veterinària, Universitat Autònoma de Barcelona, Edifici V, Trav. dels Turons, 08193 Bellaterra, Spain
3
SGIT-INIA, Ctra. De La Coruña Km. 7.5, 28040 Madrid, Spain
4
School of Veterinary Medicine and Zootechnics, Faculty of Agricultural Sciences, University of Cuenca, Avda. Doce de Octubre, 010220 Cuenca, Ecuador
5
Faculty of Veterinary Sciences, Universidad Cardenal Herrera-CEU, CEU Universities, C/Tirant lo Blanc, 7, Alfara del Patriarca, 46115 Valencia, Spain
*
Author to whom correspondence should be addressed.
Animals 2021, 11(3), 903; https://doi.org/10.3390/ani11030903
Submission received: 1 February 2021 / Revised: 9 March 2021 / Accepted: 17 March 2021 / Published: 22 March 2021
(This article belongs to the Section Pigs)

Abstract

:

Simple Summary

Nutritional strategies during pregnancy in swine production are considered essential to increase the number of piglets born alive and improve their survival and development. Amino acids, such as glutamine, are among the best compound to introduce in commercial farms after obtaining positive results in trials carried out in selected swine breeds. However, several critical productive factors have to be assessed before translating these strategies to the farm level to ensure the best balance between benefits and investments. The current study focused on the effects of prenatal L-glutamine supplementation on the offspring of Iberian gilts and sows under farm conditions. It is the first trial of amino acid supplementation during pregnancy carried out in traditional swine breeds. These non-selected swine breeds show productive or physiological differences that could affect the supplementation effect. Indeed, although there were changes at the molecular and tissue level, these effects did not turn into advantageous effects for the offspring of traditional breeds. The present study shows the importance of pre-testing nutritional strategies under the final conditions and breeds of implementation and the need to deepen at the molecular level to improve the biological interpretation of findings.

Abstract

The use of amino acids during pregnancy, such as glutamine (Gln), seems to be a promising strategy in selected swine breeds to improve the offspring prenatal development. The main goal of the current study was to assess the development of the offspring from parity 1–3 sows of a traditional breed, which were supplemented with 1% glutamine after Day 35 of gestation, under farm conditions. A total of 486 (288 treated) piglets from 78 (46 treated) Iberian sows were used. At birth and slaughterhouse, fatty acid composition, metabolism, and mTOR pathway gene expression were analyzed. At birth, treated newborns showed greater amounts of specific amino acids in plasma, such as glutamine, asparagine, or alanine, and Σn-3 fatty acids in cellular membranes than control newborns. The expression of genes belonging to mTOR Complex 1 was also higher in treated piglets with normal birth-weight. However, these findings did not improve productive traits at birth or following periods in litters from supplemented gilts (parity 1) or sows (parities 2–3). Thus, further research is needed to properly understand the effects of prenatal glutamine supplementation, particularly in traditional swine breeds.

1. Introduction

Swine production is facing new challenges to improve its efficiency. One of the current objectives is to improve prolificacy without penalizing the offspring survival and development. The possible damaging effect of the intrauterine growth restriction process (IUGR) on the offspring, mainly linked to large litters, is well-known, as well as the negative consequences on their postnatal development [1,2,3,4,5]. Many studies on selected swine breeds have shown the IUGR impact on pig production by inducing lower homogeneity and low birth-weight (BIW) pigs [6,7,8]. These effects have also been described in traditional swine breeds, even with a greater impact than in modern breeds [9,10]. Although traditional breeds show lower reproductive parameters [11,12,13,14], the increase in litter size results in lower BIW and higher variability than in selected swine breeds [10]. Even the delay of days to market is longer in traditional breeds [10]. This consequence affects farm profitability and makes clear the wide range of improvement to work on useful strategies, particularly in traditional and fatty breeds, which is a growing industry due to its high-quality cured pork products.
At the sow level, the nutritional strategies are essential to diminish negative consequences in piglets throughout their productive lifetime. Among the prenatal nutritional strategies, amino acids (AA) clearly stand out. Particularly some functional AA, such as arginine [Arg], glutamine [Gln, AA abbreviation], and proline [Pro], have been the target of the largest number of studies on pregnancy in selected swine breeds [15,16,17,18,19,20]. They have shown benefits such as increased fetal-placental unit growth and reduced variation in BIW, with Arg being the most commonly AA used in previous studies [15,19,21,22,23,24,25,26,27]. Glutamine is particularly interested because it is one of the most abundant AA in fetal tissue protein and is a primary energy source for the fetal small intestine [18,19]. However, there remain significant factors to be assessed before translating this knowledge into farm strategy to guarantee the best equilibrium between advantages and investments. These factors include the parity number (Pa), the supplementation period, and the current farm conditions, particularly for Gln. Moreover, previous studies were only developed in selected swine breeds. There are no studies on the effect of the prenatal supplement of AA on traditional breeds, although their metabolic differences could produce differences in the response [28,29,30,31,32,33,34].
Hence, the present study aimed at determining the effects of prenatal Gln supplementation on the prenatal and postnatal developments of the offspring and their carcass and meat quality under farm conditions in a traditional swine breed. The second objective was to examine the interaction of prenatal Gln supplementation and the parity of sow.

2. Materials and Methods

2.1. Animals and Design

The experiment was carried out in a commercial farm, Ibéricos de Arauzo 2004 S.L. (Zorita de la Frontera, Salamanca, Spain), according to the European Union Directive and the Spanish Policy for Animal Protection RD53/2013. As a traditional breed, the Iberian pig was used in this trial. The management of sows and their offspring followed standard commercial farm practices, housing them indoors under controlled temperature, and electronic chip identification was used. Moreover, sows and offspring were fed with standard grain-based diets for Iberian pigs (diets shown in Table S1; [35]).
A total of 78 Iberian sows (Retinto variety), from parity (Pa) 1 to 3, were inseminated with cooled semen from Duroc PIC boars (Genus plc, Worcester, UK). Day 36 of pregnancy, 46 pregnant sows (Pa1: 21 gilts, Pa2: 16 sows, Pa3: 9 sows; treated group), randomly chosen, were supplemented with 1% L-glutamine (GLN [treated group abbreviation]; S.A. Ajinomoto OmniChem N.V., Wetteren, Belgium) on the gestation diet up to delivery. The 32 sows of the control group (C; Pa1: 10 gilts, Pa2: 13 sows, Pa3: 9 sows) were fed with the same diet without supplementation. Average daily feed intakes obtained during pregnancy, after Day 35, were between 1 and 1.5 kg with no difference by treatments. Sows were housed in groups from Day 35 to Day 101 of pregnancy and, afterward, individually allocated in pens until weaning. After birth, piglets were sexed and weighed, and a total of 486 alive piglets (C: 198, 53% males; GLN: 288, 49% males) were measured and allocated to mothers until weaning. Males were surgically castrated within the two first days of birth.
Piglets were classified into two birth-weight (BIW) categories, Low and Normal BIW (LBIW and NBIW), for experimental purposes. The classification cut-off value relied on previous studies on the same farm (BIW ≤ 0.99 kg; [9,10]). At weaning (average age, 24 days), 136 control (C; 51% males) and 151 treated (GLN; 50% males) piglets randomly selected were weighed and measured. Later, piglets were housed, distributed by treatment and sex in groups of 12 piglets/pen maximum. Pigs were monitored until slaughter. At 215 days-old, 96 control (37% male) and 103 treated pigs (47% males) were sampled. Finally, 54 control (61% males) and 79 treated pigs (62% males) were sampled at the slaughterhouse.

2.2. Birth Data and Offspring Development

Birth data were recorded per sow. The BIW mean and its SD and coefficient of variation (CoV) were calculated per sow using the total piglets born (without stillbirths) and statistically analyzed by parity and treatment. The remaining birth data were assessed based on piglets born alive.
Pigs were individually weighed at birth, weaning, and slaughterhouse. Pigs were shipped to the slaughterhouse in three batches. The first and second batches were slaughtered when pigs reached the minimum market carcass weight established for the Iberian breed (115 kg; Day 244 to 267 of average age). The remaining pigs were sent to market regardless of their body weight on Day 270 of average age. Average daily weight gain (ADWG) was individually calculated for the lactation phase, for the following period (growing and fattening) until the slaughterhouse and for the whole productive life.
At birth and weaning, morphological measurements (occipito-nasal length, biparietal diameter, trunk length, maximum thoracic diameter, and abdominal and thoracic circumferences) were recorded with a measuring tape. At weaning and 215 days-old, backfat thickness, distinguishing the inner and outer layers, and longissimus dorsi (LD, loin) muscle diameter were determined with ultrasound (SonoSite Inc., Bothell, WA, USA) at the P2 point (level of the head of the last rib). At the slaughterhouse, the length of carcasses (from the posterior edge of the symphysis pubica to the anterior edge of the first rib) and the backfat thickness (at the last rib) were measured with a tape. Carcass yield was calculated individually (carcass weight/body weight).

2.3. Tissue Sampling at Slaughter

At birth, 24 control and 24 treated piglets (6 LBIW and 6 NBIW piglets per sex) were euthanized and sampled. To avoid reducing the sample size at weaning, only eight control newborns (4 LBIW and 4 NBIW) were selected from control sows to slaughter at birth. The remaining euthanized control newborns came from sows with similar characteristics to our control group. Selected neonates were euthanized by stunning and exsanguination according to RD53/2013 standard procedures. Immediately head, carcass, and total and individual viscerae (brain, heart, intestine, kidneys, liver, lungs, pancreas, and spleen) were weighed. Later, weight-ratios of carcass and individual viscerae to BIW were calculated. Duodenal samples for gene expression analysis were immediately submerged in RNAlater (Invitrogen, Carlsbad, CA, USA) and stored at −20 °C. Samples of brain, the right lateral lobe of the liver, and LD muscle were also biobanked at −20 °C until fatty acids (FA) composition analysis.
At the slaughterhouse, samples of the right lateral lobe of the liver, LD muscle, and subcutaneous backfat fat at the measurement level (P2 point) were biobanked until FA composition analysis. On the same sampling day, a second sample of LD muscle was also used for the pH and drip-loss analyses [36]. Duodenal samples were also collected and stored at −80 °C.

2.4. Amino Acids, Glucose and Lipid Metabolism and Oxidative Status

Blood samples were drawn with vacuum tubes (Vacutainer Systems Europe, Meylan, France) from euthanized neonates at birth and after fasting at the slaughterhouse. Samples were centrifuged at 1500× g for 15 min, and plasma was separated and stored at −80 °C until analyses of AA and glucose (fructosamine) and lipid metabolism. The AA analysis of plasma samples was carried out by the Instrumental Techniques laboratory of the Universidad de Valladolid (UVA, Valladolid, Spain). It was performed using the ZORBAX Eclipse Plus method with an Agilent 1100 HPLC system [37]. Parameters of glucose and lipid (total cholesterol, high-density lipoprotein cholesterol [HDL-c], low-density lipoprotein cholesterol [LDL-c], and triglycerides) profiles were assessed by a clinical analyzer (Saturno 300 plus, Crony Instruments Srl, Rome, Italy), according to the manufacturer’s instructions. Values for total antioxidant capacity were determined by FRAP (ferric reducing antioxidant power assay; [38]), while lipids oxidative damage was assessed by MDA (malondialdehyde; [39]).

2.5. Gene Expression by Quantitative PCR

The following steps described, from the RNA extraction to the raw expression data, were carried out by the Unit of Genomics service of the Universidad Complutense de Madrid (UCM, Spain). First, available duodenum tissue samples (~10 to 20 mg) obtained from the birth sampling (48 samples) and slaughterhouse (52 samples; C: 12 males and 9 females, GLN: 15 males and 16 females) were used for total RNA extraction using RNeasy PowerLyzer Tissue and Cells isolation kit (Qiagen, Hilden, Germany) and the TyssueLyser LT equipment (Qiagen), following the manufacturer’s recommendations. The obtained RNA was quantified using NanoDrop ONE (NanoDrop Technologies, Wilmington, DE, USA), and the RNA quality was assessed with an Agilent bioanalyzer device (Agilent Technologies, Palo Alto, CA, USA). Moreover, 2.2 µg of obtained RNA were treated with RNAse-Free DNAse Set (Qiagen), following the manufacturer’s instructions. Second, the synthesis of cDNA was carried out with High Capacity RNA-to-cDNA kit (Applied Biosystems, Foster City, CA, USA) using 9 µl of RNA treated with con DNAse I (~1 µg of total RNA) in a total volume of 20 µL containing, following the supplier’s instructions. Nine target genes related to mechanistic target of rapamycin (mTOR) pathway (linked to Gln; EIF4EBP1, HIFIA, MTOR, PPARG, RPS6, RPS6KB1, RPTOR, and SREBF1 [40,41]) and intestinal tight junctions (OCLN; Occludin) and two reference genes (ACTB and GAPDH) were analyzed. Primer pairs were designed using Universal ProbeLibrary Assay Design Center (Roche Life Science, Basel, Switzerland) from the available ENSEMBL sequences and covered different exons to assure the cDNA amplification (Table S2). Third, the transcript quantification was performed using Power SYBRGreen PCR Master Mix (Applied Biosystems, Warrington, UK) in a QuantStudio 12 K Flex (Applied Biosystems). The qPCR reactions were prepared in a total volume of 10 µL containing 2.5 µL of cDNA (1/10 dilution) and forward and reverse primers (concentration of 300 nM), following the manufacturer’s recommendations. All points and samples were duplicated as technical replicates, and mixes without cDNA were used as negative controls. Cycling conditions were 95 °C for 10 min, followed by 40 cycles of 95 °C (15 s) and 60 °C (1 min). Data were extracted with the QuantStudio 12 K Flex software v1.2.2 (Applied Biosystems).
For statistical analysis of gene expression, the influence of maternal treatment and BIW classification were analyzed with a linear model fitting factors and their interactions as fixed effects with sow (at birth) as a random effect. The method employed for the statistical analysis of the gene expression data [42] simultaneously analyzed the Cp values for the target and endogenous genes using a linear mixed model. The model used and posterior calculations were performed as previously described by our group [43]. Treatment and sexes were assessed at both ages, but BIW was only assessed at birth. The adjusted p-values are indicated as q-values.

2.6. Fat Content and Fatty Acid Composition of Diets and Tissue Samples

The one-step procedure [44] was used for the extraction and methylation of the diet fatty acids (FA). Gas chromatography (Hewlett Packard HP-6890, Palo Alto, CA, USA) was used to identify fatty acid methyl esters by a flame ionization detector and a capillary column (HP-Innowax, 30 m × 0.32 mm i.d., and 0.25 µm polyethylene glycol-film thickness; [45]).
The lipids from the brain, intramuscular fat (IMF) at the LD muscle, and liver fat were extracted [46]. Fat content was expressed as a percentage (%) of dry matter (DM). Afterward, total lipids at IMF and liver fat were separated into the neutral lipid (NL; in fat storage such as triglycerides) and polar lipid fractions (PL; in cell membranes such as phospholipids; [47]). Subcutaneous fat was individually analyzed in outer and inner layers. Extracts were methylated [48] and analyzed using protocols developed at our laboratory [45]. The individual FA percentages for saturated, monounsaturated, and polyunsaturated FA (SFA, MUFA, and PUFA) were calculated. Total n-3, total n-6 FA, the Σn-6/Σn-3 ratio, and the unsaturated index (UI) were also calculated [49]. The activity of stearoyl-CoA desaturase enzyme 1 (SCD1) was estimated as C18:1/C18:0 and MUFA/SFA ratios (desaturation indexes; [50]).

2.7. Statistical Analysis

Data were analyzed by the SAS version 9.4 (Statistical Analysis System Institute Inc., Cary, NC, USA) to assess the maternal treatment effect (C vs. GLN) and its interactions with sex (female vs. male) and BIW (LBIW vs. NBIW). Dependent variables were assessed using two-way ANOVA in a general linear model, including maternal treatment and sex. Except at birth and weaning, when the BIW classification was also added to the model (three-way ANOVA) and all maternal treatment interactions. No significant triple and double interactions were removed from models, and significant interactions were studied individually. Changes over time in body weight, backfat depth, and meat color traits were assessed using a repeated measures test with the Greenhouse–Geisser correction. Reproductive data and birth data were analyzed by parity and maternal treatment, and chi-square was used to assess the percentage of LBIW piglets and percentages of parity. Sow was used as a random effect in the birth and weaning analysis to consider the common maternal environment. Litter size was categorized and used as a random effect for birth data [10]. For performance parameters, the respective age was used as a covariate. Finally, pig was the experimental unit for all variables studied except for the reproductive data, where sow was the unit. Results were expressed as mean ± SE. Statistical significance was accepted from p < 0.05 and statistical trend was defined as 0.05 < p < 0.1.

3. Results

3.1. Gilts and Sows

Differences in the number of total piglets born (C: 6.7 ± 0.5, GLN: 7.1 ± 0.3 piglets) and piglets born alive (C: 6.4 ± 0.5, GLN: 6.7 ± 0.3 piglets) were not statistically significant between maternal treatments, and neither was for the LBIW piglet proportion at birth (C: 11.7%, GLN: 14.2% of LBIW piglets). Birth weight mean per litter (C: 1.38 ± 0.04, GLN: 1.31 ± 0.03 kg) and its measures of BIW variation (SD, C: 0.19 ± 0.02, GLN: 0.20 ± 0.01 kg; CoV, C: 14.3 ± 1.5, GLN: 15.6 ± 1.1%) were also not different between treatments. Among the rest of the body measures (Table S3), the mean of trunk length was greater in the control litters than in the treated ones (C: 23.8 ± 0.3, GLN: 22.9 ± 0.2 cm; p < 0.05), and there was a trend towards a similar difference in the head length (C: 12.8 ± 0.09, GLN: 12.0 ± 0.07 cm; p = 0.06). No significant interactions between maternal treatment and sow parity were found, although there were differences by parity (Table S3).

3.2. Offspring at Birth

3.2.1. Body Measures and Composition

There were no differences in birth weight (C: 1.32 ± 0.02, GLN: 1.30 ± 0.02 kg) between control and treated alive piglets. Only head (C: 12.11 ± 0.05, GLN: 11.95 ± 0.04 cm; p < 0.005) and trunk lengths (C: 23.5 ± 0.2, GLN: 22.9.6 ± 0.1 cm; p < 0.05) showed differences by maternal treatment. Control LBIW piglets also had a longer head than treated LBIW ones (C LBIW: 11.4 ± 0.05, GLN LBIW: 11.04 ± 0.04 cm; p < 0.05). Regarding viscerae, lungs were heavier in control than in treated newborns (Table 1; p < 0.05). Treated newborns showed lighter carcass (p = 0.08) and greater relative weights of the liver (p = 0.06) and total viscerae (p = 0.05) to body weight than control ones. Triple interactions and interactions between sex and maternal treatment were not significant, while the BIW affected almost all variables (Tables S4 and S5).

3.2.2. Plasma Parameters

Regarding the AA plasma levels, Gln was higher in treated newborns than in control ones (Table 1; p < 0.05), without significant maternal treatment interactions with BIW or sex. Treated newborns also had greater concentrations of alanine (Ala, Table 1; p < 0.005), asparagine (Asn; p < 0.05), glycine (Gly; p < 0.01), histidine (His; p < 0.05), proline (Pro; p < 0.05), serine (Ser; p < 0.005), and valine (Val; p < 0.05) than controls. There was also a trend for higher concentrations of isoleucine (Ile; p = 0.07) and tryptophan (Trp; p = 0.06). In addition, treated LBIW newborns showed a greater amount of Ala (C: 40.3 ± 6.4, GLN: 77.4 ± 10.8 mg/L; p < 0.001) and arginine (Arg, C: 13.6 ± 3.0, GLN: 27.8 ± 5.5 mg/L; p < 0.005) than control LBIW ones. The remaining AAs were only affected by the BIW (Table S5) with no interactions with sex. No effect of maternal treatment was observed on glucose and lipid metabolism. The assessment of lipid oxidative damage showed a trend of greater values in control newborns than in treated ones (p = 0.08), but similar values of the antioxidant capacity. There were no significant triple interactions nor between sex and maternal treatment (Table S5).

3.2.3. Gene Expression

No differences in the expression of target genes were found between maternal treatment groups (Table 2). However, treated NBIW newborns had higher RPTOR (Figure 1; q < 0.05) and MTOR (q < 0.05) expression than control NBIW ones. For the MTOR gene, there were also different expression levels between BIW groups within the control group (FC: 1.69, q < 0.01), being higher in NBIW neonates, but not in the treated group. Further information about gene expression results is shown in Table S6.

3.2.4. Fatty Acid Composition of Brain, Liver, and Muscle Tissues

Maternal Treatment Effects

Maternal treatment directly affected the polar lipid fractions in the brain (Table S7), muscle (Table S8), and liver (Table S9). Concentrations of Σn-3 FA in brain and muscle were greater in treated than in control newborns (p < 0.05). In concordance, the Σn-6/Σn-3 FA ratio (p < 0.05) was also lower in treated newborns in muscle. On the contrary, the liver fat content was lower in treated than in control newborns (Table 3; p < 0.01). In the liver, treated newborns also showed a greater desaturation index (Table 3; p < 0.01) than controls, mainly influenced by C18:1-n9 FA (oleic acid, Table S9), and concentrations of MUFA and PUFA were also affected (Table 3; p = 0.07 for both).

Maternal Treatment Interactions

Regarding the LBIW group, control newborns showed greater Σn-6 FA values than treated ones in the polar lipid fraction of the brain (Table 4; p < 0.01) with a higher Σn-6/Σn-3 FA ratio (p < 0.05) and a lower C18:1 FA/C18:0 FA index (p < 0.05). Control LBIW newborns also had lower unsaturated indexes (p < 0.01) and greater SFA amounts (p < 0.05) than treated LBIW ones in the neutral lipid fractions of muscle and higher SFA amounts (p < 0.05) in the neutral lipid fractions of the brain.
Differences between control LBIW and NBIW newborns were found in the neutral and polar lipid fractions of the brain and the neutral fraction of the liver and muscle (Table 4), but not between treated LBIW and NBIW ones. Unsaturation indexes (MUFA/SFA or C18:1 FA/C18:0 FA) were higher in control NBIW newborns than in their LBIW counterparts in previously named lipid fractions (p < 0.01 for all, except in the neutral lipid fraction of the liver, p < 0.05). Saturated FA values were greater in the brain and muscle neutral lipid fraction of control LBIW neonates than of control NBIW ones (p < 0.005, for both), and MUFA values in the brain polar lipid fraction were lower (p < 0.005). Control NBIW newborns had greater Σn-6 FA concentrations (p < 0.0001) than their LBIW counterparts in the polar lipid fraction of the brain, and with higher values of the Σn-6/Σn-3 FA ratio (p < 0.005).

3.3. Postnatal Development

At weaning, there were no differences in ADWG values, body weight, or body measures considering maternal treatment or its interactions (Table S10), except for a longer biparietal diameter in control piglets (6.60 ± 0.05 vs. 6.48 ± 0.04 cm, p < 0.05). However, treated males (0.50 ± 0.02 cm, p < 0.0001) and control females (0.46 ± 0.02 cm, p < 0.0001) showed thicker backfat depth than treated females (0.41 ± 0.02 cm). There were also differences related to backfat depth between groups of maternal treatment affected by sex at 215 days-old, but not in its evolution during the postnatal development. Control males had thinner total backfat depth than treated males (2.11 ± 0.1 vs. 2.36 ± 0.07 cm, p < 0.05), mainly due to a smaller inner layer (1.05 ± 0.07 vs. 1.23 ± 0.05 cm, p < 0.05). Control males also showed thinner total backfat depth than control females (2.57 ± 0.11 cm, p < 0.005) and also in both layers (Inner, 1.32 ± 0.08 cm, p < 0.05; Outer, 1.06 ± 0.06 vs. 1.25 ± 0.05 cm, p < 0.01). At 215 days-old, there was no effect of maternal treatment on plasma parameters (glucose and lipid metabolism).
Throughout their total postnatal period, treated pigs (ADWG: 516 ± 4 g/day; p < 0.005) grew slower than controls (536 ± 5 g/day), particularly the females (C: 544 ± 8 GLN: 511 ± 7 g/day; p < 0.005). The evolution of body weight was also different between groups of maternal treatment (p < 0.005), especially after weaning (p < 0.005). At the slaughterhouse, treated pigs were lighter than controls (C: 144.1 ± 1.5 GLN: 138.6 ± 1.2 kg; p < 0.005). In the control group, males reached their market weight sooner (Market age 264 ± 1.3 days; p < 0.005) than females (270 ± 1.7 days).

3.3.1. Carcass Traits and Gene Expression at the Slaughterhouse

Control females showed longer carcasses than control males (92.0 ± 0.6 vs. 89.8 ± 0.5 cm, p < 0.05) and treated females (89.4 ± 0.5 cm, p < 0.005). However, no differences were found in carcass weight or yield nor in the total backfat depth, neither in muscle drip-loss, nor in the pH values between maternal treatment groups, nor by interaction with sex (Table S10). On the other hand, the expression of target genes did not differ by maternal treatment (Table 5).

3.3.2. Fatty Acid Composition of Muscle, Backfat, and Liver Tissues at the Slaughterhouse

Maternal Treatment Effects

The FA composition of muscle (Table S12), backfat (Table S13), and liver (Table S14) showed some differences by maternal treatment. Regarding the FA composition of LD muscle, control pigs showed greater values of SFA, PUFA (both Σn-6 and Σn-3 FA), and of both desaturation indexes than treated ones in the neutral lipid fraction (Table 6, p < 0.05 for all) and a trend to lower MUFA concentrations (p = 0.05).

Maternal Treatment Interactions

The remaining differences in FA composition were conditioned by sex (Table 7). In the polar lipid fraction of the LD muscle, control females showed the lowest value of MUFA (p < 0.05 for all) and the highest values of PUFA (and Σn-6 FA, p < 0.05 for all) than the rest of the groups. They also had lower SFA concentrations than treated females and control males (p < 0.05 for all). However, the lowest values of Σn-3 FA (p < 0.001 for all) and the greatest Σn-6/Σn-3 FA ratio (p < 0.001 for all) belonged to treated females. In the FA profile of backfat, only a desaturation index (C18:1/C18:0) of the inner layer was greater in control males than in the rest of the groups (vs. control females and treated males, p < 0.05; and vs. treated females, p = 0.06). Finally, treated females showed lower concentrations of SFA (Table 7, p < 0.05) and greater PUFA values (only Σn-6 FA; p < 0.05 for both) than control females in the liver polar lipid fraction. On the other hand, treated females also showed a lower SFA concentration in the liver neutral lipid fraction than treated males (p < 0.05).

4. Discussion

The industry of traditional swine breeds is currently increasing its census, production, and economic influence. Batch homogeneity is one of the main production challenges, so the search for useful solutions for its improvement from birth is critical. Thus, testing feed supplements showing positive results in other swine breeds, such as Gln, is required, particularly considering the metabolic differences between traditional and selected swine breeds [28,29,30,31,32,33,34]. Glutamine is one of the most interesting AA in fetuses and adults because it is one of the most used AA by pig enterocytes as an energy source and in all tissues for nucleic acid synthesis [18,19]. The current study is not only important because it is the first one focused on the effect of prenatal Gln supplementation on traditional breeds, but because it is also the first trial of a prenatal supplementation of any AA in this kind of swine breeds.
Among the valuable data of this study is the first assessment of plasma AA levels in newborns of the Iberian breed. Some AA levels (i.e., Gln, Ala, and Asn) were greater in treated newborns. Moreover, the BIW was also studied, and the treated LBIW group showed higher Arg than the corresponding control group. The transfer of Gln to fetal blood is critical for maximizing fetal growth by synthesizing other AA, such as Glu, Asp, and Asn [51]. In a previous study, the maternal concentrations of Gln in Meishan gilts (Pa1, nulliparous), a highly prolific breed with a remarkable homogeneity in the offspring, was higher than in Large White × Landrace gilts [52,53,54,55]. The Meishan newborns also had greater Gln, Ala, and Asp concentrations, similarly to Gln supplemented newborns in a previous study, which showed higher Gln values [27,55]. However, only the proportional weight of viscerae was higher in our treated newborns related to prenatal body growth. Glutamine is recognized as a nutritionally essential AA for gestating, especially after the early gestation period and in gilts, so more improvements in litters from gilts were expected [15,56]. On the contrary, the lack of effects on the development of litters from sows supplemented with Gln has been previously described in selected swine breeds [57,58]. However, the promising potential of the Gln maternal supplementation to reduce negative effects of the IUGR process, according to scientific literature [15,19,27,59,60], led to expect more effects than those found under our conditions. Nevertheless, future studies with larger sample size, particularly gilts, could increase the detection power of productive effects, based on the result of previous studies carried out in other swine breeds.
Regarding the FA profile of different tissues, there were significant effects of the maternal treatment at birth. First, the control group showed differences between LBIW and NBIW newborns, but not in the treated group. Thus, the FA composition at birth would be more homogeneous in newborns from pregnancies supplemented with Gln. Second, treated newborns showed greater amounts of Σn-3 FA in brain and muscle cellular membranes, related to a protective effect because of the improvement of pro-/anti-inflammatory status and the reduction of pathological risks [61,62]. Finally, the treated group had a higher amount of C18:1 FA in the liver, which was previously found in Meishan newborns [54]. This result could be associated with a possible adaptation to increase the survival capacity [54], although it was not possible to corroborate it with our results.
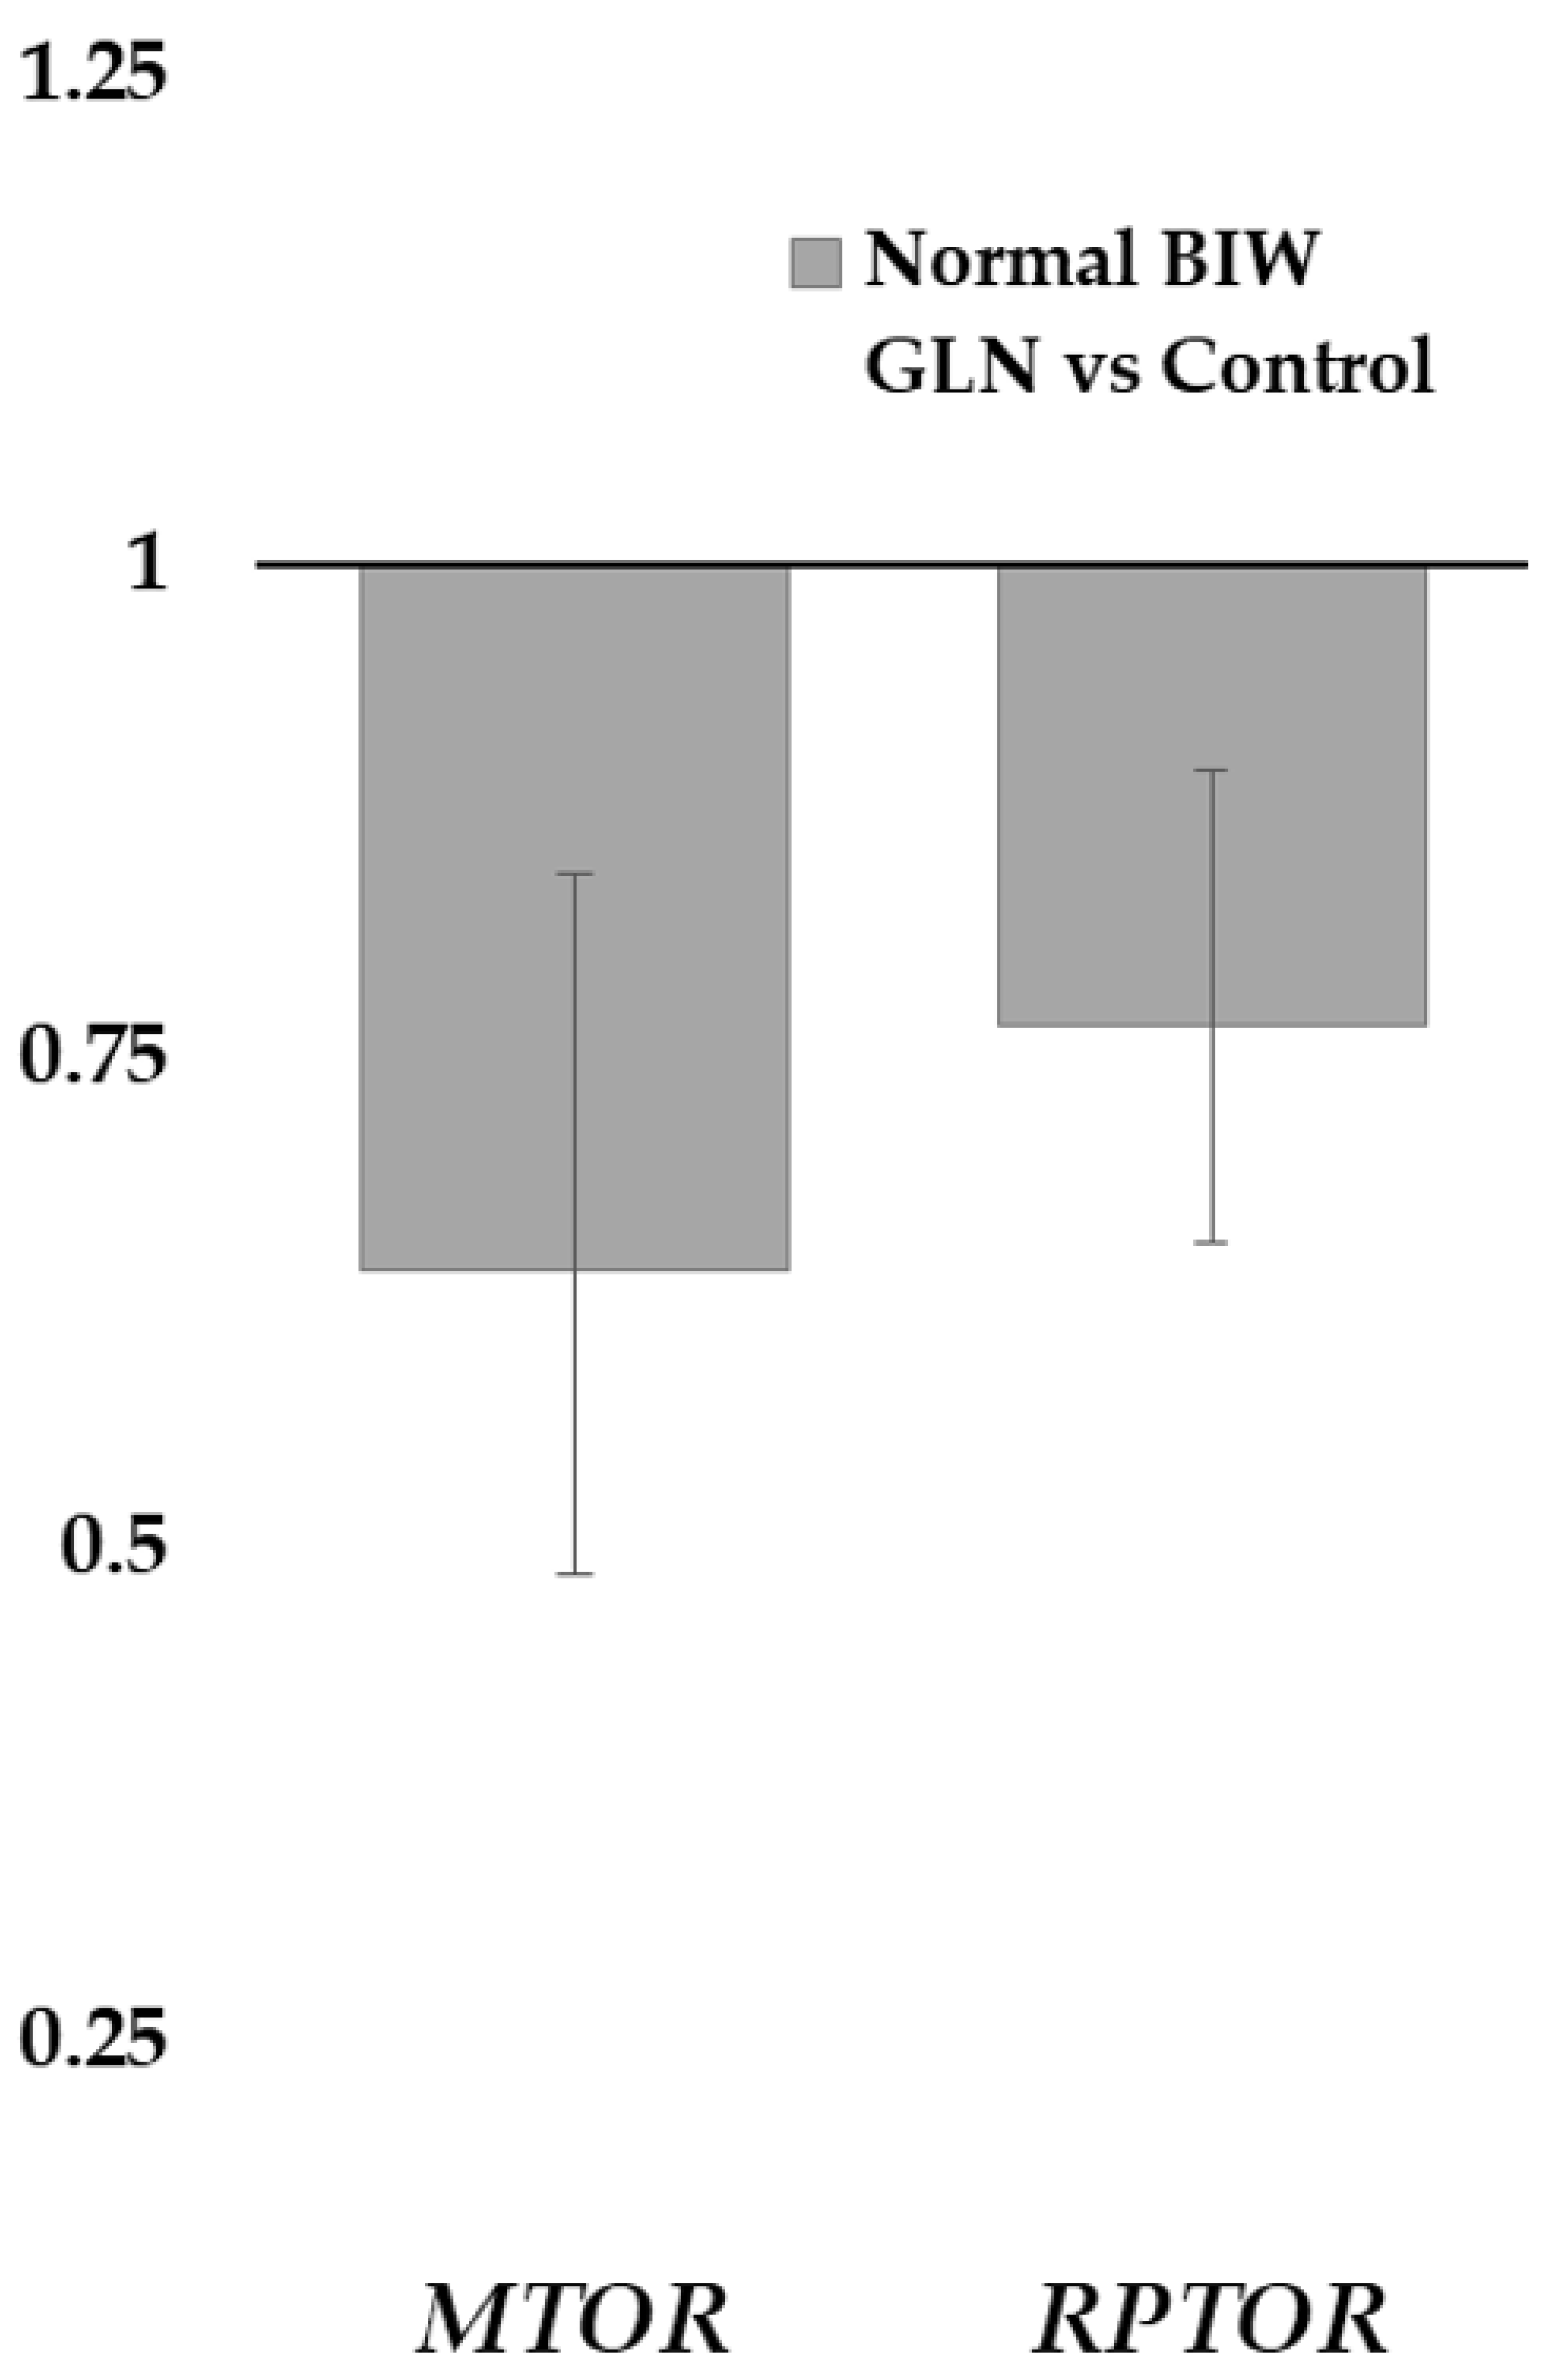
On the other hand, the supplementation of Gln also activates, directly and indirectly, the protein synthesis in fetal skeletal muscle and the mTOR signaling pathway, linked to cell growth and proliferation [19,23,40,63]. Our study has shown higher expression in components of the mTOR protein complex 1 (mTORC1; MTOR and RPTOR [raptor]) in treated NBIW newborns than in their counterparts of the control group. The mTORC1 is related to the regulation of protein and lipid synthesis, autophagy, and energy metabolism, but none of its downstream genes studied showed differences between treatment groups [40,41,63]. This finding would consist of the lack of evidence of greater prenatal growth in supplemented pregnancies. Furthermore, differences in the MTOR expression between LBIW and NBIW of the control group, but not in the treated group, were also found. Thus, treated newborns showed, as in the FA profile, more homogeneity than the control group. Finally, the expression related to intestinal tight junctions was also not different by treatment, although a previous study found benefits from the Gln supplementation in LBIW and NBIW [27]. So, physiological mechanisms related to Gln could improve prenatal development that would improve productive parameters at birth. However, 1% Gln supplementation in Iberian gilts and sows under our conditions seems not to be enough to trigger it.
The current study is the first to show the offspring development after weaning in pigs from pregnancies supplemented with Gln. Although it is always a challenge to find medium or long-term effects of maternal supplementations on the offspring, this valuable data allows us to assess the possibility of physiological or cellular changes with postnatal effects due to the prenatal Gln supplementation. However, no beneficial effects of the maternal treatment were found at weaning, at 215 days-old, or at the slaughterhouse under our conditions. Furthermore, some differences in backfat depth, carcass traits, and tissue FA profiles were affected by sex, mainly in females, although no sex-related effect was found at birth. Nevertheless, sex is a well-known important factor in swine production and, especially, in the Iberian breed [10,64,65,66].

5. Conclusions

In the current study, the Gln supplementation at 1% after Day 35 of gestation improved the plasma AA levels, the FA profile of cellular membranes in several tissues, and the gene expression of mTORC1 in Iberian newborns. However, these findings have not turned into advantageous effects on productive traits at birth nor later periods in the litters of gilts or sows under our conditions. So, further research is needed to deepen the knowledge of the parameters and molecular pathways affected by the Gln supplementation as a nutritional strategy at the sow level. Furthermore, according to our results, differences at the productive or physiological level with swine breeds previously tested should be considered before directly implementing nutritional strategies in other breeds.

Supplementary Materials

The following are available online at https://www.mdpi.com/2076-2615/11/3/903/s1, Table S1: Calculated analysis (g/kg, dry-matter basis) and fatty acid composition of the diets, Table S2: Primer design for qPCR and PCR efficiencies, Table S3: Birth data and the mean per sow of body measures of offspring between control (C) and treated (GLN) groups, Table S4: Body measures of piglets born alive at birth, Table S5. Body measures and plasma parameters of control (C) and treated (GLN) slaughtered newborns at birth, Table S6. Fatty acids (FA) composition of the brain (g/100 g total FA) of control (C) and treated (GLN) slaughtered newborns at birth, Table S7. Fatty acids (FA) composition of the liver (g/100 g total FA) of control (C) and treated (GLN) slaughtered newborns at birth, Table S8. Fatty acids (FA) composition of the Longissimus dorsi muscle (g/100 g total FA) of control (C) and treated (GLN) slaughtered newborns at birth, Table S9. The candidate gene expression from control and treated (GLN) slaughtered newborns at birth, Table S10. Postnatal development and final traits of control (C) and treated (GLN) slaughtered pigs, Table S11. The candidate gene expression from control (C) and treated (GLN) pigs at the slaughterhouse, Table S12. Fatty acids (FA) composition of the Longissimus dorsi muscle (g/100 g total FA) of control (C) and treated (GLN) pigs at the slaughterhouse, Table S13. Fatty acids (FA) composition of the backfat (g/100 g total FA) of control (C) and treated (GLN) pigs at the slaughterhouse, Table S14. Fatty acids (FA) composition of the liver (g/100 g total FA) of control (C) and treated (GLN) pigs at the slaughterhouse.

Author Contributions

Designed the study, C.L.-B., C.Ó., B.I., and A.G.-B.; performed experiments, M.V.-G., C.G.-C., J.L.P.-P., A.H.-M., S.A., C.Ó., B.I., and A.G.-B.; analyzed samples, M.V.-G., L.T.-R., and B.I.; analyzed the data, M.V.-G., and B.I. writing—original draft, M.V.-G.; writing—editing, B.I.; writing—review, A.G.-B., C.G.-C., L.T.-R., J.L.P.-P., A.H.-M., S.A., C.L.-B., and C.Ó.; project administration, C.Ó., T.C.M., B.I. and A.G.-B.; funding acquisition, C.L.-B., T.C.M., C.Ó., B.I. and A.G.-B. All authors have read and agreed to the published version of the manuscript.

Funding

The experimental work was supported by funds from the Ministry of Economy and Competitiveness (project AGL2016-79321-C2-2-R and AGL2019-108695RB-C31), co-funded by FEDER. AHM, CGC and MVG were supported by the Spanish Government (AHM: FPI National Program BES-2017-080541; CGC: FPI BES-2014-070464; MVG: FPU National Program FPU014/01285).

Institutional Review Board Statement

The study was conducted according to the guidelines of the Declaration of Helsinki, and approved by the Ethics Committee in Animal Research of INIA (report CEEA 2013/036 on 30 March 2016).

Informed Consent Statement

Not applicable.

Data Availability Statement

Data available in Supplementary Materials and upon request to the corresponding author.

Acknowledgments

The authors thank Eugenio Fernández Moya for his collaboration, Antonio Palomo for the diet data, and the staff of Ibéricos de Arauzo S.L. for their work with the animals. The authors are also very grateful to Pablo Feyjoo, Elisa Cáceres, and Millán Frias for their help at the farm and slaughterhouse.

Conflicts of Interest

The authors declare no conflict of interest.

References

  1. Quiniou, N.; Dagorn, J.; Gaudré, D. Variation of Piglets’ Birth Weight and Consequences on Subsequent Performance. Livest. Prod. Sci. 2002, 78, 63–70. [Google Scholar] [CrossRef]
  2. Gondret, F.; Lefaucheur, L.; Louveau, L.; Lebret, B.; Pichodo, X.; Le Cozler, Y. Influence of Piglet Birth Weight on Postnatal Growth Performance, Tissue Lipogenic Capacity and Muscle Histological Traits at Market Weight. Livest. Prod. Sci. 2005, 93, 137–146. [Google Scholar] [CrossRef]
  3. Bérard, J.; Kreuzer, M.; Bee, G. Effect of Litter Size and Birth Weight on Growth, Carcass and Pork Quality, and Their Relationship to Postmortem Proteolysis. J. Anim. Sci. 2008, 86, 2357–2368. [Google Scholar] [CrossRef]
  4. Wu, G.; Bazer, F.; Wallace, J.; Spencer, T. Board-Invited Review: Intrauterine Growth Retardation: Implications for the Animal Sciences. J. Anim. Sci. 2006, 84, 2316–2337. [Google Scholar] [CrossRef] [PubMed]
  5. Vallet, J.L.; McNeel, A.K.; Miles, J.R.; Freking, B.A. Placental Accommodations for Transport and Metabolism during Intra-Uterine Crowding in Pigs. J. Anim. Sci. Biotechnol. 2014, 5, 55. [Google Scholar] [CrossRef] [PubMed] [Green Version]
  6. Milligan, B.N.; Fraser, D.; Kramer, D.L. Within-Litter Birth Weight Variation in the Domestic Pig and Its Relation to Pre-Weaning Survival, Weight Gain, and Variation in Weaning Weights. Livest. Prod. Sci. 2002, 76, 181–191. [Google Scholar] [CrossRef] [Green Version]
  7. Beaulieu, A.D.; Aalhus, J.L.; Williams, N.H.; Patience, J.F. Impact of Piglet Birth Weight, Birth Order, and Litter Size on Subsequent Growth Performance, Carcass Quality, Muscle Composition, and Eating Quality of Pork1. J. Anim. Sci. 2010, 88, 2767–2778. [Google Scholar] [CrossRef] [PubMed]
  8. Douglas, S.L.; Edwards, S.A.; Kyriazakis, I. Management Strategies to Improve the Performance of Low Birth Weight Pigs to Weaning and Their Long-Term Consequences. J. Anim. Sci. 2014, 92, 2280–2288. [Google Scholar] [CrossRef]
  9. Vázquez-Gómez, M.; García-Contreras, C.; Torres-Rovira, L.; Astiz, S.; Óvilo, C.; González-Bulnes, A.; Isabel, B. Maternal Undernutrition and Offspring Sex Determine Birth-Weight, Postnatal Development and Meat Characteristics in Traditional Swine Breeds. J. Anim. Sci. Biotechnol. 2018. [Google Scholar] [CrossRef] [PubMed] [Green Version]
  10. Vázquez-Gómez, M.; García-Contreras, C.; Astiz, S.; Torres-Rovira, L.; Fernández-Moya, E.; Olivares, Á.; Daza, A.; Óvilo, C.; González-Bulnes, A.; Isabel, B. Piglet Birthweight and Sex Affect Growth Performance and Fatty Acid Composition in Fatty Pigs. Anim. Prod. Sci. 2020, 60, 573–583. [Google Scholar] [CrossRef]
  11. Lopez-Bote, C.J. Sustained Utilization of the Iberian Pig Breed. Meat Sci. 1998, 49, S17–S27. [Google Scholar] [CrossRef]
  12. Brussow, K.; Egerszegi, I.; Ratky, J.; Soos, F.; Garcia Casado, P.; Tuchscherer, A.; Toth, P. Organometric Data of the Reproductive Tract in Cycling and Early Pregnant Hungarian Mangalica Pigs. Archiv Fur Tierzucht 2004, 47, 585–594. [Google Scholar] [CrossRef]
  13. Gonzalez-Añover, P.; Encinas, T.; Torres-Rovira, L.; Pallares, P.; Muñoz-Frutos, J.; Gomez-Izquierdo, E.; Sanchez-Sanchez, R.; Gonzalez-Bulnes, A. Ovulation Rate, Embryo Mortality and Intrauterine Growth Retardation in Obese Swine with Gene Polymorphisms for Leptin and Melanocortin Receptors. Theriogenology 2011, 75, 34–41. [Google Scholar] [CrossRef]
  14. Torres-Rovira, L.; Gonzalez-Añover, P.; Pallares, P.; Pérez-Solana, M.L.; Astiz, S.; Gomez-Izquierdo, E.; Sanchez-Sanchez, R.; Gonzalez-Bulnes, A. The Interaction between Ovulation Rate and Embryo Survival in Determining Prolificacy of Different Strains of Obese Swine with Gene Polymorphisms for Leptin Receptors. Anim. Prod. Sci. 2012, 52, 58–63. [Google Scholar] [CrossRef]
  15. Wu, G.; Bazer, F.W.; Johnson, G.A.; Knabe, D.A.; Burghardt, R.C.; Spencer, T.E.; Li, X.L.; Wang, J.J. Important Roles for L-Glutamine in Swine Nutrition and Production. J. Anim. Sci. 2011, 89, 2017–2030. [Google Scholar] [CrossRef] [Green Version]
  16. Wu, G.; Bazer, F.W.; Satterfield, M.C.; Li, X.; Wang, X.; Johnson, G.A.; Burghardt, R.C.; Dai, Z.; Wang, J.; Wu, Z. Impacts of Arginine Nutrition on Embryonic and Fetal Development in Mammals. Amino Acids 2013, 45, 241–256. [Google Scholar] [CrossRef]
  17. Wu, G. Functional Amino Acids in Nutrition and Health. Amino Acids 2013, 45, 407–411. [Google Scholar] [CrossRef] [Green Version]
  18. Wu, G.; Bazer, F.W.; Burghardt, R.C.; Johnson, G.A.; Kim, S.W.; Li, X.L.; Satterfield, M.C.; Spencer, T.E. Impacts of Amino Acid Nutrition on Pregnancy Outcome in Pigs: Mechanisms and Implications for Swine Production. J. Anim. Sci. 2010, 88, E195–E204. [Google Scholar] [CrossRef] [PubMed] [Green Version]
  19. Wu, G.; Bazer, F.W.; Johnson, G.A.; Herring, C.; Seo, H.; Dai, Z.; Wang, J.; Wu, Z.; Wang, X. Functional Amino Acids in the Development of the Pig Placenta. Mol. Reprod. Dev. 2017, 84, 870–882. [Google Scholar] [CrossRef]
  20. Mordhorst, B.; Prather, R. Pig models of reproduction. In Animal Models and Human Reproduction; John Wiley & Sons: Hoboken, NJ, USA, 2017; p. 213. ISBN 1-118-88142-7. [Google Scholar]
  21. Quesnel, H.; Quiniou, N.; Roy, H.; Lottin, A.; Boulot, S.; Gondret, F. Supplying Dextrose before Insemination and L-Arginine during the Last Third of Pregnancy in Sow Diets: Effects on within-Litter Variation of Piglet Birth Weight. J. Anim. Sci. 2014, 92, 1445–1450. [Google Scholar] [CrossRef] [PubMed] [Green Version]
  22. Mateo, R.D.; Wu, G.; Bazer, F.W.; Park, J.C.; Shinzato, I.; Kim, S.W. Dietary L-Arginine Supplementation Enhances the Reproductive Performance of Gilts. J. Nutr. 2007, 137, 652–656. [Google Scholar] [CrossRef]
  23. Li, J.; Xia, H.; Yao, W.; Wang, T.; Li, J.; Piao, X.; Thacker, P.; Wu, G.; Wang, F. Effects of Arginine Supplementation during Early Gestation (Day 1 to 30) on Litter Size and Plasma Metabolites in Gilts and Sows. J. Anim. Sci. 2015, 93, 5291–5303. [Google Scholar] [CrossRef]
  24. Gonzalez-Añover, P.; Gonzalez-Bulnes, A. Maternal Age Modulates the Effects of Early-Pregnancy L-Proline Supplementation on the Birth-Weight of Piglets. Anim. Reprod. Sci. 2017. [Google Scholar] [CrossRef] [PubMed]
  25. Dallanora, D.; Marcon, J.; Walter, M.P.; Biondo, N.; Bernardi, M.L.; Wentz, I.; Bortolozzo, F.P. Effect of Dietary Amino Acid Supplementation during Gestation on Placental Efficiency and Litter Birth Weight in Gestating Gilts. Livest. Sci. 2017, 197, 30–35. [Google Scholar] [CrossRef]
  26. Guo, P.; Jiang, Z.Y.; Gao, K.G.; Wang, L.; Yang, X.F.; Hu, Y.J.; Zhang, J.; Ma, X.Y. Low-Level Arginine Supplementation (0.1%) of Wheat-Based Diets in Pregnancy Increases the Total and Live-Born Litter Sizes in Gilts. Anim. Prod. Sci. 2017, 57, 1091–1096. [Google Scholar] [CrossRef]
  27. Zhu, Y.; Li, T.; Huang, S.; Wang, W.; Dai, Z.; Feng, C.; Wu, G.; Wang, J. Maternal L-Glutamine Supplementation during Late Gestation Alleviates Intrauterine Growth Restriction-Induced Intestinal Dysfunction in Piglets. Amino Acids 2018, 50, 1289–1299. [Google Scholar] [CrossRef] [PubMed]
  28. Nieto, R.; Miranda, A.; García, M.; Aguilera, J. The Effect of Dietary Protein Content and Feeding Level on the Rate of Protein Deposition and Energy Utilization in Growing Iberian Pigs from 15 to 50kg Body Weight. Br. J. Nutr. 2002, 88, 39–49. [Google Scholar] [CrossRef] [PubMed]
  29. Rivera-Ferre, M.G.; Aguilera, J.F.; Nieto, R. Differences in Whole-Body Protein Turnover between Iberian and Landrace Pigs Fed Adequate or Lysine-Deficient Diets. J. Anim. Sci. 2006, 84, 3346–3355. [Google Scholar] [CrossRef] [PubMed] [Green Version]
  30. Fernández-Fígares, I.; Lachica, M.; Nieto, R.; Rivera-Ferre, M.G.; Aguilera, J.F. Serum Profile of Metabolites and Hormones in Obese (Iberian) and Lean (Landrace) Growing Gilts Fed Balanced or Lysine Deficient Diets. Livest. Sci. 2007, 110, 73–81. [Google Scholar] [CrossRef]
  31. Óvilo, C.; Fernández, A.; Fernández, A.I.; Folch, J.M.; Varona, L.; Benítez, R.; Nuñez, Y.; Rodríguez, C.; Silió, L. Hypothalamic Expression of Porcine Leptin Receptor (LEPR), Neuropeptide Y (NPY), and Cocaine- and Amphetamine-Regulated Transcript (CART) Genes Is Influenced by LEPR Genotype. Mamm. Genome 2010, 21, 583–591. [Google Scholar] [CrossRef]
  32. Barea, R.; Nieto, R.; Vitari, F.; Domeneghini, C.; Aguilera, J.F. Effects of Pig Genotype (Iberian v. Landrace × Large White) on Nutrient Digestibility, Relative Organ Weight and Small Intestine Structure at Two Stages of Growth. Animal 2011, 5, 547–557. [Google Scholar] [CrossRef]
  33. Nieto, R.; Lara, L.; Barea, R.; García-Valverde, R.; Aguinaga, M.A.; Conde-Aguilera, J.A.; Aguilera, J.F. Response Analysis of the Iberian Pig Growing from Birth to 150 Kg Body Weight to Changes in Protein and Energy Supply1. J. Anim. Sci. 2012, 90, 3809–3820. [Google Scholar] [CrossRef]
  34. García-Contreras, C.; Madsen, O.; Groenen, M.A.M.; López-García, A.; Vázquez-Gómez, M.; Astiz, S.; Núñez, Y.; Benítez, R.; Fernández, A.; Isabel, B.; et al. Impact of Genotype, Body Weight and Sex on the Prenatal Muscle Transcriptome of Iberian Pigs. PLoS ONE 2020, 15, e0227861. [Google Scholar] [CrossRef] [Green Version]
  35. De Blas, C.; Gasa, J.; Mateos, G.G. Necesidades Nutricionales Para Ganado Porcino. Fundación Española Para el Desarrollo de la Nutrición Animal, 2nd ed.; FEDNA: Madrid, Spain, 2013. [Google Scholar]
  36. Calvo, L.; Toldrá, F.; Aristoy, M.C.; López-Bote, C.J.; Rey, A.I. Effect of Dietary Organic Selenium on Muscle Proteolytic Activity and Water-Holding Capacity in Pork. Meat Sci. 2016, 121, 1–11. [Google Scholar] [CrossRef] [PubMed] [Green Version]
  37. Greene, J.; Henderson, J.W., Jr.; Wikswo, J.P. Rapid and Precise Determination of Cellular Amino Acid Flux Rates Using HPLC with Automated Derivatization with Absorbance Detection; Application Note; Agilent Technologies: Santa Clara, CA, USA, 2014. [Google Scholar]
  38. Benzie, I.F.; Strain, J.J. The Ferric Reducing Ability of Plasma (FRAP) as a Measure of “Antioxidant Power”: The FRAP Assay. Anal. Biochem. 1996, 239, 70–76. [Google Scholar] [CrossRef] [Green Version]
  39. Lärstad, M.; Ljungkvist, G.; Olin, A.-C.; Torén, K. Determination of Malondialdehyde in Breath Condensate by High-Performance Liquid Chromatography with Fluorescence Detection. J. Chromatogr. B 2002, 766, 107–114. [Google Scholar] [CrossRef]
  40. Zoncu, R.; Efeyan, A.; Sabatini, D.M. MTOR: From Growth Signal Integration to Cancer, Diabetes and Ageing. Nat. Rev. Mol. Cell Biol. 2010, 12, 21. [Google Scholar] [CrossRef] [PubMed] [Green Version]
  41. Kim, J.; Song, G.; Wu, G.; Gao, H.; Johnson, G.A.; Bazer, F.W. Arginine, Leucine, and Glutamine Stimulate Proliferation of Porcine Trophectoderm Cells Through the MTOR-RPS6K-RPS6-EIF4EBP1 Signal Transduction Pathway. Biol. Reprod. 2013, 88. [Google Scholar] [CrossRef] [Green Version]
  42. Steibel, J.P.; Poletto, R.; Coussens, P.M.; Rosa, G.J.M. A Powerful and Flexible Linear Mixed Model Framework for the Analysis of Relative Quantification RT-PCR Data. Genomics 2009, 94, 146–152. [Google Scholar] [CrossRef] [PubMed] [Green Version]
  43. Benítez, R.; Fernández, A.; Isabel, B.; Núñez, Y.; De Mercado, E.; Gómez-Izquierdo, E.; García-Casco, J.; López-Bote, C.; Óvilo, C. Modulatory Effects of Breed, Feeding Status, and Diet on Adipogenic, Lipogenic, and Lipolytic Gene Expression in Growing Iberian and Duroc Pigs. Int. J. Mol. Sci. 2018, 19, 22. [Google Scholar] [CrossRef] [Green Version]
  44. Sukhija, P.S.; Palmquist, D.L. Rapid Method for Determination of Total Fatty Acid Content and Composition of Feedstuffs and Feces. J. Agric. Food Chem. 1988, 36, 1202–1206. [Google Scholar] [CrossRef]
  45. Lopez-Bote, C.; Rey, A.; Ruiz, J.; Isabel, B.; Sanz Arias, R. Effect of Feeding Diets High in Monounsaturated Fatty Acids and α-Tocopheryl Acetate to Rabbits on Resulting Carcass Fatty Acid Profile and Lipid Oxidation. Anim. Sci. 1997, 64, 177–186. [Google Scholar] [CrossRef]
  46. Segura, J.; Lopez-Bote, C.J. A Laboratory Efficient Method for Intramuscular Fat Analysis. Food Chem. 2014, 145, 821–825. [Google Scholar] [CrossRef] [PubMed]
  47. Ruiz, J.; Antequera, T.; Andres, A.I.; Petron, M.; Muriel, E. Improvement of a Solid Phase Extraction Method for Analysis of Lipid Fractions in Muscle Foods. Anal. Chim. Acta 2004, 520, 201–205. [Google Scholar] [CrossRef]
  48. Segura, J.; Escudero, R.; Romero de Ávila, M.D.; Cambero, M.I.; López-Bote, C.J. Effect of Fatty Acid Composition and Positional Distribution within the Triglyceride on Selected Physical Properties of Dry-Cured Ham Subcutaneous Fat. Meat Sci. 2015, 103, 90–95. [Google Scholar] [CrossRef] [PubMed]
  49. Hulbert, A.J.; Pamplona, R.; Buffenstein, R.; Buttemer, W.A. Life and Death: Metabolic Rate, Membrane Composition, and Life Span of Animals. Physiol. Rev. 2007, 87, 1175–1213. [Google Scholar] [CrossRef] [PubMed]
  50. Hulver, M.W.; Berggren, J.R.; Carper, M.J.; Miyazaki, M.; Ntambi, J.M.; Hoffman, E.P.; Thyfault, J.P.; Stevens, R.; Dohm, G.L.; Houmard, J.A.; et al. Elevated Stearoyl-CoA Desaturase-1 Expression in Skeletal Muscle Contributes to Abnormal Fatty Acid Partitioning in Obese Humans. Cell Metab. 2005, 2, 251–261. [Google Scholar] [CrossRef] [Green Version]
  51. Wu, X.; Xie, C.; Zhang, Y.; Fan, Z.; Yin, Y.; Blachier, F. Glutamate–Glutamine Cycle and Exchange in the Placenta–Fetus Unit during Late Pregnancy. Amino Acids 2015, 47, 45–53. [Google Scholar] [CrossRef]
  52. Gu, T.; Zhu, M.; Schroyen, M.; Qu, L.; Nettleton, D.; Kuhar, D.; Lunney, J.K.; Ross, J.W.; Zhao, S.; Tuggle, C.K. Endometrial Gene Expression Profiling in Pregnant Meishan and Yorkshire Pigs on Day 12 of Gestation. BMC Genom. 2014, 15, 1–12. [Google Scholar] [CrossRef] [Green Version]
  53. Canario, L.; Cantoni, E.; Le Bihan, E.; Caritez, J.C.; Billon, Y.; Bidanel, J.P.; Foulley, J.L. Between-Breed Variability of Stillbirth and Its Relationship with Sow and Piglet Characteristics. J. Anim. Sci. 2006, 84, 3185–3196. [Google Scholar] [CrossRef]
  54. Fainberg, H.P.; Bodley, K.; Bacardit, J.; Li, D.; Wessely, F.; Mongan, N.P.; Symonds, M.E.; Clarke, L.; Mostyn, A. Reduced Neonatal Mortality in Meishan Piglets: A Role for Hepatic Fatty Acids? PLoS ONE 2012, 7, e49101. [Google Scholar] [CrossRef]
  55. Ashworth, C.J.; Nwagwu, M.O.; McArdle, H.J. Genotype and Fetal Size Affect Maternal–Fetal Amino Acid Status and Fetal Endocrinology in Large White × Landrace and Meishan Pigs. Reprod. Fertil. Dev. 2013, 25, 439–445. [Google Scholar] [CrossRef]
  56. Committee on Nutrient Requirements of Swine; Board on Agriculture and Natural Resources; Division on Earth and Life Studies; National Research Council of the National Academies. Nutrient Requirements of Swine: Eleventh Revised Edition; National Academies Press: Washington, DC, USA, 2012; ISBN 978-0-309-22423-9. [Google Scholar]
  57. Athorn, R.Z.; Wilkinson, A.R.; Henman, D.J. Effect of L-Glutamine in Late Gestation Sow Diets on Survivability and Growth of Piglets. Anim. Prod. Sci. 2017, 57, 2451. [Google Scholar] [CrossRef]
  58. Bignell, H., Jr. Maternal Ingestion of Glutamine and Glutamate during Sow Pregnancy and Lactation: Lipid Profile Analysis of Milk and Neonatal Adipose Tissues; Rutgers University—Graduate School: New Brunswick, NJ, USA, 2014. [Google Scholar]
  59. Ren, W.; Luo, W.; Wu, M.; Liu, G.; Yu, X.; Fang, J.; Li, T.; Yin, Y.; Wu, G. Dietary L-Glutamine Supplementation Improves Pregnancy Outcome in Mice Infected with Type-2 Porcine Circovirus. Amino Acids 2013, 45, 479–488. [Google Scholar] [CrossRef] [PubMed]
  60. Bee, G. Gestational Strategies Affecting Sow Reproduction and Piglet Birth Weight. In Proceedings of the the 11th International Symposium Modern Trends in Livestock Production, Belgrade, Serbia, 11–13 October 2017. [Google Scholar]
  61. Calder, P.C. Polyunsaturated Fatty Acids and Inflammatory Processes: New Twists in an Old Tale. Biochimie 2009, 91, 791–795. [Google Scholar] [CrossRef] [PubMed]
  62. Calder, P.C. Omega-3 Fatty Acids and Inflammatory Processes: From Molecules to Man. Biochem. Soc. Trans. 2017, 45, 1105–1115. [Google Scholar] [CrossRef] [Green Version]
  63. Laplante, M.; Sabatini, D.M. MTOR Signaling in Growth Control and Disease. Cell 2012, 149, 274–293. [Google Scholar] [CrossRef] [Green Version]
  64. Egea, M.; Linares, M.B.; Garrido, M.D.; Madrid, J.; Hernández, F. Feeding Iberian × Duroc Cross Pigs with Crude Glycerine: Effects of Diet and Gender on Carcass and Meat Quality. Meat Sci. 2016, 111, 78–84. [Google Scholar] [CrossRef]
  65. Daza, A.; Latorre, M.A.; Olivares, A.; López Bote, C.J. The Effects of Male and Female Immunocastration on Growth Performances and Carcass and Meat Quality of Pigs Intended for Dry-Cured Ham Production: A Preliminary Study. Livest. Sci. 2016, 190, 20–26. [Google Scholar] [CrossRef]
  66. Schinckel, A.P.; Einstein, M.E.; Jungst, S.; Booher, C.; Newman, S. Evaluation of the Impact of Pig Birth Weight on Grow-Finish Performance, Backfat Depth, and Loin Depth. Prof. Anim. Sci. 2010, 26, 51–69. [Google Scholar] [CrossRef]
Figure 1. Fold-change (FC) ratios of MTOR and RPTOR genes with significant differences between maternal treatments within normal birth-weight (BIW) newborns. FC values <1 indicate higher expression in the first group. The error lines indicate the standard errors. GLN: group treated with L-glutamine.
Animals 11 00903 g001
Table 1. Significant differences between control and treated (GLN) newborns at birth. Mean ± SE.
Controln = 24GLNn = 24p-Value
Plasma amino acids (mg/L)
GLN 90.20±6.92110.60±7.360.03
ALA 48.65±4.3170.53±5.970.004
ASN 15.01±1.3419.21±1.790.03
GLY 49.26±3.7566.64±4.510.006
HIS 21.58±1.9630.14±2.740.01
PRO 66.4±12.8100.5±11.30.02
SER 21.43±1.7931.32±2.750.004
VAL 33.82±3.0643.24±3.390.03
ILE 6.40±0.839.45±1.49t
TRP 9.95±0.4311.30±0.61t
Body composition
Lung W (g)21.42±1.5118.67±1.530.04
Liver W/Body W (%)2.51±0.092.84±0.16t
Carcass W (g)689.5±57.0600.5±56.0t
All viscera W/Body W (%)14.03±0.6115.42±0.46t
Plasma parameters
MDA (µmol/L)2.64±0.461.61±0.29t
W = weight, Amino acids (ALA = Alanine, ASN = Asparagine, GLN = Glutamine, GLY = Glycine, HIS = Histidine, ILE = Isoleucine, PRO = Proline, SER = Serine, TRP = Tryptophan, VAL = Valine), MDA = malondialdehyde, SE = standard error, t = 0.1 > p > 0.05.
Table 2. Expression of target genes in control and treated (GLN) newborns at birth.
GeneFC (GLN-C)95% CIp-Value/q-Value
EIF4EBP10.820.50–1.33ns/ns
HIF1A1.150.35–3.84ns/ns
MTOR0.850.70–1.030.08/ns
OCLN0.750.46–1.22ns/ns
PPARG0.920.57–1.50ns/ns
RPS60.830.67–1.020.07/ns
RPS6KB10.830.71–0.970.02/ns
RPTOR0.890.79–0.990.03/ns
SREBF10.890.67–1.18ns/ns
FC = Fold change, CI = Confident interval, ns = not significant.
Table 3. Significant differences in tissue fatty acid (FA) compositions between control and treated (GLN) newborns at birth. Mean ± SE (g/100 g total FA).
Controln = 24GLNn = 24p-Value
Liver, Polar lipids
Fat (% dry matter)18.44±0.6715.73±0.690.009
MUFA25.02±0.4526.36±0.52t
PUFA34.3±0.333.3±0.4t
C18:1/C18:01.04±0.031.14±0.040.04
Brain, Polar lipids
PUFA Σn-38.53±0.259.04±0.130.04
LD muscle, Polar lipids
PUFA Σn-33.53±0.073.78±0.070.02
Σn-6/Σn-36.62±0.126.19±0.130.02
MUFA = sum of monounsaturated FA, PUFA = sum of polyunsaturated FA, LD = Longissimus dorsi, SE = standard error, t = 0.1 > p > 0.05.
Table 4. Significant differences in tissue fatty acid (FA) compositions at birth between newborns with low and normal birth-weight (LBIW and NBIW) from both control (C) and treated (GLN) groups. Mean ± SE (g/100 g total FA).
C NBIW n = 12 C LBIW n = 12 GLN LBIW n = 12
Liver, Neutral lipids
Σn-6/Σn-35.39 ± 0.25 4.43 ± 0.24 T
C18:1/C18:04.33 ± 0.32 3.23 ± 0.22 A
Brain, Neutral lipids
SFA45.61 ± 0.28 C48.25 ± 0.34 C,A47.08 ± 0.39 A
MUFA/SFA0.57 ± 0.01 0.51 ± 0.01 B
Brain, Polar lipids
MUFA26.02 ± 0.24 25.10 ± 0.36 C
PUFA Σn-616.68 ± 0.14 D17.80 ± 0.24 D,B17.19 ± 0.07 B
Σn-6/Σn-31.82 ± 0.04 C2.38 ± 0.22 C,A1.98 ± 0.05 A
MUFA/SFA0.55 ± 0.010.52 ± 0.01 B
C18:1/C18:01.20 ± 0.02 B1.15 ± 0.01 B,A1.20 ± 0.01 A
LD muscle, Neutral lipids
SFA43.44 ± 0.40 C45.92 ± 0.63 C 43.46 ± 0.49 A
MUFA/SFA0.98 ± 0.02 B0.89 ± 0.03 B,B0.98 ± 0.02 B
NBIW = Normal BIW, LBIW = Low BIW, SFA = sum of saturated FA, MUFA = sum of monounsaturated FA, PUFA = sum of polyunsaturated FA, LD = Longissimus dorsi, SE = standard error, Superscritps: T = 0.1 > p > 0.05; A = p < 0.05; B = p < 0.01; C = p < 0.005; D = p < 0.0001.
Table 5. Expression of target genes in control (C) and treated (GLN) pigs at the slaughterhouse.
GeneFC (GLN-C)95% CIp- & q-Values
EIF4EBP10.990.79–1.24ns
HIF1A1.030.84–1.27ns
MTOR1.070.83–1.38ns
OCLN1.070.85–1.36ns
PPARG1.240.93–1.66ns
RPS61.120.87–1.43ns
RPS6KB11.360.71–2.58ns
RPTOR1.020.80–1.31ns
SREBF10.990.77–1.27ns
FC = Fold change, CI = Confident interval, ns = not significant.
Table 6. Significant differences in the fatty acid (FA) composition of the polar lipid fraction of LD muscle between control and treated (GLN) pigs at the slaughterhouse. LSmean ± SE (g/100 g total FA).
Controln = 54GLNn = 79p-Value
LD muscle, Neutral lipids
SFA38.62±0.5939.67±0.330.04
MUFA58.66±0.5657.76±0.30t
PUFA2.72±0.062.57±0.050.02
Σn-30.22±0.010.21±0.000.03
Σn-62.34±0.052.21±0.040.02
MUFA/SFA1.55±0.041.47±0.020.02
C18:1/C18:04.71±0.154.47±0.090.03
SFA = sum of saturated FA, MUFA = sum of monounsaturated FA, PUFA = sum of polyunsaturated FA, LD = Longissimus dorsi, SE = standard error, t = 0.1 > p > 0.05.
Table 7. Significant differences in tissue fatty acid (FA) compositions between control (C) and treated (GLN) pigs of both sexes at the slaughterhouse. LSmean ± SE (g/100 g total FA) of C and GLN females (Fem) and males (Mal).
C Fem n = 21 GLN Fem n = 30 C Mal n = 33 GLN Mal n = 49
LD muscle, Polar lipids
SFA31.49 ± 0.30 A,A32.31 ± 0.25 A32.24 ± 0.24 A
MUFA20.57 ± 0.31 A,A,B21.60 ± 0.26 A21.58 ± 0.24 A21.60 ± 0.20 B
PUFA47.94 ± 0.39 D,D,B46.09 ± 0.31 D46.17 ± 0.33 D46.69 ± 0.26 B
Σn-32.80 ± 0.08 E2.34 ± 0.07 E,D,E2.71 ± 0.07 E2.64 ± 0.05 D
Σn-644.50 ± 0.23 B,B,A43.10 ± 0.34 B42.79 ± 0.37 B43.38 ± 0.24 A
Σn-6/Σn-315.97 ± 0.86 D19.93 ± 0.73 D,D,E15.99 ± 0.69 E16.79 ± 0.56 D
Backfat, Inner layer
C18:1/C18:03.36 ± 0.14 C3.60 ± 0.12 T3.91 ± 0.11 C,T,A3.62 ± 0.09 A
Liver, Neutral lipids
SFA 45.66 ± 0.56 47.35 ± 0.44 A
Liver, Polar lipids
SFA51.73 ± 0.45 50.25 ± 0.36 A
PUFA25.80 ± 0.9328.20 ± 0.74 A
Σn-623.00 ± 0.81 25.21 ± 0.64 A
SFA = sum of saturated FA, MUFA = sum of monounsaturated FA, PUFA = sum of polyunsaturated FA, LD = Longissimus dorsi, SE = standard error, Superscritps: T = 0.1 > p > 0.05; A = p< 0.005; B = p < 0.01; C = p < 0.005; D = p < 0.001; E = p < 0.0005.
Publisher’s Note: MDPI stays neutral with regard to jurisdictional claims in published maps and institutional affiliations.

