Article

The Concurrent Detection of Chelonid Alphaherpesvirus 5 and Chelonia mydas Papillomavirus 1 in Tumoured and Non-Tumoured Green Turtles

1
College of Public Health, Medical and Veterinary Sciences, James Cook University, Townsville, QLD 4814, Australia
2
College of Medicine and Dentistry, James Cook University, Townsville, QLD 4814, Australia
*
Author to whom correspondence should be addressed.
These authors contributed equally to this work.
Animals 2021, 11(3), 697; https://doi.org/10.3390/ani11030697
Submission received: 8 February 2021 / Revised: 1 March 2021 / Accepted: 1 March 2021 / Published: 5 March 2021
(This article belongs to the Special Issue Oncogenic Viruses in Animals)

Abstract

:

Simple Summary

Characterised by benign tumours, fibropapillomatosis is a debilitating disease that predominantly afflicts the endangered green turtle (Chelonia mydas). A growing body of evidence has associated these tumours with a herpesvirus. However, a recent study detected both herpesvirus and papillomavirus in these tumours. This result challenged the idea that the herpesvirus is the sole virus associated with this disease. The present study aimed to better understand the co-occurrence of these viruses in turtles with fibropapillomatosis (in both tumour samples and non-tumoured skin samples), in addition to samples from non-tumoured turtles. Both viruses were detected in all sample types, with the 43.5% of tumours containing both herpesvirus and papillomavirus. Tumour samples were found to contain the most herpesvirus while the highest amount of papillomavirus was detected in non-tumoured skin from turtles with tumours. Collectively, these results pivot the way we think about this disease; as an infectious disease where two separate viruses may be at play.

Abstract

Characterised by benign tumours, fibropapillomatosis (FP) is a debilitating disease that predominantly afflicts the endangered green turtle (Chelonia mydas). A growing body of histological and molecular evidence has associated FP tumours with Chelonid alphaherpesvirus 5 (ChHV5). However, a recent study which detected both ChHV5 and Chelonia mydas papillomavirus 1 (CmPV1) DNA in FP tumour tissues has challenged this hypothesis. The present study aimed to establish a probe-based qPCR to assess the wider prevalence of CmPV1 and co-occurrence with ChHV5 in 275 marine turtles foraging in waters adjacent to the east coast of Queensland, Australia: three categories: Group A (FP tumours), Group B (non-tumoured skin from FP turtles) and Group C (non-tumoured skin from turtles without FP). Concurrent detection of ChHV5 and CmPV1 DNA is reported for all three categories, where Group A had the highest rate (43.5%). ChHV5 viral loads in Group A were significantly higher than loads seen in Group B and C. This was not the case for CmPV1 where the loads in Group B were highest, followed by Group A. However, the mean CmPV1 load for Group A samples was not significantly different to the mean load reported from Group B or C samples. Collectively, these results pivot the way we think about FP; as an infectious disease where two separate viruses may be at play.

1. Introduction

The endangered green turtle (Chelonia mydas) faces many threats, each of which need to be effectively managed in order to conserve this vulnerable species. Although the impact of disease in wild populations is largely unknown [1], green turtles are particularly susceptible to a tumour-forming disease [2]. Fibropapillomatosis (FP) is a neoplastic disease characterised by the formation of benign tumours. Fibrosarcomas, fibropapillomas, papillomas, fibromas and myxofibromas have all been associated with FP, with lesion type thought to be linked to different stages of development [3,4,5,6]. Depending on the location of growth, these tumours can impair feeding, vision, and locomotion of affected turtles [3,4,7]. Turtles with FP tumours are also more vulnerable to chronic stress and secondary infections [8,9]. Although this disease has been reported in all species of marine turtle, it predominantly affects green turtles [2].
While the aetiological agent of FP is yet to be confirmed [10], early studies provided evidence for a viral aetiological agent of FP [11,12]. A body of subsequent research has identified a range of potential candidates; this includes papillomaviruses, polyomaviruses, retroviruses and herpesviruses [4,13,14,15,16,17]. However, histological and molecular evidence has consistently linked FP to a herpesviral infection [11,12,14,15,18,19,20,21,22,23,24,25,26,27,28,29,30].
Chelonid alphaherpesvirus 5 (ChHV5) is considered to be the most likely aetiological agent of this disease. Elements of ChHV5 DNA have been amplified from FP tumours and from turtles without tumours, which is consistent with the latent nature of herpesviral infections [18,19,24,25,30,31,32]. However, despite the development of more sensitive assays, varying rates of ChHV5 detection in FP tumours have been reported [24,26,29,33,34,35]. It is possible that this variable rate of detection is the result of the different methods used in these studies. Alternatively, these results may simply be accurate for each population studied. It has been suggested that the inconsistency of ChHV5 detection in FP tumours indicates the presence of other co-factors contributing to disease manifestation [29].
Based on the morphology and histopathology of FP tumours, an alternative aetiological agent could be papillomavirus. The epidermal hyperplasia and mesenchymal proliferation observed in FP is similar to equine sarcoids, a neoplastic disease of horses caused by bovine papillomavirus type 1 or type 2 [36]. The characteristics of the dermal proliferation is also similar to those observed in cattle fibropapillomas and deer fibromas [12], which are both caused by papillomaviruses [37,38]. Moreover, transmission electron microscopy studies on samples from FP tumours have reported virions similar in morphology to papillomavirus [17]. These histopathological indicators triggered molecular investigations of a relationship between FP tumours and papillomaviruses a few decades ago, but they were not conclusive [17,39]. Subsequent research on links between papillomaviruses and FP were therefore abandoned until more recently, when a viral discovery project used primary cell lines from green turtles to screen a number of tissues from deceased turtles as well as FP tumour biopsies [40]. The cytopathic effect in cell cultures inoculated with material from the tumours was further investigated with current molecular techniques, which facilitated the identification of a papillomavirus. Mashkour et al. utilised species-specific assays for detection of virus [40], which likely contributed to the successful detection of both CmPV1 and ChHV5 in eight out of 10 FP tumour samples collected from green turtles with FP, thereby challenging the perception that FP is associated with just herpesvirus.
It is clear that the role of papillomaviruses in FP and the fact that viruses are the least studied pathogens in marine turtles [1] warrant further investigation. The overall objective of the current study was to conduct a comprehensive molecular survey to better understand the disease ecology. This objective was met through the following aims: (1) Investigate presence of ChHV5 and CmPV1 DNA in a larger sample collection from Australian turtles both with and without FP tumours and (2) Establish the viral load of ChHV5 and/or CmPV1 present in these samples.

2. Materials and Methods

2.1. Sample Collection

A total of 275 marine turtles were sampled at six locations along the Great Barrier Reef. This included 89 turtles with FP tumours, 87 of which were green turtles. The remaining turtles with FP tumours consisted of one loggerhead (Caretta caretta) turtles and one green/hawksbill (Eretmochelys imbricata) hybrid turtle. Where possible, paired samples were collected from FP tumours and non-tumoured skin. In addition, multiple samples of FP tumours from individual turtles were taken opportunistically. Samples from a further 186 non-tumoured turtles were also collected from three of the six study sites. These samples were grouped into three categories: Group A (FP Tumours), Group B (Non-tumoured skin from turtles with FP tumours) and Group C (Skin from non-tumoured turtles) (Table 1). The total dataset consisted of samples from waters adjacent to Cairns (n = 2), Townsville (n = 80), Bowen (n = 130), Airlie Beach (n = 1), Gladstone (n = 54) and Brisbane (n = 8).
Most turtles sampled in this study were captured using the rodeo capture technique [41] and flipper-tagged with a unique alpha-numeric inscribed titanium tag (Stockbrands Company, Pty. Ltd., Perth, Western Australia). The remaining tumour samples were collected during necropsy and others were donated (see Supplementary Tables S1–S3). The curved carapace length (CCL) of each turtle in this study was measured using a flexible tape measure (±2 mm).
All samples were collected using fresh, sterile, disposable scalpel blades and stored in cryovials containing 90% ethanol. Any paired skin samples were collected from non-tumoured sites on the trailing edge of the front flipper of each turtle. Samples were collected between 2009 and 2018. The median year of collection was 2013. All samples were stored at 4°C prior to DNA extraction. All live turtles were sampled under permits from James Cook University Animal Ethics Committee (A1501 and A1971), Department of Environment and Science (WISP06619309 and WISP13754613) and Great Barrier Reef Marine Park Authority (G12/35326.1, G10/33220.1 and G36593.1).

2.2. DNA Extraction

DNA was extracted using Promega Wizard1 SV Genomic DNA Purification System according to the manufacturer’s instructions with an additional 10 μL of proteinase K used per reaction. DNA concentration was assessed by spectrophotometric analysis (NanoDrop™ 2000 Spectrophotometer), and DNA purity was determined using OD260/280. Extracted DNA was stored in −20 °C prior to analysis. All samples containing ≥2ng/µL of DNA were used for subsequent analysis.

2.3. Primer and Probe Design

PCR primers and probes were designed and used to specifically amplify conserved regions of CmPV1 and ChHV5: the E1 gene and DNA polymerase, respectively. The green turtle Glyceraldehyde 3-phosphate dehydrogenase (GAPDH) gene was selected to quantify a single-copy host target as a proxy to host cell copy number. These targets will hereby be referred to as CmPV1-E1, ChHV5-DNApol and GAPDH. In addition, one set of primers was designed to target the E2 gene from CcPV1 from loggerhead turtles (CcPV1-E2).
Primers and/or probes for ChHV5-DNApol and GAPDH targets were designed in this study, while CmPV1-E1 target was amplified using the Cm-Pap-109 primer and probe set described in Mashkour et al. (2018) (Table 2). Primer and probe design for the remaining targets was based on sequences available from GenBank (National Center for Biotechnology Information; NCBI, Bethesda, Maryland). Accession numbers HQ878327.2 and FJ234450.1 served as the main base for the ChHV5-DNApol and GAPDH primers respectively. To increase the specificity of the assay, ChHV5-specific primers were designed based on the consensus sequences of DNA polymerase sequences isolated from green turtles only. Cc-Pap-99 primer set was designed to specifically target CcPV1-E2 gene. The E2 genes of CmPV1 (Genbank accession no. EU493091.1) and CcPV1 (GenBank accession no EU493092.1) were aligned to identify the site of highest variability. This section of the CcPV1-E2 was then used to design specific PCR primers to detect only CcPV1. All primers and probes were designed using AlleleID version 7.7 (Premier Biosoft International, Palo Alto, California) and synthesised by Macorgen Inc. (Seoul, South Korea) (Table 2).
Probe-based qPCR reactions (20 μL) were made with 10 μL of GoTaq® Probe qPCR Master Mix (Promega, Madison, WI, USA), 1.6 μL of each primer (0.8 μM), 0.2 μL of probe, ~2 μL of template DNA (~80 ng) and 4.6 μL nuclease free water. All GoTaq® Probe qPCRs were carried out using a Magnetic Induction Cycler (MIC) qPCR machine (Bio Molecular Systems). The thermocycling conditions for these assays were as follows: 2 min at 95 °C followed by 50 cycles (95 °C for 10 s, 60 °C for 10 s). All assays without a probe were run as dye-based qPCR reactions (20 μL) which were comprised of 10 μL of 5× GoTaq® qPCR Hot Start Master Mix (Promega), 1.6 μL of each primer (0.8 μM), ~2 μL of template DNA (~80 ng) and 4.8 μL nuclease free water. The PCR was carried out on a Rotor-Gene 6000 thermocycler machine. The results of these assays were visualised in real time with the thermocycling conditions provided in Table 1.
A green turtle embryo fibroblast cell line, CMEM which previously tested negative for herpesviral and papillomaviral DNA using published PCR primers (Mashkour et al., 2018), was used as the negative biological control for these assays.

2.4. Producing Standard Curves for ChHV5, CmPV1 and Green Turtle Genomic DNA

To be able to report viral copy numbers, robust standards were required from each of the viruses and the host samples. For ChHV5-DNApol and GAPDH targets, Cm-Dpol-864 and GAPDH-475 assays were used to generate amplicons for use as plasmid inserts (Table 2). At the time, the Australian CmPV1 strain was not fully sequenced and to avoid possible SNPs and missing samples, for CmPV1-E1 target the Cm-Pap-109 primers were used from Mashkour et al. [40].
After successful polymerisation, the amplicons CmPV1-E1, ChHV5-DNApol and GAPDH were cloned separately into pGEM®-T Easy Vectors (Promega, Madison, WI, USA) using the TA blue/white cloning system according to pGEM®-T Easy Vector Systems protocol. To confirm the presence of desired inserts the plasmid DNAs were sequenced along both strands using a universal M13 primer set (Macorgen Inc., Seoul, Korea).
A supercoiled circular plasmid can suppress the PCR amplification and result in an error as big as seven copies of the target gene per cell [42]. To avoid misinterpretation of viral loads the cloned plasmids were treated with restriction enzymes. To select an enzyme which only cut the pGEM®-T Easy Vector once, without digesting the target genes, the vector and the cloned sequences were analysed via Geneious v10.1 [43], subsequently SacI and PstI were chosen for treatment. The linear plasmids were eluted in DNAse free water and stored at −20 °C.

2.5. Calibration Curves and Real-Time Quantitative PCR

For the setup of a dilution series, the mass of one copy of the cloned CmPV1-E1, ChHV5-DNApol and GAPDH DNA plasmid were calculated using the mass of 1bp. The gram per mol of each amplicon was used to determine the appropriate amount needed for the initial dilution steps. The measurement was obtained using a Quantus™ Fluorometer using QuantiFluor® dsDNA Systems (both from Promega, Madison, WI, USA).
Tenfold serial dilutions were prepared in nuclease free water to produce a titration series from 108 to 101 of each plasmid in 2 μL/reaction (as the GoTaq® Probe qPCR was undertaken using 2 μL of template DNA in a 20 μL PCR). From this, calibration curves for pCmPV1-E1, pChHV5-DNApol and pGAPDH were produced. To make the standard curves, each dilution point was assayed in triplicate and the highest efficiencies were considered for the following calculations. Calibration curves for pCmPV1-E1, pChHV5-DNApol and pGAPDH were constructed by plotting cycle numbers versus the log concentrations using the MIC software (see Figure S1).

2.6. Viral and Host qPCR Reaction Conditions and Data Interpretation

Linear pCmPV1-E1, pChHV5-DNApol and pGAPDH were run independently in singleplex qPCR reactions. Samples were tested in duplicates and in each run a negative biological control (green turtle primary culture), a no template control (NTC; nuclease free water) and triplicate standards were included. The MIQE guidelines [44] were followed to avoid assay contamination by genomic or plasmid DNA. To ensure repeatability, a single person ran the qPCRs and measures of intra- and inter-assay variation were used. Care was taken to provide a wide range standard curve and cover the copy number range observed in “unknown” samples. Samples were considered positive if the emitted fluorescence of both duplicates exceeded the threshold limit of detection (LOD) and were within 0.5 Ct of each other and negative otherwise. Lower LOD was determined by carrying out qPCR on 24 replicates of low copy number per reaction for each plasmid (5, 10, 50 and 100 target copies per 2 μL). The 50% and 100% LOD were calculated for linear pCmPV1-E1, pChHV5-DNApol and pGAPDH.
The runs were considered valid if the efficiency was between 90–110%, NTC and negative control were negative and if the MIC standardised value would let import the normalised standard curve for the run. Data were analysed in the MIC software where an adaptive baseline threshold was automatically generated for each assay. PCR efficiencies were calculated using the formula: E = (10−1/slope − 1) × 100.
The viral copy number of each virus per cell was calculated according to CmPV1-E1 and/or ChHV5-DNApol copies per host cell using the following equation:
= CmPVE 1   and / or   ChHV 5 DNApol   quantity   1 2 G A P D H   q u a n t i t y
For all samples, viral load per diploid genome was determined by dividing CmPV1-E1 and ChHV5-DNApol copy numbers by half of the GAPDH copy number.

2.7. Statistical Analysis

The resulting copy numbers of group A and B were compared using unpaired t-test with a 95% confidence interval. The two-tailed p-value was also calculated. Dealing with non-parametric groups of results, the Kruskal–Wallis test by ranks was done on samples from different regions to investigate the distribution of each virus in six regions covered by this study. The rate of detection was calculated using Chi-square and Fisher’s exact test of independence and was used to compare the portion of animals, tumours, non-tumoured skin from turtles with FP tumours, and skin from non-tumoured turtles, with each virus in each region. Values with p-value < 0.05 were considered statistically significant. The statistical analyses were conducted using IBM SPSS Statistics 25. The mean copy number of ChHV5 in each sample group in the present study was also compared with results in other ChHV5 studies [25,45,46]. Unit conversions were done where appropriate.

3. Results

3.1. qPCR Validation and Optimisation

In silico evaluation of the designed primers and probes confirmed the specificity of these oligonucleotides. Initial amplified products and plasmid amplicons were sequenced and had 100% pairwise identity to the desired target genes. The known negative controls (both NTC and biological control) did not react in any assay.
The standard curves were successfully constructed and used for the qPCRs and subsequently the calculation of copy numbers per cells of each virus. The standard curves for linear pGAPDH, pCmPV1 and pChHV5 are shown in supplements (Figure S1). Absolute quantification and the standard curves for three cloned plasmids were plotted based on the cycles (Cq values) and the log of concentration (10 to 108 copies per reaction). The data points represent three replicates of each dilution. The R2 values, the efficiency of each qPCR and the equation of the standard curves are as follows: pGAPDH R2 0.950; Efficiency 0.99; Equation y = −3.35x + 40.76; pChHV5 Dpol R2 0.993; Efficiency 0.92; Equation y = −3.54x + 40.49; pCmPV1-E1 R2 0.974; Efficiency 1.05; Equation y = −3.21x + 40.48.
The qPCR sensitivity was determined by 50% certainty cut-off for LOD as described by World Organization for Animal Health [47]. In this study, 10 copies per reaction were detected in 75% of the replicates for CmPV1-E1 and ChHV5-DNApol while 50 copies per reaction were detected for GAPDH. The 100% LOD was 100 copies per reaction for all the three plasmid DNAs.

3.2. Viral DNA Detection

A total of 353 samples from 275 foraging turtles were screened in this study using probe-based qPCR. Of the turtles sampled in this study, 89 individual turtles were afflicted with FP tumours. On an individual turtle basis, the detection of CmPV1 and/or ChHV5 amplicons varied from 0 to 100% in turtles with FP tumours. If one sample from one animal reacted in the PCR, the animal was considered positive for the presence of the tested virus. Of these 89 turtles, 69 (77.3%) tested positive for ChHV5, 46 (51.7%) for CmPV1, 40 (44.9%) for both viruses and samples from 14 (15.7%) turtles tested negative for both. Only 6 (6.7%) turtles were positive for CmPV1 but not ChHV5, while 29 (32.6%) turtles were positive for ChHV5 but not CmPV1.
Viral DNA detection of both ChHV5 and CmPV1 varied between sample types. Group A had the highest rates of viral detection and within this group ChHV5 was detected in 86.3% of samples (Table 3). This is almost double the rate of detection of CmPV1 (47.3%) in that sample type. Moreover, 57 of the 62 samples in which CmPV1 was detected also reacted to the ChHV5 assay. Therefore, ChHV5 DNA was more predominant in FP tumours but was often detected alongside CmPV1. Only 9.2% of the Group A samples did not react in either assay (Table 3). Interestingly, a higher rate of detection for both viruses was observed in the Group C samples compared to Group B, despite the Group C samples being sourced from turtles without FP tumours (Table 3). Similarly, of the samples from which no viral DNA was detected Group B samples had the highest rate (Table 3).
Using the specific primer sets for loggerhead papillomavirus (Cc-Pap-99 PCR primers), CcPV1 was detected in both samples of loggerhead turtles tested, one of which was taken from tumour tissue (Group A) and the other was a Group B sample. The tumour tissues of loggerhead samples did not react in CmPV1-specific assays and the green samples did not react in CcPV1-specific assays. This provides strong support for the already defined species barrier between the CmPV1 and CcPV1 viruses.

Viral Loads of CmPV1 and ChHV5

The mean viral loads detected in each of the three sampling groups are reported in Table 4. The ChHV5 load in Group A ranged from 0 to 226.1 (mean: 15.635; SD: 30.152) copies in each cell and the CmPV1 load range was 0 to 2.54 (mean: 0.0814 (≈1 copy in 12 cells); SD: 0.357). The raw data is provided in Supplementary Tables S1–S3. With respect to ChHV5, the highest viral load was detected in the Group A samples (FP tumours). Interestingly, the mean ChHV5 load for Group C samples was slightly higher than that for Group B despite the fact that Group B samples were collected from turtles afflicted with FP. The viral load per cell of ChHV5 in Group A samples is significantly higher than Group B samples (p-value < 0.0001). The mean viral load of CmPV1 varied amongst the sample groups, with the highest load detected in Group B (Table 4). The FP tumour samples (Group A) had a lower mean load of CmPV1 than Group B, this difference is statistically significant (p-value = 0.0138). Overall, the highest mean viral load detected was ChHV5 in Group A samples (Table 4).
The mean copy number of ChHV5 in each sample group in the present study was found to be consistent with results in other ChHV5 studies (See Supplementary Table S4). No similar undertaking could be done for the CmPV1 results as there are no comparable datasets in marine turtles. However, the results are consistent with human cervical intraepithelial neoplasia (CIN) I, II, III caused by human papillomavirus (HPV) 16, 18, 33 and 58 [48,49,50].

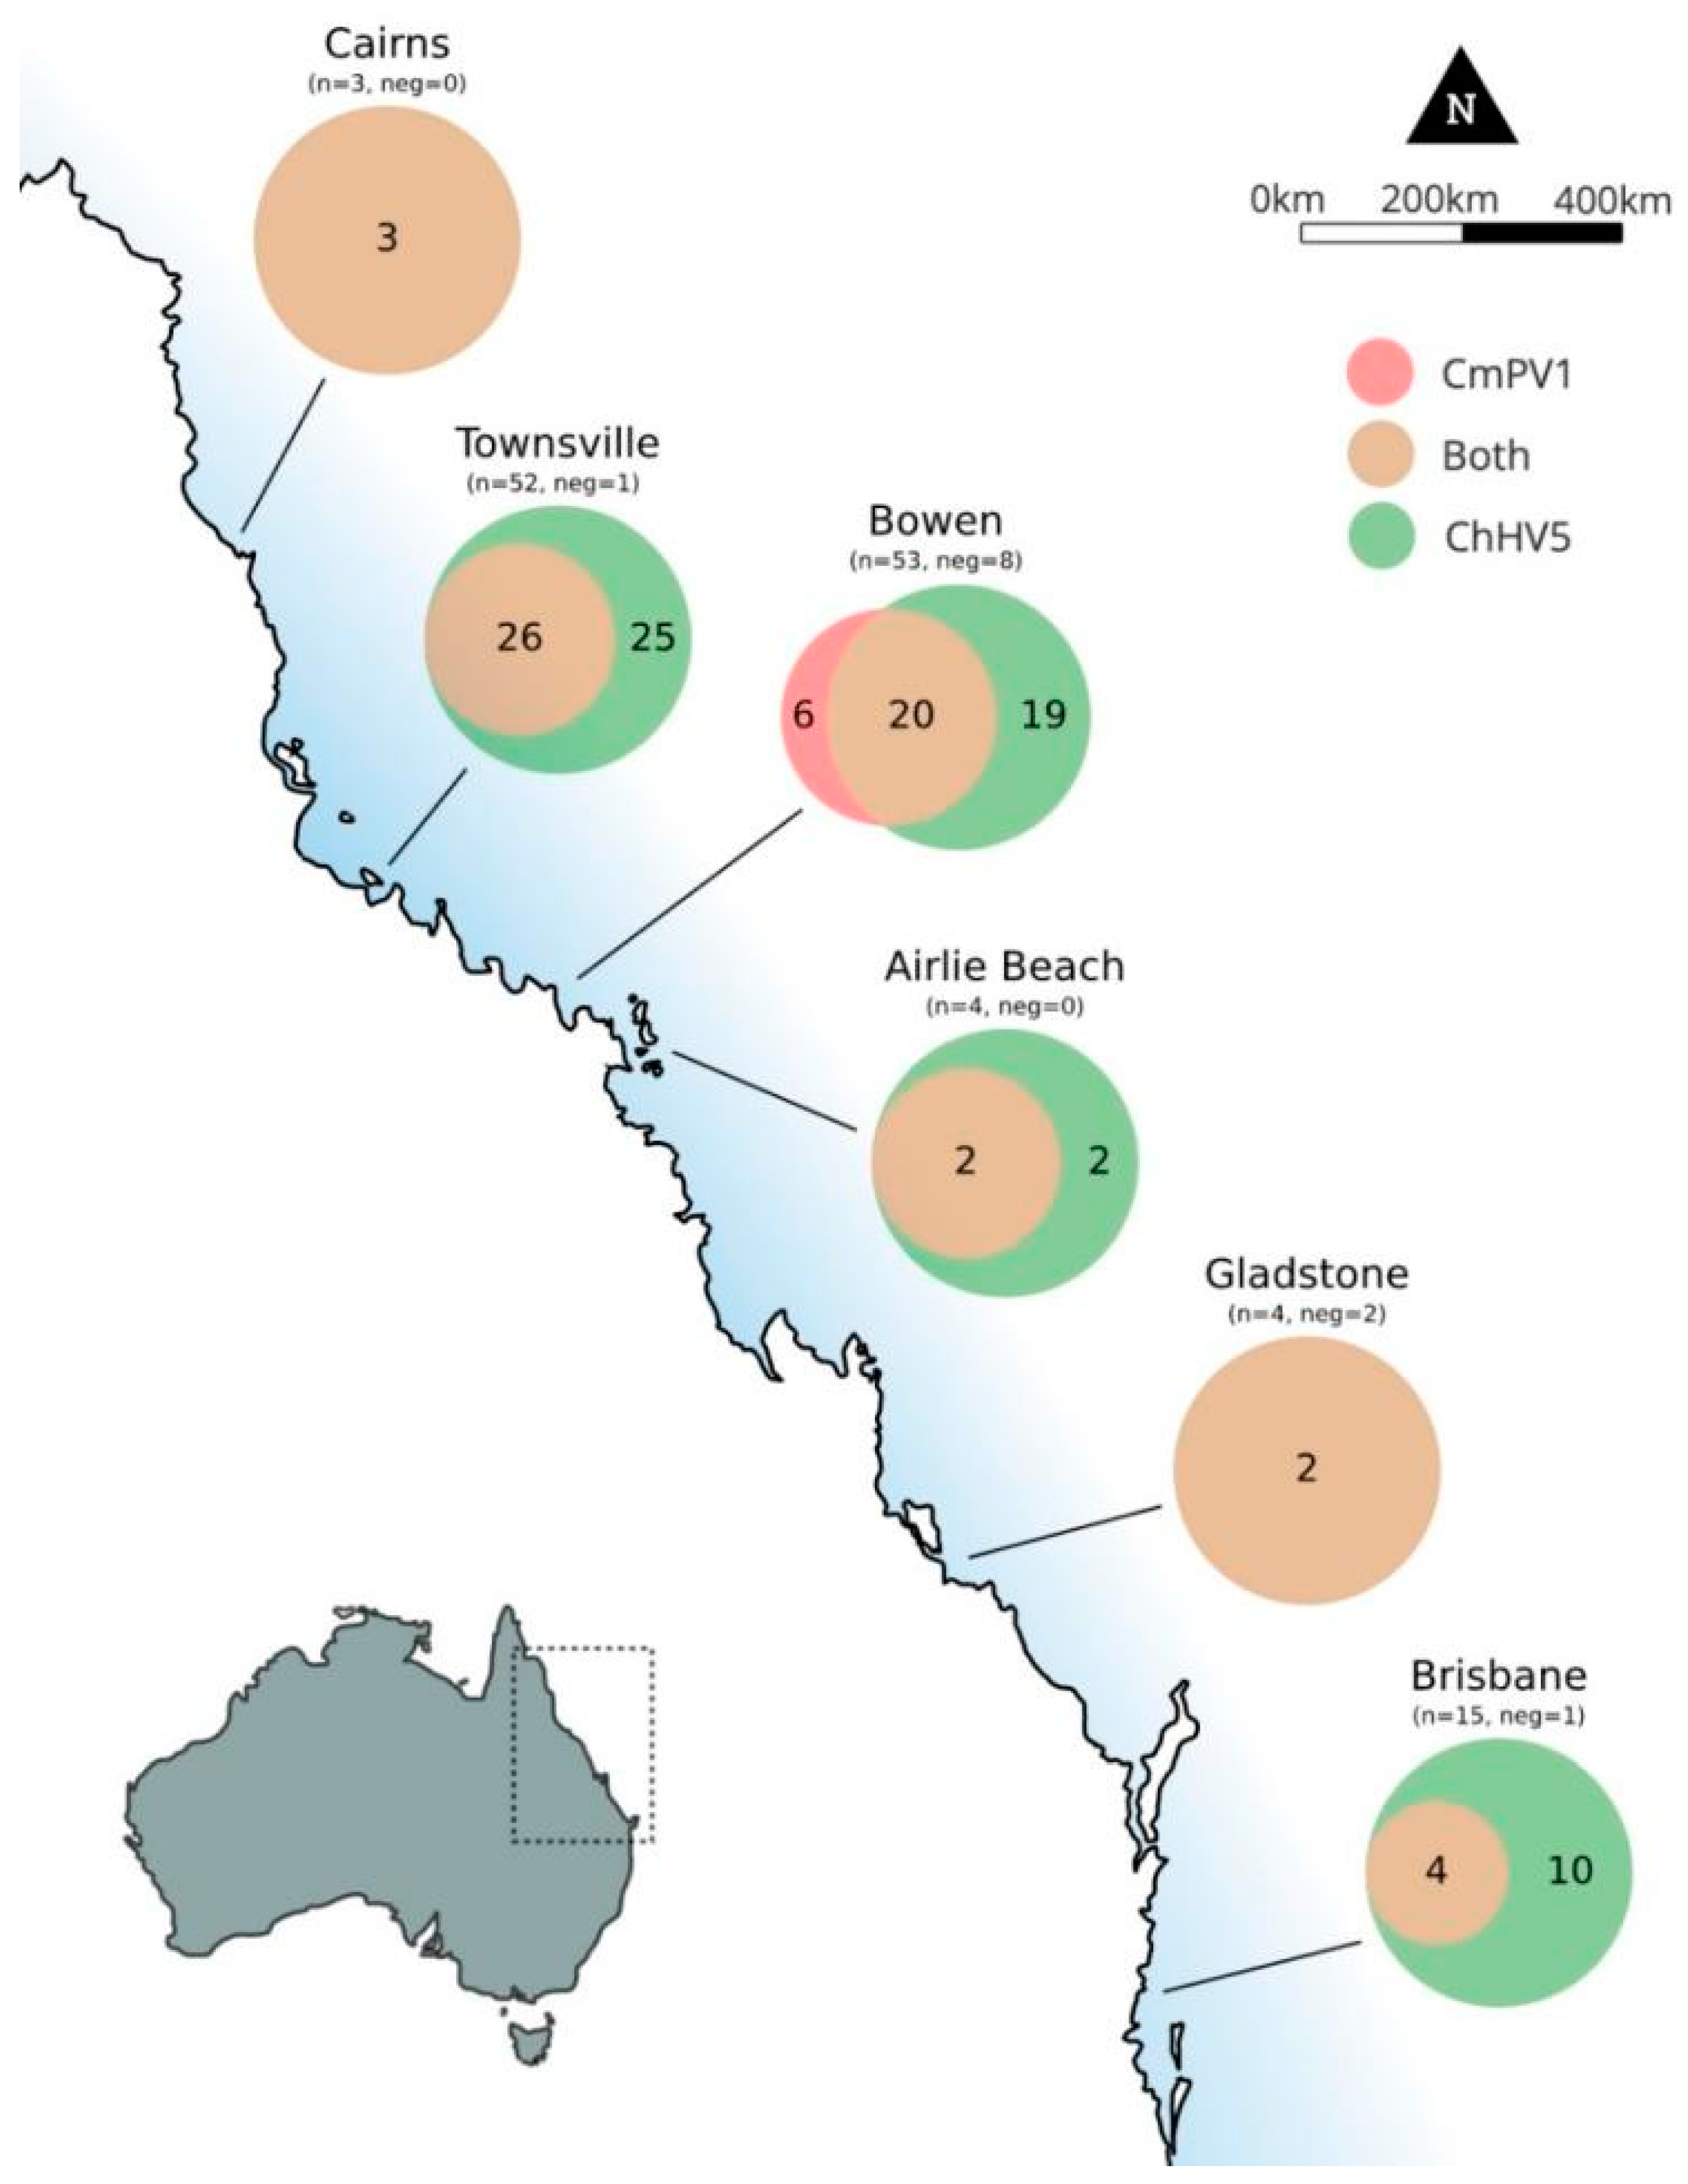
3.3. Geographic Distribution of ChHV5 and CmPV1

Viral detection varied both between the six regions in this study, and within regions but between viruses (Figure 1). In Group A samples from both Townsville, Brisbane, and Bowen, ChHV5 was detected in significantly higher rates than CmPV1 (p < 0.05) (Table 5). This is also true of Group C samples from Gladstone (p < 0.001) (Table 5). However, in Group C samples collected from Bowen, significantly higher rates of CmPV1 were detected (p < 0.001) (Table 5).

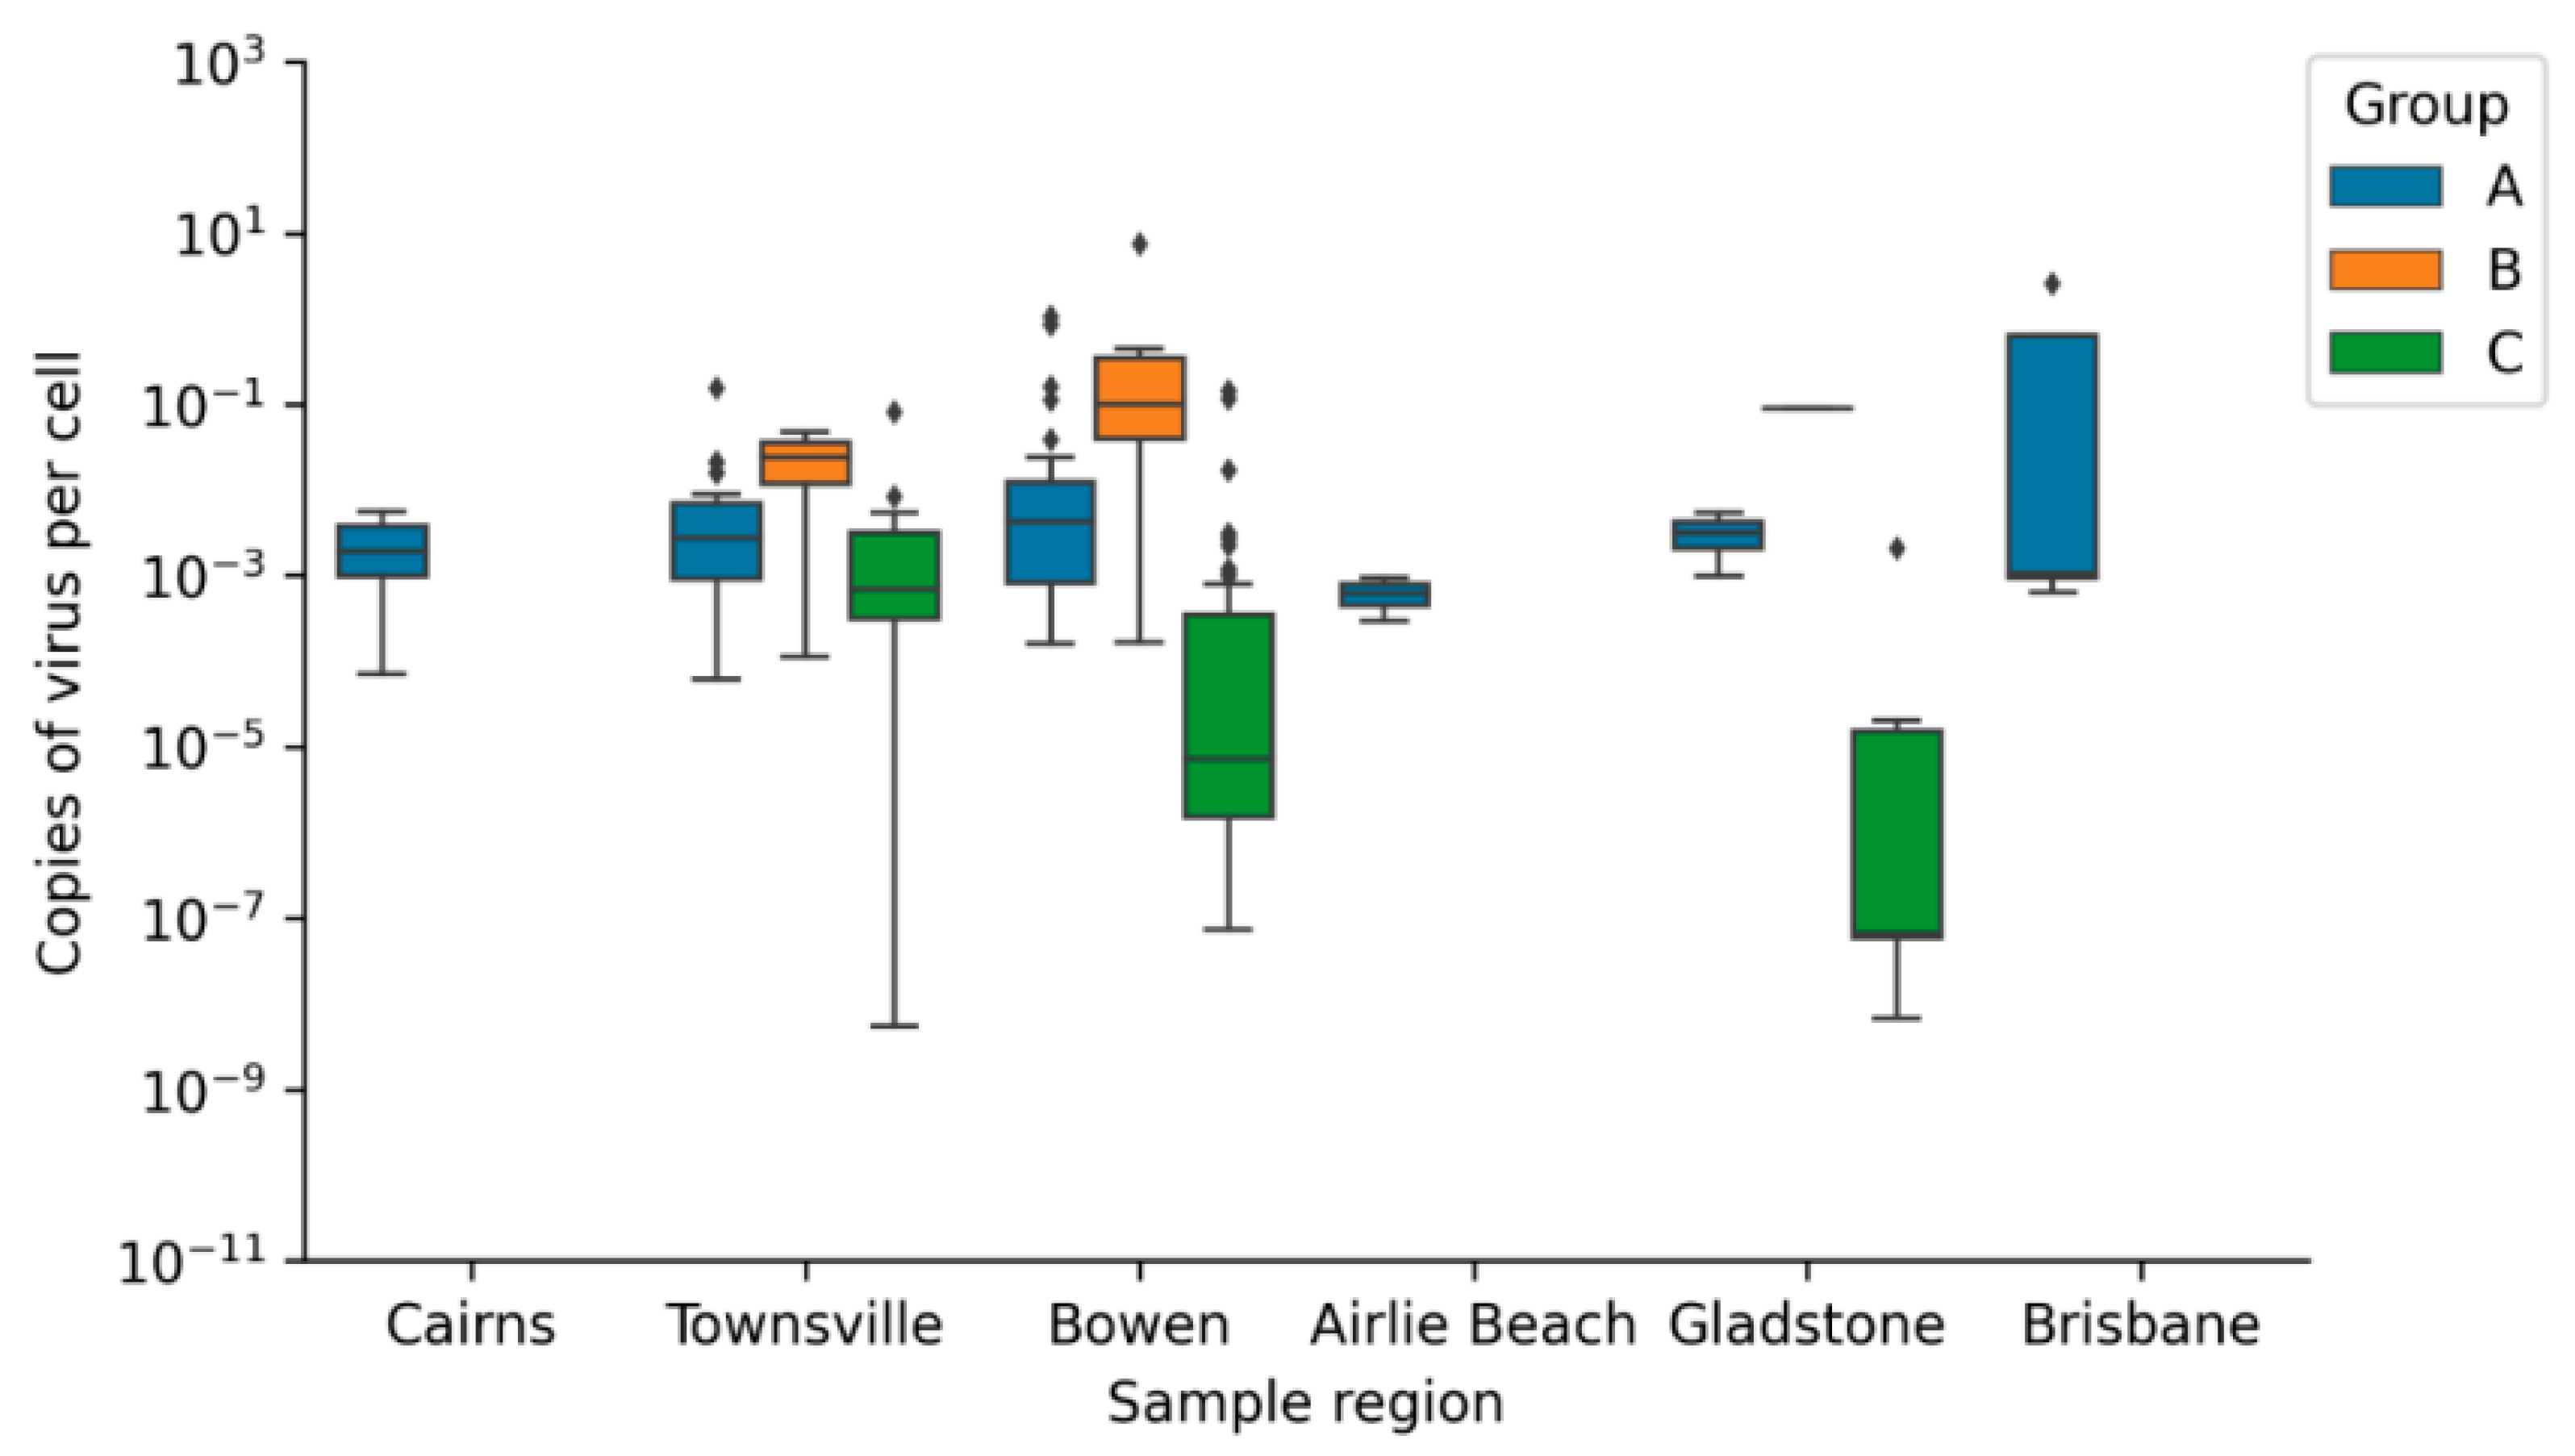
Geographic Distribution of Viral Loads

The distribution of ChHV5 viral load is comparable in Group A samples across the six regions tested, as Kruskal–Wallis test by ranks resulted in a non-significant difference between the ChHV5 viral load in tumour samples from these six regions (ChHV5GroupA p value = 0.100). Group C turtles from these regions also do not have significantly different loads of ChHV5 (ChHV5GroupC p value = 0.122). The viral load distributions in samples that contained ChHV5 DNA from six regions of Queensland can be seen in Figure 2.
The distribution of CmPV1 load is the same in the tumours sampled across the six regions tested, as Kruskal–Wallis test by ranks resulted in a non-significant difference between the CmPV1 viral load in tumour samples from these six regions (CmPV1GroupA p value = 0.317). This trend can be seen in Figure 3.

4. Discussion

Although papillomavirus was proposed as an aetiological agent of FP in the 1990s [4] and this hypothesis was supported by transmission electron microscopy evidence [17], papillomaviral DNA was not successfully detected in FP tumour tissue in studies conducted around this time [17,39]. Conversely, a body of histological and molecular evidence emerged which led to herpesviral infection to be considered the primary candidate for an aetiological agent of FP [11,12,14,15,19,20,21,22,23,24,25,26,27,28,29,30,33]. Despite the subsequent discovery and description of CmPV1 and CcPV1 [51,52], these papillomaviruses were not linked to FP lesions. However, following the initial detection of both ChHV5 and CmPV1 DNA in a small sample size of FP tumour tissue [40], the current study set out to test the wider prevalence of CmPV1 and co-occurrence with ChHV5 in marine turtles in waters adjacent to the east coast of Queensland, Australia. Three sample categories were used in this study: Group A (FP tumours), Group B (non-tumoured skin from turtles with FP tumours) and Group C (non-tumoured skin from turtles without FP tumours). Concurrent detection of ChHV5 and CmPV1 DNA is reported for all three categories which challenges previous hypotheses of ChHV5 as the leading etiological agent of FP. This study is the first to report concurrent detection of viral DNA from ChHV5 and CmPV1 in non-tumoured skin samples collected from marine turtles. This study is also the first comprehensive molecular survey of CmPV1 utilising species-specific primers, allowing for a more in-depth investigation of the results in Mashkour et al. [40]. However, the results of this study also provide further evidence toward the association between ChHV5 and FP, where higher detection rates of ChHV5, compared to CmPV1, are reported in FP tumour samples (Group A). Furthermore, regional differences in the rate of detection and viral loads in Group A samples support the hypothesis of FP tumour “hot-spots” in Queensland [53]. Collectively, these results pivot the way we think about FP; as an infectious disease where two separate viruses may be at play.

4.1. Rate of Detection

Overall, the rate of detection for ChHV5, CmPV1 and the combination of both was highest for Group A (Table 3). These results are consistent with the theory that ChHV5 is associated with FP tumours [2,11,15,19,25], and open a new line of scientific inquiry regarding the role of CmPV1 in FP tumour development. However, if a simple cause-and-effect relationship is at play, a detection rate of 100% in FP tumour samples would provide strong support of this. Although the rates of detection of these viruses were highest in FP tumour samples, these rates were still variable; ChHV5 was detected in 86.3% of FP tumour samples, while CmPV1 was detected in less than half (47.3%) of these samples. Although there is no comparable data available for CmPV1, this variable rate of ChHV5 detection is consistent with similar studies [18,24,26,29,34]. However, the detection of CmPV1 in Group A samples provides yet another small piece in the puzzle for the trigger factors involved in FP tumour development. Taken together, these results add weight to the theory that there are other factors at play in FP development [2,29,54].
This study also serves as a validation for newly developed qPCR assays for the detection of ChHV5, CcPV1 and GAPDH described herein. Of note is the improved sensitivity of the Dpol-ChHV5-82 assay in comparison to conventional PCR assays previously used in this region by Jones et al. [29] to facilitate longer amplicon length for subsequent phylogenetic analyses. Using a combination of conventional PCR assays ChHV5 DNA was detected in 62 of the 89 Group A individual turtles [29]. In the present study, ChHV5 DNA was detected in 69 Group A turtles using a single qPCR assay (Dpol-ChHV5-82), which emphasises the need to match the assay selection with end-point goals. Consistent with the known advantages of qPCR [23,40,55], our results show that qPCR assays are suitable in studies which aim to determine presence or absence of viral DNA, due to the enhanced sensitivity of these assays over conventional PCR. Moreover, the benefits of qPCR assays can extend beyond simple presence/absence tests into viral load assessment for positive samples.

4.2. Mean Viral Load

Here, we reported viral loads for both ChHV5 and CmPV1 across three sample types (Groups A, B and C). The highest mean load of ChHV5 was found in Group A samples, adding to the body of evidence that this virus is closely associated with FP tumours. The highest mean load of CmPV1 was detected in Group B samples, but the significance of this result is unclear. The small sample size comprising this Group (n = 36), in contrast to Group A and C (n = 131 and 186 respectively), limit the conclusions that can be drawn about this result. Further analysis on a larger set of samples of this type (non-tumoured skin from turtles with FP tumours) would undoubtedly add resolution to this result. Other than the case of ChHV5 in Group A samples, the mean viral load in all other sample types for both viruses was less than one copy per cell indicating a low level infection in these samples.
While the mean ChHV5 load results obtained in this study were consistent with other reports [23,25,45,46], such comparisons could not be made for CmPV1 as there are no other comparable datasets in marine turtles. However, the CmPV1 viral loads are in the same range reported for human cervical malignancies caused by HPV 16, 18, 33 and 58 where the mean HPV copies per 10,000 cells were reported to be ~log3–5 in CIN I, II and III [48,49,50].
This study assessed both the rate of detection and viral load of ChHV5 and CmPV1 and, in some cases, there was disparity between the rate of detection and viral load. For example, CmPV1 was detected in 100% of Group A samples from Cairns yet the viral load was relatively low (0.002 ± 0.002 copies per cell). This phenomenon may be a feature of the varied storage times prior to extraction and qPCR; while all samples were stored at the same temperatures some were stored for 10 years prior to analysis, while others were stored for less than one. It is possible that this led to DNA degradation, with subsequent impacts on viral load detection. However, these results are in comparison to a ChHV5 load of 39.300 ± 56.788 copies per cell in the same samples with the same rate of detection. Such marked variation in viral load in the same sample (subject to the same storage time) adds to the complexity of the picture, rather than a presence/absence result.
Researchers have detected and quantified ChHV5 through molecular surveys and serological analyses in tumoured and non-tumoured marine turtles [23,25,32,45,46,56,57]. Whole genome sequencing and transcriptome approaches have also been employed in recent years to better understand the association between ChHV5 and FP [58,59,60]. However, additional molecular and serological surveys specifically targeting both ChHV5 and CmPV1 from other regions and species of marine turtles would be highly beneficial to understanding the role of CmPV1 in FP, and in marine turtle health as a whole.

4.3. Concurrent Detection

Concurrent infections of herpesvirus and papillomavirus have been described extensively in humans (see [61]) and in Atlantic bottlenose dolphins [62]. Our study reports the concurrent presence of herpesviral and papillomaviral DNA in both tumoured and non-tumoured marine turtles. The presence of these viruses in non-tumoured skin of turtles with FP tumours (Group B) and those free of clinical disease (Group C) are consistent with previous studies on these viruses [23,46,63] and are in line with the ubiquity and commensal nature of both viruses [46,64]. These results lend further weight to the hypothesis that FP manifestation relies on more than just exposure to viral infection alone [2].
Due to the nature of these two viruses, there is a possibility that either ChHV5 or CmPV1, or indeed both may be opportunistic pathogens in FP, rather than aetiological agents. As Koch’s postulates have yet to be fulfilled for either virus, this possibility needs to be considered when interpreting the results of this study. Future studies, considering ChHV5 and/or CmPV1, or even other emerging viruses, may aid in elucidating the answer to this question.

4.4. Geographic Locations

Differences in both viral load and rate of detection of both ChHV5 and CmPV1 were found across the six study sites. The highest mean viral load was detected in Cairns. This group was comprised of three samples from two turtles which were both afflicted by FP tumours. Higher rates of detection and viral loads are reported in Group A samples from Townsville, Bowen and Brisbane. These results are consistent with previous suggestions that these regions are FP “hot-spots” in Queensland [53]. However, when examining the data beyond mean loads, it is clear that higher loads of ChHV5 were detected in Group A samples at each study site. This suggests that while there may indeed be FP tumour hot-spots in Queensland, this relationship is not directly linked with viral load. Bowen is of particular interest, being the only study site where some Group A samples contained CmPV1 exclusively. In all other study sites, when CmPV1 was detected from Group A samples it was in conjunction with ChHV5. Moreover, Group C samples from Bowen had a higher rate of CmPV1 detection compared to ChHV5 (p-value < 0.001) indicating a high prevalence of papillomavirus in clinically healthy turtles in this region, which would make it an excellent study site for more in-depth investigations on CmPV1.
Although the migratory nature of marine turtles should be considered when interpreting these results, only fine-scale movements have been observed between foraging grounds in Queensland [65]. This high site fidelity adds increased confidence in the locational trends reported here. However, it is possible that moribund turtles alter their foraging and site-selection behaviours during illness. Long-term monitoring programs which document and sample FP cases would provide a robust means to ensure that capture location is accurately reflecting a well-defined foraging ground.

4.5. Limitations

In a field that relies on opportunistic sampling of free ranging marine wildlife, it was a major effort to collect samples (n = 353) from a total of 275 individual turtles, especially those with FP. Although more samples distributed evenly between sample groups and study sites may have provided more confidence in the conclusions that can be drawn regarding these categories, such sample sets are not always realistic in wildlife disease investigations [29]. Therefore, in the interest of elucidating the potential role of papillomavirus in FP as identified by Mashkour et al. [40], we have reported the findings for all sites and sample types. Testing the tissue samples from rehabilitation facilities or existing biobanks can be an alternative to assessing free range turtles and is therefore suggested to test for CmPV1 presence in FP tumours from numerous global locations.
Tumour severity scores, tumour size and anatomical location are not available for most samples utilised in this study. This precluded further analysis concerning these factors. We are therefore unable to ascertain whether there are any correlations between viral load and tumour size, location or severity of FP affliction. Future studies should consider these factors in order to provide deeper insight to the trends reported here.
Assay sensitivity and specificity is always a consideration and as tests are constantly evolving, future development may include more sensitive methods and targets such as viral mRNA as an indicator of viral expression. However, ChHV5 mRNA has been observed to be less abundant than DNA, with most viral genes not being highly expressed in FP [58,59,66]. Moreover, no viruses, including ChHV5 and CmPV1, were found to be differentially expressed in FP tumours when de novo transcriptome assembly was employed [66]. While these results indicate that future viral expression studies on FP tumours could encounter challenges in establishing differential expression, rapid advancements in molecular biology may aid in overcoming these challenges. As such, existing FP RNA-seq datasets should still be specifically queried for CmPV1 expression and further studies on viral expression should be encouraged. In the present study, we reported low viral copy numbers demanding sensitive assays. To overcome assay sensitivity targeted sequencing, droplet digital PCR, and low input template DNA qPCR-based approaches such as amplification ratio-based detection can be implemented. The latter was used in marine turtle population genetics and FP related eDNA analysis [59,67].

4.6. Future Perspective

Despite the noted limitations, the results reported in the present study show some clear and reliable trends which we hope will be further explored on a global scale. Our understanding of FP, and marine turtle virology as a whole, has many knowledge gaps [1] which need to be addressed in order to develop comprehensive management plans for these endangered species. The results from this and other studies have revealed that viral DNA is present in animals that do not show clinical signs [18,56,58], which questions their role in tumour development and highlights the need for further understanding of co-factors (environmental triggers, host genetics and immune responses) in disease development and why some turtles do not develop tumours despite the presence of viral DNA. Diseases in terrestrial animals are often tracked by serological methods, and such tests could be more widely implemented to determine whether turtles have mounted an immune response to ChHV5, CmPV1 and/or CcPV1 which would negate the need to rely on clinical signs alone for exposure status of an animal [9]. Recently, Page-Karjian et al. screened blood samples from a large group of free ranging and rehabilitated green and loggerhead turtles. All samples were analysed for ChHV5 DNA using qPCR, and turtles in rehabilitation for antibodies to ChHV5 peptides using an enzyme-linked immunosorbent assay (ELISA). A higher proportion of loggerheads were found to be ChHV5-positive using ELISA, suggesting the hypothesis that they may be more able to mount an immune response against the virus when compared to green turtles [56]. We were unable to collect corresponding blood samples from FP-afflicted turtles in this study, precluding such analyses. Our understanding of FP would be greatly improved if such studies were employed across a range of species and regions.
In terms of CmPV1 in FP tumours, the presence, infectivity and tumorigenesis should be assessed by advanced virological methods such as transmission electron microscopy, serology, histopathology, cell culture and molecular analyses. To study the virus itself, molecular analyses can be further applied to map any evolutionary variations in each region.

4.7. Conclusions

The results of the present study provide valuable insight into some of these gaps and with improved detection of papillomavirus in FP tumour tissue, it also challenges long held perceptions of the role of herpesvirus as the sole infectious agent associated with FP tumours. This study serves as an open door to broaden our horizon when surveying FP- afflicted turtles.

Supplementary Materials

The following are available online at https://www.mdpi.com/2076-2615/11/3/697/s1, Figure S1: Absolute quantification and the standard curves for three cloned plasmids, Table S1: The origin of FP tumour samples (Group A) used in this study, Table S2: The origin of samples of non-tumoured skin from turtles with FP tumours (Group B samples) used in this study, Table S3: The origin of samples of non-tumoured skin from turtles without FP tumours (Group C samples) used in this study. Table S4: The average copy number of ChHV5 in various units calculated in different studies in comparison to the current study.

Author Contributions

Conceptualization, N.M., K.J. and E.A.; methodology, N.M., K.J., W.W., G.B. and E.A.; software, N.M., K.J., W.W. and G.B.; validation, N.M., K.J. and G.B.; formal analysis, N.M. and W.W.; in-vestigation, N.M. and K.J.; resources, N.M., K.J., G.B. and E.A.; data curation, N.M. and K.J.; writing—original draft preparation, N.M., K.J., E.A.; writing—review and editing, N.M., K.J., W.W., G.B. and E.A.; visualization, N.M., K.J., W.W. and E.A.; supervision, G.B. and E.A.; project administration, N.M., K.J. and E.A.; funding acquisition, N.M., G.B., E.A. All authors have read and agreed to the published version of the manuscript.

Funding

This work was supported in part by funds from the World Wide Fund for Nature (WWF).

Institutional Review Board Statement

All live turtles were sampled under permits from James Cook University Animal Ethics Committee (A1501 and A1971), Department of Environment and Science (WISP06619309 and WISP13754613) and Great Barrier Reef Marine Park Authority (G12/35326.1, G10/33220.1 and G36593.1).

Data Availability Statement

All data presented in this study are available herein.

Acknowledgments

The authors gratefully acknowledge Johanna Leonhardt and Ian Bell for their efforts in sample collection of the Group C Gladstone samples.

Conflicts of Interest

The authors declare no conflict of interest.

References

  1. Mashkour, N.; Jones, K.; Kophamel, S.; Hipolito, T.; Ahasan, S.; Walker, G.; Jakob-Hoff, R.; Whittaker, M.; Hamann, M.; Bell, I.; et al. Disease risk analysis in sea turtles: A baseline study to inform conservation efforts. PLoS ONE 2020, 15, e0230760. [Google Scholar] [CrossRef]
  2. Jones, K.M.; Ariel, E.; Burgess, G.; Read, M. A review of fibropapillomatosis in Green turtles (Chelonia mydas). Vet. J. 2016, 212, 48–57. [Google Scholar] [CrossRef]
  3. Work, T.M.; Work, T.M.; Balazs, G.H.; Rameyer, R.A.; Morris, R.A. Retrospective pathology survey of green turtles Chelonia mydas with fibropapillomatosis in the Hawaiian Islands, 1993-2003. Dis. Aquat. Org. 2004, 62, 163–176. [Google Scholar] [CrossRef] [Green Version]
  4. Herbst, L.H. Fibropapillomatosis of marine turtles. Annu. Rev. Fish Dis. 1994, 4, 389–425. [Google Scholar] [CrossRef]
  5. Norton, T.M.; Jacobson, E.R.; Sundberg, J.P. Cutaneous Fibropapillomas and Renal Myxofibroma in a Green Turtle, Chelonia mydas. J. Wildl. Dis. 1990, 26, 265–270. [Google Scholar] [CrossRef] [Green Version]
  6. Kang, K.; Torres-Velez, F.; Zhang, J.; Moore, P.; Moore, D.; Rivera, S.; Brown, C. Localization of Fibropapilloma-associated Turtle Herpesvirus in Green Turtles (Chelonia mydas) by In-Situ Hybridization. J. Comp. Pathol. 2008, 139, 218–225. [Google Scholar] [CrossRef] [PubMed]
  7. Flint, M.; Limpus, C.; Patterson-Kane, J.; Murray, P.; Mills, P. Corneal Fibropapillomatosis in Green Sea Turtles (Chelonia mydas) in Australia. J. Comp. Pathol. 2010, 142, 341–346. [Google Scholar] [CrossRef] [PubMed]
  8. Aguirre, A.A.; Balazs, G.H.; Spraker, T.R.; Gross, T.S. Adrenal and Hematological Responses to Stress in Juvenile Green Turtles (Chelonia mydas) with and without Fibropapillomas. Physiol. Zool. 1995, 68, 831–854. [Google Scholar] [CrossRef]
  9. Work, T.M.; Rameyer, R.A.; Balazs, G.H.; Cray, C.; Chang, S.P. Immune Status of Free-Ranging Green Turtles with Fibropapillomatosis from Hawaii. J. Wildl. Dis. 2001, 37, 574–581. [Google Scholar] [CrossRef] [PubMed] [Green Version]
  10. Work, T.M.; Dagenais, J.; Weatherby, T.M.; Balazs, G.H.; Ackermann, M. In Vitro Replication of Chelonid Herpesvirus 5 in Organotypic Skin Cultures from Hawaiian Green Turtles (Chelonia mydas). J. Virol. 2017, 91, e00404-17. [Google Scholar] [CrossRef] [Green Version]
  11. Herbst, L.H. The Etiology and Pathogenesis of Green Turtle Fibropapillomatosis. Ph.D. Thesis, University of Florida, Gainesville, FL, USA, 1995. [Google Scholar]
  12. Jacobson, E.; Mansell, J.; Sundberg, J.; Hajjar, L.; Reichmann, M.; Ehrhart, L.; Walsh, M.; Murru, F. Cutaneous fibropapillomas of green turtles (Chelonia mydas). J. Comp. Pathol. 1989, 101, 39–52. [Google Scholar] [CrossRef]
  13. Casey, R.; Quackenbush, S.; Work, T.; Balazs, G.; Bowser, P.; Casey, J. Evidence for retrovirus infections in green turtles Chelonia mydas from the Hawaiian islands. Dis. Aquat. Org. 1997, 31, 1–7. [Google Scholar] [CrossRef]
  14. Jacobson, E.; Buergelt, C.; Williams, B.; Harris, R. Herpesvirus in cutaneous fibropapillomas of the green turtle Chelonia mydas. Dis. Aquat. Org. 1991, 12, 1–6. [Google Scholar] [CrossRef]
  15. Quackenbush, S.L.; Work, T.M.; Balazs, G.H.; Casey, R.N.; Rovnaka, J.; Chavesd, A.; du Toit, L.; Baines, J.D.; Parrish, C.R.; Bowser, P.R.; et al. Three Closely Related Herpesviruses Are Associated with Fibropapillomatosis in Marine Turtles. Virology 1998, 246, 392–399. [Google Scholar] [CrossRef] [Green Version]
  16. Herbst, L.; Ene, A.; Su, M.; DeSalle, R.; Lenz, J. Tumor outbreaks in marine turtles are not due to recent herpesvirus mutations. Curr. Biol. 2004, 14, R697–R699. [Google Scholar] [CrossRef] [PubMed] [Green Version]
  17. Lu, Y.; Aguirre, A.A.; Work, T.M.; Balazs, G.H.; Nerurkar, V.R.; Yanagihara, R. Identification of a small, naked virus in tumor-like aggregates in cell lines derived from a green turtle, Chelonia mydas, with fibropapillomas. J. Virol. Methods 2000, 86, 25–33. [Google Scholar] [CrossRef]
  18. Alfaro-Núñez, A.; Bertelsen, M.F.; Bojesen, A.M.; Rasmussen, I.; Zepeda-Mendoza, L.; Olsen, M.T.; Gilbert, M.T.P. Global distribution of Chelonid fibropapilloma-associated herpesvirus among clinically healthy sea turtles. BMC Evol. Biol. 2014, 14, 206. [Google Scholar] [CrossRef]
  19. Lackovich, J.K.; Brown, D.R.; Homer, B.L.; Garber, R.L.; Mader, D.R.; Moretti, R.H.; Patterson, A.D.; Herbst, L.H.; Orós, J.; Jacobson, E.R.; et al. Association of herpesvirus with fibropapillomatosis of the green turtle Chelonia mydas and the loggerhead turtle Caretta caretta in Florida. Dis. Aquat. Org. 1999, 37, 89–97. [Google Scholar] [CrossRef]
  20. Lu, Y.; Wang, Y.; Aguirre, A.; Zhao, Z.; Liu, C.; Nerurkar, V.; Yanagihara, R. RT-PCR detection of the expression of the polymerase gene of a novel reptilian herpesvirus in tumor tissues of green turtles with fibropapilloma. Arch. Virol. 2003, 148, 1155–1163. [Google Scholar] [CrossRef]
  21. Nigro, O.; Aguirre, A.A.; Lu, Y. Nucleotide sequence of an ICP18. 5 assembly protein (UL28) gene of green turtle herpesvirus pathogenically associated with green turtle fibropapilloma. J. Virol. Methods 2004, 120, 107–112. [Google Scholar] [CrossRef]
  22. Nigro, O.; Yu, G.; Aguirre, A.A.; Lu, Y. Sequencing and characterization of the full-length gene encoding the single-stranded DNA binding protein of a novel Chelonian herpesvirus. Arch. Virol. 2004, 149, 337–347. [Google Scholar] [CrossRef]
  23. Page-Karjian, A.; Norton, T.M.; Ritchie, B.; Brown, C.; Mancia, C.; Jackwood, M.; Gottdenker, N.L. Quantifying chelonid herpesvirus 5 in symptomatic and asymptomatic rehabilitating green sea turtles. Endanger. Species Res. 2015, 28, 135–146. [Google Scholar] [CrossRef] [Green Version]
  24. Page-Karjian, A.; Torres, F.; Zhang, J.; Rivera, S.; Diez, C.; Moore, P.A.; Moore, D.; Brown, C. Presence of chelonid fibropapilloma-associated herpesvirus in tumored and non-tumored green turtles, as detected by polymerase chain reaction, in endemic and non-endemic aggregations, Puerto Rico. SpringerPlus 2012, 1, 1–8. [Google Scholar] [CrossRef] [PubMed] [Green Version]
  25. Quackenbush, S.L.; Aguirre, A.A.; Spraker, T.R.; Horrocks, J.A.; Vermeer, L.A.; Balazs, G.H.; Casey, J.W.; Casey, R.N.; Murcek, R.J.; Paul, T.A.; et al. Quantitative analysis of herpesvirus sequences from normal tissue and fibropapillomas of marine turtles with real-time PCR. Virology 2001, 287, 105–111. [Google Scholar] [CrossRef] [Green Version]
  26. Rodenbusch, C.R.; Baptistotte, C.; Werneck, M.R.; Pires, T.T.; Melo, M.T.D.; De Ataíde, M.W.; Dos Reis, K.; Testa, P.; Alieve, M.M.; Canal, C.W. Fibropapillomatosis in green turtles Chelonia mydas in Brazil: Characteristics of tumors and virus. Dis. Aquat. Org. 2014, 111, 207–217. [Google Scholar] [CrossRef] [PubMed] [Green Version]
  27. Yu, Q.; Hu, N.; Lu, Y.; Nerurkar, V.R.; Yanagihara, R. Rapid acquisition of entire DNA polymerase gene of a novel herpesvirus from green turtle fibropapilloma by a genomic walking technique. J. Virol. Methods 2001, 91, 183–195. [Google Scholar] [CrossRef]
  28. Yu, Q.; Lu, Y.; Nerurkar, V.R.; Yanagihara, R. Amplification and analysis of DNA flanking known sequences of a novel herpesvirus from green turtles with fibropapilloma. Arch. Virol. 2000, 145, 2669–2676. [Google Scholar] [CrossRef]
  29. Jones, K.; Burgess, G.; Budd, A.M.; Huerlimann, R.; Mashkour, N.; Ariel, E. Molecular evidence for horizontal transmission of chelonid alphaherpesvirus 5 at green turtle (Chelonia mydas) foraging grounds in Queensland, Australia. PLoS ONE 2020, 15, e0227268. [Google Scholar] [CrossRef] [PubMed]
  30. Lu, Y.; Wang, Y.; Yu, Q.; Aguirre, A.A.; Balazs, G.H.; Nerurkar, V.R.; Yanagihara, R. Detection of herpesviral sequences in tissues of green turtles with fibropapilloma by polymerase chain reaction. Arch. Virol. 2000, 145, 1885–1893. [Google Scholar] [CrossRef] [PubMed]
  31. McGeoch, D.J.; Gatherer, D. Integrating Reptilian Herpesviruses into the Family Herpesviridae. J. Virol. 2005, 79, 725–731. [Google Scholar] [CrossRef] [PubMed] [Green Version]
  32. Page-Karjian, A.; Gottdenker, N.L.; Whitfield, J.; Herbst, L.; Norton, T.M.; Ritchie, B. Potential Noncutaneous Sites of Chelonid Herpesvirus 5 Persistence and Shedding in Green Sea Turtles Chelonia mydas. J. Aquat. Anim. Health 2017, 29, 136–142. [Google Scholar] [CrossRef] [PubMed]
  33. Alfaro-Núñez, A.; Gilbert, M.T.P. Validation of a sensitive PCR assay for the detection of Chelonid fibropapilloma-associated herpesvirus in latent turtle infections. J. Virol. Methods 2014, 206, 38–41. [Google Scholar] [CrossRef]
  34. Ariel, E.; Nainu, F.; Jones, K.; Juntunen, K.; Bell, I.; Gaston, J.; Scott, J.; Trocini, S.; Burgess, G. Phylogenetic variation of chelonid alphaherpesvirus 5 in green turtle (Chelonia mydas) populations along the Queensland Coast, Australia. J. Aquat. Anim. Health 2017. [Google Scholar] [CrossRef]
  35. Lawrance, M.F.; Mansfield, K.L.; Sutton, E.; Savage, A.E. Molecular evolution of fibropapilloma-associated herpesviruses infecting juvenile green and loggerhead sea turtles. Virology 2018, 521, 190–197. [Google Scholar] [CrossRef]
  36. Ugochukwu, I.C.I.; Aneke, C.I.; Idoko, I.S.; Sani, N.A.; Amoche, A.J.; Mshiela, W.P.; Ede, R.E.; Ibrahim, N.D.G.; Njoku, C.I.O.; Sackey, A.K.B. Bovine papilloma: Aetiology, pathology, immunology, disease status, diagnosis, control, prevention and treatment: A review. Comp. Haematol. Int. 2019, 28, 737–745. [Google Scholar] [CrossRef]
  37. Garcês, A.; Pires, I.; Savini, F.; Scagliarini, A.; Gallina, L. Cutaneous Fibropapilloma in a Red Deer (Cervus elaphus) Associated with Cervus elaphus Papillomavirus in Portugal. J. Wildl. Dis. 2020, 56, 636. [Google Scholar] [CrossRef]
  38. Munday, J.S.; Cullum, A.A.; Thomson, N.A.; Bestbier, M.; McCormack, T.; Julian, A.F. Anal fibropapillomas containing bovine papillomavirus type 2 DNA in two groups of heifers. N. Z. Vet. J. 2018, 66, 267–271. [Google Scholar] [CrossRef]
  39. Brown, D.R.; Lackovich, J.K.; Klein, P.A. Further evidence for the absence of papillomaviruses from sea turtle fibropapillomas. Vet. Rec. 1999, 145, 616–617. [Google Scholar] [CrossRef]
  40. Mashkour, N.; MacLaine, A.; Burgess, G.W.; Ariel, E. Discovery of an Australian Chelonia mydas papillomavirus via green turtle primary cell culture and qPCR. J. Virol. Methods 2018, 258, 13–23. [Google Scholar] [CrossRef]
  41. Limpus, C.J.; Reed, P.C. The green turtle, Chelonia mydas, in Queensland: Population structure in a coral reef feeding area. In Biology of Australian Frogs and Reptiles; Grigg, G., Shine, R., Ehmann, H., Eds.; Surrey Beatty and Sons: Sydney, Australia, 1985; pp. 47–52. [Google Scholar]
  42. Hou, Y.; Zhang, H.; Miranda, L.; Lin, S. Serious Overestimation in Quantitative PCR by Circular (Supercoiled) Plasmid Standard: Microalgal pcna as the Model Gene. PLoS ONE 2010, 5, e9545. [Google Scholar] [CrossRef] [Green Version]
  43. Kearse, M.; Moir, R.; Wilson, A.; Stones-Havas, S.; Cheung, M.; Sturrock, S.; Buxton, S.; Cooper, A.; Markowitz, S.; Duran, C.; et al. Geneious Basic: An integrated and extendable desktop software platform for the organization and analysis of sequence data. Bioinformatics 2012, 28, 1647–1649. [Google Scholar] [CrossRef]
  44. Bustin, S.A.; Benes, V.; Garson, J.A.; Hellemans, J.; Huggett, J.; Kubista, M.; Mueller, R.; Nolan, T.; Pfaffl, M.W.; Shipley, G.L.; et al. The MIQE Guidelines: Minimum Information for Publication of Quantitative Real-Time PCR Experiments. Clin. Chem. 2009, 55, 611–622. [Google Scholar] [CrossRef] [Green Version]
  45. Greenblatt, R.J.; Work, T.M.; Dutton, P.; Sutton, C.A.; Spraker, T.R.; Casey, R.N.; Diez, C.E.; Parker, D.; Leger, J.S.; Balazs, G.H.; et al. Geographic Variation in Marine Turtle Fibropapillomatosis. J. Zoo Wildl. Med. 2005, 36, 527–530. [Google Scholar] [CrossRef]
  46. Alfaro-Núñez, A.; Bojesen, A.M.; Bertelsen, M.F.; Wales, N.; Balazs, G.H.; Gilbert, M.T.P. Further evidence of Chelonid herpesvirus 5 (ChHV5) latency: High levels of ChHV5 DNA detected in clinically healthy marine turtles. PeerJ 2016, 4, e2274. [Google Scholar] [CrossRef] [Green Version]
  47. Díaz, F. OIE Standard on principles and methods of validation of diagnostic assays for infectious diseases. In Proceedings of the OIE Regional Workshop for OIE National Focal Points for Veterinary Products, Tokyo, Japan, 3–5 December 2014. [Google Scholar]
  48. Sun, Z.; Zhang, R.; Liu, Z.; Liu, C.; Li, X.; Zhou, W.; Yang, L.; Ruan, Q.; Zhang, X. Development of a fluorescence–based multiplex genotyping method for simultaneous determination of human papillomavirus infections and viral loads. BMC Cancer 2015, 15, 860. [Google Scholar] [CrossRef]
  49. Oyervides-Muñoz, M.A.; Pérez-Maya, A.A.; Sánchez-Domínguez, C.N.; Berlanga-Garza, A.; Antonio-Macedo, M.; Valdéz-Chapa, L.D.; Cerda-Flores, R.M.; Trevino, V.; Barrera-Saldaña, H.A.; Garza-Rodríguez, M.L. Multiple HPV Infections and Viral Load Association in Persistent Cervical Lesions in Mexican Women. Viruses 2020, 12, 380. [Google Scholar] [CrossRef] [Green Version]
  50. Duan, L.; Du, H.; Wang, C.; Huang, X.; Qu, X.; Shi, B.; Liu, Y.; Zhang, W.; Duan, X.; Wei, L.; et al. The application of BMRT-HPV viral load to secondary screening strategies for cervical cancer. PLoS ONE 2020, 15, e0232117. [Google Scholar] [CrossRef]
  51. Manire, C.A.; Stacy, B.A.; Kinsel, M.J.; Daniel, H.T.; Anderson, E.T.; Wellehan, J.F. Proliferative dermatitis in a loggerhead turtle, Caretta caretta, and a green turtle, Chelonia mydas, associated with novel papillomaviruses. Vet. Microbiol. 2008, 130, 227–237. [Google Scholar] [CrossRef] [PubMed]
  52. Herbst, L.H.; Lenz, J.; Van Doorslaer, K.; Chen, Z.; Stacy, B.A.; Wellehan, J.F.; Manire, C.A.; Burk, R.D. Genomic characterization of two novel reptilian papillomaviruses, Chelonia mydas papillomavirus 1 and Caretta caretta papillomavirus 1. Virology 2009, 383, 131–135. [Google Scholar] [CrossRef] [Green Version]
  53. Jones, K. Environmental Influences on the Epidemiology of Fibropapillomatosis in Green Turtles (Chelonia mydas) and Consequences for Management of Inshore Areas of the great Barrier Reef. Ph.D. Thesis, James Cook University, Townsville, Australia, 2019. [Google Scholar]
  54. Greenblatt, R.J.; Work, T.M.; Balazs, G.H.; Sutton, C.A.; Casey, R.N.; Casey, J.W. The Ozobranchus leech is a candidate mechanical vector for the fibropapilloma-associated turtle herpesvirus found latently infecting skin tumors on Hawaiian green turtles (Chelonia mydas). Virology 2004, 321, 101–110. [Google Scholar] [CrossRef] [Green Version]
  55. Smith, C.J.; Osborn, A.M. Advantages and limitations of quantitative PCR (Q-PCR)-based approaches in microbial ecology. FEMS Microbiol. Ecol. 2009, 67, 6–20. [Google Scholar] [CrossRef] [Green Version]
  56. Page-Karjian, A.; Serrano, M.E.; Cartzendafner, J.; Morgan, A.; Ritchie, B.W.; Gregory, C.R.; McNeill, J.B.; Perrault, J.R.; Christiansen, E.F.; Harms, C.A. Molecular Assessment of Chelonid Alphaherpesvirus 5 Infection in Tumor-Free Green (Chelonia mydas) and Loggerhead (Caretta caretta) Sea Turtles in North Carolina, USA, 2015–2019. Animals 2020, 10, 1964. [Google Scholar] [CrossRef]
  57. Work, T.M.; Dagenais, J.; Willimann, A.; Balazs, G.; Mansfield, K.; Ackermann, M. Differences in Antibody Responses against Chelonid Alphaherpesvirus 5 (ChHV5) Suggest Differences in Virus Biology in ChHV5-Seropositive Green Turtles from Hawaii and ChHV5-Seropositive Green Turtles from Florida. J. Virol. 2020, 94, 01658-19. [Google Scholar] [CrossRef]
  58. Blackburn, N.B.; Leandro, A.C.; Nahvi, N.; Devlin, M.A.; Leandro, M.; Escobedo, I.M.; Peralta, J.M.; George, J.; Stacy, B.A.; deMaar, T.W.; et al. Transcriptomic profiling of fibropapillomatosis in green sea turtles (Chelonia mydas) from South Texas. bioRxiv 2020. [Google Scholar] [CrossRef]
  59. Yetsko, K.; Farrell, J.; Stammnitz, M.R.; Whitmore, L.; Whilde, J.; Eastman, C.B.; Ramia, D.R.; Thomas, R.; Krstic, A.; Linser, P.; et al. Mutational, transcriptional and viral shedding dynamics of the marine turtle fibropapillomatosis tumor epizootic. bioRxiv 2020. [Google Scholar] [CrossRef]
  60. Yetsko, K.; Farrell, J.A.; Blackburn, N.B.; Whitmore, L.; Stammnitz, M.R.; Whilde, J.; Eastman, C.B.; Ramia, D.R.; Thomas, R.; Krstic, A.; et al. Molecular characterization of a marine turtle tumor epizootic, profiling external, internal and postsurgical regrowth tumors. Commun. Biol. 2021, 4, 1–16. [Google Scholar] [CrossRef]
  61. Guidry, J.T.; Scott, R.S. The interaction between human papillomavirus and other viruses. Virus Res. 2017, 231, 139–147. [Google Scholar] [CrossRef] [PubMed] [Green Version]
  62. Cruz, D.; Rodríquez, M.; Kouri, V.; Soto, Y.; Zamora, L.; Rodríguez, D.; Barrera, M.; Rehtanz, M. Concurrent papillomavirus- and herpesvirus-infection in Atlantic bottlenose dolphins (Tursiops truncatus) inhabiting the Cuban coast. Mar. Mammal Sci. 2014, 30, 1564–1572. [Google Scholar] [CrossRef]
  63. Kullander, J.; Handisurya, A.; Forslund, O.; Geusau, A.; Kirnbauer, R.; Dillner, J. Cutaneous human papillomavirus 88: Remarkable differences in viral load. Int. J. Cancer 2008, 122, 477–480. [Google Scholar] [CrossRef] [PubMed] [Green Version]
  64. Antonsson, A.; Forslund, O.; Ekberg, H.; Sterner, G.; Hansson, B.G. The Ubiquity and Impressive Genomic Diversity of Human Skin Papillomaviruses Suggest a Commensalic Nature of These Viruses. J. Virol. 2000, 74, 11636–11641. [Google Scholar] [CrossRef] [Green Version]
  65. Shimada, T.; Jones, R.; Limpus, C.; Groom, R.; Hamann, M. Long-term and seasonal patterns of sea turtle home ranges in warm coastal foraging habitats: Implications for conservation. Mar. Ecol. Prog. Ser. 2016, 562, 163–179. [Google Scholar] [CrossRef] [Green Version]
  66. Duffy, D.J.; Schnitzler, C.; Karpinski, L.; Thomas, R.; Whilde, J.; Eastman, C.; Yang, C.; Krstic, A.; Rollinson, D.; Zirkelbach, B.; et al. Sea turtle fibropapilloma tumors share genomic drivers and therapeutic vulnerabilities with human cancers. Commun. Biol. 2018, 1, 1–13. [Google Scholar] [CrossRef]
  67. Shamblin, B.M.; Dodd, M.G.; Williams, K.L.; Frick, M.G.; Bell, R.; Nairn, C.J. Loggerhead turtle eggshells as a source of maternal nuclear genomic DNA for population genetic studies. Mol. Ecol. Resour. 2011, 11, 110–115. [Google Scholar] [CrossRef]
Figure 1. The distribution of chelonid alphaherpesvirus 5 (ChHV5) and Chelonia mydas papillomavirus 1 (CmPV1) in FP tumour samples (Group A) collected from green turtles at six regions along the Queensland coast. A total of 131 FP tumour tissues were tested. Of the assay samples 62 reacted in the qPCR for CmPV1, 113 for ChHV5, and 12 samples did not react in either assay. 57 turmor samples reacted in both viruses. The viral detection at each site is categorised into three categories: ChHV5 only (red), CmPV1 only (green), both ChHV5 and CmPV1 detected in the same sample (beige). The total number of samples screened (n) and the total number of negatives (neg) are shown for each location.
Animals 11 00697 g001
Figure 2. Boxplots of ChHV5 viral loads (log scale) in different sample types from six regions of Queensland. Group A (FP Tumours), Group B (Non-tumoured skin from turtles with FP tumours) and Group C (Skin from non-tumoured turtles). The Box plots of viral loads include the median (centre horizontal line), interquartile range (box), minimum and maximum (whiskers), and outliers (diamonds).
Animals 11 00697 g002
Figure 3. Box-plots of CmPV1 viral loads (log scale) in different sample types from six regions of Queensland. Group A (FP Tumours), Group B (Non-tumoured skin from turtles with FP tumours) and Group C (Skin from non-tumoured turtles). The Box plots of viral loads include the median (centre horizontal line), interquartile range (box), minimum and maximum (whiskers), and outliers (diamonds).
Animals 11 00697 g003
Table 1. The number of turtles used in this study categorised by study site and sample type.
Number of Samples
Study SiteTotal Number of TurtlesNumber of Turtles with FP TumoursGroup A (FP Tumours)Group B (Non-Tumoured Skin from Turtles with FP Tumours)Group C
(Skin from Non-Tumoured Turtles)
Cairns223--
Townsville8024521356
Bowen13050531580
Airlie Beach114--
Gladstone5444450
Brisbane88154-
Total2758913136186
Table 2. The sequences of the PCR primers and probes along with the PCR cycling protocols used in the PCR to amplify the target genes from cloned plasmids (standards), positive controls and test samples. Abbreviations: BHQ1, black hole quencher-1; FAM, 6-carboxyfluorescein; F, forward primer; R, reverse primer; P, probe.
Primers and ProbesSequenceTarget GeneAmplicon LengthCycling ConditionsReference
Cloned plasmids for standard assaysCm-Dpol-864F: 5′-ATG ACG GAC GGA CAA CAG-3′ChHV5-DNApol864 bp2 min at 95 °C; 35 cycles (95 °C for 10 s, 57 °C for 15 s, and 72 °C for 55 s)The present study
R: 5′-GGA GAT GAC GGC TGC TAA-3′
GAPDH-475F: 5′-CCT TTA ATG CGG GTG CTG-3′GAPDH475 bp2 min at 95 °C; 35 cycles (95 °C for 10 s, 57 °C for 15 s, and 72 °C for 30 s)The present study
R: 5′-CAC GGT TGC TGT ATC CAA-3′
Cm-Pap-109F: 5′-GCC GAT GAT GTC CAC TTA T-3′CmPV1-E1109 bp2 min at 95 °C; 40 cycles (95 °C for 10 s, 60 °C for 20 s, and 72 °C for 30 s)Mashkour et al. (2018)
R: 5′-GCT GAA TCC ACA GAG GTA G-3′
Screening assaysCm-Pap-109F: 5′-GCC GAT GAT GTC CAC TTA T-3′CmPV1-E1109 bp2 min at 95 °C; 50 cycles (95 °C for 10 s, 60 °C for 10 s)Mashkour et al. (2018)
R: 5′-GCT GAA TCC ACA GAG GTA G-3′
P: 5′-FAM CGA CCC ATG AAG CCG CTG T BHQ1-3′
Dpol-ChHV5-82F: 5′-CTA CCT TGT CTG GAG GTG GC-3′ChHV5-DNApol82 bp2 min at 95 °C; 50 cycles (95 °C for 10 s, 60 °C for 10 s)The present study
R: 5′-GGG TGT GAA TAA AAT CCC GCG-3′
P: 5′-FAM TAG GGC GCG ACA TGC TTC BHQ1-3′
GAPDH-83F: 5′-CTG GTC TCC TGG TAT GGA-3′GAPDH83 bp2 min at 95 °C; 50 cycles (95 °C for 10 s, 60 °C for 10 s)The present study
R: 5′-CAT GGA CTC CCA ACC TAT C-3′
P: 5′-FAM AAA CCA CCC TCC AAA TCT GGC BHQ1-3′
Cc-Pap-99F: 5′-AAA GGG CAG TGG GAA ATC TC-3′CcPV1-E299 bp2 min at 95 °C; 40 cycles (95 °C for 10 s, 58 °C for 20 s, and 72 °C for 30 s)The present study
R: 5′-TGT GAT GGC GAC GAT GTG-3′
Table 3. The results from the 353 samples screened in this study for the presence of chelonid alphaherpesvirus 5 (ChHV5) and Chelonia mydas papillomavirus 1 (CmPV1). The results are categorised by sample types: Group A (FP Tumours), Group B (Non-tumoured skin from turtles with FP tumours) and Group C (Skin from non-tumoured turtles). A summary of the total detections is also provided.
Viral DNA Detections
Sample TypeChHV5CmPV1Both ChHV5 and CmPV1Neither ChHV5 and CmPV1
Group A113/131 (86.3%)62/131 (47.3%)57/131 (43.5%)12/131 (9.2%)
Group B4/36 (11.1%)9/36 (25.0%)1/36 (2.8%)24/36 (66.7%)
Group C39/186 (21.0%)68/186 (36.6%)8/186 (4.3%)85/186 (45.7%)
Overall156/353 (44.2%)139/353 (39.4%)66/353 (18.7%)121/353 (34.3%)
Table 4. Mean viral load (reported as copy number per cell ± standard deviation) detected in the three different biological sample types screened in this study; Group A (FP Tumours), Group B (Non-tumoured skin from turtles with FP tumours) and Group C (Skin from non-tumoured turtles).
ChHV5 (Copy Number Per Cell)CmPV1 (Copy Number Per Cell)
Group A15.635 ± 30.1520.0814 ± 0.357
Group B0.0204 ± 0.03790.855 ± 2.351
Group C0.100 ± 0.6060.005 ± 0.023
Table 5. Number of viral DNA detections and mean viral load (reported as copy number per cell ± standard deviation) of the samples which tested positive in the three different biological sample types screened in this study; Group A (FP Tumours), Group B (non-tumoured skin from turtles with FP tumours) and Group C (skin from non-tumoured turtles). The number of detections within each group were compared using Chi square and Fisher’s exact test, respectively, with the results also reported here. Statistically significant differences are highlighted in bold. Unavailable samples are denoted by a hyphen. * This is not a meaningful comparison.
Group AGroup BGroup C
ChHV5CmPV1p-ValueChHV5CmPV1p-ValueChHV5CmPV1p-Value
CairnsNo. (%) positive3/3 (100.0%)3/3 (100.0%)1.000------
Average copy number/cell39.300 ± 56.7880.002 ± 0.002*-----*
TownsvilleNo. (%) positive51/52 (98.1%)26/52 (50.0%)<0.000012/13 (15.4%)2/13 (15.4%)1.0005/56 (8.9%)11/56 (19.6%)0.105
Average copy number/cell11.364 ± 16.1200.010 ± 0.030*0.039 ± 0.0530.023 ± 0.033 0.758 ± 1.6950.009 ± 0.024*
BowenNo. (%) positive39/53 (73.6%)26/53 (49.1%)0.00951/15 (6.7%)6/15 (40.0%)0.030917/80 (21.25%)52/80 (65%)<0.00001
Average copy number/cell16.456 ± 28.9110.088 ± 0.257-- 0.231 ± 0.9180.005 ± 0.024*
Airlie BeachNo. (%) positive4/4 (100%)2/4 (50.0%)0.429------
Average copy number/cell3.554 ± 0.8350.001 ± 0.0004*-----*
GladstoneNo. (%) positive2/4 (50.0%)2/4 (50.0%)1.0000/4 (0.0%)1/4 (25.0%)1.00022/50 (44.0%)6/50 (12.0%)0.0003
Average copy number/cell2.061 ± 2.9000.003 ± 0.003*---0.000004 ± 0.000010.0003 ± 0.0008*
BrisbaneNo. (%) positive14/15 (93.3%)4/15 (26.6%)<0.0011/4 (25.0%)0/4 (0.0%)1.000---
Average copy number/cell29.220 ± 58.4660.634 ± 1.267*-----*
Publisher’s Note: MDPI stays neutral with regard to jurisdictional claims in published maps and institutional affiliations.

