
How Divergence for Feed Efficiency Traits Affects Body Measurements and Metabolites in Blood and Ruminal Parameters on Pre-Weaning Dairy Heifers

 , , , and
Abstract
:Simple Summary
Abstract
1. Introduction
2. Materials and Methods
2.1. Animals, Housing, Management, and Feed Efficiency Groups
2.2. Morphometric Measurements
2.3. Blood Collection and Analyses
2.4. Rumen Variables and Analyses
2.5. Statistical Analyses
3. Results
4. Discussion
5. Conclusions
Author Contributions
Funding
Institutional Review Board Statement
Data Availability Statement
Conflicts of Interest
References
- Okine, E.K.; Basarab, J.A.; Goonewardene, L.A.; Mir, P. Residual feed intake and feed efficiency: Differences and implications. In Florida Ruminant Nutrition Symposium; University of Florida Institute of Food and Agricultural Sciences: Gainesville, FL, USA, 2004; pp. 27–38. [Google Scholar]
- Herd, R.M.; Bishop, S.C. Genetic variation in residual feed intake and its association with other production traits in British Hereford cattle. Livest. Prod. Sci. 2000, 63, 111–119. [Google Scholar] [CrossRef]
- Koch, R.M.; Swiger, L.A.; Chambers, D.; Gregory, K.E. Efficiency of feed use in beef cattle. J. Anim. Sci. 1963, 22, 486–494. [Google Scholar] [CrossRef]
- Crowley, J.J.; McGee, M.; Kenny, D.A.; Crews Jr, D.H.; Evans, R.D.; Berry, D.P. Phenotypic and genetic parameters for different measures of feed efficiency in different breeds of Irish performance-tested beef bulls. J. Anim. Sci. 2010, 88, 885–894. [Google Scholar] [CrossRef]
- Herd, R.M.; Oddy, V.H.; Richardson, E.C. Biological basis for variation in residual feed intake in beef cattle. 1. Review of potential mechanisms. Aust. J. Exp. Agric. 2004, 44, 423–430. [Google Scholar] [CrossRef]
- Herd, R.M.; Arthur, P.F. Physiological basis for residual feed intake. J. Anim. Sci. 2009, 87, 64–71. [Google Scholar] [CrossRef] [PubMed]
- Kelly, A.K.; McGee, M.; Crews Jr, D.H.; Fahey, A.G.; Wylie, A.R.; Kenny, D.A. Effect of divergence in residual feed intake on feeding behaviour, blood metabolic variables, and body composition traits in growing beef heifers. J. Anim. Sci. 2010, 88, 109–123. [Google Scholar] [CrossRef] [Green Version]
- Nascimento, C.F.; Branco, R.H.; Bonilha, S.F.M.; Cyrillo, J.N.S.G.; Negrão, J.A.; Mercadante, M.E.Z. Residual feed intake and blood variables in young Nellore cattle. J. Anim. Sci. 2015, 93, 1318–1326. [Google Scholar] [CrossRef]
- Leão, J.M.; Coelho, S.G.; Machado, F.S.; Azevedo, R.A.; Lima, J.A.M.; Carneiro, J.C.; Lage, C.F.A.; Ferreira, A.L.; Pereira, L.G.R.; Tomich, T.R.; et al. Phenotypically divergent classification of pre-weaned heifer calves for feed efficiency indexes and their correlations with heat production and thermography. J. Dairy Sci. 2018, 101, 5060–5068. [Google Scholar] [CrossRef] [PubMed] [Green Version]
- Khan, M.A.; Lee, H.J.; Lee, W.S.; Kim, H.S.; Ki, H.S.; Hur, T.Y.; Suh, G.H.; Kang, S.J.; Choi, Y.J. Structural growth, rumen development, and metabolic and immune responses of Holstein male calves fed milk through step-down and conventional methods. J. Dairy Sci. 2007, 90, 3376–3387. [Google Scholar] [CrossRef] [Green Version]
- Lodge-Ivey, S.L.; Browne-Silva, J.; Horvath, M.B. Technical note: Bacterial diversity and fermentation end products in rumen fluid samples collected via oral lavage or rumen cannula. J. Anim. Sci. 2009, 87, 2333–2337. [Google Scholar] [CrossRef]
- Henderson, G.; Cox, F.; Kittelmann, S.; Miri, V.H.; Zethof, M.; Noel, S.J.; Waghorn, G.C.; Janssen, P.H. Effect of DNA extraction methods and sampling techniques on the apparent structure of cow and sheep rumen microbial communities. PLoS ONE 2013, 8, e74787. [Google Scholar] [CrossRef] [Green Version]
- Kumar, S.; Indugu, N.; Vecchiarelli, B.; Pitta, D.W. Associative patterns among anaerobic fungi, methanogenic archaea, and bacterial communities in response to changes in diet and age in the rumen of dairy cows. Front. Microbiol. 2015, 6, 781. [Google Scholar] [CrossRef] [PubMed] [Green Version]
- AOAC. Association of Official Analytical Chemists. In Official Methods of Analysis, 13th ed.; AOAC: Washington, DC, USA, 1980. [Google Scholar]
- Lawrence, P.; Kenny, D.A.; Earley, B.; Crews, D.H., Jr.; McGee, M. Grass silage intake, rumen and blood variables, ultrasonic and body measurements, feeding behavior and activity in pregnant beef heifers differing in phenotypic residual feed intake. J. Anim. Sci. 2011, 89, 3248–3261. [Google Scholar] [CrossRef] [PubMed] [Green Version]
- Basarab, J.A.; Price, M.A.; Aalhus, J.L.; Okine, E.K.; Snelling, W.M.; Lyle, K.L. Residual feed intake and body composition in young growing cattle. Can. J. Anim. Sci. 2003, 83, 189–204. [Google Scholar] [CrossRef]
- Nkrumah, J.D.; Basarab, J.A.; Price, M.A.; Okine, E.K.; Ammoura, A.; Guercio, S.; Hansen, C.; Li, C.; Benkel, B.; Murdoch, B.; et al. Different measures of energetic efficiency and their phenotypic relationships with growth, feed intake, and ultrasound and carcass merit in hybrid cattle. J. Anim. Sci. 2004, 82, 2451–2459. [Google Scholar] [CrossRef] [PubMed]
- Lage, C.F.A.; Coelho, S.G.; Diniz Neto, H.C.; Malacco, V.M.R.; Rodrigues, J.P.P.; Sacramento, J.P.; Teixeira, V.A.; Machado, F.S.; Pereira, L.G.R.; Tomich, T.R.; et al. Relationship between feed efficiency indexes and thermography, blood, and ruminal parameters in pre-weaning dairy heifers. PLoS ONE 2020, 15, e0236118. [Google Scholar] [CrossRef]
- Brockman, R.P.; Laarveld, B. Hormonal Regulation of Metabolism in Rumininants; a Review. Livest. Prod. Sci. 1986, 14, 313–334. [Google Scholar] [CrossRef]
- Alende, M.; Lancaster, P.A.; Spangler, M.L.; Pordomingo, A.J.; Andrae, J.G. Residual feed intake in cattle: Physiological basis. A Review. Rev. Arg. Prod. Anim. 2016, 36, 49–56. [Google Scholar]
- Fitzsimons, C.; Kenny, D.A.; McGee, M. Visceral organ weights, digestion and carcass characteristics of beef bulls differing in residual feed intake offered a high concentrate diet. Animal 2014, 8, 949–959. [Google Scholar] [CrossRef] [Green Version]
- Fitzsimons, C.; Kenny, D.A.; Deighton, M.H.; Fahey, A.G.; McGee, M. Methane emissions, body composition, and rumen fermentation traits of beef heifers differing in residual feed intake. J. Anim. Sci. 2013, 91, 5789–5800. [Google Scholar] [CrossRef] [PubMed] [Green Version]
- Lawrence, P.; Kenny, D.A.; Earley, B.; McGee, M. Intake of conserved and grazed grass and performance traits in beef suckler cows differing in phenotypic residual feed intake. Livest. Sci. 2013, 152, 154–166. [Google Scholar] [CrossRef]
- Van Soest, P.J. Nutritional Ecology of the Ruminant; Cornell University Press: New York, NY, USA, 1982; p. 476. [Google Scholar]
 = high efficiency (RFI < 0.5 SD below the mean (n = 10) and RG > 0.5 SD above the mean (n = 9));
  = low efficiency (RFI > 0.5 SD above the mean (n = 10) and RG < 0.5 SD below the mean (n = 8)) and
  = intermediary.
= high efficiency (RFI < 0.5 SD below the mean (n = 10) and RG > 0.5 SD above the mean (n = 9)); = low efficiency (RFI > 0.5 SD above the mean (n = 10) and RG < 0.5 SD below the mean (n = 8)) and = intermediary.
= intermediary.
= high efficiency (RFI < 0.5 SD below the mean (n = 10) and RG > 0.5 SD above the mean (n = 9)); = low efficiency (RFI > 0.5 SD above the mean (n = 10) and RG < 0.5 SD below the mean (n = 8)) and = intermediary.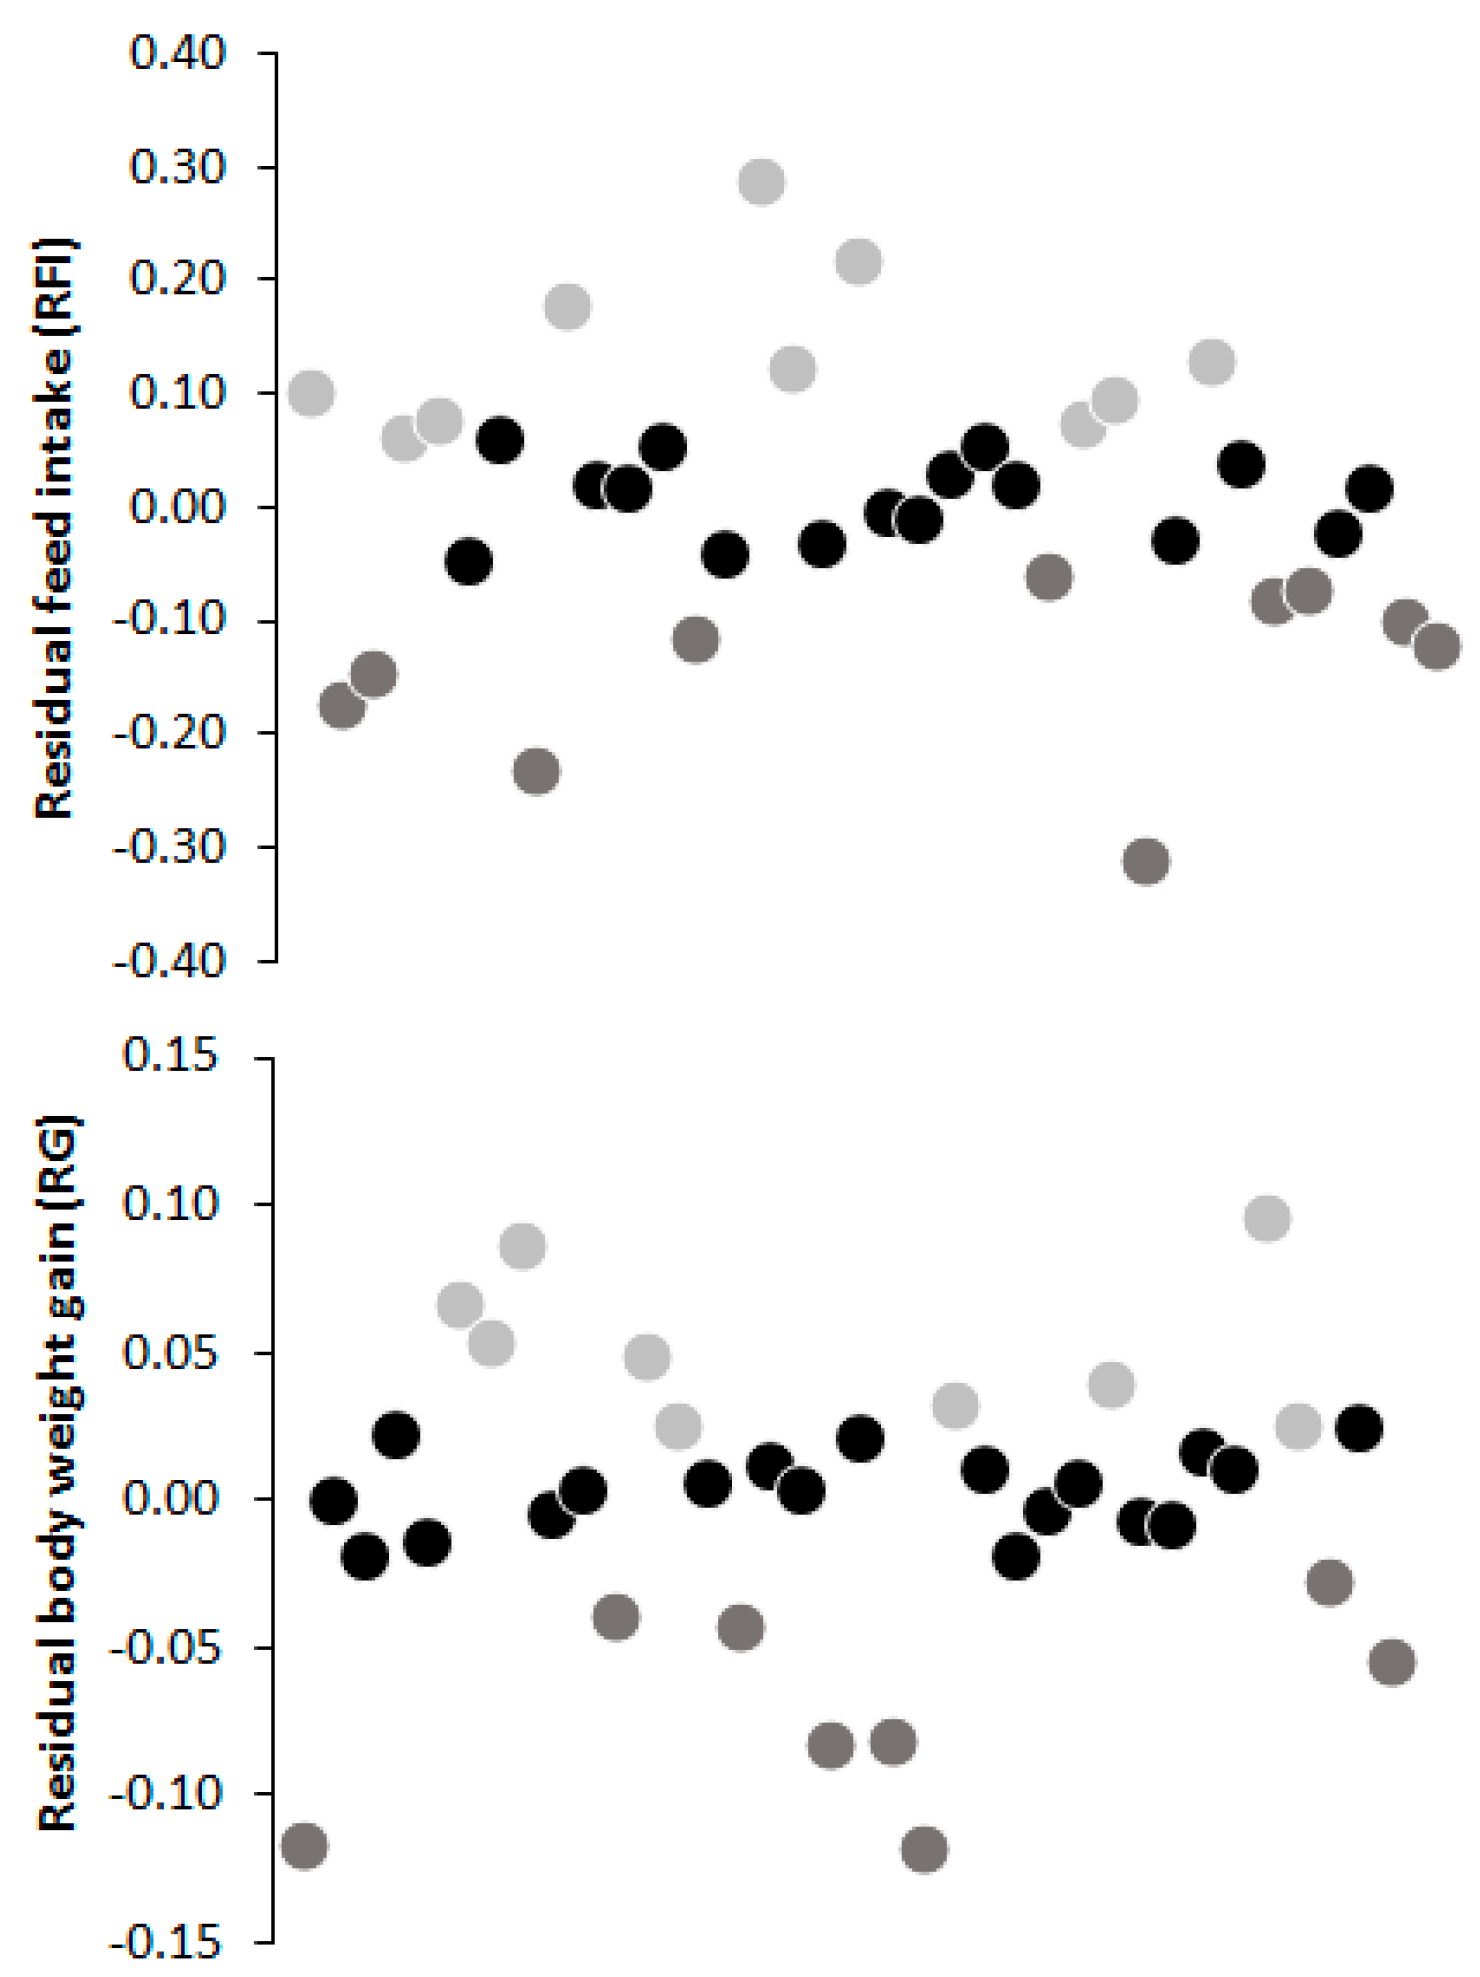

| Nutrient Composition (DM Basis, %) | Milk | Hay | Starter | TMR |
|---|---|---|---|---|
| DM | 12.6 | 90.3 | 89.3 | 89.3 |
| CP | 3.13 | 13.6 | 22.2 | 21.8 |
| Organic Matter | - | 80.8 | 77.9 | 78 |
| Ether extract | 3.93 | 3.7 | 4.6 | 4.6 |
| NFC | - | 16.7 | 59.5 | 57.3 |
| NDF | - | 70.1 | 24.5 | 26.8 |
| ADF | - | 33.3 | 9.9 | 11 |
| GE (Kcal/kg) | - | 3928 | 3728 | 3738 |
| Ca | - | 0.8 | 2 | 1.9 |
| P | - | 0.3 | 0.5 | 0.5 |
| Lactose | 4.54 | - | - | - |
| Item | RFI | SEM | p-Value | RG | SEM | p-Value | ||||||
|---|---|---|---|---|---|---|---|---|---|---|---|---|
| HE | LE | G | W | G X W | HE | LE | G | W | G X W | |||
| DMI (g/day) | 1480 | 1744 | 51.8 | 0.06 | <0.01 | 0.94 | 1535 | 1594 | 52.5 | 0.68 | <0.01 | 0.89 |
| FE | 0.7 | 0.61 | 0.02 | <0.01 | <0.01 | 0.59 | 0.68 | 0.63 | 0.022 | 0.15 | <0.01 | 0.81 |
| ADG (kg/day) | 0.98 | 0.98 | 0.03 | 0.98 | <0.01 | 0.89 | 1.1 | 0.92 | 0.06 | 0.19 | 0.37 | 0.47 |
| Item | RFI | SEM | p-Value | RG | SEM | p-Value | ||
|---|---|---|---|---|---|---|---|---|
| HE | LE | HE | LE | |||||
| Withers height (cm) | ||||||||
| Initial | 79.4 | 77.9 | 0.89 | 0.41 | 78.9 | 79.6 | 1 | 0.74 |
| Final | 94.9 | 93.2 | 0.61 | 0.18 | 94.1 | 92.3 | 0.87 | 0.31 |
| Variation | 15.5 | 15.3 | 4.02 | 0.77 | 15.2 | 12.7 | 0.54 | 0.01 |
| Hip height (cm) | ||||||||
| Initial | 83.3 | 82 | 0.99 | 0.51 | 83.3 | 83.4 | 1.07 | 0.97 |
| Final | 99 | 97.7 | 0.67 | 0.35 | 97.9 | 96.7 | 0.99 | 0.56 |
| Variation | 15.7 | 15.7 | 0.57 | 0.97 | 14.6 | 13.3 | 0.53 | 0.23 |
| Heart girth (cm) | ||||||||
| Initial | 81.2 | 79.5 | 0.77 | 0.28 | 79.1 | 80.6 | 1.02 | 0.5 |
| Final | 106 | 104 | 0.98 | 0.43 | 104 | 105 | 1.14 | 0.89 |
| Variation | 24.8 | 24.5 | 0.73 | 0.94 | 24.9 | 24.4 | 0.86 | 0.53 |
| Hip width (cm) | ||||||||
| Initial | 22.3 | 20.6 | 0.41 | 0.03 | 20.6 | 20.3 | 0.55 | 0.79 |
| Final | 28.6 | 28.6 | 0.56 | 1 | 29 | 28.5 | 0.46 | 0.6 |
| Variation | 6.3 | 8.0 | 1.1 | 0.83 | 8.4 | 8.2 | 0.44 | 0.83 |
| Item | RFI | RG |
|---|---|---|
| Morphometric measurements | ||
| Withers height | −0.10 | 0.01 |
| Hip height | −0.08 | 0.03 |
| Heart girth | −0.03 | 0.01 |
| Hip width | −0.05 | 0.03 |
| Blood parameters | ||
| Glucose | 0.15 | 0.61 * |
| Insulin | 0.46 * | 0.37 |
| BHB | −0.01 | −0.54 * |
| Glucose:Insulin | 0.19 | −0.68 * |
| Ruminal parameters | ||
| NH3-N | −0.16 | 0.42 |
| pH | 0.06 | 0.16 |
| VFA | 0.03 | 0.02 |
| Acetate | 0.08 | −0.13 |
| Propionate | 0.13 | −0.20 |
| Butyrate | −0.35 | 0.43 |
| Item | RFI | SEM | p-Value | RG | SEM | p-Value | ||
|---|---|---|---|---|---|---|---|---|
| HE | LE | HE | LE | |||||
| Glucose (mg/dL) | 119 | 112 | 3.23 | 0.24 | 111 | 107 | 3.91 | 0.63 |
| Insulin (μU/mL) | 1.72 | 1.22 | 0.19 | 0.18 | 1.54 | 1.18 | 0.257 | 0.51 |
| BHB (mmol/L) | 0.32 | 0.31 | 0.15 | 0.67 | 0.28 | 0.38 | 0.02 | 0.01 |
| Glucose:Insulin (mg/μU) | 0.8 | 1.17 | 0.26 | 0.2 | 0.83 | 1.69 | 0.346 | 0.07 |
| Item | RFI | SEM | p-Value | RG | SEM | p-Value | ||
|---|---|---|---|---|---|---|---|---|
| HE | LE | HE | LE | |||||
| NH3-N (mg/dL) | 9.87 | 9.88 | 1.95 | 0.99 | 10.42 | 6.5 | 2.27 | 0.06 |
| pH | 5.97 | 6.24 | 0.15 | 0.39 | 6.11 | 5.67 | 0.17 | 0.21 |
| VFA (µmol/mL) | 50.4 | 41.22 | 4.23 | 0.29 | 51.54 | 47.23 | 2.57 | 0.43 |
| Acetate (µmol/mL) | 23.94 | 20.15 | 1.93 | 0.34 | 21.57 | 23.14 | 1.56 | 0.63 |
| Propionate (µmol/mL) | 19.75 | 17.4 | 1.87 | 0.55 | 18.31 | 20.14 | 1.65 | 0.6 |
| Butyrate (µmol/mL) | 3.99 | 3.32 | 0.34 | 0.35 | 3.99 | 3.05 | 0.28 | 0.1 |
| Acetate:Propionate | 1.25 | 1.2 | 0.04 | 0.58 | 1.19 | 1.19 | 0.04 | 0.95 |
Publisher’s Note: MDPI stays neutral with regard to jurisdictional claims in published maps and institutional affiliations. |
© 2021 by the authors. Licensee MDPI, Basel, Switzerland. This article is an open access article distributed under the terms and conditions of the Creative Commons Attribution (CC BY) license (https://creativecommons.org/licenses/by/4.0/).
Share and Cite
Leão, J.M.; Coelho, S.G.; Lage, C.F.d.A.; Azevedo, R.A.d.; Lima, J.A.M.; Carneiro, J.C.; Ferreira, A.L.; Machado, F.S.; Pereira, L.G.R.; Tomich, T.R.; et al. How Divergence for Feed Efficiency Traits Affects Body Measurements and Metabolites in Blood and Ruminal Parameters on Pre-Weaning Dairy Heifers. Animals 2021, 11, 3436. https://doi.org/10.3390/ani11123436
Leão JM, Coelho SG, Lage CFdA, Azevedo RAd, Lima JAM, Carneiro JC, Ferreira AL, Machado FS, Pereira LGR, Tomich TR, et al. How Divergence for Feed Efficiency Traits Affects Body Measurements and Metabolites in Blood and Ruminal Parameters on Pre-Weaning Dairy Heifers. Animals. 2021; 11(12):3436. https://doi.org/10.3390/ani11123436
Chicago/Turabian StyleLeão, Juliana Mergh, Sandra Gesteira Coelho, Camila Flávia de Assis Lage, Rafael Alves de Azevedo, Juliana Aparecida Mello Lima, Juliana Campos Carneiro, Alexandre Lima Ferreira, Fernanda Samarini Machado, Luiz Gustavo Ribeiro Pereira, Thierry Ribeiro Tomich, and et al. 2021. "How Divergence for Feed Efficiency Traits Affects Body Measurements and Metabolites in Blood and Ruminal Parameters on Pre-Weaning Dairy Heifers" Animals 11, no. 12: 3436. https://doi.org/10.3390/ani11123436
APA StyleLeão, J. M., Coelho, S. G., Lage, C. F. d. A., Azevedo, R. A. d., Lima, J. A. M., Carneiro, J. C., Ferreira, A. L., Machado, F. S., Pereira, L. G. R., Tomich, T. R., Diniz Neto, H. d. C., & Campos, M. M. (2021). How Divergence for Feed Efficiency Traits Affects Body Measurements and Metabolites in Blood and Ruminal Parameters on Pre-Weaning Dairy Heifers. Animals, 11(12), 3436. https://doi.org/10.3390/ani11123436