Article

Effects of Eimeria tenella Infection on Key Parameters for Feed Efficiency in Broiler Chickens

1
Department of Poultry Science, University of Georgia, Athens, GA 30602, USA
2
Department of Animal and Dairy Science, University of Georgia, Athens, GA 30602, USA
*
Author to whom correspondence should be addressed.
Animals 2021, 11(12), 3428; https://doi.org/10.3390/ani11123428
Submission received: 8 November 2021 / Revised: 24 November 2021 / Accepted: 29 November 2021 / Published: 1 December 2021
(This article belongs to the Special Issue Antioxidants in Animal Production, Reproduction, Health and Welfare)

Abstract

:

Simple Summary

Coccidiosis, which can be induced by Eimeria spp., causes tremendous economic losses in the poultry production. Eimeria tenella (E. tenella) is one of the poultry Eimeria spp. that damage cecal tissue. Broilers infected with E. tenella can have reduced body weight, feed efficiency, and gut health because ceca are the main site for producing volatile fatty acids (VFA; important energy sources) and ceca accommodate diverse pathogens. To find appropriate strategies to cope with E. tenella infection, modes of actions of E. tenella infection on broiler growth and health should be investigated, and experimental infection model should be established. In the study, different levels of sporulated E. tenella oocysts were inoculated to the broilers, and the inoculation dosages induced mild infection in the ceca of broilers. The current study showed that E. tenella infection damaged feed efficiency and small intestinal health in broilers, mainly by reducing cecal volatile fatty acids (VFA) production. Different inoculation levels modulated the tendency of fecal moisture content and fecal oocyst shedding at different time points. Based on the results, energy supplementation and/or modulation of cecal microbiota potentially ameliorates negative effects of E. tenella infection in broilers.

Abstract

The purpose of the study was to investigate effects of different inoculation dosages of E. tenella on growth performance, gastrointestinal permeability, oocyst shedding, intestinal morphology, fecal consistency, ileal apparent digestibility, antioxidant capacity, and cecal VFA profile in broiler chickens. Five different dosages (T0: 0, T1: 6250, T2: 12,500, T3: 25,000, and T4: 50,000) of E. tenella oocysts were inoculated via oral gavage to fourteen-day-old broilers. Inoculation of E. tenella linearly increased FCR (p < 0.05), and feed intake was quadratically increased on 6 days post-infection (dpi; p = 0.08) and 7 dpi (p = 0.09). Cecal lesion score of each treatment was T0: 0; T1: 0.39 ± 0.14; T2: 0.93 ± 0.21; T3: 1.25 ± 0.16; and T4: 1.58 ± 0.2. Cecal total VFA production was linearly reduced due to E. tenella infection on 6 dpi (p < 0.01). E. tenella infection deepened cecal crypts depth on 6 dpi (CD; p < 0.05). Gastrointestinal permeability tended to be linearly increased (p = 0.07). E. tenella infection tended to linearly reduce duodenal VH (p = 0.1) and jejunal VH on 9 dpi (p = 0.09). Different dosages of E. tenella modulated the tendency of fecal moisture content and oocyst shedding. Therefore, E. tenella infection impaired feed efficiency and small intestinal health mainly by reducing cecal VFA production and deepening cecal CD in broilers.

1. Introduction

Coccidiosis causes tremendous economic losses in broiler production by impairing gut health and depressing growth performance and feed efficiency of broiler chickens, and expensive anti-coccidial treatments also increase the overall production cost [1,2]. Avian coccidiosis are induced by Eimeria spp., which are protozoan parasites, and there are 7 known Eimeria spp. that can infect chickens: Eimeria acervulina, E. maxima, E. tenella, E. brunetti, E. necatrix, E. mitis, and E. praecox [3]. Each species resides at the different section of the intestinal tract of broiler chickens, and thereby it has different modes of actions to affect growth performance and gut health of broilers [4]. Teng et al. [5] reported that E. maxima decreased digestibility of crude proteins and amino acids in broilers. Eimeria spp. can be transmitted via the fecal–oral route. The infection is initiated by ingestion of sporulated (infectious) oocysts, and after the asexual and sexual replications, un-sporulated oocysts are excreted with feces [6]. In an appropriate environment, the oocysts can be sporulated and become infectious, and this life cycle can be repeated with poultry growth cycle.
Eimeria tenella (E. tenella) resides in the mucus membrane of ceca, and during its replications, epithelial cells in ceca are damaged, resulting in hemorrhagic diarrhea and impaired growth performance and intestinal health in broilers [7]. The ceca, the main intestinal compartment for bacterial fermentation, can be reservoirs for pathogenic bacteria and their toxins that can cause oxidative stress after entering the blood stream of broilers [8]. However, ceca also play crucial roles in producing beneficial bacterial metabolites including vitamins, volatile fatty acids (VFA), lactic acid, and antimicrobial compounds via bacterial fermentation [9]. The VFA are not only inhibit the growth of pathogenic bacteria, but also are energy substrates for the host and induce gut development of chickens by accelerating gut epithelial cell proliferation [10]. Moreover, VFA interact with fat metabolism via mitogen-activated protein kinase (MAPK) pathway [11]. These suggest that VFA are closely associated with feed efficiency by providing extra energy to the host or influencing metabolism of chickens.
To cope with Eimeria spp. infection in broiler production, anti-coccidial drugs, and vaccination has been used in the broiler industry. However, the use of anti-coccidial drugs has been restricted by inhibiting the use of old anti-coccidial drugs and requiring Veterinary Feed Directives (VFD) registrations because of the spread of resistant Eimeria strain and consumer pressure [12,13]. Furthermore, vaccination is expensive and can prevent spread of Eimeria spp. [14]. Recently, a lot of attention has been paid to find nutritional interventions to control Eimeria spp. infection in broilers. Diverse bioactive compounds, including essential oils [15], probiotics [16], sodium butyrate [17], and plant extracts [18], were studied to control or to ameliorate negative effects of E. tenella infection and in broilers. The modes of actions of those bioactive compounds may include damaging cell wall of E. tenella, modulating cecal microbiota, and/or enhancing the immunity of broilers. To find suitable nutritional interventions, it is important to understand mode of actions of E. tenella on the growth of chickens and to set up appropriate experimental infection models to test novel nutritional interventions. Therefore, the hypothesis of this study was that impaired cecal health due to E. tenella infection may result in reduced growth performance and impaired intestinal health because of reduced VFA production and increased oxidative stress. The purpose of the study was to investigate the effects of different inoculation dosages of E. tenella on growth performance, gastrointestinal permeability, oocyst shedding, fecal consistency, intestinal morphology, ileal apparent digestibility, antioxidant capacity, and cecal VFA in broiler chickens.

2. Materials and Methods

2.1. Experimental Design, Diets, and Growth Performance

This study was approved by the Institutional Animal Care and Use committee of the University of Georgia, and this experiment was conducted at the Poultry Research Center, University of Georgia, Athens, GA. A total of 360 fourteen-day-old male Cobb500 broiler chickens were distributed to 5 treatments with 6 replicates (12 birds per battery cage) in a completely randomized design. The experimental treatments were (1) treatments 0 (T0): administration with 1 mL of phosphate-buffered solution (PBS) as a sham-challenged group; (2) treatments 1 (T1): administration with 6250 sporulated oocysts of E. tenella; treatment 2 (T2): administration with 12,500 sporulated oocysts of E. tenella; treatments (T3): administration with 25,000 sporulated oocysts of E. tenella; and treatment (T4), administration with 50,000 sporulated oocysts of E. tenella. The sham-challenged groups were placed on the top of the cages to minimize the cross-infection. The E. tenella used in the study was a wild-type strain. To each bird, 1 mL of inoculum was administrated by oral gavage. As shown in Table 1, the experimental diet (D 14 to 23) was formulated to meet or exceed Cobb 500 nutrient requirements (2018) and included 3 g/kg of titanium (IV) oxide (Acros Organics, Morris Plains, NJ, USA) as an indigestible marker to determine the apparent ileal digestibility (AID). In-feed anticoccidials were not included in the experimental diet (D 14 to 23) and in the pre-experimental diet (D 0 to 14).
During the entire experiment period, birds had free access to water and feed, and temperature was controlled according to the recommendation of Cobb Broiler Management Guide. Body weight (BW) of the birds per cage were recorded on 6 days post-infection (dpi) and 9 dpi, and feed disappearance were recorded daily to calculate average daily gain (ADG), average daily feed intake (ADFI), and feed conversion ratio (FCR). The acute phase was 0 to 6 dpi, and recovery phase was 6 to 9 dpi.

2.2. Gastrointestinal Permeability, Oocyst Shedding, and Fecal Consistency

Gastrointestinal permeability was measured according to Teng et al. [19] with minor modifications. On 5, 6, and 7 dpi, one bird per cage was administrated with 1 mL of 2.2 mg/mL of fluorescein isothiocyanatedextran 4 kDa (FITC-D4; Sigma-Aldrich Co., St. Louis, MO, USA) dissolved in PBS. After 2 h, birds were euthanized and blood from the heart was collected into heparin-free vacutainer tubes. The tubes stood in a dark container at room temperature for 1 h for clotting and centrifuged at 1000× g for 15 min to recover serum. The collected serum samples were transferred to a 96 black well plate (Greiner Bio-one, Monroe, NC, USA) in duplicate, and the fluorescence was measured at an excitation wavelength of 485 nm and an emission wavelength of 528 nm by using a ICTOR3 Multilabel Plate Reader (Perkin Elmer, Waltham, MA, USA). The FITC-D4 concentration in the serum was quantified by prepared standard solution using pooled serum from birds that were not inoculated with FITC-D4 (not part of the study) and expressed relative to the T0 group.
Fresh fecal samples were collected on 5 to 6 dpi, 6 to 7 dpi, and 7 to 8 dpi to measure fecal moisture content and fecal oocyst shedding. Fecal samples were put in a 60 °C oven until constant weight, and the weights before and after drying were recorded to calculate moisture content. Oocysts in fecal samples were counted using a McMaster chamber to calculate oocyst shedding per gram of feces. Briefly, 3 to 5 g of fecal samples were put in 50 mL tubes and mixed thoroughly with 25 mL of distilled water to ensure a uniform suspension. Afterwards, 1 mL of the suspension were mixed with 9 mL of the saturated salt solutions. The mixed solution was loaded into a McMaster chamber, and number of oocysts were counted using a microscope. Oocyst shedding were expressed as log10 (oocysts/g feces).

2.3. Sample Collection and Lesion Score

On 6 and 9 dpi, 4 birds per cage were euthanized by the cervical dislocation method for sample collection and lesion scoring (6 dpi). Cecal lesion scoring from 4 birds per cage was conducted in a blind fashion according to the 4-score scale method [20]. Around 3 to 5 cm of intestinal sections of mid-duodenum, mid-jejunum, mid-ileum, and mid-ceca were collected, and then rinsed with PBS to remove digesta, and stored in 10% neutral-buffered formalin for further steps. From 4 birds per cage, ileal digesta (from the Meckel’s diverticulum to 15 cm upper from the ileo-cecal-colic junction) were collected and dried in a 60 °C oven until constant weight to determine ileal moisture content and for digestibility analysis. Liver and ceca samples were collected and snap-frozen and stored at −80 °C.

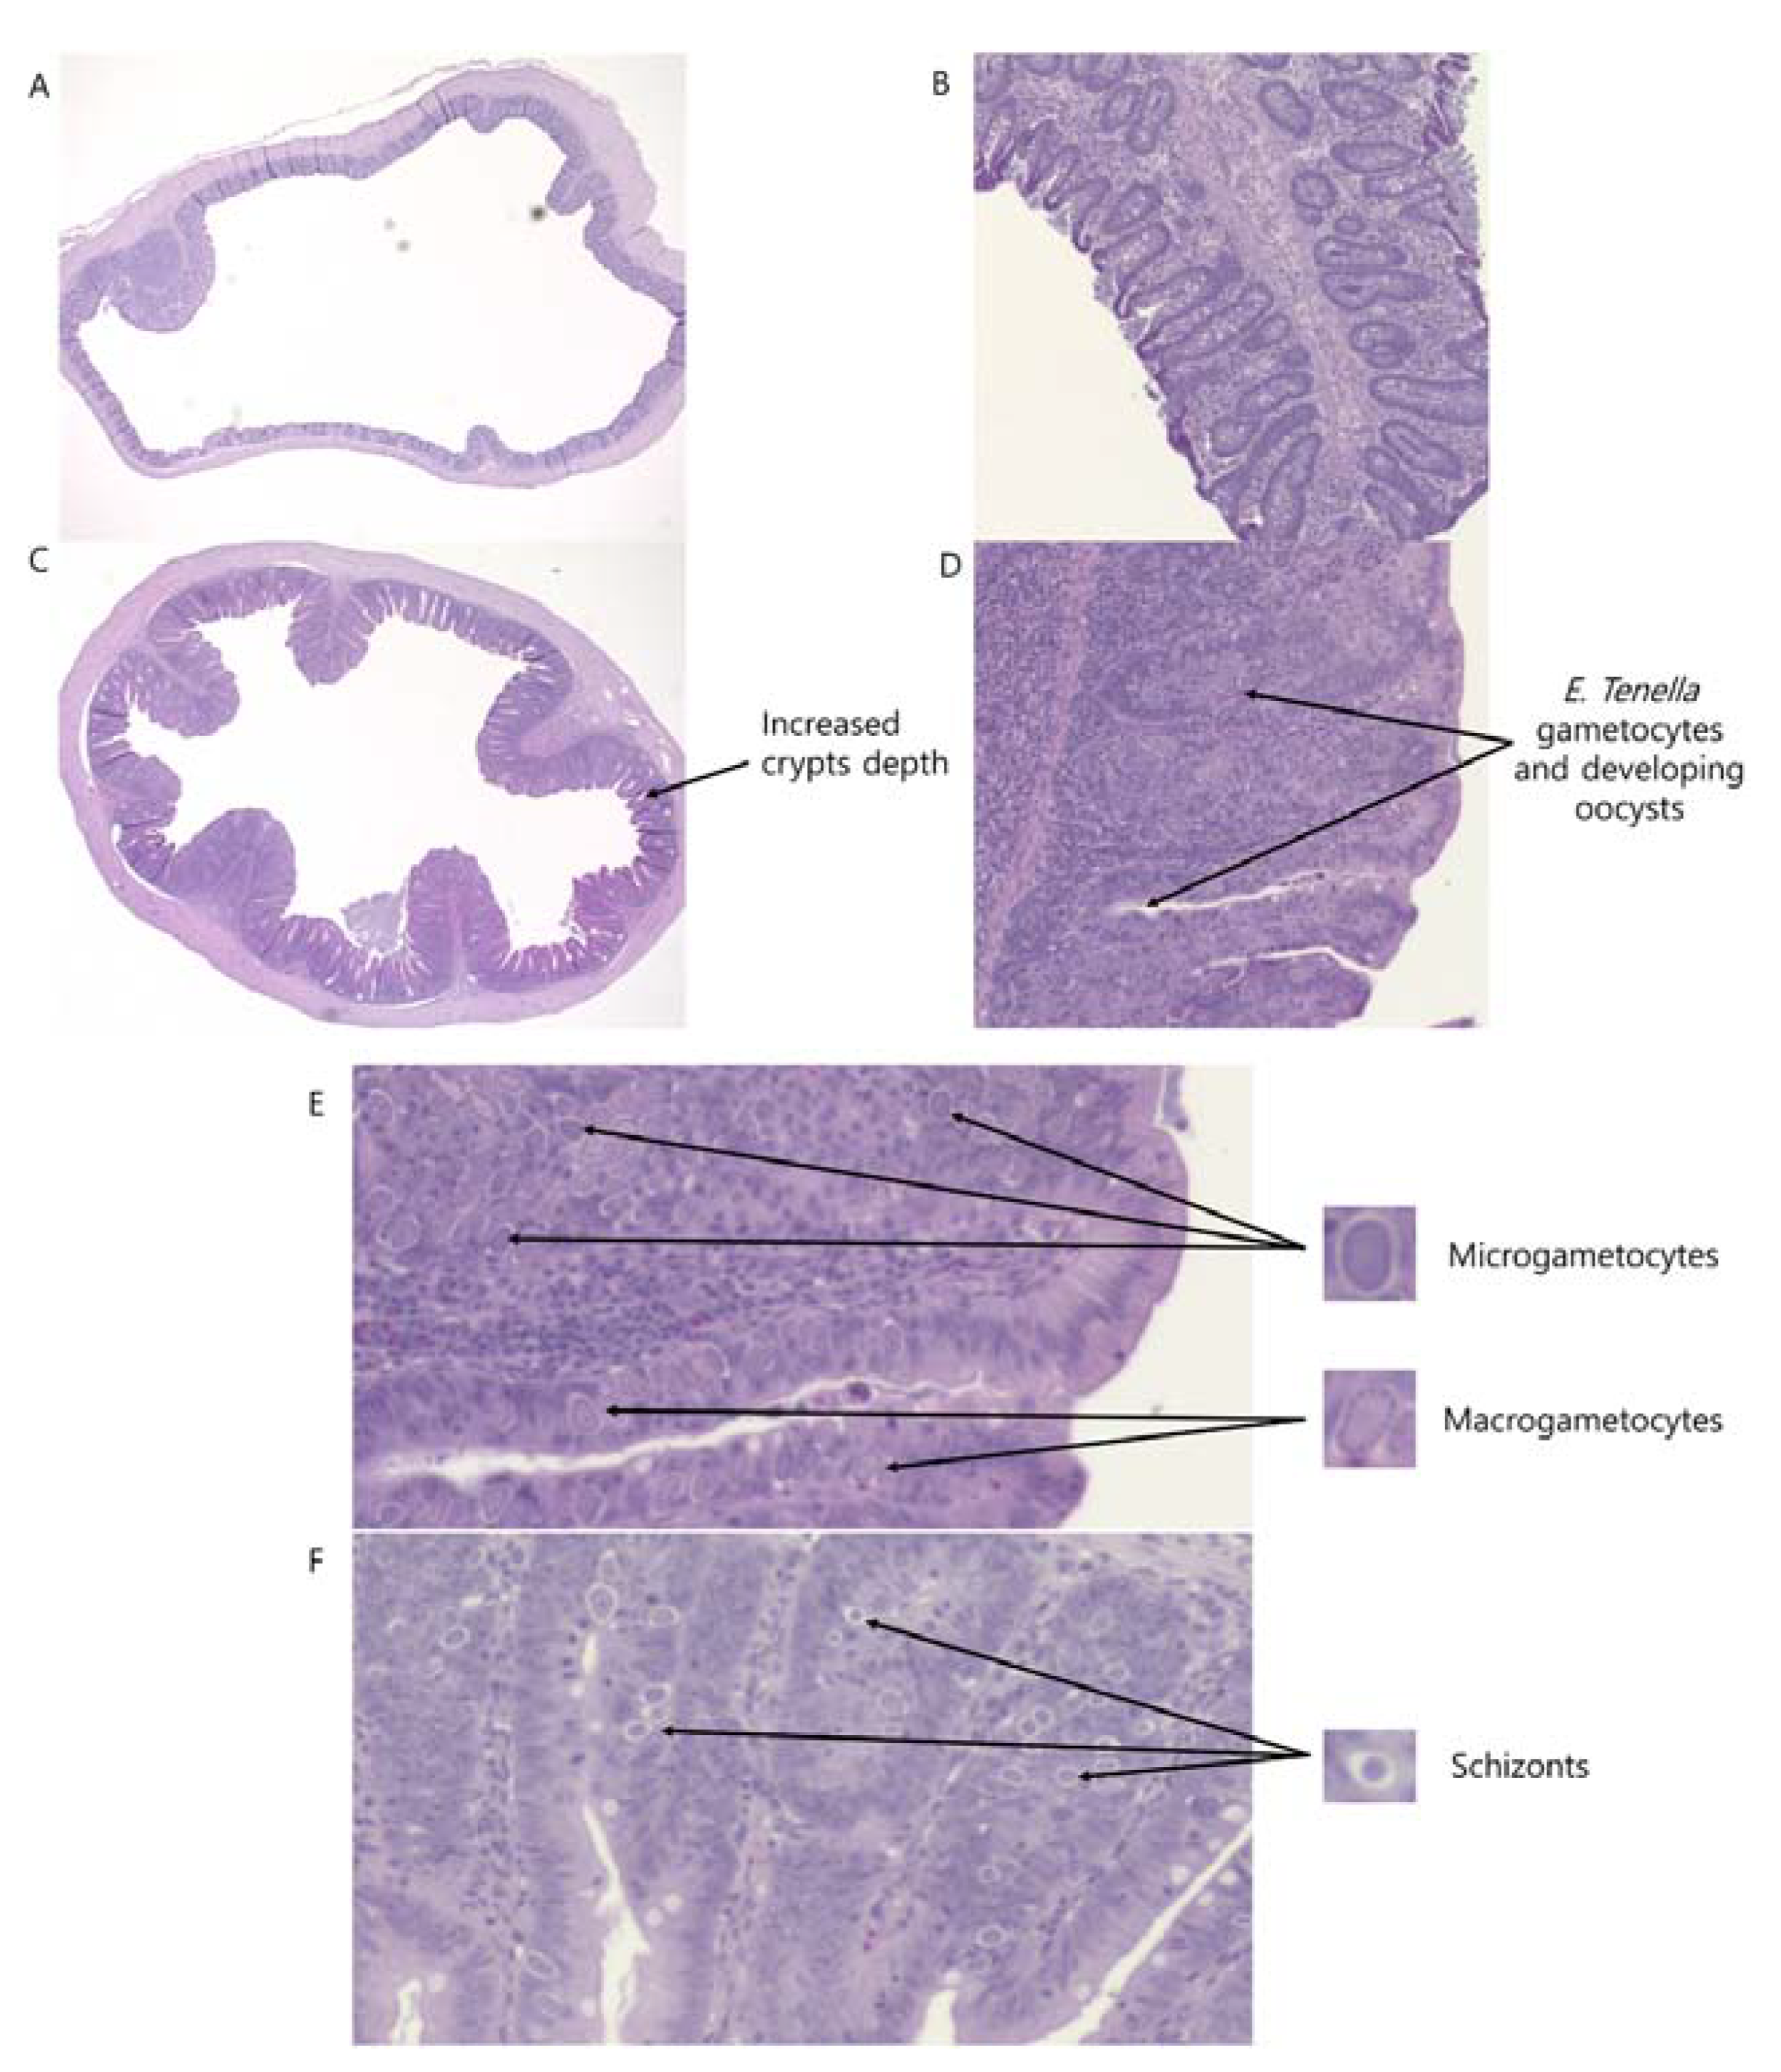
2.4. Intestinal Morphology

The fixed tissues in 10% neutral-buffered formalin were embedded in paraffin and cut into 4 µm, and hematoxylin and eosin (H&E) staining was conducted. The H&E-stained slides were read using a microscope (BZ-X810; Keyence, Osaka, Japan). The villus height (VH) and crypts depth (CD) of five well-oriented villi per section and their corresponding crypts for the five villi were measured for duodenum, jejunum, and ileum samples, and CD was measured for ceca samples by using ImageJ (National Institutes of Health, Bethesda, MD, USA). The ratios of VH to CD were calculated for each villus and crypt.

2.5. Apparent Ileal Digestibility

The concentrations of titanium dioxide in oven-dried samples (0.3 g for ileal digesta samples and 0.5 g for the feed sample) were analyzed according to Short et al. [21]. Dry matter (DM), organic matter (OM), and ash apparent ileal digestibility were determined according to Lin and Olukosi [22].

2.6. Liver Total Antioxidant Capacity (TAC)

Total antioxidant capacity (TAC) in the liver was measured using a commercial kit (QuantiCromAntioxidant Assay Kit; DTAC-100) (BioAssay Systems, Hayward, CA, USA). Approximately 100 mg of frozen liver samples were homogenized in 1 mL of PBS for 45 s using a beads beater and centrifuged at 10,000× g for 10 min. Aliquots of supernatants were taken for the analyses of protein content using the Pierce™ BCA Protein Assay Kit (Thermo Fisher Scientific, Cleveland, OH, USA) after 20 times dilution. Afterwards, TAC was measured according to the manufacture’s protocol without further dilutions. The absorbance was measured using SpectraMax® ABS Plus microplate reader (Molecular devices, San Jose, CA, USA). The TAC values were expressed as nM trolox quivalents/mg protein.

2.7. VFA Concentrations in Cecal Digesta

Concentrations of VFA in cecal digesta were analyzed according to Lourenco et al. [23]. Cecal samples were collected from birds on 6 and 9 dpi, and the samples were snap-frozen in liquid nitrogen and stored at −80 °C for further analyzes. Once thawed, samples were diluted and homogenized by placing 0.5 g into 3 mL of distilled water. The samples were vigorously homogenized for 1 min and subsequently frozen at −20 °C. After the samples were thawed, these were centrifuged at 10,000× g for 10 min, and 850 μL of supernatant were collected and mixed with 170 μL of the fresh 25% (wt/vol) meta-phosphoric acid solution, and immediately frozen at −20 °C overnight. The samples were centrifuged at 10,000× g for 10 min, and 800 μL of supernatant was collected and mixed with 1600 μL ethyl acetate. Samples were vigorously homogenized for 10 s and allowed to settle for 5 min. The top layer was transferred to a screw-thread vial and analyzed in a gas chromatograph (Shimadzu GC-2010 plus; Shimadzu Corporation, Kyoto, Japan) equipped with an autoinjector (AOC-20i; Shimadzu Corporation, Kyoto, Japan). A capillary column (Zebron ZB-FFAP; 30 m × 0.32 mm × 0.25 μm; Phenomenex Inc., Torrance, CA, USA) was used for the separation of the VFA. The sample injection volume was set at 1 mL, and helium was used as the carrier gas. The column temperature was initially set at 110 °C, and gradually increased to 200 °C over the course of 6 min. The flame ionization detector was set at 350 °C.

2.8. Statistical Analyses

Statistical analyses were performed using SAS (version 9.4; SAS Inst. Inc., Cary, NC, USA). Data normality was checked using proc univariate except for lesion score data. All groups were compared using proc mixed in a completely randomized design followed by Tukey’s comparison test. Kruskal–Wallis test followed by the Dwass, Steel, Critchlow-Fligner post hoc test was used to analyze lesion score data. Orthogonal polynomial contrasts were utilized to evaluate the significance of linear or quadratic effects of different E. tenella inoculation dosages, and the inoculation dosages of E. tenella were normalized by using the base 2 logarithm of the number of sporulated E. tenella number for orthogonal polynomial contrasts [19]. Statistical significance was set at p < 0.05, and trends (0.05 ≤ p ≤ 0.1) were also presented.

3. Results

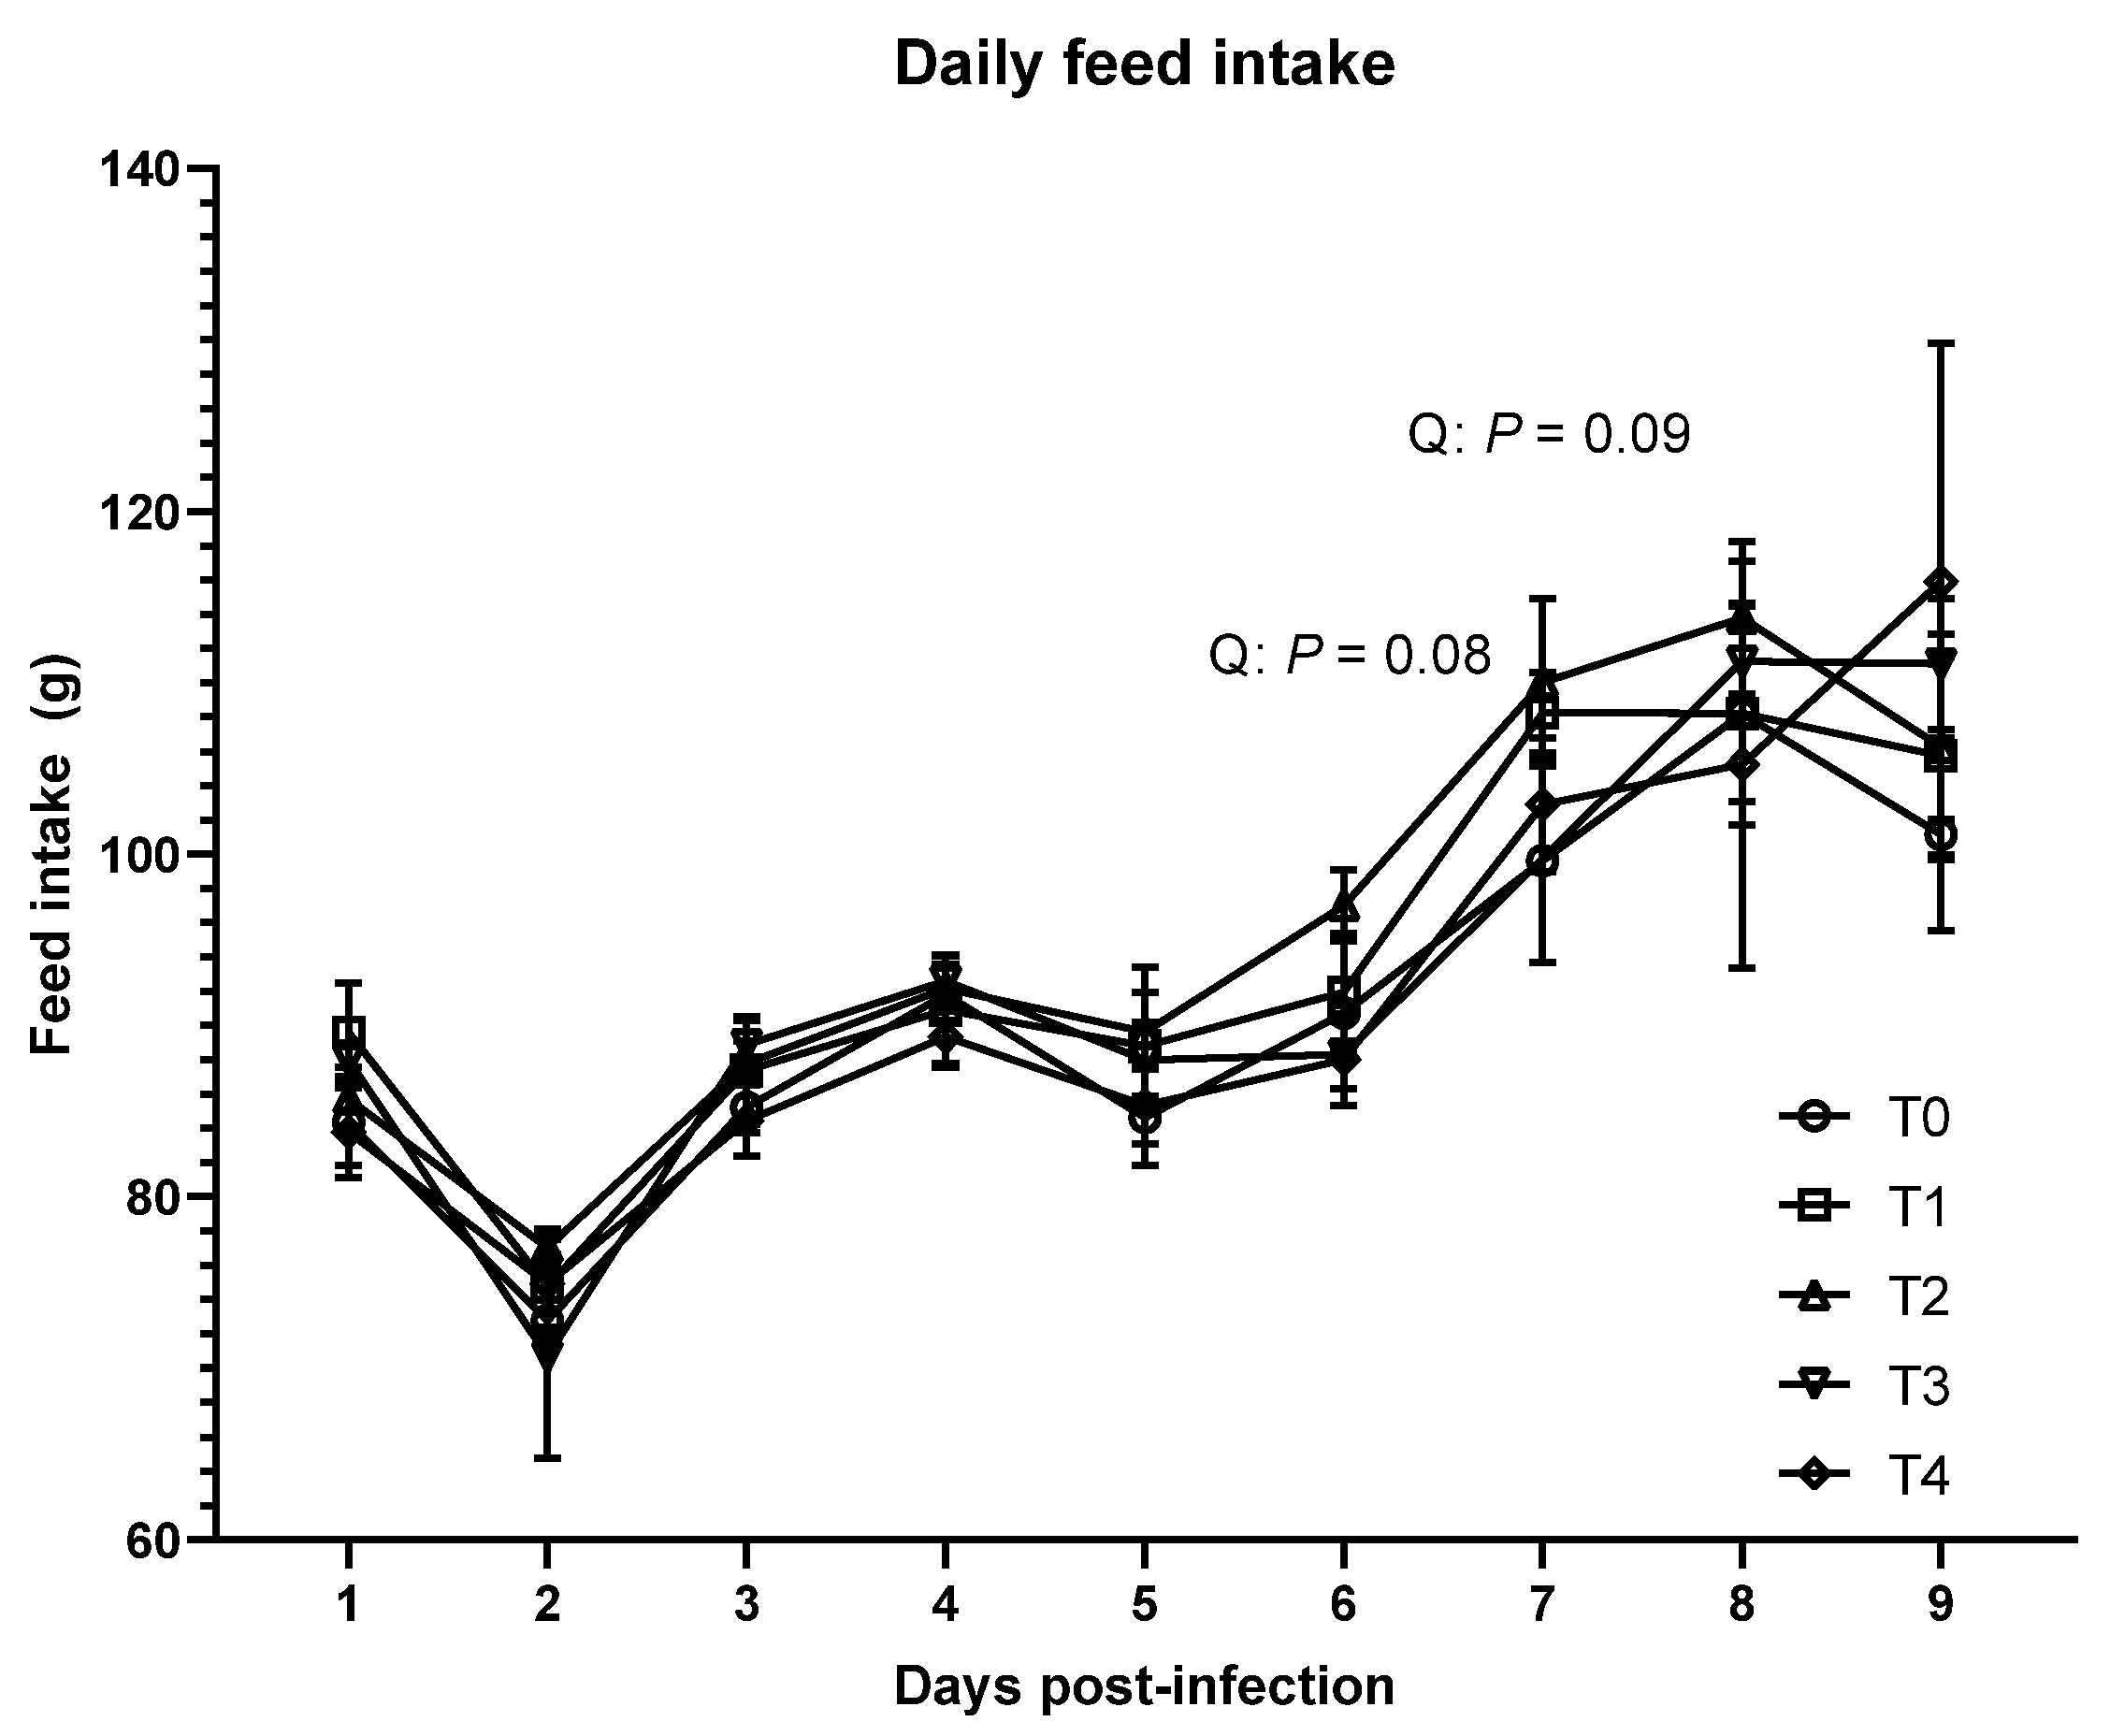
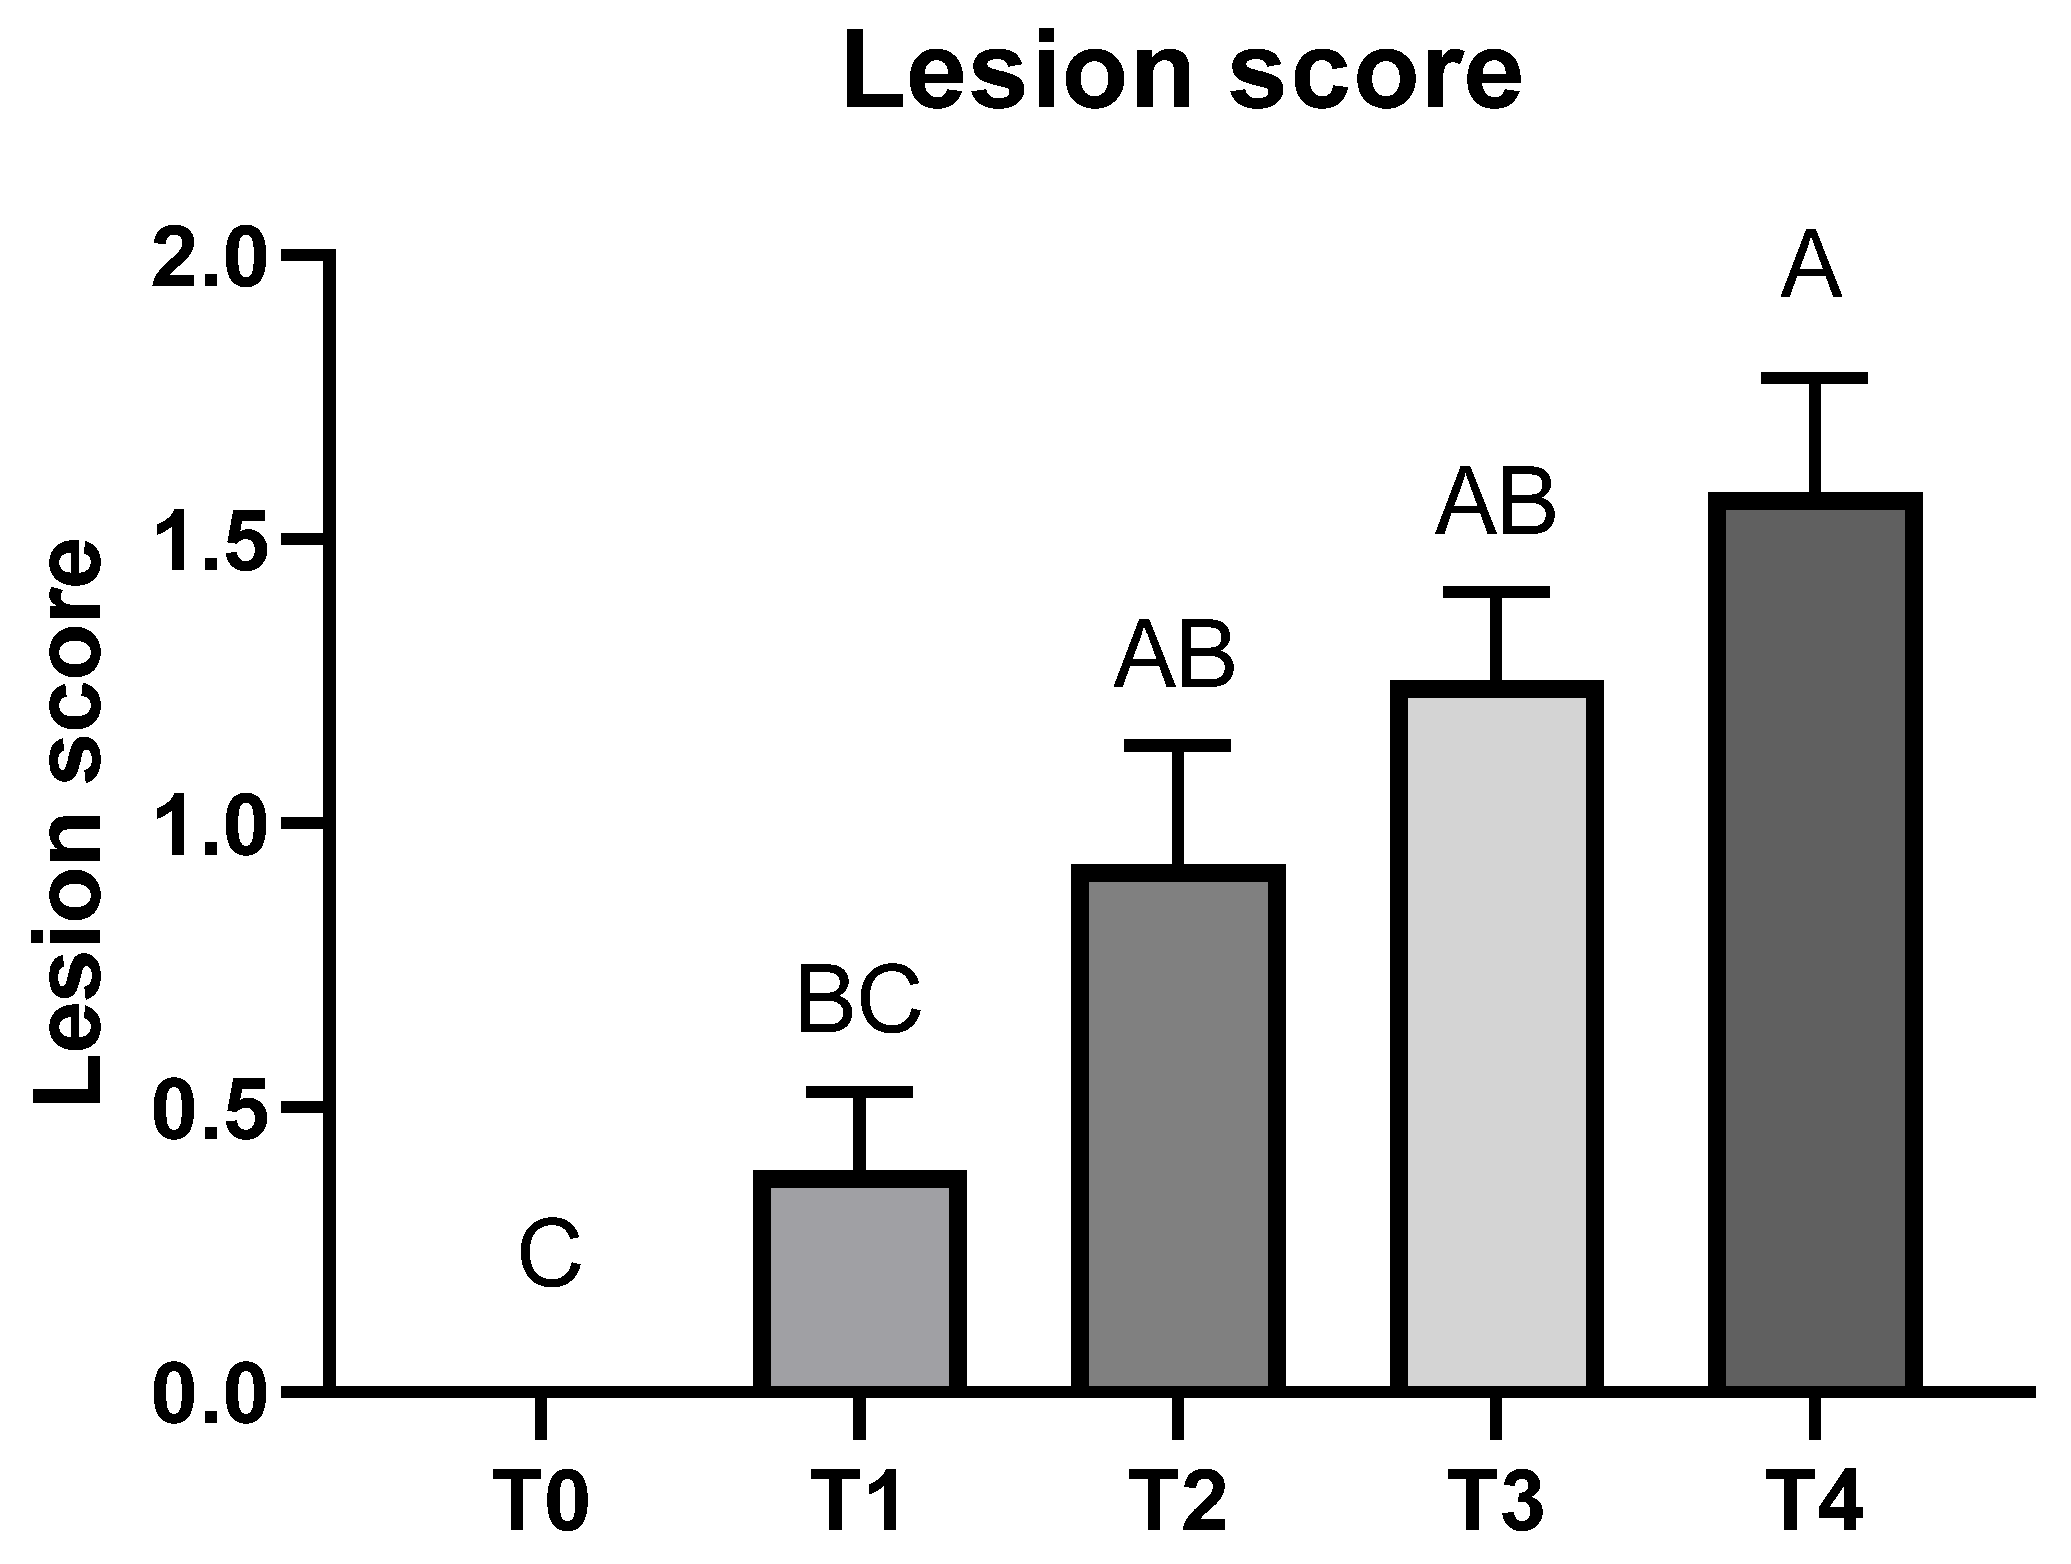
3.1. Growth Performance and Lesion Score

As shown in Table 2, no significant differences were observed in BW, ADG, and ADFI in the acute phase (p > 0.1) among the treatments. However, daily feed intake tended to quadratically increase on 6 dpi (p = 0.08) and 7 dpi (p = 0.09) due to E. tenella infection (Figure 1). In the acute phase, FCR was linearly increased due to the inoculation of E. tenella (p < 0.05). There were no significant differences in growth performance among the treatments in the recovery phase.
Cecal lesion due to E. tenella infection was not detected in the T0 group on 6 dpi (Figure 2). The T4 group had a higher lesion score compared to the T1 group (p < 0.05); lesion scores > 0 and <2 were also obtained in T1, T2, and T3 groups.

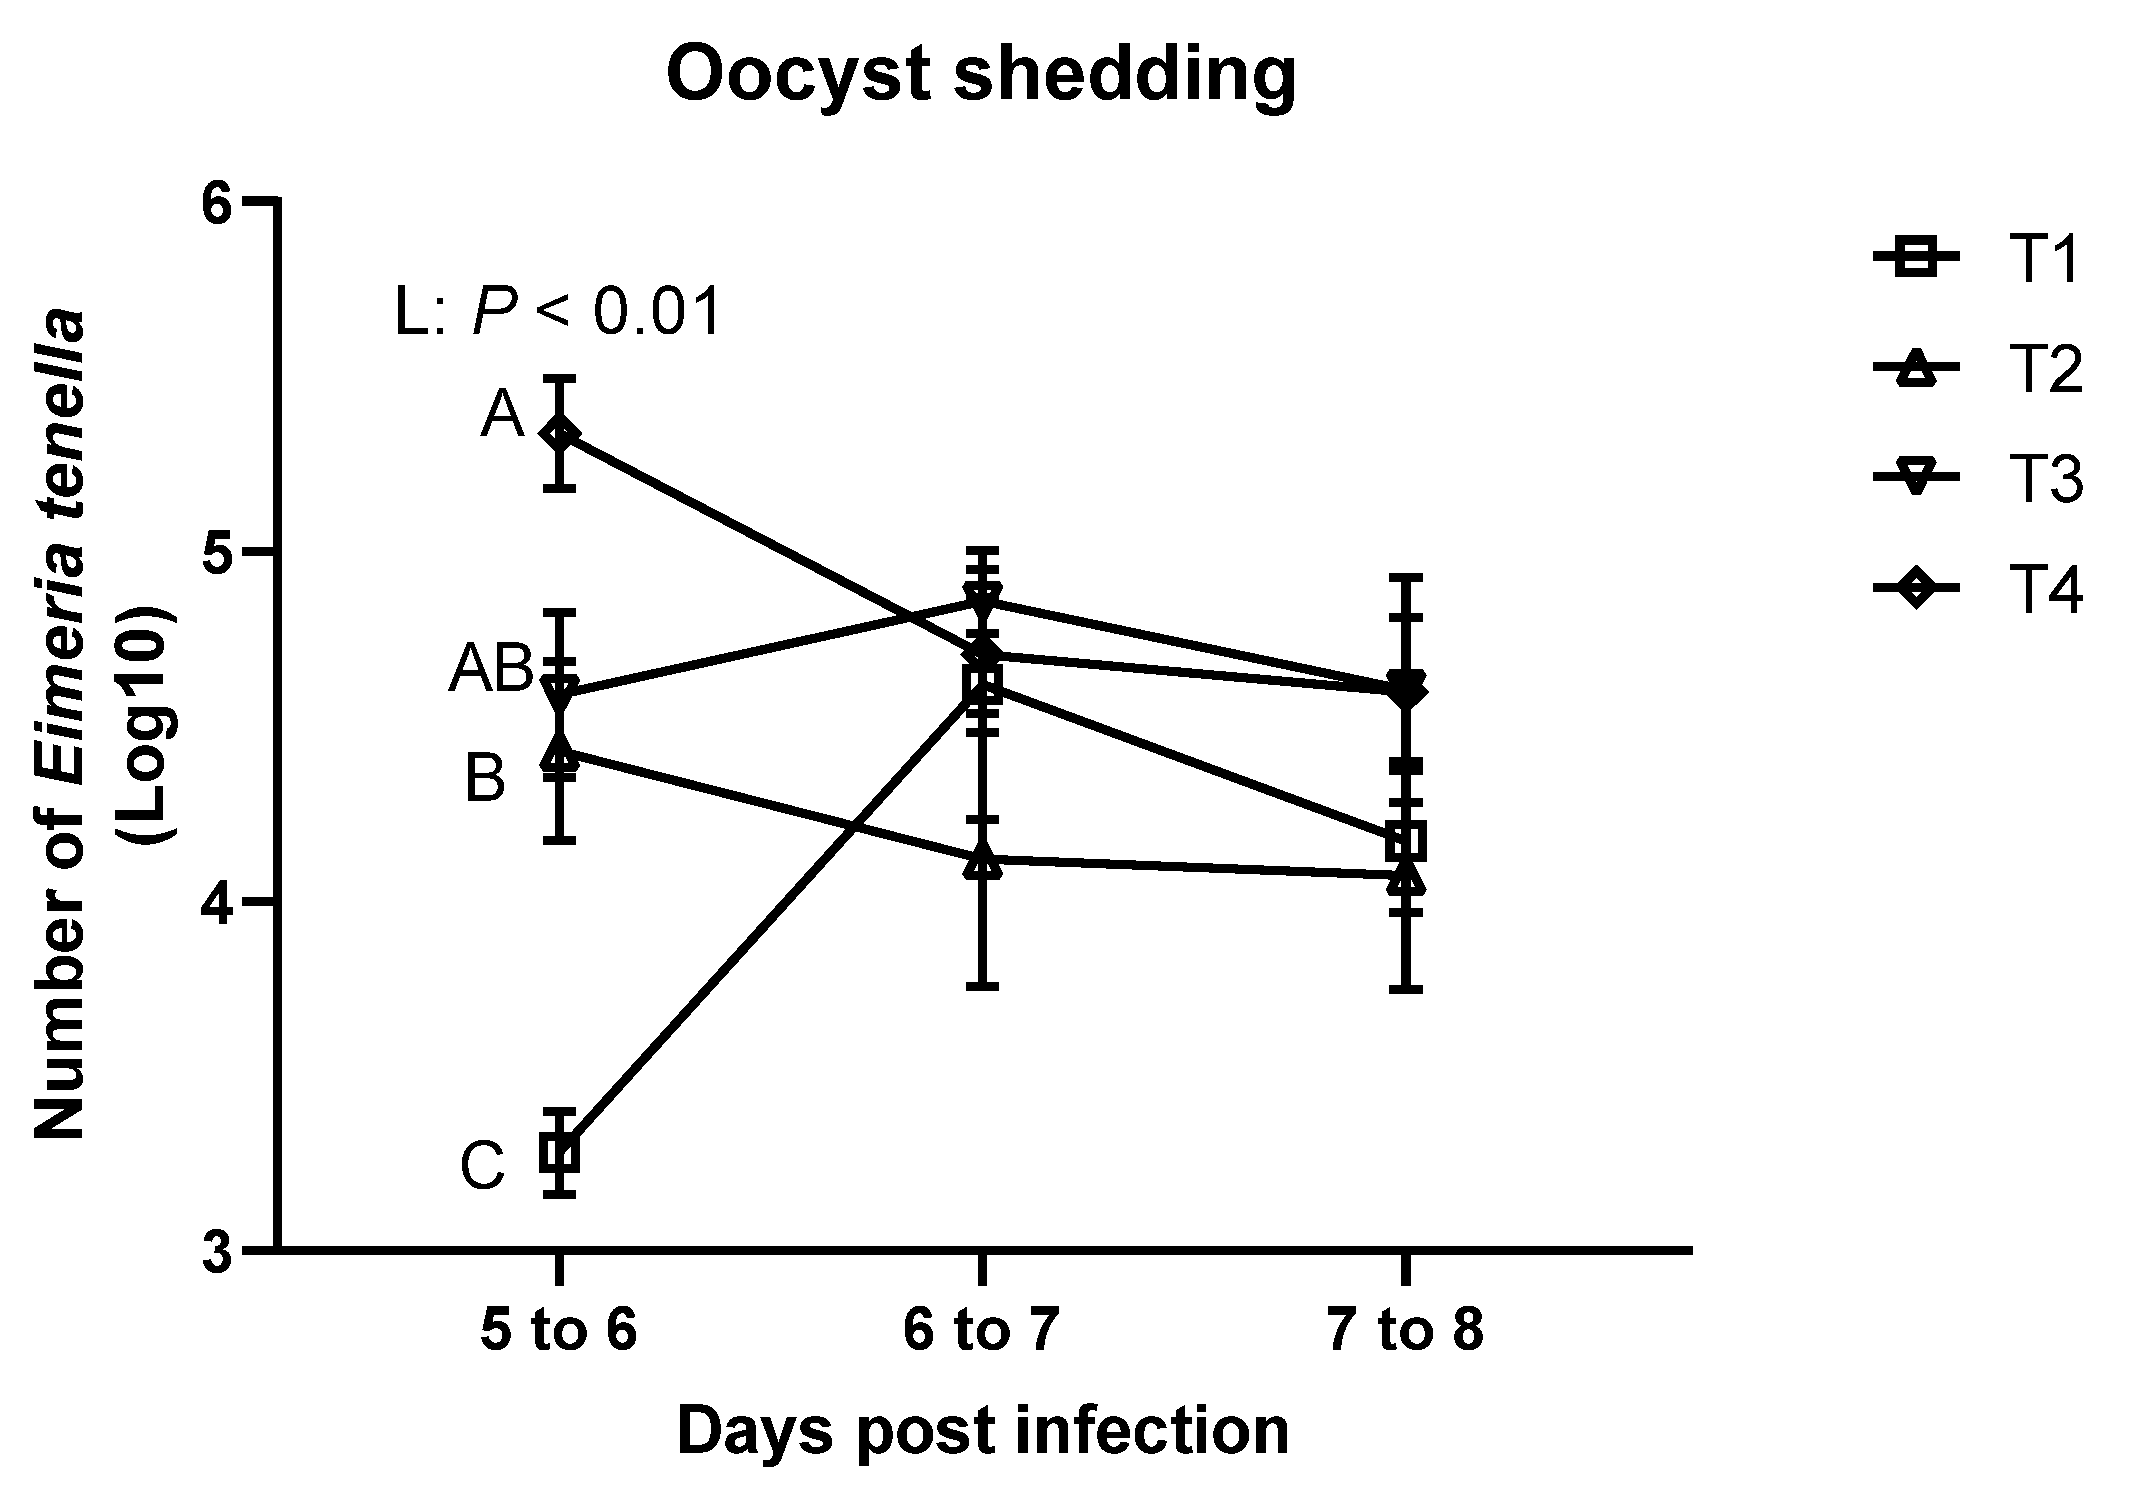
3.2. Oocyst Shedding and Fecal/ileal Moisture Content

As shown in Figure 3, E. tenella was not detected in the feces of the sham-challenged (T0) group at all time points. On 5 to 6 dpi, the T4 group had significantly higher oocyst shedding compared to T1 group, and E. tenella infection linearly increased oocyst shedding. However, there were no significant differences in oocyst shedding among the treatments on 6 to 7 dpi and 7 to 8 dpi.
As shown in Table 3, Fecal moisture content was modulated due to E. tenella infection on 7 to 8 dpi (p < 0.05). Fecal moisture content was quadratically decreased on 5 to 6 dpi (p < 0.05), and quadratically increased on 6 to 7 dpi (p < 0.05) due to E. tenella infection. E. tenella infection linearly increased fecal moisture content on 7 to 8 dpi (p < 0.05). On 6 dpi, E. tenella infection altered ileal moisture content, and ileal moisture content was linearly decreased on 6 dpi due to E. tenella infection (p < 0.05).

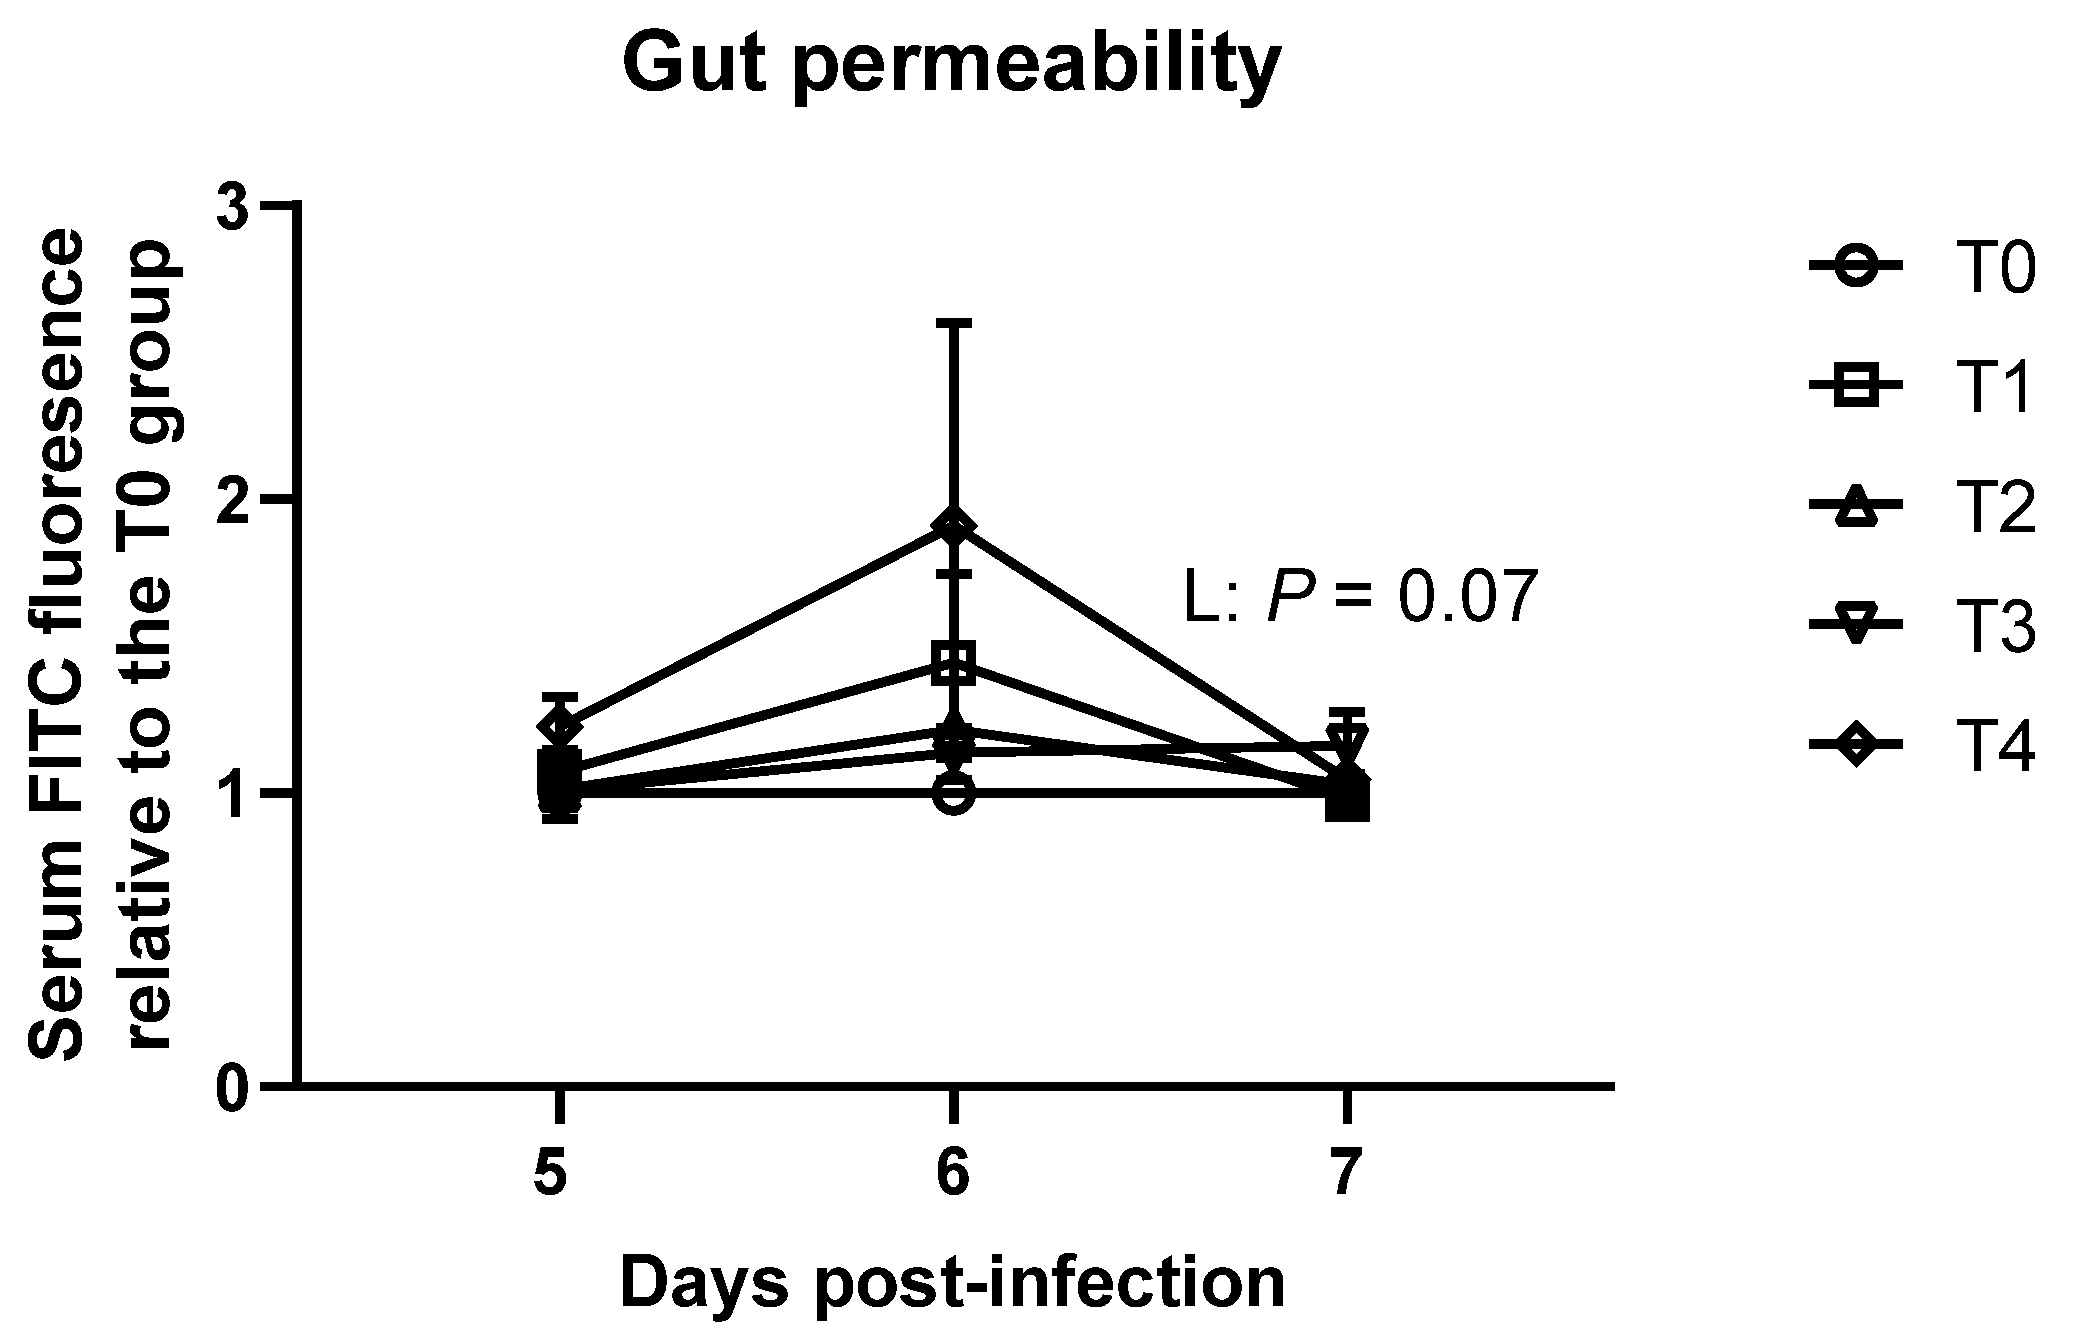
3.3. Gastrointestinal Permeability

No significant differences in gastrointestinal permeability were observed on 5 dpi and 6 dpi (Figure 4). However, gastrointestinal permeability tended to be linearly increased (p = 0.07). However, the numerically highest group, T4, had only 1.16 folds FITC fluorescence compared to the T0 group.

3.4. Intestinal Morphology and Apparent Ileal Digestibility

As shown in Table 4, E. tenella infection linearly (p < 0.05) and quadratically (p < 0.05) increased cecal CD, whereas the sham-challenged group had the lowest cecal CD compared to the E. tenella challenged groups on 6 dpi (p < 0.05). On 6 dpi, ileal CD showed a tendency to be linearly reduced (p = 0.06), and ileal VH:CD tended to be increased (p = 0.08) due to E. tenella infection. On 9 dpi, the inoculation of E. tenella tended to linearly decrease duodenal VH (p = 0.1) and jejunal VH (p = 0.09). The T0 group had lower cecal CD compared to T2, T3, and T4 groups (p < 0.05), and E. tenella infection linearly (p < 0.05), and quadratically (p < 0.05) increased cecal CD. As shown in Figure 5, cecal CD were deepened, and gametocytes and developing oocysts were observed in the ceca of broiler chickens infected E. tenella.
In broiler chickens infected E. tenella, crypts were deepened and gametocytes and developing oocysts were observed.
There were no significant differences in the ileal apparent digestibility of DM, OM, and ash among treatments on 6 dpi and 9 dpi (p > 0.1; Table 5).

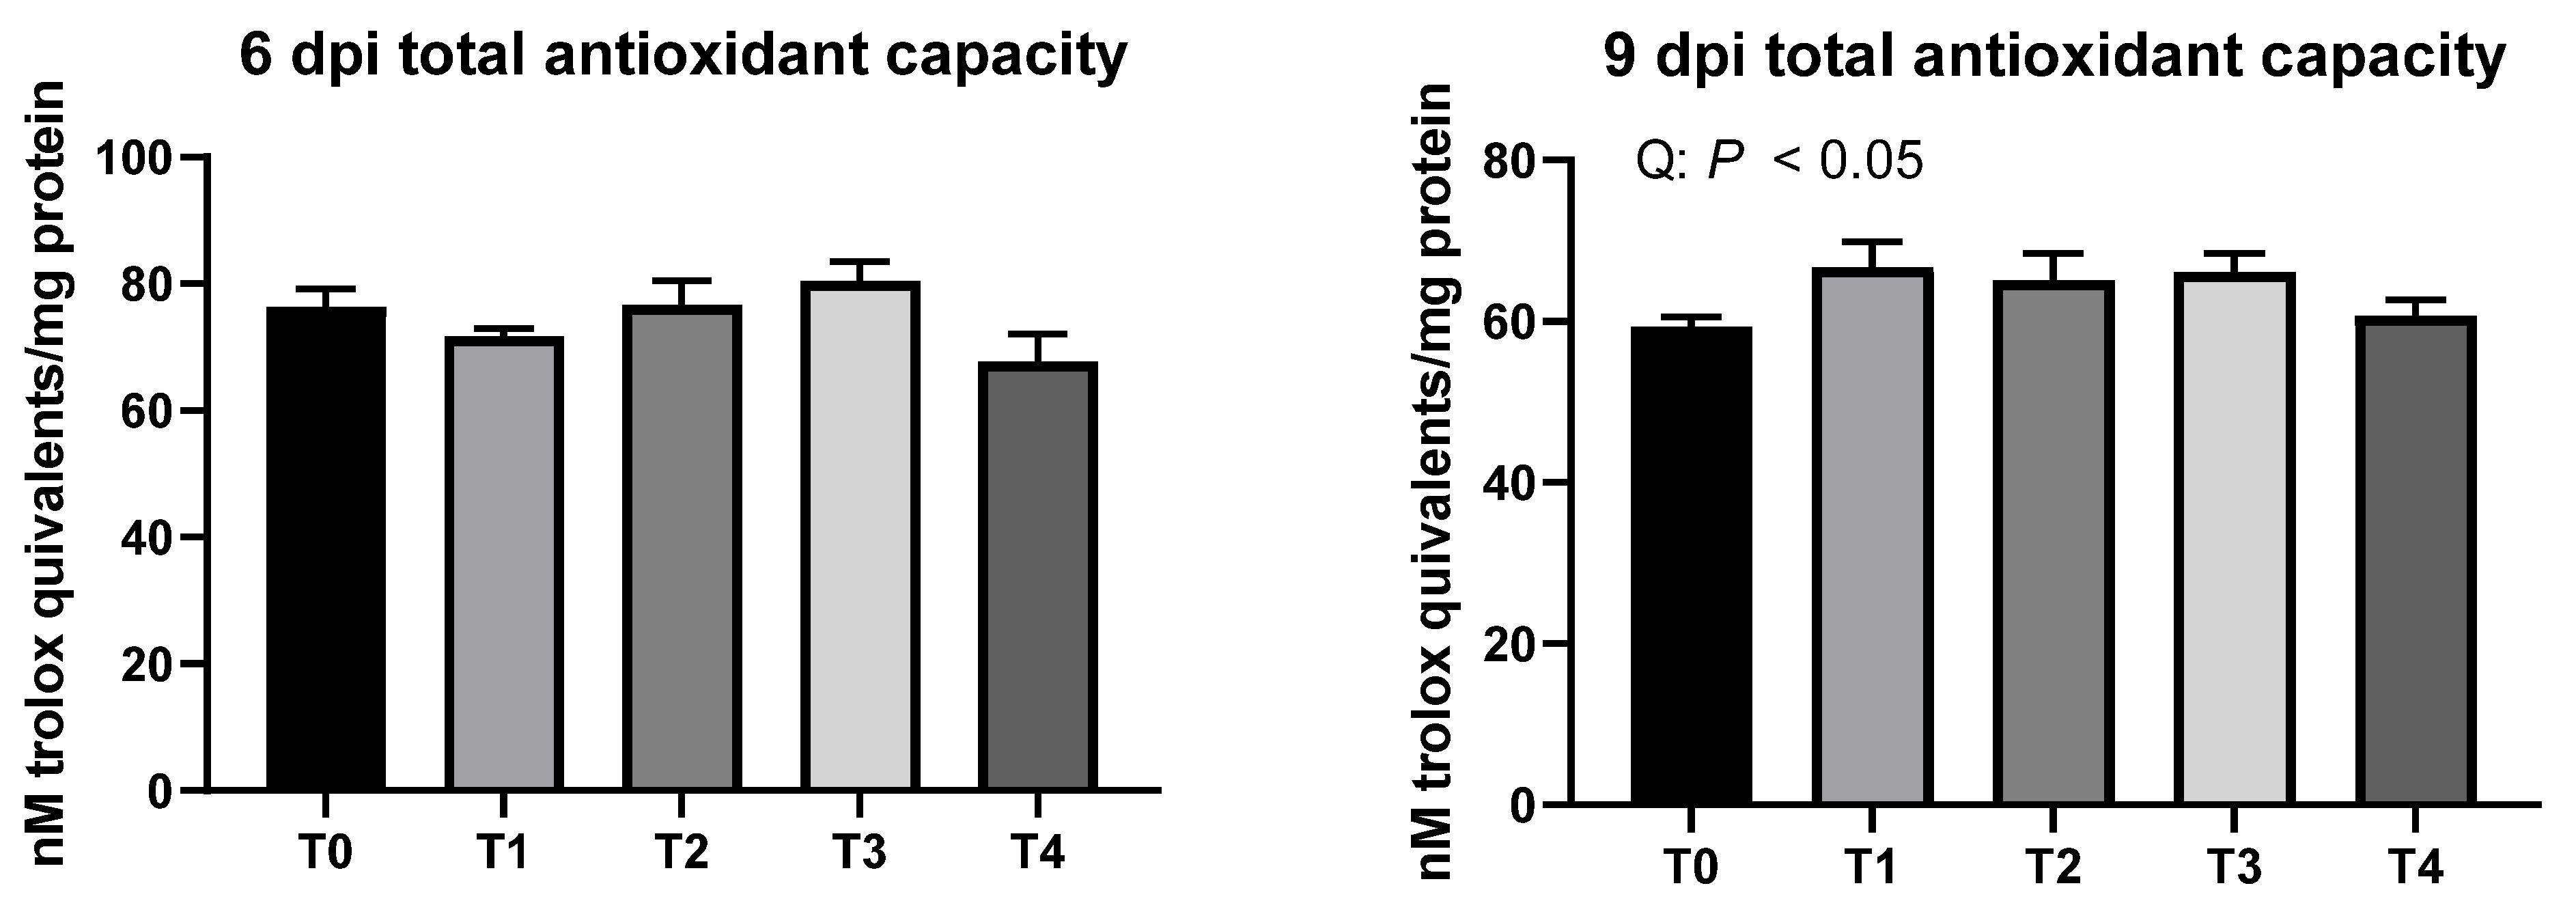
3.5. Liver Total Antioxidant Capacity (TAC)

As shown in Figure 6, liver TAC was not modulated due to E. tenella infection in broiler chickens (p > 0.1) on 6 dpi. However, different inoculation dosages of E. tenella quadratically increased liver TAC on 9 dpi (p < 0.05).

3.6. VFA Concentrations in Cecal Digesta

As shown in Table 6, infection of E. tenella linearly decreased acetate concentration in ceca contents (p < 0.05), and the T4 group had significantly lower acetate concentration in ceca contents compared to the T0 group. Isobutyrate concentration in ceca contents was linearly decreased (p < 0.05) on 6 dpi as E. tenella dosage increased. Total VFA were linearly decreased due to E. tenella infection (p < 0.05), and the T4 group had significantly lower total VFA compared to the T0 group on 6 dpi. On 9 dpi, E. tenella tended to linearly decrease butyrate (p = 0.09), and significantly decreased valerate concentrations (Linear; p < 0.05) in ceca contents. The T0 group had significantly lower propionate compared to the T1 group, and T4 birds had significantly lower varelate compared to the T1 group.

4. Discussion

The purpose of the study was to investigate the effects of different inoculation dosages of E. tenella on growth performance, gastrointestinal permeability, oocyst shedding, intestinal morphology, fecal consistency, ileal apparent digestibility, antioxidant capacity, and cecal VFA profile in broiler chickens. Inoculation dosages were derived from our previous study [19], and the same strain of E. tenella was used. However, in the current study, milder infection (lesion score of T4: 1.6) was achieved compared to our previous study (lesion score of the T4 equivalent group: 2.7). The potential reason for milder infection would be that broilers were challenged with three different Eimeria spp. (E. acervulina, E. maxima, and E. tenella) in the previous study, which probably caused more severe infection by compensating the immune system in birds compared to the single species challenging in the current study. Mild-infection models are important to test a new bioactive compound because if the compounds do not show any beneficial effects at the mild infection model, they may not show any beneficial effects against coccidiosis at severe infection model either. In the present study, E. tenella infection decreased feed efficiency during the acute phase and increased feed intake on 6 and 7 dpi. These data are partially consistent with previous studies [24,25] which reported that FCR was increased along with reduced BW of broilers. In our current study, however, E. tenella infection increased FCR by increasing the feed intake of birds, whereas BW was also numerically (p = 0.16) decreased with a linear trend during the acute phase. Impaired feed efficiency in broilers infected with E. tenella during the acute phase in the present study would be associated with reduced acetate and total VFA production in the ceca. Acetate is the most abundant VFA, which are produced via bacterial fermentation in the ceca of broilers [26]. It is already well-established that E. tenella infection can negatively affect cecal microbiome, which results in depressed VFA production in broilers according to many previous studies [27,28]. Cecal VFA production affects the host’s energy balance because VFA are important energy substrates for the host [29]. Gasaway [30] mentioned that VFA supply approximately 11% to 18% of the total energy production in chickens. In addition, Eimeria spp. compete for energy and nutrients for their asexual and sexual replications with the host [31]. Reduced available energy in the body can result in reduced BW or increased FCR by raising feed intake of the birds to decrease maintenance energy requirements or to meet the energy requirements, respectively [32]. In addition, reduced production of acetate, which can induce the secretion of satiety-stimulating hormones from the gut, could increase the feed intake of the birds [33]. Therefore, in this study, reduced VFA production in ceca due to E. tenella infection potentially reduced available energy levels in the body, and this increased feed intake and FCR to supply more energy to meet the energy requirements in broiler chickens infected with E. tenella.
This study showed that E. tenella infection deepened crypts depth of the ceca. The potential reasons for increased cecal crypts depth due to E. tenella infection are still unclear. It is proposed that E. tenella increased cecal CD (mucosa layer) to make their habitats in the ceca, or ceca crypts were deepened to increase VFA absorption because VFA production was restricted due to E. tenella infection. Nevertheless, deepened CD could inhibit the production and absorption of VFA in the ceca. Increased CD possibly turned in increased total goblet cells in the ceca and mucus secretion into the cecal contents. This possibly reduced concentration of VFA and modulated VFA production in ceca content by affecting microbiome of the broiler chickens. Ceca only have villi at the entrance of the ceca to filter large particles away and to act as an immunological detector of cecal contents [34,35], and middle and distal parts of the ceca only have smooth mucous membrane without villi [36]. Thereby, another possible reason for increased CD in broilers infected with E. tenella would be that birds increased CD to let crypts function like villi as a defensive mechanism in the proximal ceca because E. tenella infected ceca are vulnerable for further infections (e.g., bacterial infection).
We also hypothesized that impaired ceca health due to E. tenella infection may indirectly affect small intestinal health (the main area for nutrient digestion and absorption) by causing energy deficiency and inducing oxidative stress, and this may account for decreased feed efficiency in the current study. Nevertheless, no differences were observed in DM, OM, and ash apparent ileal digestibility among the treatments on 6 and 9 dpi in the current study. According to our previous study, E. maxima infection significantly decreased nutrient digestibility in broiler chickens, which indicates that different Eimeria spp. affect nutrient digestibility of broilers differently [5]. Liver total antioxidant capacity was same among the treatments on 6 dpi and even increased in broilers infected with E. tenella on 9 dpi, potentially because mild infection of E. tenella may allow birds to stimulate their antioxidant defensive system. Still, over-production of antioxidants (enzymatic and non-enzymatic) can result in over-use of energy and nutrients, which also may decrease available energy and nutrients for growth in chickens. However, a previous study by Georgieva et al. [25] reported that severe E. tenella infection model decreased antioxidant capacity of broilers. Ileal crypt depth was decreased, and ileal VH:CD was increased without affecting VH in E. tenella infected broilers in the current study. Probably, ileal morphology was enhanced with limited energy and nutrients sources as a compensation mechanism because cecal functionality was restricted due to E. tenella in the current study. There were negative effects of E. tenella on duodenal and jejunal morphology on 9 dpi and gastrointestinal permeability on 7 dpi. Energy and absorbed VFA play an important role in gut development in broiler chickens by stimulating gut epithelial cell proliferation [9]. In this study, reduced cecal VFA production would be the main factor that negatively affected gut health of E. tenella infected broilers rather than increased pathogens and toxin production because liver health was maintained in broilers infected with E. tenella. Whereas it cannot be concluded that impaired intestinal health caused impaired feed efficiency during the acute phase, energy deficiency due to poor VFA yield subsequently damaged intestinal health of broilers infected with E. tenella. Moreover, while differences were observed in gastrointestinal permeability, it was only less than two-fold difference. Our previous study [37] reported that more than 200 folds differences of gastrointestinal permeability were observed due to E. maxima infection. Hence, reduced VFA production in the ceca due to E. tenella infection caused energy deficiency in the body, which resulted in compensated gut health in broiler chickens.
In this study, different E. tenella inoculation dosages linearly increased oocyst shedding on 5 to 6 dpi, which implies that the higher inoculation dosages can results in higher oocyst shedding. Nonetheless, these data could be obtained in our study because our E. tenella strain induced mild-infection (lesion score below 2) in the ceca. Williams [38] demonstrated that higher inoculation dosage levels can linearly increase oocyst yields until reaching to the crowded dosages (e.g., maximally producing dosage), and higher dosages than the crowded dosages can decrease oocyst yields in broilers. However, no differences were observed on 6 to 7 dpi and 7 to 8 dpi in the current study. The current result also demonstrated that different challenge dosages of E. tenella have different peak point of shedding. The potential reason would be that higher number of E. tenella possibly decreased number of generation within the asexual and sexual stages of the life [35], which resulted in an earlier peak date for the highest dosage group in the study. Our study was the first to find that different E. tenella inoculation dosages resulted in different peak points for oocyst yields in the mildly infected broilers. Oocyst yields in severely infected (E. tenella lesion score 3 to 4) broilers at different time points should be investigated further.
Ileal and fecal moisture contents were modulated due to Eimeria infection in the current study. Ileal (6 dpi) and fecal moisture contents (5 to 6 dpi) were quadratically and linearly decreased, respectively. Afterwards, fecal moisture content was increased on 6 to 8 dpi. E. tenella are known to induce diarrhea containing mucus and blood. Although obvious bloody diarrhea was not achieved in the current study, fecal moisture content was increased after 6 dpi. Potentially, E. tenella damaged enterocytes in the ceca and modulated microbiota, and this caused electrolyte imbalance in the ceca which may explain the modulated ileal and fecal moisture contents in the current study [39]. Moreover, ceca play a crucial role in water absorption [40], and water absorption ability of the ceca of birds infected with E. tenella would be limited potentially due to thickened mucosa layer in the current study. Hypothetically, higher water loss due to E. tenella infection increased water intake [40] as birds increased their feed intake to compensate energy deficiency in the current study. In addition, increased fecal moisture content can result in increased litter moisture, and this can increase the incidence of food pad dermatitis in broilers [41].
This current study showed that mild infection of E. tenella impaired feed efficiency and gut health mainly through reducing VFA production in broilers. Thereby, supplementation of VFA or bioactive compounds that has high energy values and antimicrobial effects (e.g., medium chain fatty acids) can control mild-infection of E. tenella in broilers [11,42].

5. Conclusions

Orthogonal polynomial contrasts showed that E. tenella mild-infection reduced VFA production in the ceca, and this caused energy deficiency, which increased feed intake and impaired feed efficiency of broiler chickens. This suggests that the cecal VFA concentrations could be a key parameter to represent feed efficiency and E. tenella infection severity in broiler chickens. Furthermore, mild-infection of E. tenella modulated intestinal morphology, antioxidant capacity, and gastrointestinal permeability in the recovery phase. Different inoculation dosages of E. tenella changed oocyst shedding patterns and ileal/fecal moisture content. These current data showed that the mechanisms of E. tenella impair feed efficiency and gut health of broilers, which will be beneficial to study strategies to cope with E. tenella infection in broiler chickens. Based on the current study, 25,000 to 50,000 sporulated oocyst dosage range would be recommended as subclinical models for nutritional strategies.

Author Contributions

Conceptualization, J.C. and W.K.K.; methodology, J.C., P.-Y.T., J.M.L., T.R.C. and W.K.K.; validation, P.-Y.T., J.M.L., T.R.C. and W.K.K.; investigation, J.C., H.K. and Y.H.T.; data curation, J.C.; writing—original draft preparation, J.C.; writing—review and editing, H.K., Y.H.T., P.-Y.T., J.M.L. and W.K.K.; visualization, J.C. supervision, T.R.C. and W.K.K.; project administration, W.K.K. All authors have read and agreed to the published version of the manuscript.

Funding

This research received no external funding.

Institutional Review Board Statement

This study was approved by the Institutional Animal Care and Use committee of the University of Georgia (A2018 09-006, approved on 16 January 2019).

Informed Consent Statement

Not applicable.

Data Availability Statement

The data presented in this study are available on request from the corresponding author. The data are not publicly available due to further statistical analysis.

Acknowledgments

We appreciated Brett Marshall for his help with the gastrointestinal permeability measurement and Taylor Rae Krause for her help with the VFA analysis. The authors appreciate Alberta L. Fuller for providing the E. tenella strain for this study.

Conflicts of Interest

The authors declare no conflict of interest.

References

  1. Blake, D.P.; Knox, J.; Dehaeck, B.; Huntington, B.; Rathinam, T.; Ravipati, V.; Ayoade, S.; Gilbert, W.; Adebambo, A.O.; Jatau, I.D. Re-calculating the cost of coccidiosis in chickens. Vet. Res. 2020, 51, 1–14. [Google Scholar] [CrossRef] [PubMed]
  2. Choi, J.; Kim, W.K. Dietary application of tannins as a potential mitigation strategy for current challenges in poultry production: A review. Animals 2020, 10, 2389. [Google Scholar] [CrossRef]
  3. Vermeulen, A.; Schaap, D.; Schetters, T.P. Control of coccidiosis in chickens by vaccination. Vet. Parasitol. 2001, 100, 13–20. [Google Scholar] [CrossRef]
  4. López-Osorio, S.; Chaparro-Gutiérrez, J.J.; Gómez-Osorio, L.M. Overview of poultry Eimeria life cycle and host-parasite interactions. Front. Vet. Sci. 2020, 7, 384. [Google Scholar] [CrossRef] [PubMed]
  5. Teng, P.-Y.; Yadav, S.; Shi, H.; Kim, W.K. Evaluating endogenous loss and standard ileal digestibility of amino acids in response to the graded severity levels of E. maxima infection. Poult. Sci. 2021, 100, 101426. [Google Scholar] [CrossRef]
  6. Gaboriaud, P.; Sadrin, G.; Guitton, E.; Fort, G.; Niepceron, A.; Lallier, N.; Rossignol, C.; Larcher, T.; Sausset, A.; Guabiraba, R. The absence of gut microbiota alters the development of the apicomplexan parasite Eimeria tenella. Front. Cell. Infect. Microbiol. 2020, 10, 926. [Google Scholar] [CrossRef]
  7. Zaman, M.A.; Iqbal, Z.; Abbas, R.Z.; Khan, M.N. Anticoccidial activity of herbal complex in broiler chickens challenged with Eimeria tenella. Parasitology 2012, 139, 237–243. [Google Scholar] [CrossRef] [PubMed]
  8. Cason, J.; Hinton, A., Jr.; Northcutt, J.; Buhr, R.; Ingram, K.; Smith, D.; Cox, N. Partitioning of external and internal bacteria carried by broiler chickens before processing. J. Food Prot. 2007, 70, 2056–2062. [Google Scholar] [CrossRef] [PubMed]
  9. Shang, Y.; Kumar, S.; Oakley, B.; Kim, W.K. Chicken gut microbiota: Importance and detection technology. Front. Vet. Sci. 2018, 5, 254. [Google Scholar] [CrossRef]
  10. Józefiak, D.; Rutkowski, A.; Martin, S. Carbohydrate fermentation in the avian ceca: A review. Anim. Feed Sci. Technol. 2004, 113, 1–15. [Google Scholar] [CrossRef]
  11. Zhang, J.-M.; Sun, Y.-S.; Zhao, L.-Q.; Chen, T.-T.; Fan, M.-N.; Jiao, H.-C.; Zhao, J.-P.; Wang, X.-J.; Li, F.-C.; Li, H.-F. SCFAs-induced GLP-1 secretion links the regulation of gut microbiome on hepatic lipogenesis in chickens. Front. Microbiol. 2019, 10, 2176. [Google Scholar] [CrossRef] [Green Version]
  12. Broom, L.J. Evidence-based consideration of dietary ‘alternatives’ to anticoccidial drugs to help control poultry coccidial infections. Worlds Poult. Sci. J. 2021, 77, 43–54. [Google Scholar] [CrossRef]
  13. Noack, S.; Chapman, H.D.; Selzer, P.M. Anticoccidial drugs of the livestock industry. Parasitol. Res. 2019, 118, 2009–2026. [Google Scholar] [CrossRef] [PubMed] [Green Version]
  14. Blake, D.P.; Tomley, F.M. Securing poultry production from the ever-present Eimeria challenge. Trends Parasitol. 2014, 30, 12–19. [Google Scholar] [CrossRef] [Green Version]
  15. Giannenas, I.; Florou-Paneri, P.; Papazahariadou, M.; Christaki, E.; Botsoglou, N.; Spais, A. Effect of dietary supplementation with oregano essential oil on performance of broilers after experimental infection with Eimeria tenella. Arch. Anim. Nutr. 2003, 57, 99–106. [Google Scholar] [CrossRef]
  16. Memon, F.; Yang, Y.; Lv, F.; Soliman, A.; Chen, Y.; Sun, J.; Wang, Y.; Zhang, G.; Li, Z.; Xu, B. Effects of probiotic and Bidens pilosa on the performance and gut health of chicken during induced Eimeria tenella infection. J. Appl. Microbiol. 2021, 131, 425–434. [Google Scholar] [CrossRef]
  17. Zhou, Z.; Nie, K.; Huang, Q.; Li, K.; Sun, Y.; Zhou, R.; Wang, Z.; Hu, S. Changes of cecal microflora in chickens following Eimeria tenella challenge and regulating effect of coated sodium butyrate. Exp. Parasitol. 2017, 177, 73–81. [Google Scholar] [CrossRef]
  18. Song, X.; Li, Y.; Chen, S.; Jia, R.; Huang, Y.; Zou, Y.; Li, L.; Zhao, X.; Yin, Z. Anticoccidial effect of herbal powder “Shi Ying Zi” in chickens infected with Eimeria tenella. Animals 2020, 10, 1484. [Google Scholar] [CrossRef]
  19. Teng, P.-Y.; Yadav, S.; de Souza Castro, F.L.; Tompkins, Y.H.; Fuller, A.L.; Kim, W.K. Graded Eimeria challenge linearly regulated growth performance, dynamic change of gastrointestinal permeability, apparent ileal digestibility, intestinal morphology, and tight junctions of broiler chickens. Poult. Sci. 2020, 99, 4203–4216. [Google Scholar] [CrossRef] [PubMed]
  20. Johnson, J.; Reid, W.M. Anticoccidial drugs: Lesion scoring techniques in battery and floor-pen experiments with chickens. Exp. Parasitol. 1970, 28, 30–36. [Google Scholar] [CrossRef]
  21. Short, F.; Gorton, P.; Wiseman, J.; Boorman, K. Determination of titanium dioxide added as an inert marker in chicken digestibility studies. Anim. Feed Sci. Technol. 1996, 59, 215–221. [Google Scholar] [CrossRef]
  22. Lin, Y.; Olukosi, O.A. Qualitative and quantitative profiles of jejunal oligosaccharides and cecal short-chain fatty acids in broiler chickens receiving different dietary levels of fiber, protein and exogenous enzymes. J. Sci. Food Agric. 2021, 101, 5190–5201. [Google Scholar] [CrossRef] [PubMed]
  23. Lourenco, J.M.; Kieran, T.J.; Seidel, D.S.; Glenn, T.C.; Silveira, M.F.D.; Callaway, T.R.; Stewart, R.L., Jr. Comparison of the ruminal and fecal microbiotas in beef calves supplemented or not with concentrate. PLoS ONE 2020, 15, e0231533. [Google Scholar] [CrossRef]
  24. Christaki, E.; Florou-Paneri, P.; Giannenas, I.; Papazahariadou, M.; Botsoglou, N.A.; Spais, A.B. Effect of a mixture of herbal extracts on broiler chickens infected with Eimeria tenella. Anim. Res. 2004, 53, 137–144. [Google Scholar] [CrossRef] [Green Version]
  25. Georgieva, N.; Koinarski, V.; Gadjeva, V. Antioxidant status during the course of Eimeria tenella infection in broiler chickens. Vet. J. 2006, 172, 488–492. [Google Scholar] [CrossRef] [PubMed]
  26. Aljumaah, M.R.; Alkhulaifi, M.M.; Abudabos, A.M.; Alabdullatifb, A.; El-Mubarak, A.H.; Al Suliman, A.R.; Stanley, D. Organic acid blend supplementation increases butyrate and acetate production in Salmonella enterica serovar Typhimurium challenged broilers. PLoS ONE 2020, 15, e0232831. [Google Scholar] [CrossRef]
  27. Macdonald, S.E.; Nolan, M.J.; Harman, K.; Boulton, K.; Hume, D.A.; Tomley, F.M.; Stabler, R.A.; Blake, D.P. Effects of Eimeria tenella infection on chicken caecal microbiome diversity, exploring variation associated with severity of pathology. PLoS ONE 2017, 12, e0184890. [Google Scholar] [CrossRef]
  28. Kley, M.-V.; Oviedo-Rondón, E.; Dowd, S.; Hume, M.; Nalian, A. Effect of Eimeria infection on cecal microbiome of broilers fed essential oils. ARS USDA Submiss. 2012, 11, 747. [Google Scholar] [CrossRef] [Green Version]
  29. LeBlanc, J.G.; Chain, F.; Martín, R.; Bermúdez-Humarán, L.G.; Courau, S.; Langella, P. Beneficial effects on host energy metabolism of short-chain fatty acids and vitamins produced by commensal and probiotic bacteria. Microb. Cell. Fact. 2017, 16, 1–10. [Google Scholar] [CrossRef] [Green Version]
  30. Gasaway, W.C. Volatile fatty acids and metabolizable energy derived from cecal fermentation in the willow ptarmigan. Comp. Biochem. Physiol. Part A Physiol. 1976, 53, 115–121. [Google Scholar] [CrossRef]
  31. Santos, T.S.D.; Teng, P.-Y.; Yadav, S.; Castro, F.L.D.S.; Gould, R.L.; Craig, S.W.; Chen, C.; Fuller, A.L.; Pazdro, R.; Sartori, J.R. Effects of Inorganic Zn and Cu Supplementation on Gut Health in Broiler Chickens Challenged with Eimeria spp. Front. Vet. Sci. 2020, 7, 230. [Google Scholar] [CrossRef]
  32. Renaudeau, D.; Gilbert, H.; Noblet, J. Effect of climatic environment on feed efficiency in swine. In Feed Efficiency in Swine; Springer: Berlin/Heidelberg, Germany, 2012; pp. 183–210. [Google Scholar]
  33. Canfora, E.E.; Blaak, E.E. Acetate: A diet-derived key metabolite in energy metabolism: Good or bad in context of obesity and glucose homeostasis? Curr. Opin. Clin. Nutr. Metab. Care 2017, 20, 477–483. [Google Scholar] [CrossRef] [PubMed]
  34. Adji, A.V.; Plumeriastuti, H.; Ma’ruf, A.; Legowo, D. Histopathological Alterations of Ceca in Broiler Chickens (Gallus gallus) Exposed to Chronic Heat Stress. World 2019, 9, 211–217. [Google Scholar] [CrossRef]
  35. Walker, R.A.; Sharman, P.A.; Miller, C.M.; Lippuner, C.; Okoniewski, M.; Eichenberger, R.M.; Ramakrishnan, C.; Brossier, F.; Deplazes, P.; Hehl, A.B. RNA Seq analysis of the Eimeria tenella gametocyte transcriptome reveals clues about the molecular basis for sexual reproduction and oocyst biogenesis. BMC Genom. 2015, 16, 94. [Google Scholar] [CrossRef] [Green Version]
  36. Clench, M.H.; Mathias, J.R. The avian cecum: A review. Wilson Bull. 1995, 107, 93–121. [Google Scholar]
  37. Teng, P.-Y.; Choi, J.; Tompkins, Y.; Lillehoj, H.; Kim, W. Impacts of increasing challenge with Eimeria maxima on the growth performance and gene expression of biomarkers associated with intestinal integrity and nutrient transporters. Vet. Res. 2021, 52, 1–12. [Google Scholar] [CrossRef] [PubMed]
  38. Williams, R. Quantification of the crowding effect during infections with the seven Eimeria species of the domesticated fowl: Its importance for experimental designs and the production of oocyst stocks. Int. J. Parasitol. 2001, 31, 1056–1069. [Google Scholar] [CrossRef]
  39. Chadwick, E.; Rahimi, S.; Grimes, J.; Pitts, J.; Beckstead, R. Sodium bisulfate feed additive aids broilers in growth and intestinal health during a coccidiosis challenge. Poult. Sci. 2020, 99, 5324–5330. [Google Scholar] [CrossRef]
  40. Nakahiro, Y.; Isshiki, Y. Effect of cecal ligation on digestibility of crude fiber, cellulose and pentosan in chickens. Jpn. Poult. Sci. 1975, 12, 138–140. [Google Scholar] [CrossRef] [Green Version]
  41. Van der Hoeven-Hangoor, E.; Van de Linde, I.; Paton, N.; Verstegen, M.; Hendriks, W. Effect of different magnesium sources on digesta and excreta moisture content and production performance in broiler chickens. Poult. Sci. 2013, 92, 382–391. [Google Scholar] [CrossRef] [PubMed]
  42. Faradilla, Z.S.; Yunus, M.; Hermadi, H.A. The Effect of Dietary Administration of Virgin Coconut oil on Differential Leukocytes in Infected Chicken with Eimeria tenella. J. World’s Poult. Res. 2020, 10, 615–622. [Google Scholar] [CrossRef]
Figure 1. Daily feed intake of broiler chickens infected with different dosages of Eimeria tenella. Daily feed intake was measured in the T0 (treatment 0; Sham-challenged with phosphate-buffered saline); T1 (treatment 1; challenged with 6250 sporulated oocysts of E. tenella); T2 (treatment 2; challenged with 12,500 sporulated oocysts of E. tenella); T3 (treatment 3; challenged with 25,000 sporulated oocysts of E. tenella); T4 (treatment 4; challenged with 50,000 sporulated oocysts of E. tenella) groups during 1 to 9 days post-infection. At each time point, orthogonal polynomial contrasts analysis was conducted to see linear pattern (L) and quadratic pattern (Q) among the treatments.
Animals 11 03428 g001
Figure 2. Cecal lesion score of broiler chickens infected with different dosages of Eimeria tenella on 6 days post-infection. Cecal lesion score was measured in the T0 (treatment 0; Sham-challenged with phosphate-buffered saline); T1 (treatment 1; challenged with 6250 sporulated oocysts of E. tenella); T2 (treatment 2; challenged with 12,500 sporulated oocysts of E. tenella); T3 (treatment 3; challenged with 25,000 sporulated oocysts of E. tenella); T4 (treatment 4; challenged with 50,000 sporulated oocysts of E. tenella) groups on 6 days post-infection. Different letters at the same time point represent significantly different (p < 0.05) by utilizing the Kruskal–Wallis test followed by the Dwass, Steel, Critchlow-Fligner post hoc test.
Animals 11 03428 g002
Figure 3. Oocyst shedding of broiler chickens infected with different dosages of Eimeria tenella. Fecal oocyst shedding was measured using McMaster chamber in the T0 (treatment 0; Sham-challenged with phosphate-buffered saline); T1 (treatment 1; challenged with 6250 sporulated oocysts of E. tenella); T2 (treatment 2; challenged with 12,500 sporulated oocysts of E. tenella); T3 (treatment 3; challenged with 25,000 sporulated oocysts of E. tenella); T4 (treatment 4; challenged with 50,000 sporulated oocysts of E. tenella) groups on 5 to 6, 6 to 7, and 7 to 8 days post-infection. Number of E. tenella oocysts is shown as log10 (oocysts/g feces). At each time point, orthogonal polynomial contrasts analysis was conducted to see linear pattern (L) and quadratic pattern (Q) among the treatments. Different letters at the same time point represent significantly different (p < 0.05) by proc mixed followed by the Tukey’s multiple comparison test among the treatment groups.
Animals 11 03428 g003
Figure 4. In vivo gastrointestinal permeability of broiler chickens infected with different dosages of Eimeria tenella. In vivo gastrointestinal permeability was measured using fluorescein isothiocyanate dextran 4 kDa in the T0 (treatment 0; Sham-challenged with phosphate-buffered saline); T1 (treatment 1; challenged with 6250 sporulated oocysts of E. tenella); T2 (treatment 2; challenged with 12,500 sporulated oocysts of E. tenella); T3 (treatment 3; challenged with 25,000 sporulated oocysts of E. tenella); T4 (treatment 4; challenged with 50,000 sporulated oocysts of E. tenella) groups on 5, 6, and 7 days post-infection. At each time point, orthogonal polynomial contrasts analysis was conducted to see linear pattern (L) and quadratic pattern (Q) among the treatments.
Animals 11 03428 g004
Figure 5. Ceca morphology of a non-challenged bird ((A) 2×; (B) 10×) and of a Eimeria tenella infected bird ((C) 2×; (D) 10×) in the T1 group (challenged with 6250 sporulated oocysts of E. tenella) on 6 days post-infection when tissues were stained with hematoxylin and eosin. Microgametocytes, macrogametocytes, and schizonts were observed in the ceca crypts (E,F).
Animals 11 03428 g005
Figure 6. Total antioxidant capacity in the liver of broiler chickens infected with different dosages of Eimeria tenella. On 6 and 9 days post-infection (dpi), total antioxidant capacity in the liver was measured in the T0 (treatment 0; Sham-challenged with phosphate-buffered saline); T1 (treatment 1; challenged with 6250 sporulated oocysts of E. tenella); T2 (treatment 2; challenged with 12,500 sporulated oocysts of E. tenella); T3 (treatment 3; challenged with 25,000 sporulated oocysts of E. tenella); T4 (treatment 4; challenged with 50,000 sporulated oocysts of E. tenella) groups. At each time point, orthogonal polynomial contrasts analysis was conducted to see linear pattern (L) and quadratic pattern (Q) among the treatments.
Animals 11 03428 g006
Table 1. Diet composition and calculated analysis of the broiler diet (g/kg, as fed basis).
IngredientsD 14 to 23
Corn700.8
Soybean meal (480 g crude protein/kg)241.73
Soybean oil15.84
Deflour phosphate13.99
Sand7.00
Limestone6.11
Titanium dioxide3.00
DL-Methionine 99%2.86
L-Lysine HCl 78%2.80
Vitamin Premix 12.50
Common Salt1.79
L-threonine0.77
Mineral Premix 20.80
Total1,000
Calculated energy and nutrient value, %
Metabolizable energy, Mcal/kg3,100
Crude protein18.375
SID 3 Methionine0.552
SID Total sulfur amino acids0.8
SID Lysine1.02
SID Threonine0.66
Total calcium0.76
Available phosphate0.38
1 Vitamin mix provided the following in mg/100 g diet: thiamine-HCl, 1.5; riboflavin 1.5; nicotinic acid amide 15; folic acid 7.5; pyridoxine-HCl, 1.2; d-biotin 3; vitamin B-12 (source concentration, 0.1%) 2; d-calcium pantothenate 4; menadione sodium bisulfite, 1.98; α-tocopherol acetate (source 500,000 IU/g), 22.8; cholecalciferol (source 5,000,000 IU/g) 0.09; retinyl palmitate (source 500,000 IU/g), 2.8; ethoxyquin, 13.34; I-inositol, 2.5; dextrose, 762.2; 2 Mineral mix provided the following in g/100 g diet: Ca(H2PO4)2·H2O, 3.62; CaCO3, 1.48; KH2PO4, 1.00; Na2SeO4, 0.0002; MnSO4·H2O, 0.035; FeSO4·7H2O, 0.05; MgSO4·7H2O, 0.62; KIO3, 0.001; NaCl, 0.60; CuSO4·5H2O, 0.008; ZnCO3, 0.015; CoCl2·6H2O, 0.00032; NaMoO4·2H2O, 0.0011; KCl, 0.10; dextrose, 0.40; 3 SID: standard ileal digestible amino acid.
Table 2. Growth performance parameters including body weight (BW; g), average daily gain (ADG; g/d), average daily feed intake (ADFI; g/d), and feed conversion ratio (FCR; g/g) of broiler chickens infected with different dosages of Eimeria tenella during the acute phase [0 to 6 days post-infection (dpi)] and recovery phase (6 to 9 dpi) 1.
Items Eimeria tenella-Challenged Polynomial Contrast
T0T1T2T3T4SEMp ValueLin.Quad.
Initial BW 359.4360.3356359.53583.720.38
0 to 6 dpi
BW703.4705.5697699.5680.7727.280.550.160.43
ADG57.3357.5357.0156.5453.804.320.560.160.37
ADFI84.9287.2488.6386.0584.314.610.550.690.11
FCR1.481.521.551.521.570.060.190.040.64
6 to 9 dpi
BW881.8859876.9885.73889.1979.630.970.690.72
ADG65.8157.4061.6863.8369.7013.740.620.430.22
ADFI115.4120.9123.77123.1123.114.860.870.40.55
FCR1.92.172.031.971.770.390.500.380.16
0 to 9 dpi
ADG60.1657.4958.8358.9759.106.470.970.940.66
ADFI95.0998.47100.698.1697.246.810.720.650.22
FCR1.621.741.711.671.640.140.540.850.15
1 T0: treatment 0 (Sham-challenged with phosphate-buffered saline); T1, treatment 1 (challenged with 6250 sporulated oocysts of Eimeria tenella); T2, treatment 2 (challenged with 12,500 sporulated oocysts of Eimeria tenella); T3, treatment 3 (challenged with 25,000 sporulated oocysts of Eimeria tenella); T4, treatment 4 (challenged with 50,000 sporulated oocysts of Eimeria tenella). At each time point, orthogonal polynomial contrasts analysis was conducted to see linear pattern (L) and quadratic pattern (Q) among the treatments.
Table 3. Fecal moisture content (fecal consistency) and ileal moisture content of broiler chickens infected with different dosages of Eimeria tenella on 5 to 6 days post-infection (dpi), 6 to 7 dpi, and 7 to 8 dpi (fecal moisture content), and at 6 and 9 dpi (ileal moisture content) 1.
Items Eimeria tenella-Challenged Polynomial Contrast
T0T1T2T3T4SEMp ValueLin.Quad.
Feces
5 to 6 dpi78.2376.7675.9176.5676.991.660.220.220.04
6 to 7 dpi68.1469.6873.3874.6468.664.870.120.350.03
7 to 8 dpi 70.8171.8773.0975.0774.862.520.03<0.010.65
Ileum
6 dpi81.7581.8380.680.9480.810.760.030.010.33
9 dpi 80.3480.181.2480.6279.931.220.420.90.18
1 T0: treatment 0 (Sham-challenged with phosphate-buffered saline); T1, treatment 1 (challenged with 6250 sporulated oocysts of E. tenella); T2, treatment 2 (challenged with 12,500 sporulated oocysts of E. tenella); T3, treatment 3 (challenged with 25,000 sporulated oocysts of E. tenella); T4, treatment 4 (challenged with 50,000 sporulated oocysts of E. tenella). At each time point, orthogonal polynomial contrasts analysis was conducted to see linear pattern (L) and quadratic pattern (Q) among the treatments.
Table 4. Duodenal, jejunal, ileal, and cecal morphology [villus height (VH; μm), crypts depth (CD; μm), and VH:CD] of broiler chickens infected with different dosages of Eimeria tenella on 6 days post-infection (dpi) and 9 dpi 1.
Items Eimeria tenella-Challenged Polynomial Contrast
T0T1T2T3T4SEMp ValueLin.Quad.
6 dpi
Duodenum
VH2459.972585.522442.422154.122485.42300.160.220.340.56
CD282.46245.17253.82227.51255.5535.360.170.130.08
VH:CD9.0510.89.8610.399.851.780.530.610.26
Jejunum
VH1411.461375.621332.651321.931303.211470.710.170.76
CD234.92222.03223.93221.29225.4334.5234.520.660.57
VH:CD6.386.566.086.285.941.220.910.470.85
Ileum
VH899.01936.51934.37894.06879.21113.90.870.580.41
CD194.11181.49183.02184.97161.4624.030.240.060.59
VH:CD4.925.285.185.095.720.590.220.080.54
Cecal CD217.21 b410.22 a451.86 a593.18 a477.05 a111.85<0.01<0.01<0.01
9 dpi
Duodenum
VH24752574.812452.62150.152375.54278.630.170.10.87
CD250.69226.78233.48211.26234.5635.580.490.310.23
VH:CD10.2611.5511.0410.7410.321.950.770.780.28
Jejunum
VH1410.121348.811320.961288.441257.51159.320.540.090.82
CD208.29217.18197.49211.8210.8534.220.870.990.78
VH:CD7.216.557.066.56.211.860.690.260.87
Ileum
VH888.68917.4879.2885.43876.32108.220.970.690.85
CD173.99167.73158.63161.9155.4628.80.80.260.78
VH:CD5.355.575.745.75.950.720.690.170.89
Cecal CD87.57 b163.55 a,b182.47 a224.19 a196.3 a47.71<0.01<0.010.02
1 T0: treatment 0 (Sham-challenged with phosphate-buffered saline); T1, treatment 1 (challenged with 6250 sporulated oocysts of E. tenella); T2, treatment 2 (challenged with 12,500 sporulated oocysts of E. tenella); T3, treatment 3 (challenged with 25,000 sporulated oocysts of E. tenella); T4, treatment 4 (challenged with 50,000 sporulated oocysts of E. tenella). At each time point, orthogonal polynomial contrasts analysis was conducted to see linear pattern (L) and quadratic pattern (Q) among the treatments. Different letters at the same time point represent significantly different (p < 0.05) by proc mixed followed by the Tukey’s multiple comparison test among the treatment groups.
Table 5. Apparent ileal digestibility (%) of dry matter (DM), organic matter (OM), and ash of broiler chickens infected with different dosages of Eimeria tenella on 6 days post-infection (dpi) and 9 dpi.
Items Eimeria tenella-Challenged 1 Polynomial Contrast
T0T1T2T3T4SEMp ValueLin.Quad.
6 dpi
DM69.1670.3168.3571.5370.191.960.090.210.96
OM70.8572.0870.1373.3271.79 1.940.090.230.89
Ash40.164037.6640.8242.665.470.60.420.26
9 dpi
DM72.7170.3171.8672.4473.52.80.420.360.2
OM75.0272.2974.3274.6875.82.690.290.310.18
Ash33.0336.2429.4733.8633.829.490.810.950.76
1 T0: treatment 0 (Sham-challenged with phosphate-buffered saline); T1, treatment 1 (challenged with 6250 sporulated oocysts of E. tenella); T2, treatment 2 (challenged with 12,500 sporulated oocysts of E. tenella); T3, treatment 3 (challenged with 25,000 sporulated oocysts of E. tenella); T4, treatment 4 (challenged with 50,000 sporulated oocysts of E. tenella). At each time point, orthogonal polynomial contrasts analysis was conducted to see linear pattern (L) and quadratic pattern (Q) among the treatments.
Table 6. Concentrations of volatile fatty acids (mM) in ceca contents of broiler chickens infected with different dosages of Eimeria tenella at 6 days post-infection (dpi) and 9 dpi 1.
Items Eimeria tenella-Challenged 1 Polynomial Contrast
T0T1T2T3T4SEMp ValueLin.Quad.
6 dpi
Acetate48.21 a35.2 a,b35.64 a,b36.94 a,b26.91 b100.02<0.010.65
Propionate8.379.030.847.276.12.950.50.110.45
Isobutyrate0.260.170.190.150.120.080.07<0.0100.73
Butyrate8.695.87.45.344.963.80.420.120.82
Isovalerate0.420.420.450.320.370.170.720.350.82
Valerate1.090.950.780.690.80.510.720.220.47
Total VFA67.04 a51.58 a,b52.52 a,b50.73 a,b39.26 b13.950.04<0.010.8
9 dpi
Acetate50.7776.5262.0146.4748.1127.040.310.320.25
Propionate6.14 b11.87 a8.17 a,b7.82 a,b7.07 a,b3.340.060.620.07
Isobutyrate0.160.320.150.160.160.140.220.390.55
Butyrate8.6413.048.586.246.34.940.160.090.4
Isovalerate0.260.530.390.370.60.390.590.310.96
Valerate0.96 a,b1.65 a0.86 a,b0.8 a,b0.57 b0.550.030.030.21
Total VFA66.94103.9468.7261.8662.8335.970.260.290.43
1 T0: treatment 0 (Sham-challenged with phosphate-buffered saline); T1, treatment 1 (challenged with 6250 sporulated oocysts of E. tenella); T2, treatment 2 (challenged with 12,500 sporulated oocysts of E. tenella); T3, treatment 3 (challenged with 25,000 sporulated oocysts of E. tenella); T4, treatment 4 (challenged with 50,000 sporulated oocysts of E. tenella). At each time point, orthogonal polynomial contrasts analysis was conducted to see linear pattern (L) and quadratic pattern (Q) among the treatments. Different letters at the same time point represent significantly different (p < 0.05) by proc mixed followed by the Tukey’s multiple comparison test among the treatment groups.
Publisher’s Note: MDPI stays neutral with regard to jurisdictional claims in published maps and institutional affiliations.

