
An Experimental Model for Iron Deficiency Anemia in Sows and Offspring Induced by Blood Removal during Gestation


Abstract
:Simple Summary
Abstract
1. Introduction
2. Materials and Methods
2.1. Animals and Housing
2.2. Study Design
2.2.1. Trial I
2.2.2. Trial II
2.3. Feeding Regime and Feed Composition
2.4. Anesthesia, Surgical Procedure and Treatment
2.5. Blood Removal
2.6. Blood Sampling and Laboratory Analysis
2.7. Farrowing Recordings
2.8. Organ Weight and Tissue Iron
2.9. Statistical Analysis
3. Results
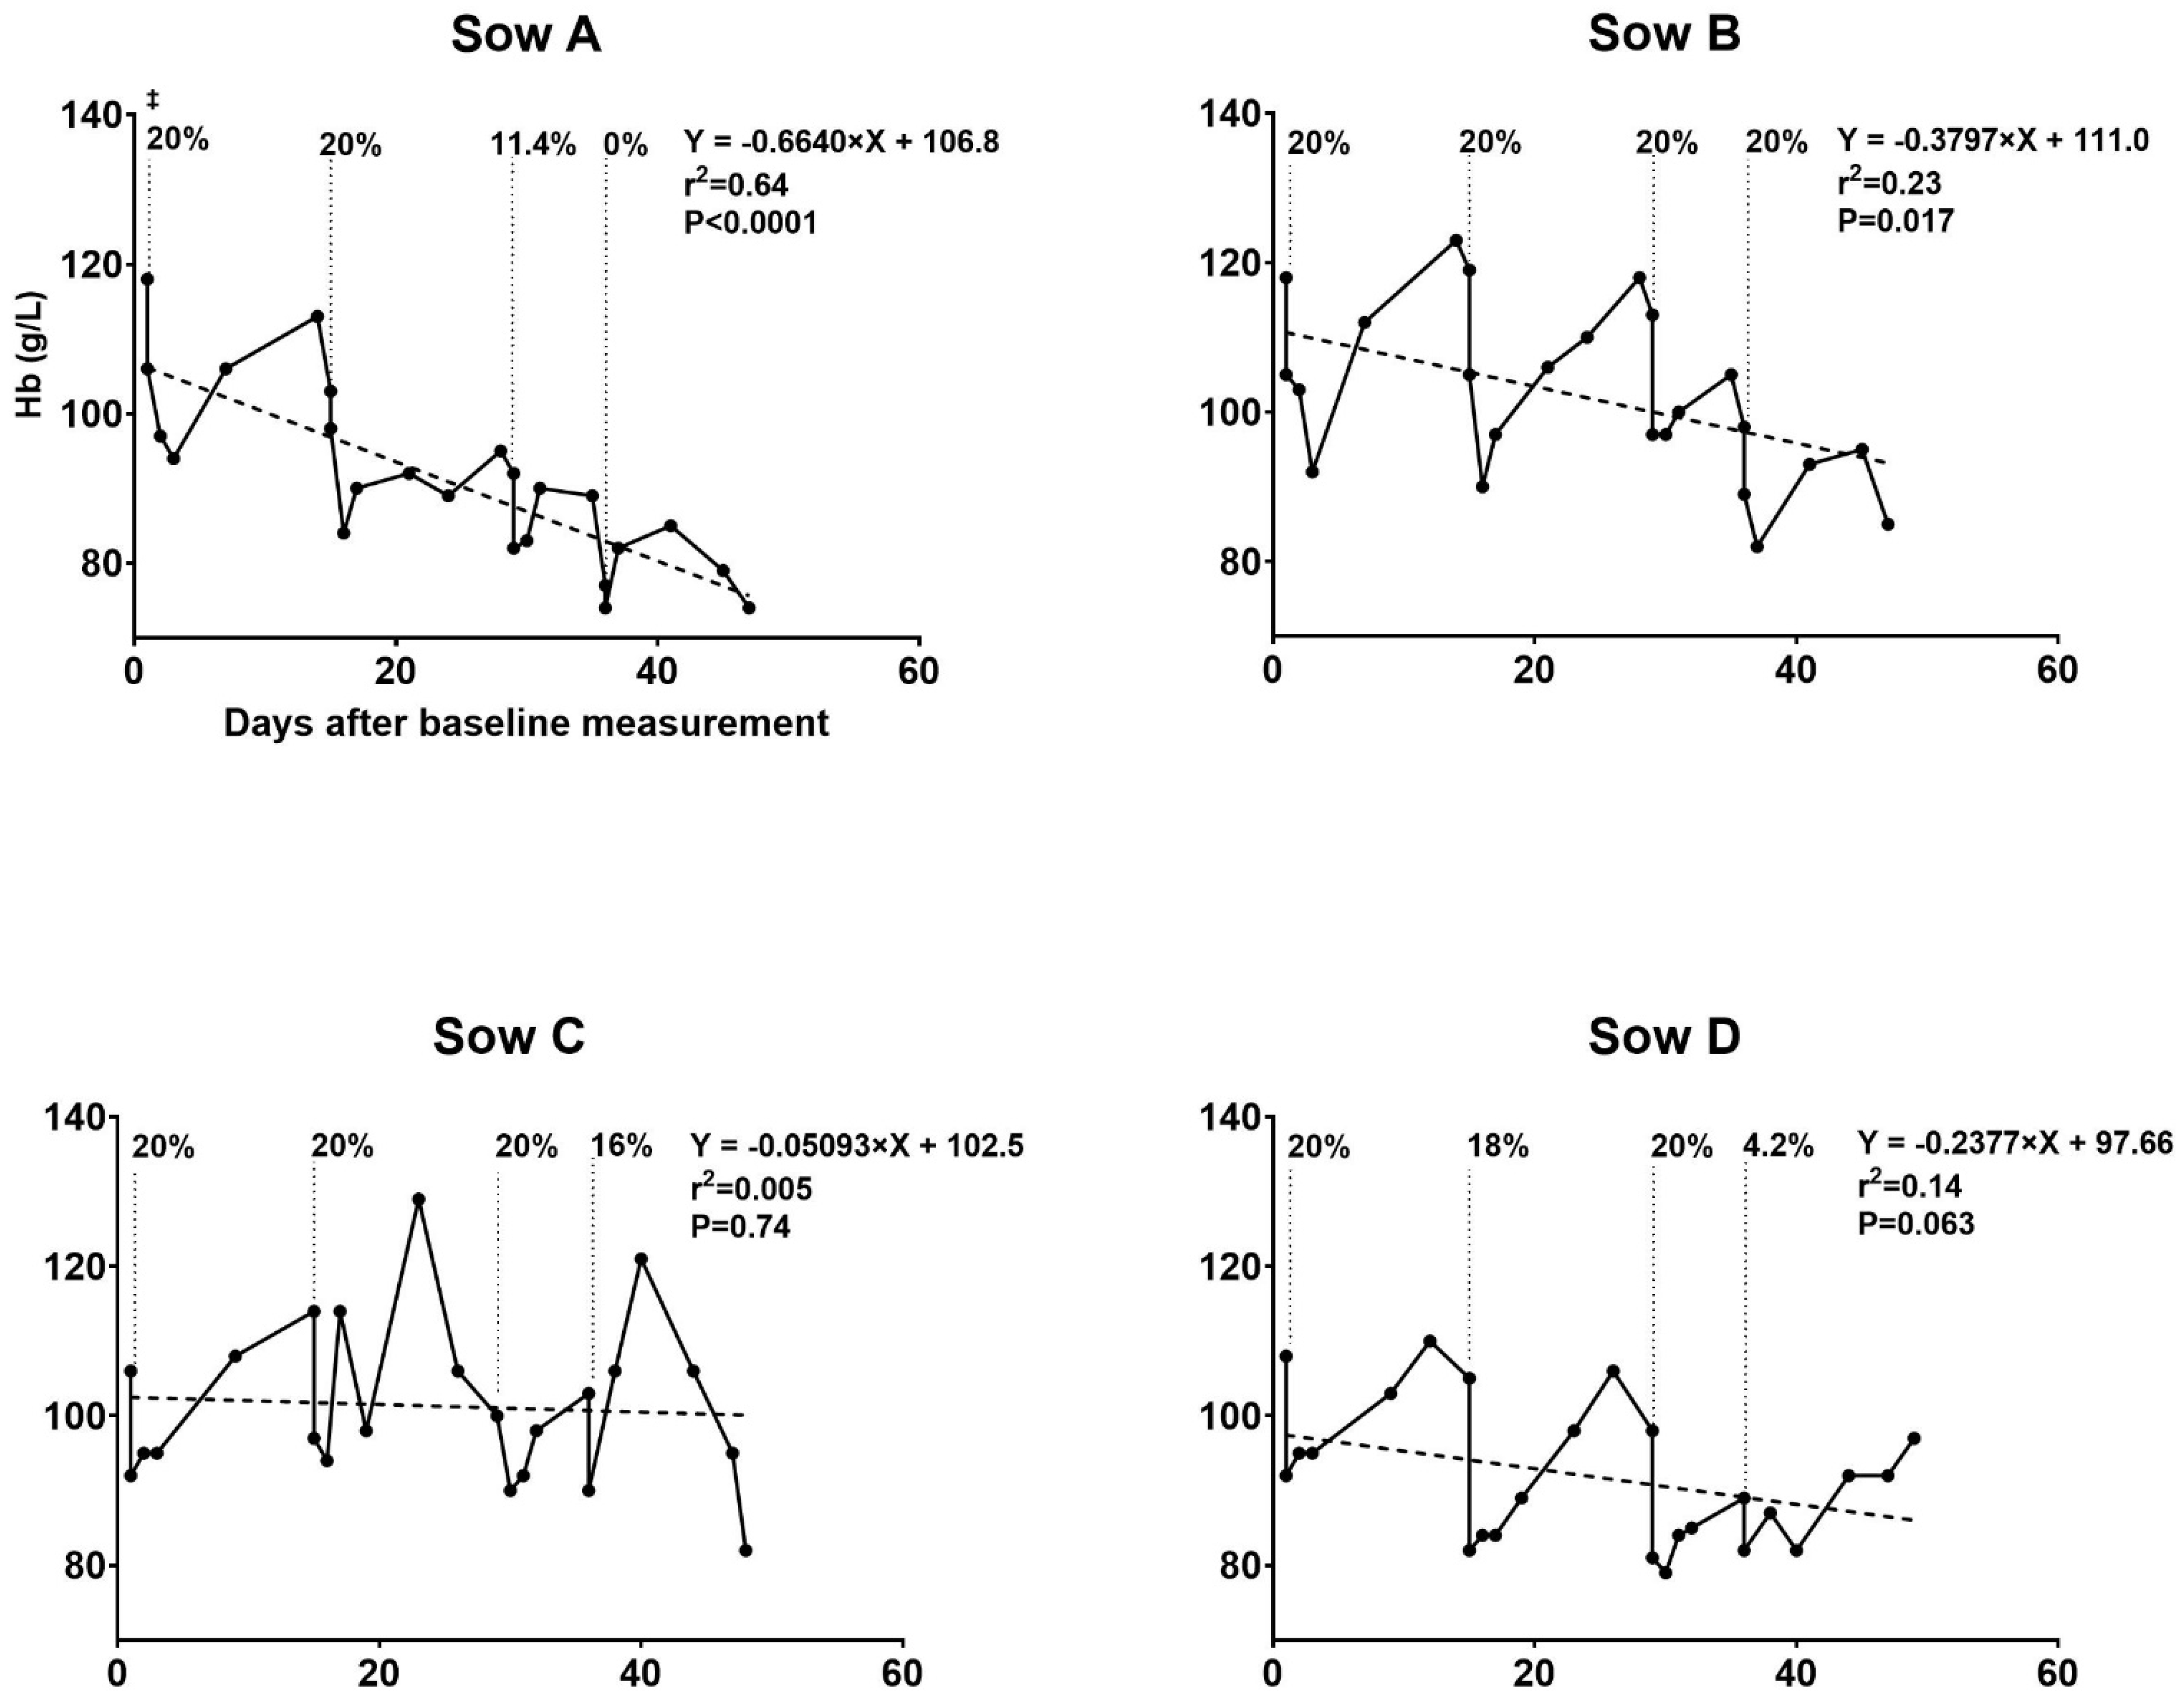
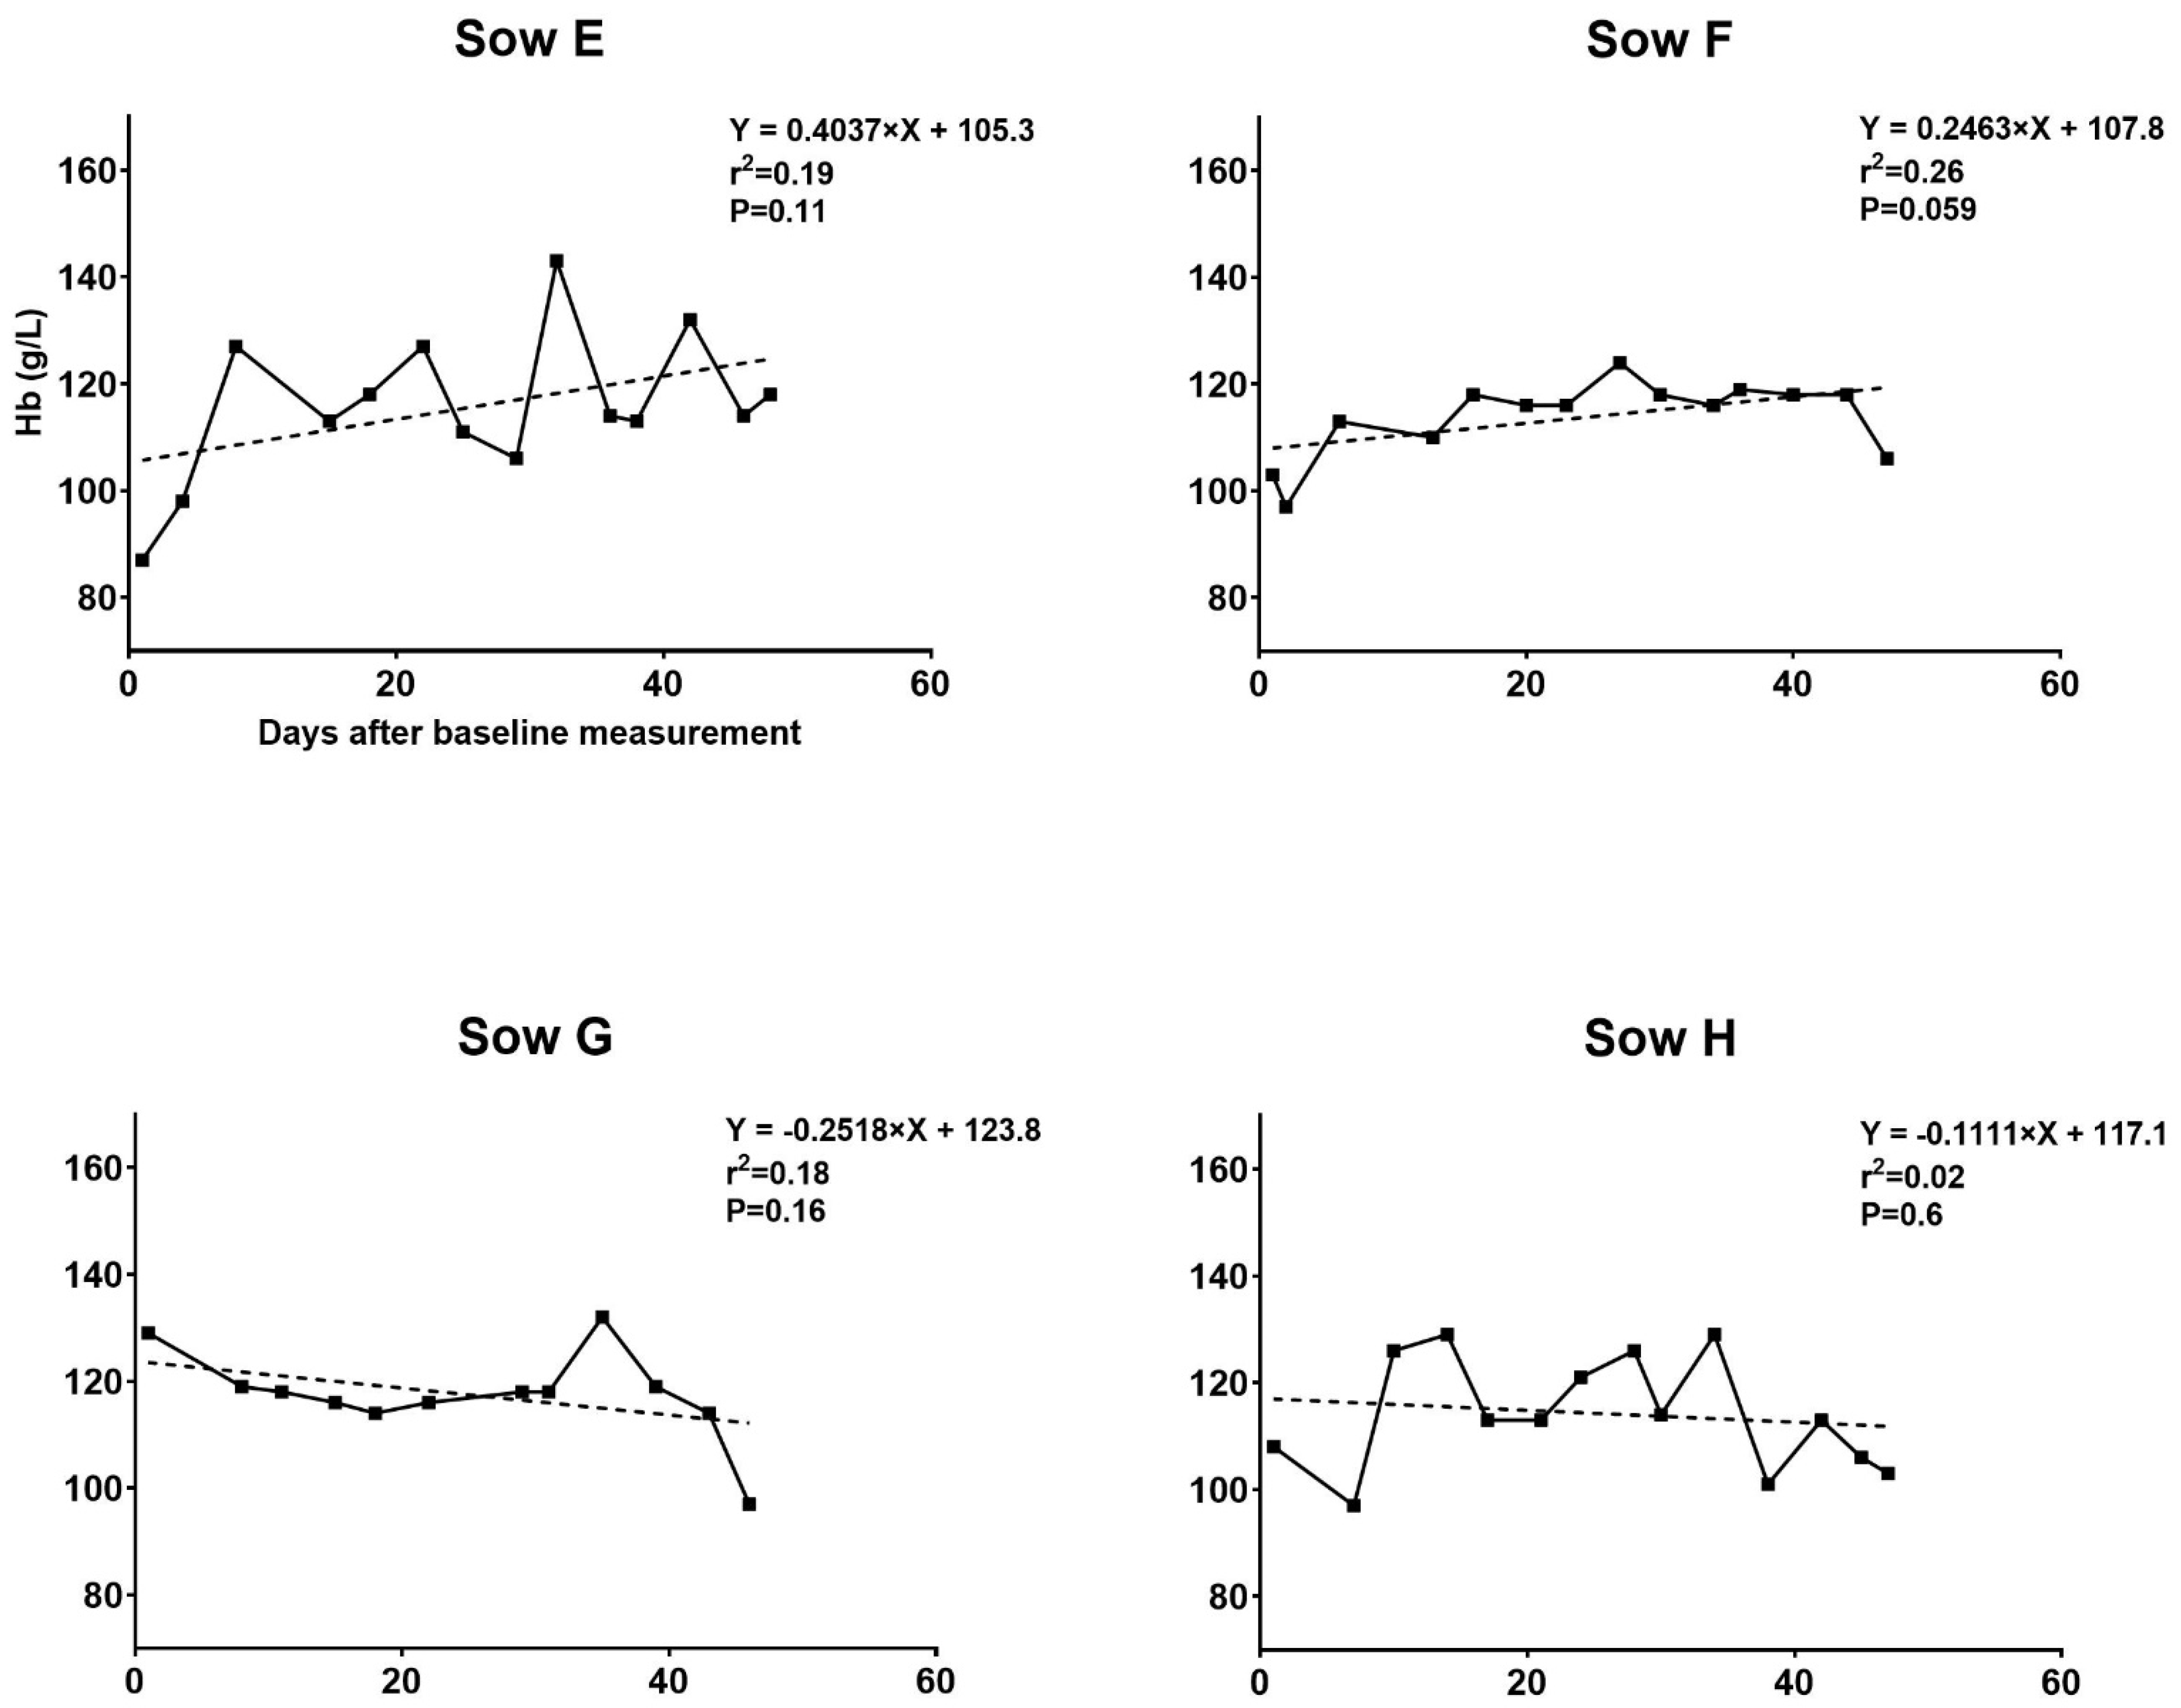
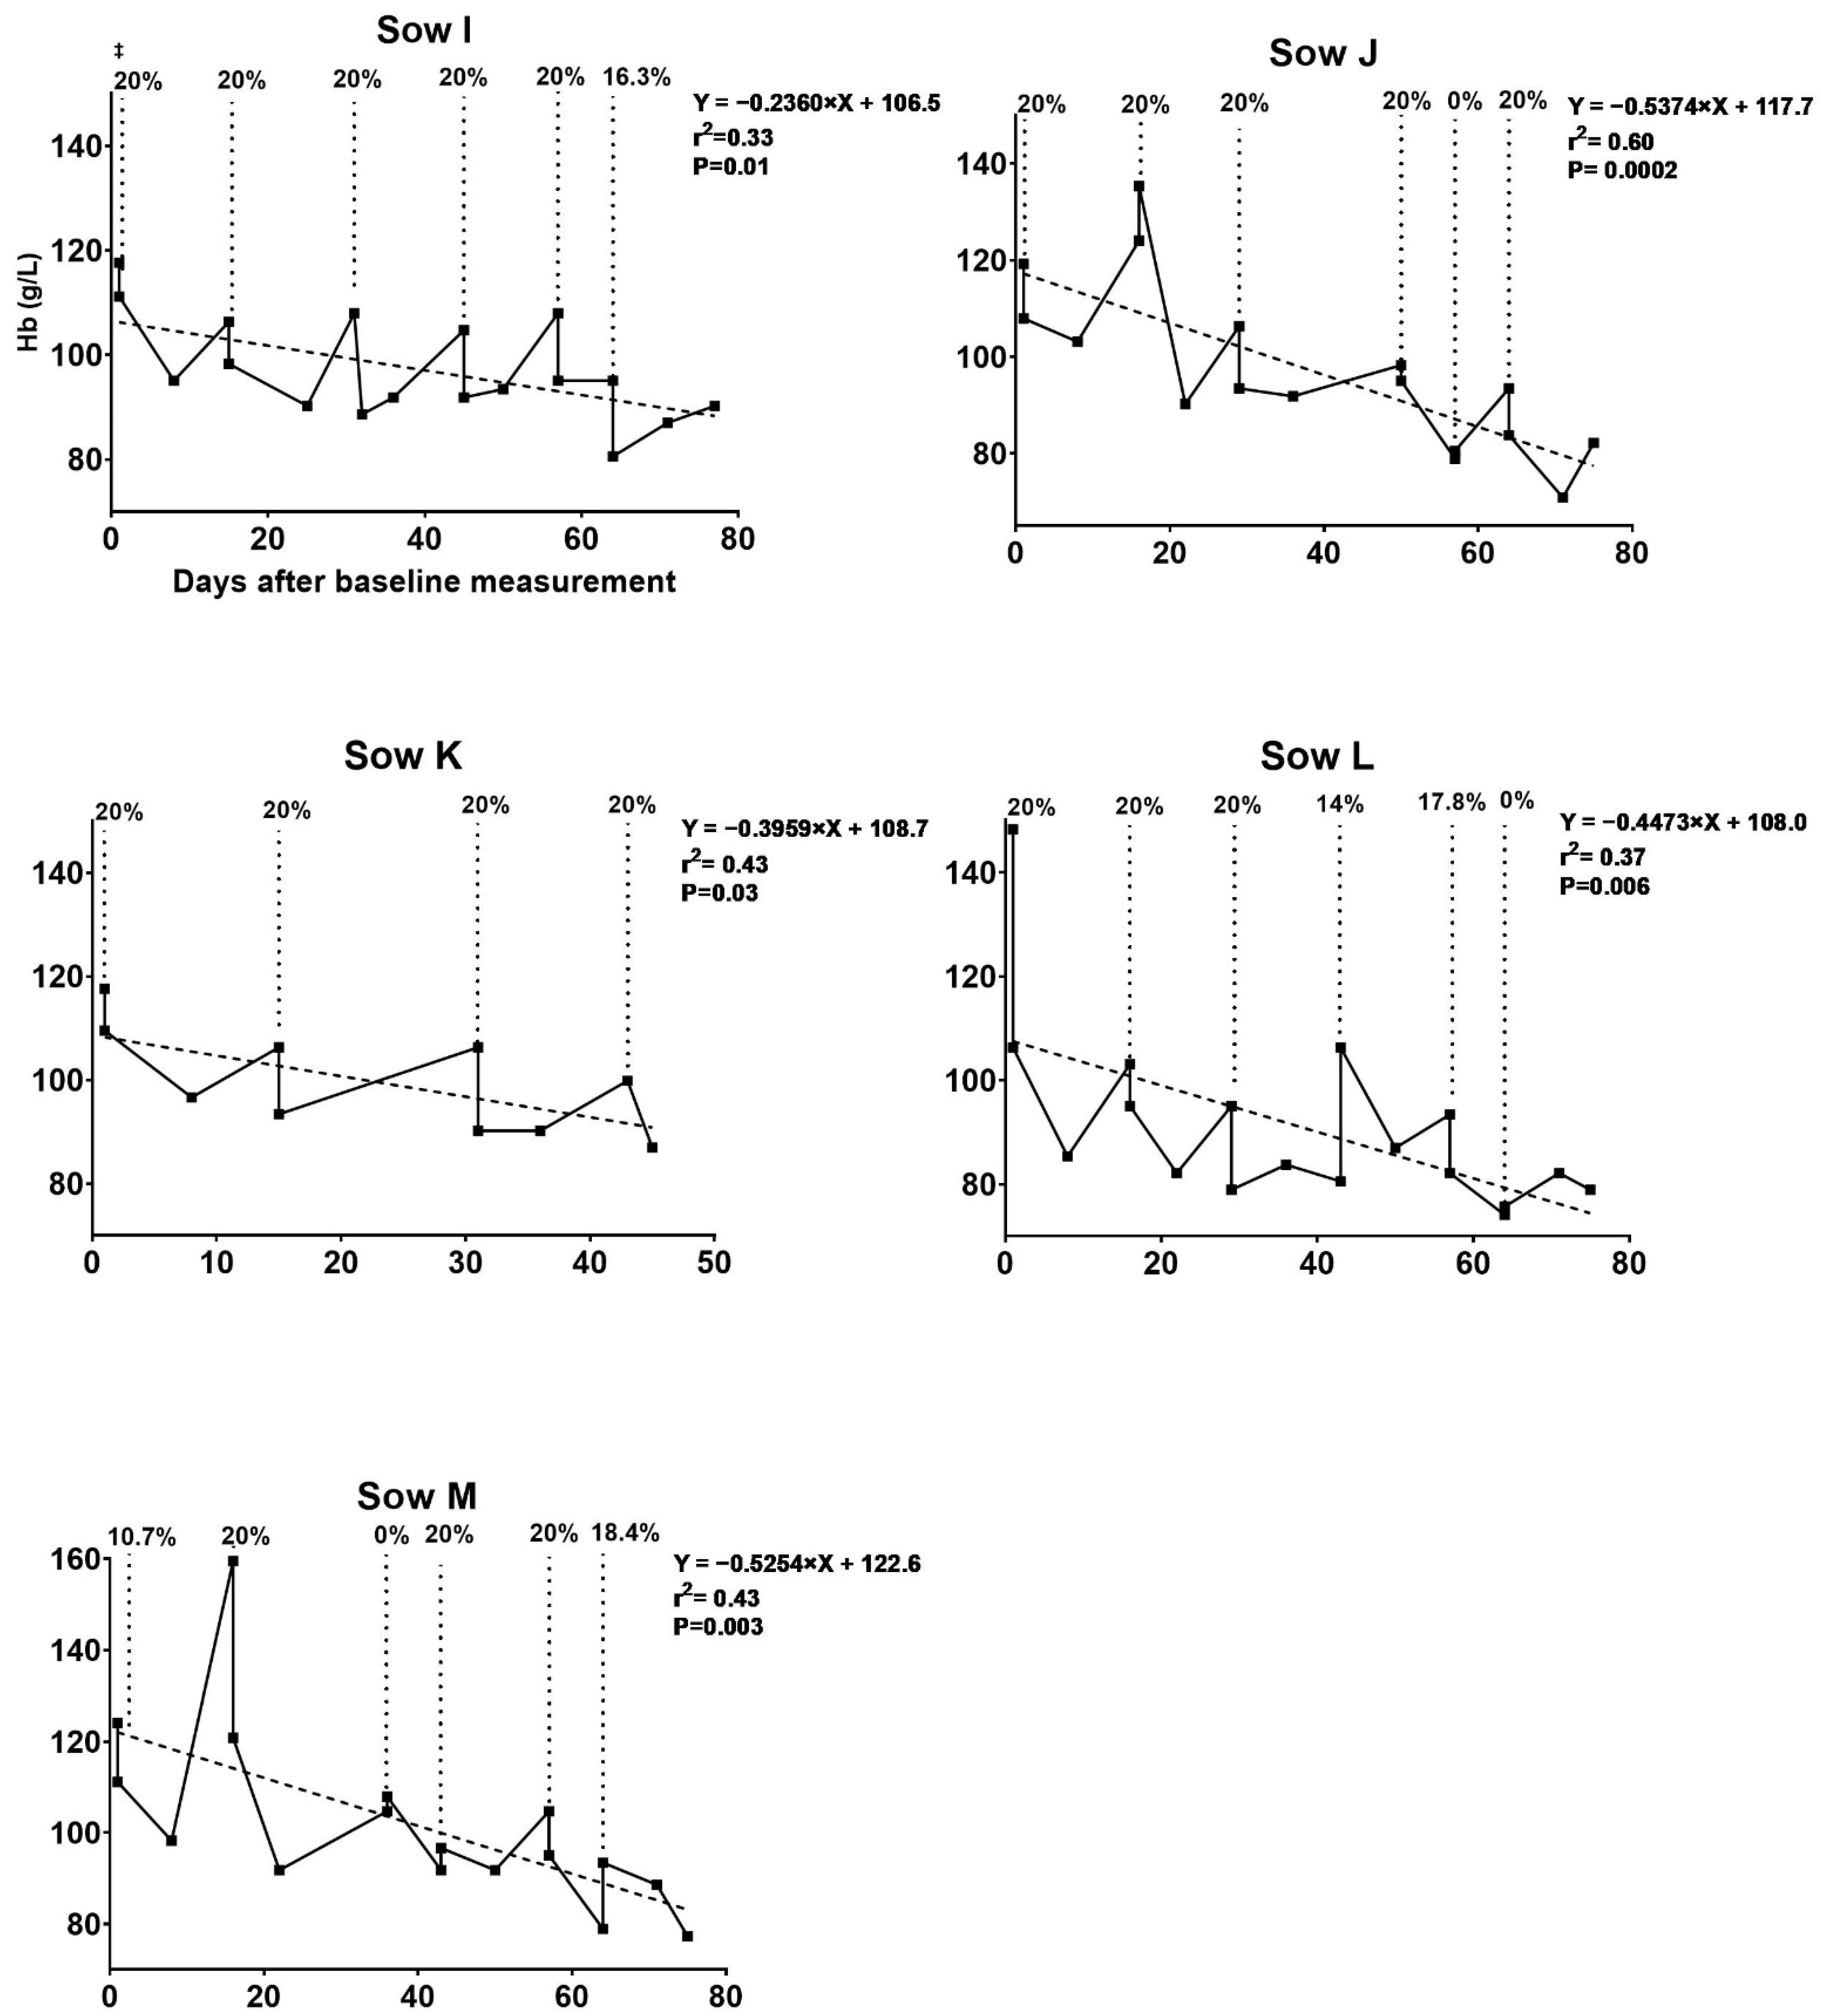
3.1. Hematologic Development of Sows during Pregnancy
3.1.1. Trial I
3.1.2. Trial II
3.2. Hematology of Newborn Piglets
3.2.1. Trial I
3.2.2. Trial II
3.3. Clinical Outcomes
3.3.1. Trial I
3.3.2. Trial II
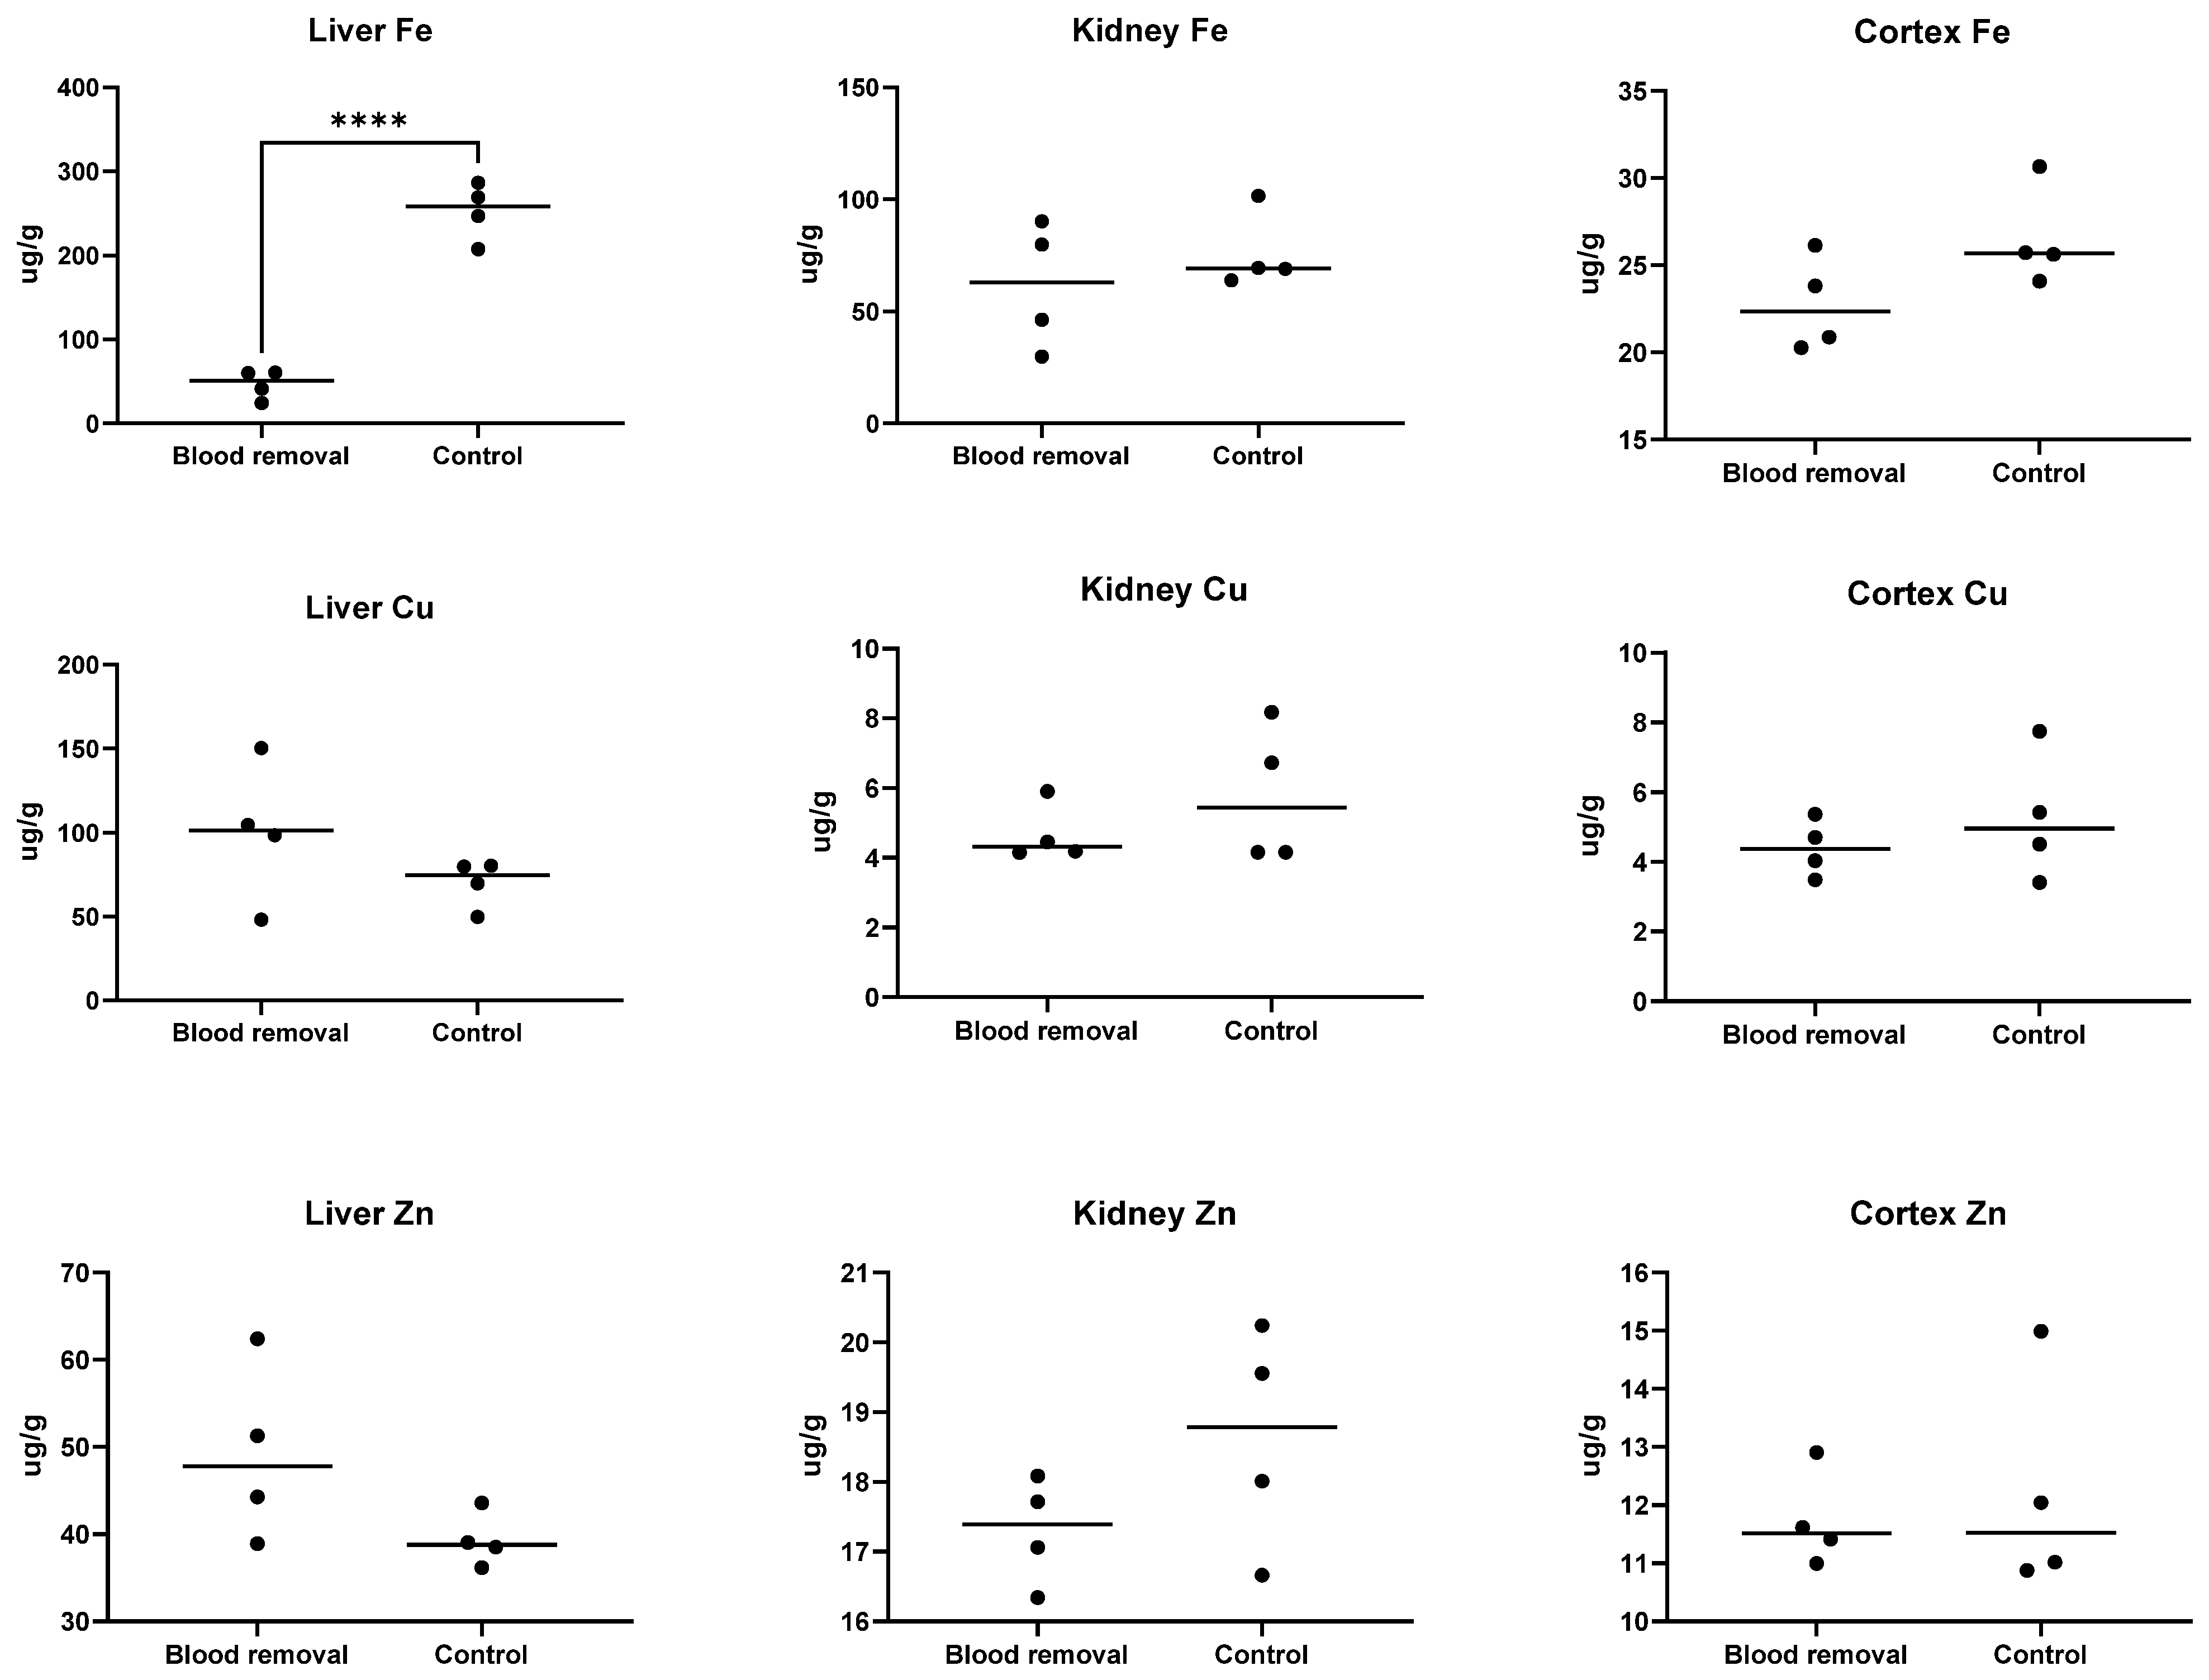
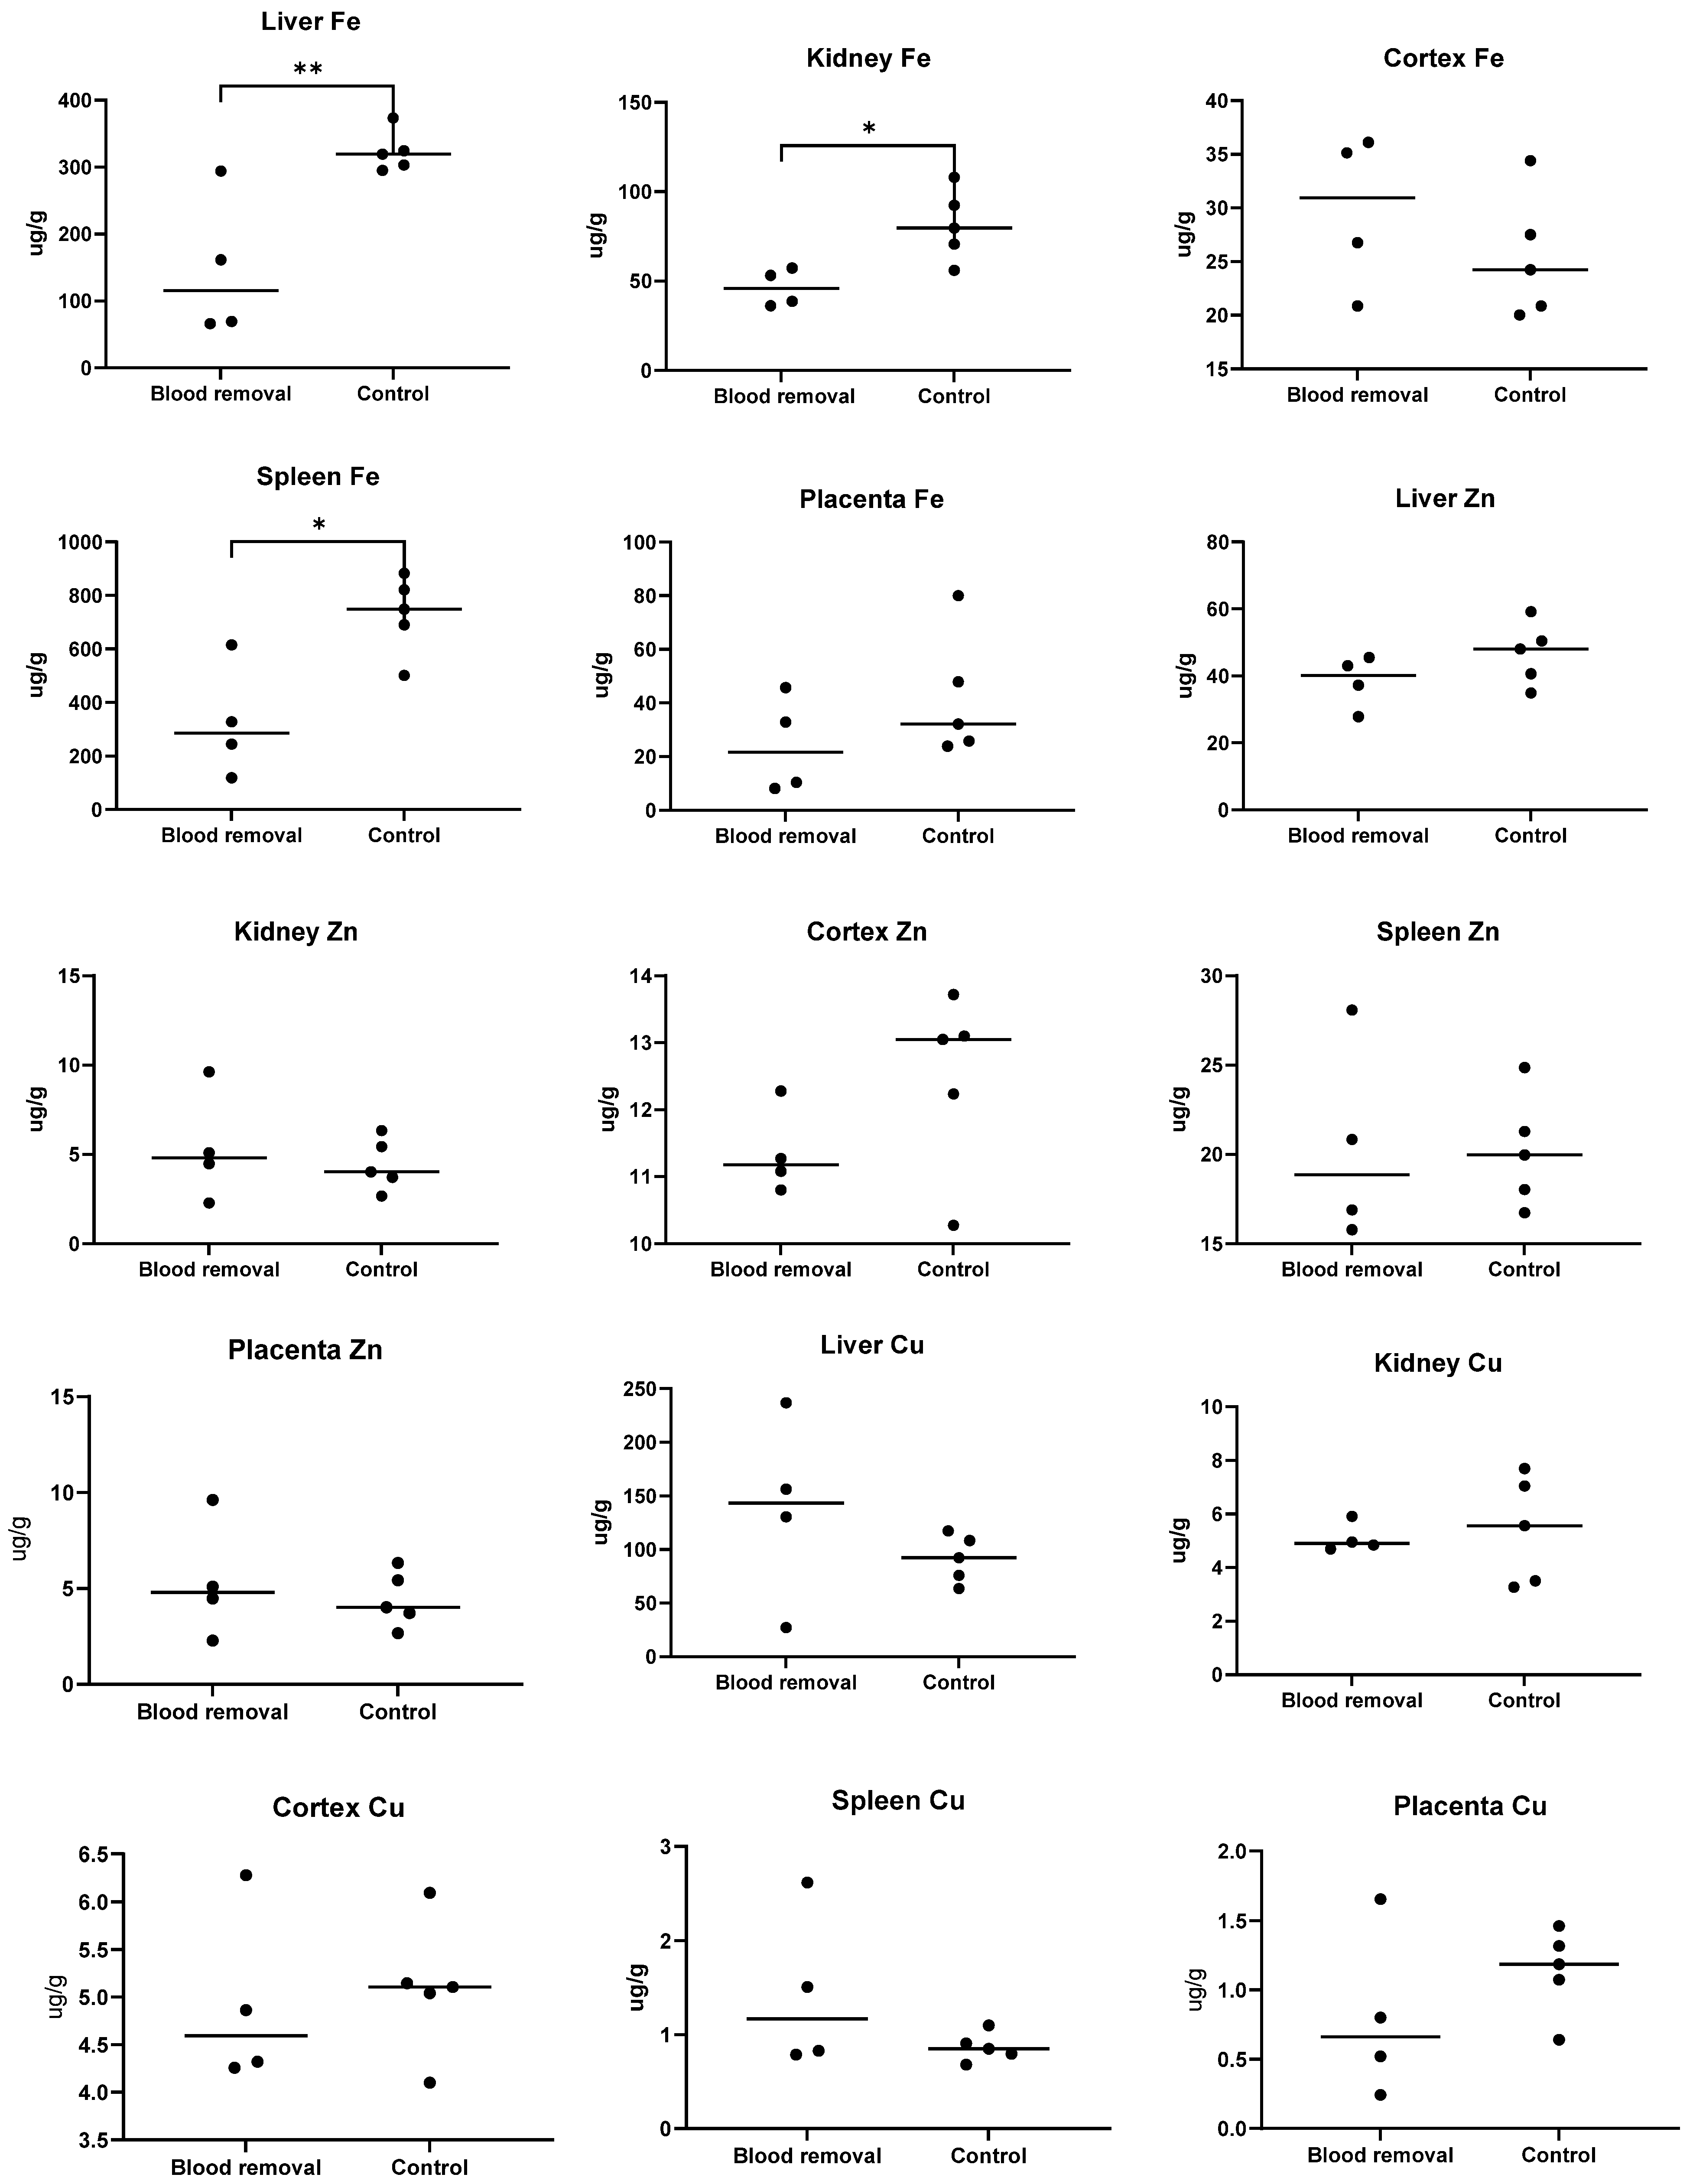
3.4. Tissue Fe
3.4.1. Trial I
3.4.2. Trial II
3.5. Relative Organ Weights
4. Discussion
5. Conclusions
Supplementary Materials
Author Contributions
Funding
Institutional Review Board Statement
Informed Consent Statement
Data Availability Statement
Acknowledgments
Conflicts of Interest
References
- Normand, V.; Perrin, H.; Auvigne, V.; Robert, N.; Laval, A. Anaemia in the sow: A cohort study to assess factors with an impact on haemoglobin concentration, and the influence of haemoglobin concentration on the reproductive performance. Vet. Rec. 2012, 171, 350. [Google Scholar] [CrossRef]
- Bhattarai, S.; Framstad, T.; Nielsen, J. Stillbirths in relation to sow hematological parameters at farrowing: A cohort study. J Swine Health Prod. 2018, 26, 215–222. [Google Scholar]
- Moore, R.W.; Redmond, H.; Livingston, C.W. Iron deficiency anemia as a cause of stillbirths in swine. J. Am. Vet. Med. Assoc. 1965, 147, 746–748. [Google Scholar]
- World Health Organization. Worldwide Prevalence of Anaemia Report 1993–2005: WHO Global Database on Anaemia; World Health Organization: Geneva, Switzerland, 2008; Available online: https://apps.who.int/iris/bitstream/handle/10665/43894/9789241596657_eng.pdf;jsessionid=E6C5B812F621055955C6B06E9510D85F?sequence=1 (accessed on 14 March 2019).
- Tybirk, P.; Sloth, N.M.; Kjeldsen, N.; Shooter, L. Danish Nutrient Standards. SEGES Pig Research Centre. 2019. Available online: https://pigresearchcentre.dk/-/media/English-site/Research_PDF/Nutrition-standards/Normermaj2019UKLISHudgave_29.ashx (accessed on 29 October 2019).
- (U.S.) NRC. Nutrient Requirements of Swine. In Nutrient Requirements of Swine, 11th ed.; NRC: Washington, DC, USA, 2012; p. 236. [Google Scholar]
- Alonso-Spilsbury, M.; Mota-Rojas, D.; Villanueva-García, D.; Martinez-Burnes, J.; Orozco, H.; Ramírez-Necoechea, R.; Mayagoitia, A.L.; Trujillo, M.E. Perinatal asphyxia pathophysiology in pig and human: A review. Anim. Reprod. Sci. 2005, 90, 1–30. [Google Scholar] [CrossRef] [PubMed]
- Friend, D.W.; Cunningham, H.M.; Nicholson, J.W.G. The Duration of Farrowing in Relation to the Reproductive Performance of Yorkshire Sows 1. Can. J. Comp. Med. Vet. Sci. 1962, 26, 127–130. [Google Scholar]
- Canario, L.; Cantoni, E.; Le Bihan, E.; Caritez, J.C.; Billon, Y.; Bidanel, J.P.; Foulley, J.L. Between-breed variability of stillbirth and its relationship with sow and piglet characteristics. J. Anim. Sci. 2006, 84, 3185–3196. [Google Scholar] [CrossRef] [PubMed]
- Borges, V.F.; Bernardi, M.L.; Bortolozzo, F.; Wentz, I. Risk factors for stillbirth and foetal mummification in four Brazilian swine herds. Prev. Vet. Med. 2005, 70, 165–176. [Google Scholar] [CrossRef]
- Malhotra, M.; Sharma, J.; Batra, S.; Sharma, S.; Murthy, N.; Arora, R. Maternal and perinatal outcome in varying degrees of anemia. Int. J. Gynecol. Obstet. 2002, 79, 93–100. [Google Scholar] [CrossRef]
- Lozoff, B.; Georgieff, M.K. Iron Deficiency and Brain Development. Semin. Pediatr. Neurol. 2006, 13, 158–165. [Google Scholar] [CrossRef] [PubMed]
- Breymann, C. Iron deficiency anemia in pregnancy. Semin Hematol. 2015, 52, 339–347. [Google Scholar] [CrossRef]
- Allen, L.H. Anemia and iron deficiency: Effects on pregnancy outcome. Am. J. Clin. Nutr. 2000, 71, 1280S–1284S. [Google Scholar] [CrossRef]
- Alwan, N.A.; Cade, J.E.; McArdle, H.J.; Greenwood, D.C.; Hayes, H.E.; Simpson, N.A. Maternal iron status in early pregnancy and birth outcomes: Insights from the baby’s vascular health and iron in pregnancy study. Br. J Nutr. 2015, 113, 1985–1992. [Google Scholar] [CrossRef] [Green Version]
- Coad, J.; Pedley, K. Iron deficiency and iron deficiency anemia in women. Scand. J. Clin. Lab. Investig. 2014, 74, 82–89. [Google Scholar] [CrossRef]
- Bhattarai, S.; Framstad, T.; Nielsen, J.P. Iron treatment of pregnant sows in a Danish herd without iron deficiency anemia did not improve sow and piglet hematology or stillbirth rate. Acta Vet. Scand. 2019, 61, 60. [Google Scholar] [CrossRef] [PubMed]
- Nielsen, J.P.; Busch, M.E.; Friendship, B.; Martineau, G.P.; Framstad, T. Herd diagnosis of iron deficiency in piglets. In Proceedings of the Joint Meeting of the 5th European Symposium of Porcine Health Management and the 50th Anniversary Meeting of the Pig Veterinary Society of Great Britain, Edinburg, UK, 22–24 May 2013; p. 168. [Google Scholar]
- Bhattarai, S.; Nielsen, J.P. Early indicators of iron deficiency in large piglets at weaning. J. Swine Health Prod. 2015, 23, 10–17. [Google Scholar]
- Bhattarai, S.; Framstad, T.; Nielsen, J.P. Hematologic reference intervals of Danish sows at mid-gestation. Acta Vet.Scand. 2019, 61, 16. [Google Scholar] [CrossRef] [PubMed]
- Stephansen, D.A.; Nielsen, A.H.; Hvitved-Jacobsen, T.; Arias, C.A.; Brix, H.; Vollertsen, J. Distribution of metals in fauna, flora and sediments of wet detention ponds and natural shallow lakes. Ecol. Eng. 2014, 66, 43–51. [Google Scholar] [CrossRef]
- R Core Team. R: A Language and Environment for Statistical Computing; R Foundation for Statistical Computing: Vienna, Austria, 2019. [Google Scholar]
- Hansen, S.L.; Trakooljul, N.; Liu, H.-C.; Moeser, A.J.; Spears, J.W. Iron Transporters Are Differentially Regulated by Dietary Iron, and Modifications Are Associated with Changes in Manganese Metabolism in Young Pigs. J. Nutr. 2009, 139, 1474–1479. [Google Scholar] [CrossRef] [PubMed] [Green Version]
- Yanagisawa, H.; Miyakoshi, Y.; Kobayashi, K.; Sakae, K.; Kawasaki, I.; Suzuki, Y.; Tamura, J. Long-term intake of a high zinc diet causes iron deficiency anemia accompanied by reticulocytosis and extra-medullary erythropoiesis. Toxicol. Lett. 2009, 191, 15–19. [Google Scholar] [CrossRef] [PubMed]
- Lee, G.R.; Nacht, S.; Lukens, J.N.; Cartwright, G.E. Iron metabolism in copper-deficient swine. J. Clin. Investig. 1968, 47, 2058–2069. [Google Scholar] [CrossRef] [PubMed]
- Hermesch, S.; Jones, R. Genetic parameters for haemoglobin levels in pigs and iron content in pork. Animal 2012, 6, 1904–1912. [Google Scholar] [CrossRef] [Green Version]
- Breymann, C.; Huch, R. Anaemia in Pregnancy and the Puerperium; Uni-Med Verlag AG: Bremen, Germany, 2011; pp. 10–33. [Google Scholar]
- Mahan, D.C.; Watts, M.R.; St-Pierre, N. Macro- and micromineral composition of fetal pigs and their accretion rates during fetal development1,2. J. Anim. Sci. 2009, 87, 2823–2832. [Google Scholar] [CrossRef] [PubMed]
- Mahan, D.C.; Shields, R.G. Macro- and micromineral composition of pigs from birth to 145 kilograms of body weight. J. Anim. Sci. 1998, 76, 506–512. [Google Scholar] [CrossRef] [Green Version]
- Matte, J.J.; Girard, C.L. Changes of serum and blood volumes during gestation and lactation in multiparous sows. Can. J. Anim. Science. 1996, 76, 263–266. [Google Scholar] [CrossRef]
- Fry, M.M.; Kirk, C.A. Reticulocyte indices in a canine model of nutritional iron deficiency. Vet Clin Pathol. 2006, 35, 172–181. [Google Scholar] [CrossRef]
- Brugnara, C. Iron Deficiency and Erythropoiesis: New Diagnostic Approaches. Clin. Chem. 2003, 49, 1573–1578. [Google Scholar] [CrossRef]
- Goodnough, L.T.; Skikne, B.; Brugnara, C. Erythropoietin, iron, and erythropoiesis. Blood 2000, 96, 823–833. [Google Scholar] [CrossRef]
- Mudd, A.T.; Fil, J.E.; Knight, L.C.; Lam, F.; Liang, Z.-P.; Dilger, R.N. Early-Life Iron Deficiency Reduces Brain Iron Content and Alters Brain Tissue Composition Despite Iron Repletion: A Neuroimaging Assessment. Nutrients 2018, 10, 135. [Google Scholar] [CrossRef] [Green Version]
- Rytych, J.L.; Elmore, M.R.P.; Burton, M.D.; Conrad, M.S.; Donovan, S.M.; Dilger, R.N.; Johnson, R.W. Early Life Iron Deficiency Impairs Spatial Cognition in Neonatal Piglets. J. Nutr. 2012, 142, 2050–2056. [Google Scholar] [CrossRef] [Green Version]
- Calvo, J.J.; Allue, J.R.; Escudero, A.; Garcia, L.J. Plasma ferritin of sows during pregnancy and lactation. Cornell Vet. 1989, 79, 273–282. [Google Scholar]
- Rogers, J.T.; Bridges, K.R.; Durmowicz, G.P.; Glass, J.; Auron, P.; Munro, H.N. Translational control during the acute phase response. Ferritin synthesis in response to interleukin-1. J. Biol. Chem. 1990, 265, 14572–14578. [Google Scholar] [CrossRef]


| Sampling Point | Gestation Day | Blood Removal Group | Control Group | |||
|---|---|---|---|---|---|---|
| Hb ‡, Mean before Removal (SD ε), g/L | Mean Hb, % Drop Immediately after Removal | Mean Hb, % Rise before Next Blood Removal | Gestation Day | Hb, Mean (SD), g/L | ||
| Blood removal 1 | 71–72 | 113 (5.5) | 12.2 | 10.4 | 72–77 | 103 (15.8) |
| Blood removal 2 | 85–86 | 110 (6.5) | 13.3 | 5.5 | 84–86 | 117 (7.24) |
| Blood removal 3 | 99–100 | 101 (7.6) | 10.6 | 1.9 | 99–100 | 116 (6.53) |
| Blood removal 4 | 106–107 | 92 (9.8) | 8.7 | 0.8 | 106–108 | 116 (11.0) |
| At Farrowing | 117–119 | 85 (8.2) | 117–119 | 106 (7.6) | ||
| Experimental Groups | p-Value | ||||
|---|---|---|---|---|---|
| Blood Removal (n = 4) | Control (n = 4) | ||||
| Mean (SD †) | Median | Mean (SD) | Median | ||
| Hematocrit [L/L] | 0.26 (0.02) | 0.26 | 0.32 (0.02) | 0.32 | 0.01 * |
| Red blood cell count [bill/L] | 4.1 (0.25) | 4.1 | 5.2 (0.18) | 5.2 | 0.0004 *** |
| MCH [fmol] | 1.2 (0.12) | 1.3 | 1.2 (0.08) | 1.2 | 0.9 |
| MCV [fL] | 64.2 (6.0) | 66.8 | 62.4 (3.2) | 61.5 | 0.6 |
| MCHC [mmol/L] | 19.6 (0.4) | 19.7 | 20.1 (0.4) | 20.2 | 0.16 |
| Leukocyte Count [bill/L] | 7 (2.9) | 7.3 | 11 (3.4) | 11.5 | 0.12 |
| Absolute reticulocyte count [bill/L] | 57.2 (25.8) | 51.9 | 30.3 (16.3) | 23 | 0.12 |
| CHCMr [mmol/L] | 16.8 (0.35) | 16.9 | 18 (0.56) | 17.8 | 0.01 * |
| CHr [fmol] | 1.1 (0.19) | 1.1 | 1.3 (0.02) | 1.3 | 0.27 |
| MCVr [fL] | 71.4 (10.5) | 70.1 | 73.6 (3.1) | 73.1 | 0.6 |
| HDWr [mmol/L] | 2.3 (0.41) | 2.2 | 2.2 (0.29) | 2.2 | 0.6 |
| RDWr [%] | 18.1 (2.31) | 18.3 | 18.9 (3.38) | 17.7 | 0.7 |
| TIBC [μmol] | 59.47 (6.11) | 58.32 | 57.31 (2.35) | 57.29 | 0.5 |
| Serum iron [μmol] | 18.95 (8.98) | 19.70 | 19.43 (3.83) | 18.20 | 0.8 |
| Transferrin saturation [%] | 32.51 (17.3) | 31.42 | 33.80 (5.63) | 32.76 | 0.9 |
| Sampling Point | Gestation Day | Blood Removal Group | Control Group | |||
|---|---|---|---|---|---|---|
| Hb ‡, Mean before Removal (SD ε), g/L | Mean Hb, % Drop Immediately after Removal | Mean Hb, % Rise before Next Blood Removal | Gestation Day | Hb, Mean (SD), g/L | ||
| Blood removal 1 | 42–44 | 125 (13) | 12.9 | 8.4 | 42–44 | 130.1 (11.4) |
| Blood removal 2 | 56–58 | 118 (25.2) | 12.1 | 0 | 56–58 | 144.3 (29.6) |
| Blood removal 3 | 70–72 | 104 (5.9) | 15.5 | 15.2 | 70–72 | 121.1 (4.1) |
| Blood removal 4 | 84–86 | 101 (4.1) | 11.8 | 14.3 | 84–86 | 117.2 (5.7) |
| Blood removal 5 | 98–100 | 102 (7.6) | 11.0 | 3.5 | 98–100 | 121.1 (6.1) |
| Blood removal 6 | 105–107 | 94 (0.9) | 13.7 | 105–107 | 122.0 (4.6) | |
| At Farrowing | 82 (5.7) | 106.6 (8.2) | ||||
| Experimental Groups | p-Value ‡ | ||||
|---|---|---|---|---|---|
| Blood Removal (n = 4) | Control (n = 5) | ||||
| Mean (SD †) | Median | Mean (SD) | Median | ||
| Hematocrit [L/L] | 0.26 (0.01) | 0.25 | 0.32 (0.24) | 0.32 | 0.002 ** |
| Red blood cell count [bill/L] | 3.89 (0.22) | 3.89 | 5.31 (0.86) | 5.31 | <0.0001 **** |
| MCH [fmol] | 1.30 (0.52) | 1.33 | 1.24 (0.08) | 1.27 | 0.24 |
| MCV [fL] | 67.12 (2.86) | 68.20 | 61.42 (3.67) | 61.40 | 0.038 * |
| MCHC [mmol/L] | 19.49 (0.24) | 19.54 | 20.28 (0.46) | 20.26 | 0.01 * |
| Leukocyte count [bill/L] | 7.20 (4.24) | 8.35 | 9.88 (2.83) | 9.38 | 0.29 |
| Absolute reticulocyte count [bill/L] | 53.70 (27.08) | 54.85 | 38.76 (20.33) | 32.40 | 0.37 |
| CHCMr [mmol/L] | 16.70 (16.69) | 16.80 | 17.37 (17.36) | 17.49 | 0.17 |
| CHr [fmol] | 1.2 (0.06) | 1.19 | 1.34 (0.07) | 1.36 | 0.02 * |
| MCVr [fL] | 72.8 (1.80) | 73.4 | 78.38 (6.86) | 77.30 | 0.16 |
| HDWr [mmol/L] | 2.26 (0.57) | 2.07 | 2.10 (0.32) | 2.18 | 0.60 |
| RDWr [%] | 16.82 (3.53) | 15.55 | 16.04 (1.24) | 16.20 | 0.65 |
| Experimental Groups | p-Value ‡ | ||||||
|---|---|---|---|---|---|---|---|
| Blood Removal (n = 33) | Control (n = 37) | ||||||
| Mean (SD †) | Median | Mean (SD) | Median | Effect Estimate | 95% CI α | p-Value | |
| Hemoglobin [g/L] | 100.6 (14.31) | 101 | 113.0 (9.64) | 112.7 | −11.54 | −23.11; 0.18 | 0.058 |
| Hematocrit [L/L] | 0.33 (0.04) | 0.33 | 0.37 (0.03) | 0.37 | −0.038 | −0.07; −0.001 | 0.04 * |
| Red blood cell count [bill/L] | 5.13 (0.64) | 5.17 | 5.58 (0.54) | 5.57 | −0.43 | −0.83; −0.02 | 0.04 * |
| MCH [fmol] | 1.21 (0.08) | 1.21 | 1.25 (0.06) | 1.25 | −0.037 | −0.1; 0.02 | 0.24 |
| MCV [fL] | 64.82 (4.35) | 64.5 | 67.22 (3.15) | 67.2 | −2.17 | −5.28; 1.0 | 0.16 |
| MCHC [mmol/L] | 18.76 (0.54) | 18.68 | 18.73 (0.49) | 18.73 | 0.04 | −0.47; 0.58 | 0.84 |
| Leukocyte count [bill/L] | 6.21 (1.9) | 6.07 | 5.45 (1.66) | 5.6 | 0.7 | −1.12; 2.53 | 0.41 |
| Absolute reticulocyte count [mia/L] | 200.0 (82.4) | 222.9 | 262.6 (45.27) | 268.6 | −56.97 | −142.19; 28.43 | 0.17 |
| CHCMr [mmol/L] | 15.68 (0.31) | 15.68 | 15.93 (0.4) | 15.9 | −0.23 | −0.55; 0.07 | 0.13 |
| CHr [fmol] | 1.07 (0.09) | 1.09 | 1.14 (0.05) | 1.13 | −0.05 | −0.12; 0.02 | 0.14 |
| MCVr [fL] | 69.14 (5.55) | 70.1 | 71.9 (2.79) | 71.7 | −2.41 | −6.65; 1.87 | 0.24 |
| HDWr [mmol/L] | 2.28 (0.3) | 2.27 | 2.02 (0.14) | 2.04 | 0.24 | −0.03; 0.53 | 0.09 |
| RDWr [%] | 14.37 (1.75) | 13.70 | 13.65 (0.67) | 13.6 | 0.6 | −0.86; 2.06 | 0.38 |
| Glucose [mg/dL] | 1.98 (0.88) | 1.75 | 1.79 (0.75) | 1.6 | 0.11 | −0.57; 0.78 | 0.71 |
| Lactate [mmol/L] | 4.72 (2.32) | 4.19 | 4.44 (1.39) | 4.09 | 0.27 | −0.6; 1.22 | 0.5 |
| TIBC [μmol] | 17.26 (5.7) | 15.93 | 14.19 (4.54) | 13.39 | 2.93 | −0.9; 6.68 | 0.12 |
| Serum iron [μmol] | 4.58 (2.1) | 4.4 | 4.53 (1.38) | 4.25 | 0.05 | −0.81; 0.9 | 0.89 |
| Transferrin saturation [%] | 28.24 (12.94) | 25.1 | 35.12 (16.06) | 31.03 | −7.47 | −20.20; 5.02 | 0.22 |
| Experimental Groups | p-Value ‡ | ||||||
|---|---|---|---|---|---|---|---|
| Blood Removal (n = 27) | Control (n = 40) | ||||||
| Mean (SD †) | Median | Mean (SD) | Median | Effect Estimate | 95% CI α | p-Value | |
| Hemoglobin [g/L] | 93.14 (14.80) | 93.04 | 98.40 (16.19) | 95.04 | −5.34 | −18.65; 8.01 | 0.40 |
| Hematocrit [L/L] | 0.29 (0.04) | 0.29 | 0.32 (0.05) | 0.30 | −0.02 | −0.06; 0.02 | 0.35 |
| Red blood cell count [bill/L] | 4.51 (0.73) | 4.70 | 4.92(0.81) | 4.72 | −0.38 | −1.03; 0.27 | 0.23 |
| MCH [fmol] | 1.28 (0.06) | 1.29 | 1.28 (0.07) | 1.24 | 0.03 | −0.02; 0.08 | 0.23 |
| MCV [fL] | 66.25 (3.98) | 64.7 | 65.15 (3.56) | 66.0 | 1.76 | −2.76; 4.21 | 0.64 |
| MCHC [mmol/L] | 19.39 (0.56) | 19.41 | 19.10 (0.43) | 19.14 | 0.24 | −0.22–0.69 | 0.27 |
| Leukocyte count [bill/L]WBCB | 13.07 (5.03) | 11.80 | 11.58(4.35) | 12.25 | 1.23 | −3.01; 5.39 | 0.54 |
| Absolute reticulocyte count [bill/L] | 160.06 (33.34) | 156.0 | 224.91(43.95) | 216.1 | −65.34 | −100.70; −30.33 | 0.002 ** |
| CHCMr [mmol/L] | 15.35 (0.25) | 15.32 | 15.34 (0.36) | 15.34 | −0.03 | −0.34; 0.26 | 0.80 |
| CHr [fmol] | 1.10 (0.05) | 1.11 | 1.12 (0.05) | 1.13 | −0.02 | −0.06; 0.01 | 0.31 |
| MCVr [fL] | 72.59 (3.39) | 72.50 | 73.73 (4.08) | 74.18 | −1.38 | −4.67; 1.81 | 0.37 |
| HDWr [mmol/L] | 2.42 (0.18) | 2.40 | 2.29 (0.23) | 2.26 | 0.13 | −0.08; 0.36 | 0.20 |
| RDWr [%] | 14.96 (0.89) | 14.80 | 14.36 (0.63) | 14.25 | 0.66 | 0.06; 1.30 | 0.04 |
| Experimental Group | ||
|---|---|---|
| Blood Removal (n = 4) | Control (n = 4) | |
| Parity | 3.75 (SD α 1.29) | 3.75 (SD 0.82) |
| Total born (liveborn + stillborn) [n] | 19.75/litter | 20.5/L |
| Still born [n] | 8 (10.1%) | 3 (3.6%) |
| Mummified [n] | 5 | 0 |
| Farrowing duration [min] | 296 (SD 158) | 341 (SD 112) |
| Assisted births [n] | 1.25/L (SD 0) | 1/L (SD 1.63) |
| Birthweight [g] | 1253 (SD 313) | 1273 (SD 347) |
| Experimental Group | ||
|---|---|---|
| Blood Removal n = 3 * | Control n = 5 | |
| Parity | 3.2 (0.84 SD α) | 2.8 (SD 0.84) |
| Total born (liveborn + stillborn) [n] | 20.33 (SD 3.78)/L | 21.00 (SD 5.78)/L |
| Still born [n] | 7 (11.4%) | 10 (9.5%) |
| Mummified [n] | 0.00 | 0.6 |
| Farrowing duration [min] | 603.66 (SD 345.04) | 331.20 (SD 292.84) |
| Assisted births [n] | 0.6 (1.1) | 0.2 (0.4) |
| Birthweight [g] | 1368.63 (SD 235.49) | 1241.74 (SD 132.32) |
| Organ | Experimental Group | p-Value | |
|---|---|---|---|
| Blood Removal (n = 20) | Control (n = 25) | ||
| Right kidney | 4.26 (1.06) | 4.66 (1.19) | 0.29 |
| Left kidney | 4.34 (0.98) | 4.60 (1.32) | 0.51 |
| Liver | 32.84 (7.57) | 32.33 (4.26) | 0.86 |
| Spleen | 1.33 (0.46) | 1.22 (0.24) | 0.41 |
| Brain | 25.87 (4.71) | 29.58 (7.09) | 0.19 |
Publisher’s Note: MDPI stays neutral with regard to jurisdictional claims in published maps and institutional affiliations. |
© 2021 by the authors. Licensee MDPI, Basel, Switzerland. This article is an open access article distributed under the terms and conditions of the Creative Commons Attribution (CC BY) license (https://creativecommons.org/licenses/by/4.0/).
Share and Cite
Rydal, M.P.; Bhattarai, S.; Nielsen, J.P. An Experimental Model for Iron Deficiency Anemia in Sows and Offspring Induced by Blood Removal during Gestation. Animals 2021, 11, 2848. https://doi.org/10.3390/ani11102848
Rydal MP, Bhattarai S, Nielsen JP. An Experimental Model for Iron Deficiency Anemia in Sows and Offspring Induced by Blood Removal during Gestation. Animals. 2021; 11(10):2848. https://doi.org/10.3390/ani11102848
Chicago/Turabian StyleRydal, Martin Peter, Sheeva Bhattarai, and Jens Peter Nielsen. 2021. "An Experimental Model for Iron Deficiency Anemia in Sows and Offspring Induced by Blood Removal during Gestation" Animals 11, no. 10: 2848. https://doi.org/10.3390/ani11102848
APA StyleRydal, M. P., Bhattarai, S., & Nielsen, J. P. (2021). An Experimental Model for Iron Deficiency Anemia in Sows and Offspring Induced by Blood Removal during Gestation. Animals, 11(10), 2848. https://doi.org/10.3390/ani11102848