
Free-Range Feeding Alters Fatty Acid Composition at the sn-2 Position of Triglycerides and Subcutaneous Fat Physicochemical Properties in Heavy Pigs

 ,
,  , , ,
, , ,
Abstract
Simple Summary
Abstract
1. Introduction
2. Materials and Methods
2.1. Experimental Design
2.2. Fat Extraction and Triacylglyceride Purification
2.3. Fatty Acid Profile of Subcutaneous Fat
2.4. Triacylglyceride Structure Analysis
2.5. Melting Point of Subcutaneous Fat
2.6. Texture Profile Analysis
2.7. Statistical Analysis
3. Results and Discussion
4. Conclusions
Author Contributions
Funding
Institutional Review Board Statement
Informed Consent Statement
Data Availability Statement
Acknowledgments
Conflicts of Interest
References
- Noblet, J.; van Milgen, J. Energy value of pig feeds: Effect of pig body weight and energy evaluation system. J. Anim. Sci. 2004, 82, E229–E238. [Google Scholar] [CrossRef]
- Mu, H.L.; Hoy, C.E. The digestion of dietary triacylglycerols. Prog. Lipid Res. 2004, 43, 105–133. [Google Scholar] [CrossRef]
- Bracco, U. Effect of triglyceride structure on fat absorption. Am. J. Clin. Nutr. 1994, 60, 1002S–1009S. [Google Scholar] [CrossRef]
- Segura, J.; Ruiz-López, N.; Menoyo, D.; Cambero, M.I.; López-Bote, C.J. Comparison of analytical techniques for the determination of the positional distribution of fatty acids in triacylglycerols. Relationship with pig fat melting point and hardness. Grasas Aceites 2015, 66, e076. [Google Scholar] [CrossRef]
- Ponnampalam, E.N.; Lewandowski, P.; Nesaratnam, K.; Dunshea, F.R.; Gill, H. Differential effects of natural palm oil, chemically-and enzymatically-modified palm oil on weight gain, blood lipid metabolites and fat deposition in a pediatric pig model. Nutr. J. 2011, 10, 1–7. [Google Scholar] [CrossRef][Green Version]
- Gouk, S.W.; Cheng, S.F.; Mok, J.S.L.; Ong, A.S.H.; Chuah, C.H. Long-chain SFA at the sn-1, 3 positions of TAG reduce body fat deposition in C57BL/6 mice. Br. J. Nutr. 2013, 110, 1987–1995. [Google Scholar] [CrossRef]
- Smith, S.B.; Yang, A.J.; Larsen, T.W.; Tume, R.K. Positional analysis of triacylglycerols from bovine adipose tissue lipids varying in degree of unsaturation. Lipids 1998, 33, 197–207. [Google Scholar] [CrossRef]
- Segura, J.; Escudero, R.; Romero de Ávila, M.D.; Cambero, M.I.; López-Bote, C.J. Effect of fatty acid composition and positional distribution within the triglyceride on selected physical properties of dry-cured ham subcutaneous fat. Meat Sci. 2015, 103, 90–95. [Google Scholar] [CrossRef]
- King, D.A.; Behrends, J.M.; Jenschke, B.E.; Rhoades, R.D.; Smith, S.B. Positional distribution of fatty acids in triacylglycerols from subcutaneous adipose tissue of pigs fed diets enriched with conjugated linoleic acid, corn oil, or beef tallow. Meat Sci. 2004, 67, 675–681. [Google Scholar] [CrossRef]
- Segura, J.; Cambero, M.I.; Cámara, L.; Loriente, C.; Mateos, G.G.; López-Bote, C.J. Effect of sex, dietary glycerol or dietary fat during late fattening, on fatty acid composition and positional distribution of fatty acids within the triglyceride in pigs. Animal 2015, 9, 1904–1911. [Google Scholar] [CrossRef][Green Version]
- Rey, A.I.; López-Bote, C.J.; Kerry, J.P.; Lynch, P.B.; Buckley, D.J.; Morrissey, P.A. Modification of lipid composition and oxidation in porcine muscle and muscle microsomes as affected by dietary supplementation of n-3 with either n-9 or n-6 fatty acids and α-tocopheryl acetate. Anim. Feed Sci. Technol. 2004, 113, 223–238. [Google Scholar] [CrossRef]
- Daza, A.; Rey, A.I.; Olivares, A.; Cordero, G.; Toldrá, F.; López-Bote, C.J. Physical activity-induced alterations on tissue lipid composition and lipid metabolism in fattening pigs. Meat Sci. 2009, 81, 641–646. [Google Scholar] [CrossRef]
- Rey, A.I.; Daza, A.; López-Carrasco, C.; López-Bote, C.J. Quantitative study of the α- and γ-tocopherols accumulation in muscle and backfat from Iberian pigs kept free-range as affected by time of free-range feeding or weight gain. Anim. Sci. 2006, 82, 901–908. [Google Scholar] [CrossRef]
- Daza, A.; Mateos, A.; Rey, A.I.; Ovejero, I.; López-Bote, C.J. Effect of duration of feeding under free-range conditions on production results and carcass and fat quality in Iberian pigs. Meat Sci. 2007, 76, 411–416. [Google Scholar] [CrossRef]
- Daza, A.; Rey, A.I.; Menoyo, D.; Bautista, J.M.; Olivares, A.; López-Bote, C.J. Effect of level of feed restriction during growth and/or fattening on fatty acid composition and lipogenic enzyme activity in heavy pigs. Anim. Feed Sci. Technol. 2007, 138, 61–74. [Google Scholar] [CrossRef]
- Ayuso, M.; Fernández, A.; Núñez, Y.; Benítez, R.; Isabel, B.; Barragán, C.; Fernández, A.I.; Rey, A.I.; Medrano, J.F.; Cánovas, A.; et al. Comparative Analysis of Muscle Transcriptome between Pig Genotypes Identifies Genes and Regulatory Mechanisms Associated to Growth, Fatness and Metabolism. PLoS ONE 2015, 10, e0145162. [Google Scholar] [CrossRef]
- BOE. Real Decreto 4/2014, de 10 de Enero, por el que se Aprueba la Norma de Calidad para la Carne, el Jamón, la Paleta y la Caña de Lomo Ibérico; Boletín Oficial del Estado, Num.10, de 11 de Enero de 2014; Government of Spain: Madrid, Spain, 2014; pp. 1569–1585. [Google Scholar]
- Daza, A.; Rey, A.I.; Ruiz, J.; López-Bote, C.J. Effects of feeding in free-range conditions or in confinement with different dietary MUFA/PUFA ratios and α-tocopheryl acetate, on antioxidants accumulation and oxidative stability in Iberian pigs. Meat Sci. 2005, 69, 151–163. [Google Scholar] [CrossRef]
- Segura, J.; Calvo, L.; Óvilo, C.; González-Bulnes, A.; Olivares, A.; Cambero, M.I.; López-Bote, C.J. Alternative method for intramuscular fat analysis using common laboratory equipment. Meat Sci. 2015, 103, 24–27. [Google Scholar] [CrossRef]
- Garcés, R.; Mancha, M. One-step lipid extraction and fatty acid methyl esters preparation from fresh plant tissues. Anal. Biochem. 1993, 211, 139–143. [Google Scholar] [CrossRef]
- ISO 6321:2002. Animal and Vegetable Fats and Oils—Determination of Melting Point in Open Capillary Tubes (Slip Point), Second Edition, 2–15. 2002. Available online: www.iso.org/obp/ui/#iso:std:iso:6321:ed-2:v1:en (accessed on 30 May 2021).
- Romero de Ávila, M.D.; Cambero, M.I.; Ordóñez, J.A.; de la Hoz, L.; Herrero, A.M. Rheological behaviour of commercial cooked meat propducts evaluated by tensile test and texture profile analysis (TPA). Meat Sci. 2014, 98, 310–315. [Google Scholar] [CrossRef]
- SAS Institute Inc. SAS 9.4 for Windows; SAS Institute Inc.: Cary, NC, USA, 2014. [Google Scholar]
- Kritchevsky, D.; Tepper, S.A.; Kuksis, A.; Eghtedary, K.; Klurfeld, D.M. Cholesterol vehicle in experimental atherosclerosis. 21. native and randomized lard and tallow. J. Nutr. Biochem. 1998, 9, 582–585. [Google Scholar] [CrossRef]
- Ruiz-Gutiérrez, V.; Morgado, N.; Prada, J.L.; Pérez-Jiménez, F.; Muriana, F.J. Composition of human VLDL triacylglycerols after ingestion of olive oil and high oleic sunflower oil. J. Nutr. 1998, 128, 570–576. [Google Scholar] [CrossRef] [PubMed]
- Mattson, F.H.; Volpenhein, R.A. The specific distribution of unsaturated fatty acids in the triglycerides of plants. J. Lipid Res. 1963, 4, 392–396. [Google Scholar] [CrossRef]
- Ventanas, S.; Tejeda, J.F.; Estévez, M. Chemical composition and oxidative status of tissues from Iberian pigs as affected by diets: Extensive feeding v. oleic acid- and tocopherol-enriched mixed diets. Animal 2008, 2, 621–630. [Google Scholar] [CrossRef] [PubMed]
- Rey, A.I.; Menoyo, D.; Segura, J.; López-Bote, C.J.; Calvo, L. Combination of dietary glycaemic index and fasting time prior to slaughter as strategy to modify quality of pork. Meat Sci. 2020, 161. [Google Scholar] [CrossRef]
- Christie, W.W.; Moore, J.H. A comparison of structure of triglycerides from various pig tissues. Biochim. Biophy. Acta 1970, 210, 46–56. [Google Scholar] [CrossRef]
- Innis, S.M.; Nelson, C.M. Dietary triacylglycerols rich in sn-2 palmitate alter post-prandial lipoprotein and unesterified fatty acids in term infants. Prostaglandins Leukot. Essent. Fatty Acids 2013, 89, 145–151. [Google Scholar] [CrossRef] [PubMed]
- Christie, W.W.; Moore, J.H. The variation of triglyceride structure with fatty acid composition in pig adipose tissue. Lipids 1970, 5, 921–928. [Google Scholar] [CrossRef]
- Christie, W.W.; Clapperton, J.L. Structures of the triglycerides of cows’ milk, fortified milks (including infant formulae), and human milk. Int. J. Dairy Technol. 1982, 35, 22–24. [Google Scholar] [CrossRef]
- Innis, S.M. Dietary Triacylglycerol Structure and Its Role in Infant Nutrition. Adv. Nutr. 2011, 2, 275–283. [Google Scholar] [CrossRef]
- Christie, W.W. Structure of the triacyl-sn-glycerols in the plasma and milk of the rat and rabbit. J. Dairy Res. 1985, 52, 219–222. [Google Scholar] [CrossRef] [PubMed]
- Hunter, J.E. Studies on effects of dietary fatty acids as related to their position on triglycerides. Lipids 2001, 36, 655–668. [Google Scholar] [CrossRef] [PubMed]
- Mu, H.L.; Porsgaard, T. The metabolism of structured triacylglycerols. Prog. Lipid Res. 2005, 44, 430–448. [Google Scholar] [CrossRef] [PubMed]
- Innis, S.M.; Dyer, R. Dietary triacylglycerols with palmitic acid (16:0) in the 2-position increase 16:0 in the 2-position of plasma and chylomicron triacylglycerols, but reduce phospholipid arachidonic and docosahexaenoic acids, and alter cholesteryl ester metabolism in formula-fed piglets. J. Nutr. 1997, 127, 1311–1319. [Google Scholar] [CrossRef] [PubMed]
- Innis, S.M.; Dyer, R.; Quinlan, P.T.; Diersen-Schade, D. Dietary triacylglycerol structure and saturated fat alter plasma and tissue fatty acids in piglets. Lipids 1996, 31, 497–505. [Google Scholar] [CrossRef]
- Couëdelo, L.; Vaysse, C.; Vaique, E.; Guy, A.; Gosse, I.; Durand, T.; Pinet, S.; Cansell, M.; Combe, N. The fraction of α-linolenic acid present in the sn-2 position of structured triacylglycerols decreases in lymph chylomicrons and plasma triacylglycerols during the course of lipid absorption in rats. J. Nutr. 2012, 142, 70–75. [Google Scholar] [CrossRef]
- Ventanas, S.; Estevez, M.; Tejeda, J.F.; Ruiz, J. Protein and lipid oxidation in Longissimus dorsi and dry cured loin from Iberian pigs as affected by crossbreeding and diet. Meat Sci. 2006, 72, 647–655. [Google Scholar] [CrossRef]
- López-Bote, C.J.; Isabel, B.; Daza, A. Partial replacement of poly- with monounsaturated fatty acids and vitamin E supplementation in pig diets: Effect on fatty acid composition of subcutaneous and intramuscular fat and on fat and lean firmness. Anim. Sci. 2002, 75, 349–358. [Google Scholar] [CrossRef]
- Wood, J.D.; Enser, M.; Fisher, A.V.; Nute, G.R.; Sheard, P.R.; Richardson, R.I.; Hughes, S.I.; Whittington, F.M. Fat deposition, fatty acid composition and meat quality: A review. Meat Sci. 2008, 78, 343–358. [Google Scholar] [CrossRef]
- Lea, C.H.; Swoboda, P.A.T.; Gatherum, D.P. A chemical study if sift fat ub criss-bred pigs. J. Agric. Sci. 1970, 74, 279–284. [Google Scholar] [CrossRef]
- Casutt, M.M.; Scheeder, M.R.L.; Escher, F.; Dufey, P.A.; Kreuzer, M. Relating texture properties and composition of bovine fat tissue. Fett-Lipid 1999, 101, 283–290. [Google Scholar] [CrossRef]
- Nishioka, T.; Irie, M. Evaluation method for firmness and stickiness of porcine perirenal fat. Meat Sci. 2005, 70, 399–404. [Google Scholar] [CrossRef] [PubMed]
- Sumena, K.B.; Lucy, K.M.; Chungath, J.J.; Ashok, N.; Harshan, K.R. Regional histology of the subcutaneous tissue and the Sweat glands of large white Yorkshire pigs. Tamilnadu J. Vet. Anim. Sci. 2010, 6, 128–135. [Google Scholar]


| Growing | Fattening | ||
|---|---|---|---|
| Ingredients (%) | <87.5 kg | >87.5 kg | |
| Lard | High-Oleic | ||
| Barley NAC 2C/11 | 32.6 | 58.5 | 53.4 |
| Wheat NAC/11 | 40.0 | 30.0 | 30.0 |
| Soy 47 | 14.3 | 4.50 | 4.40 |
| Corn | 8.90 | - | - |
| Lard | 1.00 | 4.00 | 1.20 |
| Minerals (corrector) | 3.20 | 3.00 | 3.00 |
| High-oleic sunflower | - | 0.00 | 8.00 |
| Fatty acids (%) | |||
| C16:0 | 24.5 | 18.7 | |
| C16:1 | 1.25 | 1.29 | |
| C18:0 | 13.2 | 12.5 | |
| C18:1n-9 | 49.8 | 61.7 | |
| C18:2n-6 | 12.5 | 7.10 | |
| C18:3n-3 | 0.43 | 0.48 | |
| EN (MJ/kg) | 10.29 | 10.13 | 10.20 |
| Crude protein (g/kg feed) | 157.0 | 152.6 | |
| Crude fat (g/kg feed) | 45.0 | 77.5 | |
| Crude fiber (g/kg feed) | 50.0 | 57.2 | |
| Ash (g/kg feed) | 52.3 | 63.7 | |
| Lard | High-Oleic Sunflower Oil | Acorn | ||
|---|---|---|---|---|
| TAG | C14:0 | 1.07 | 0.871 | 0.070 |
| C16:0 | 23.6 | 18.1 | 15.3 | |
| C16:1 | 1.92 | 1.95 | 1.88 | |
| C18:0 | 13.7 | 12.1 | 2.68 | |
| C18:1n-9 | 47.1 | 59.7 | 61.5 | |
| C18:2n-6 | 12.1 | 6.78 | 17.9 | |
| C18:3n-3 | 0.569 | 0.465 | 0.705 | |
| sn-2 | C14:0 | 0.005 | 0.006 | 0.007 |
| C16:0 | 68.9 | 21.1 | 1.78 | |
| C16:1 | 2.54 | 2.48 | 1.66 | |
| C18:0 | 9.05 | 14.0 | 0.296 | |
| C18:1n-9 | 16.1 | 57.2 | 65.3 | |
| C18:2n-6 | 3.31 | 4.95 | 30.3 | |
| C18:3n-3 | 0.127 | 0.311 | 0.671 | |
| sn-1,3 | C14:0 | 1.60 | 1.30 | 0.101 |
| C16:0 | 0.988 | 16.6 | 22.1 | |
| C16:1 | 1.61 | 1.68 | 1.99 | |
| C18:0 | 16.0 | 11.2 | 3.87 | |
| C18:1n-9 | 62.6 | 61.0 | 59.6 | |
| C18:2n-6 | 16.4 | 7.69 | 11.7 | |
| C18:3n-3 | 0.790 | 0.542 | 0.722 |
| LARD 3 | SUN 4 | EXT 5 | MSE 2 | p-Value 1 | ||||
|---|---|---|---|---|---|---|---|---|
| C14:0 | 1.45 | a | 1.41 | a | 1.06 | b | 0.0039 | 0.0001 |
| C15:0 | 0.051 | ab | 0.043 | b | 0.058 | a | 0.0001 | 0.0139 |
| C16:0 | 24.5 | a | 23.7 | a | 18.2 | b | 0.1085 | 0.0001 |
| C16:1n-7 | 2.58 | a | 2.58 | a | 2.05 | b | 0.0192 | 0.0001 |
| C17:0 | 0.273 | 0.246 | 0.276 | 0.0006 | 0.1203 | |||
| C17:1 | 0.311 | a | 0.270 | b | 0.271 | b | 0.0006 | 0.0135 |
| C18:0 | 12.4 | a | 11.2 | a | 7.87 | b | 0.2485 | 0.0001 |
| C18:1n-9 | 48.0 | c | 50.7 | b | 57.9 | a | 0.3227 | 0.0001 |
| C18:2n-6 | 7.71 | b | 7.13 | b | 9.44 | a | 0.0757 | 0.0001 |
| C18:3n-3 | 0.603 | b | 0.546 | b | 0.706 | a | 0.0016 | 0.0001 |
| C20:0 | 0.199 | 0.191 | 0.171 | 0.0006 | 0.1245 | |||
| C20:1n-9 | 1.22 | b | 1.19 | b | 1.38 | a | 0.0040 | 0.0002 |
| C20:3n-6 | 0.510 | 0.559 | 0.477 | 0.0097 | 0.3945 | |||
| C20:4n-6 | 0.144 | 0.139 | 0.149 | 0.0001 | 0.2024 | |||
| SFA 6 | 38.9 | a | 36.8 | a | 27.6 | b | 0.4571 | 0.0001 |
| MUFA 7 | 52.1 | c | 54.8 | b | 61.6 | a | 0.3420 | 0.0001 |
| PUFA 8 | 8.97 | b | 8.38 | b | 10.8 | a | 0.0837 | 0.0001 |
| UI 9 | 71.5 | c | 73.0 | b | 84.6 | a | 0.7588 | 0.0001 |
| Σn-6/Σn-3 10 | 13.9 | 14.3 | 14.3 | 0.3259 | 0.2714 | |||
| SFA/PUFA | 4.34 | a | 4.40 | a | 2.57 | b | 0.0251 | 0.0001 |
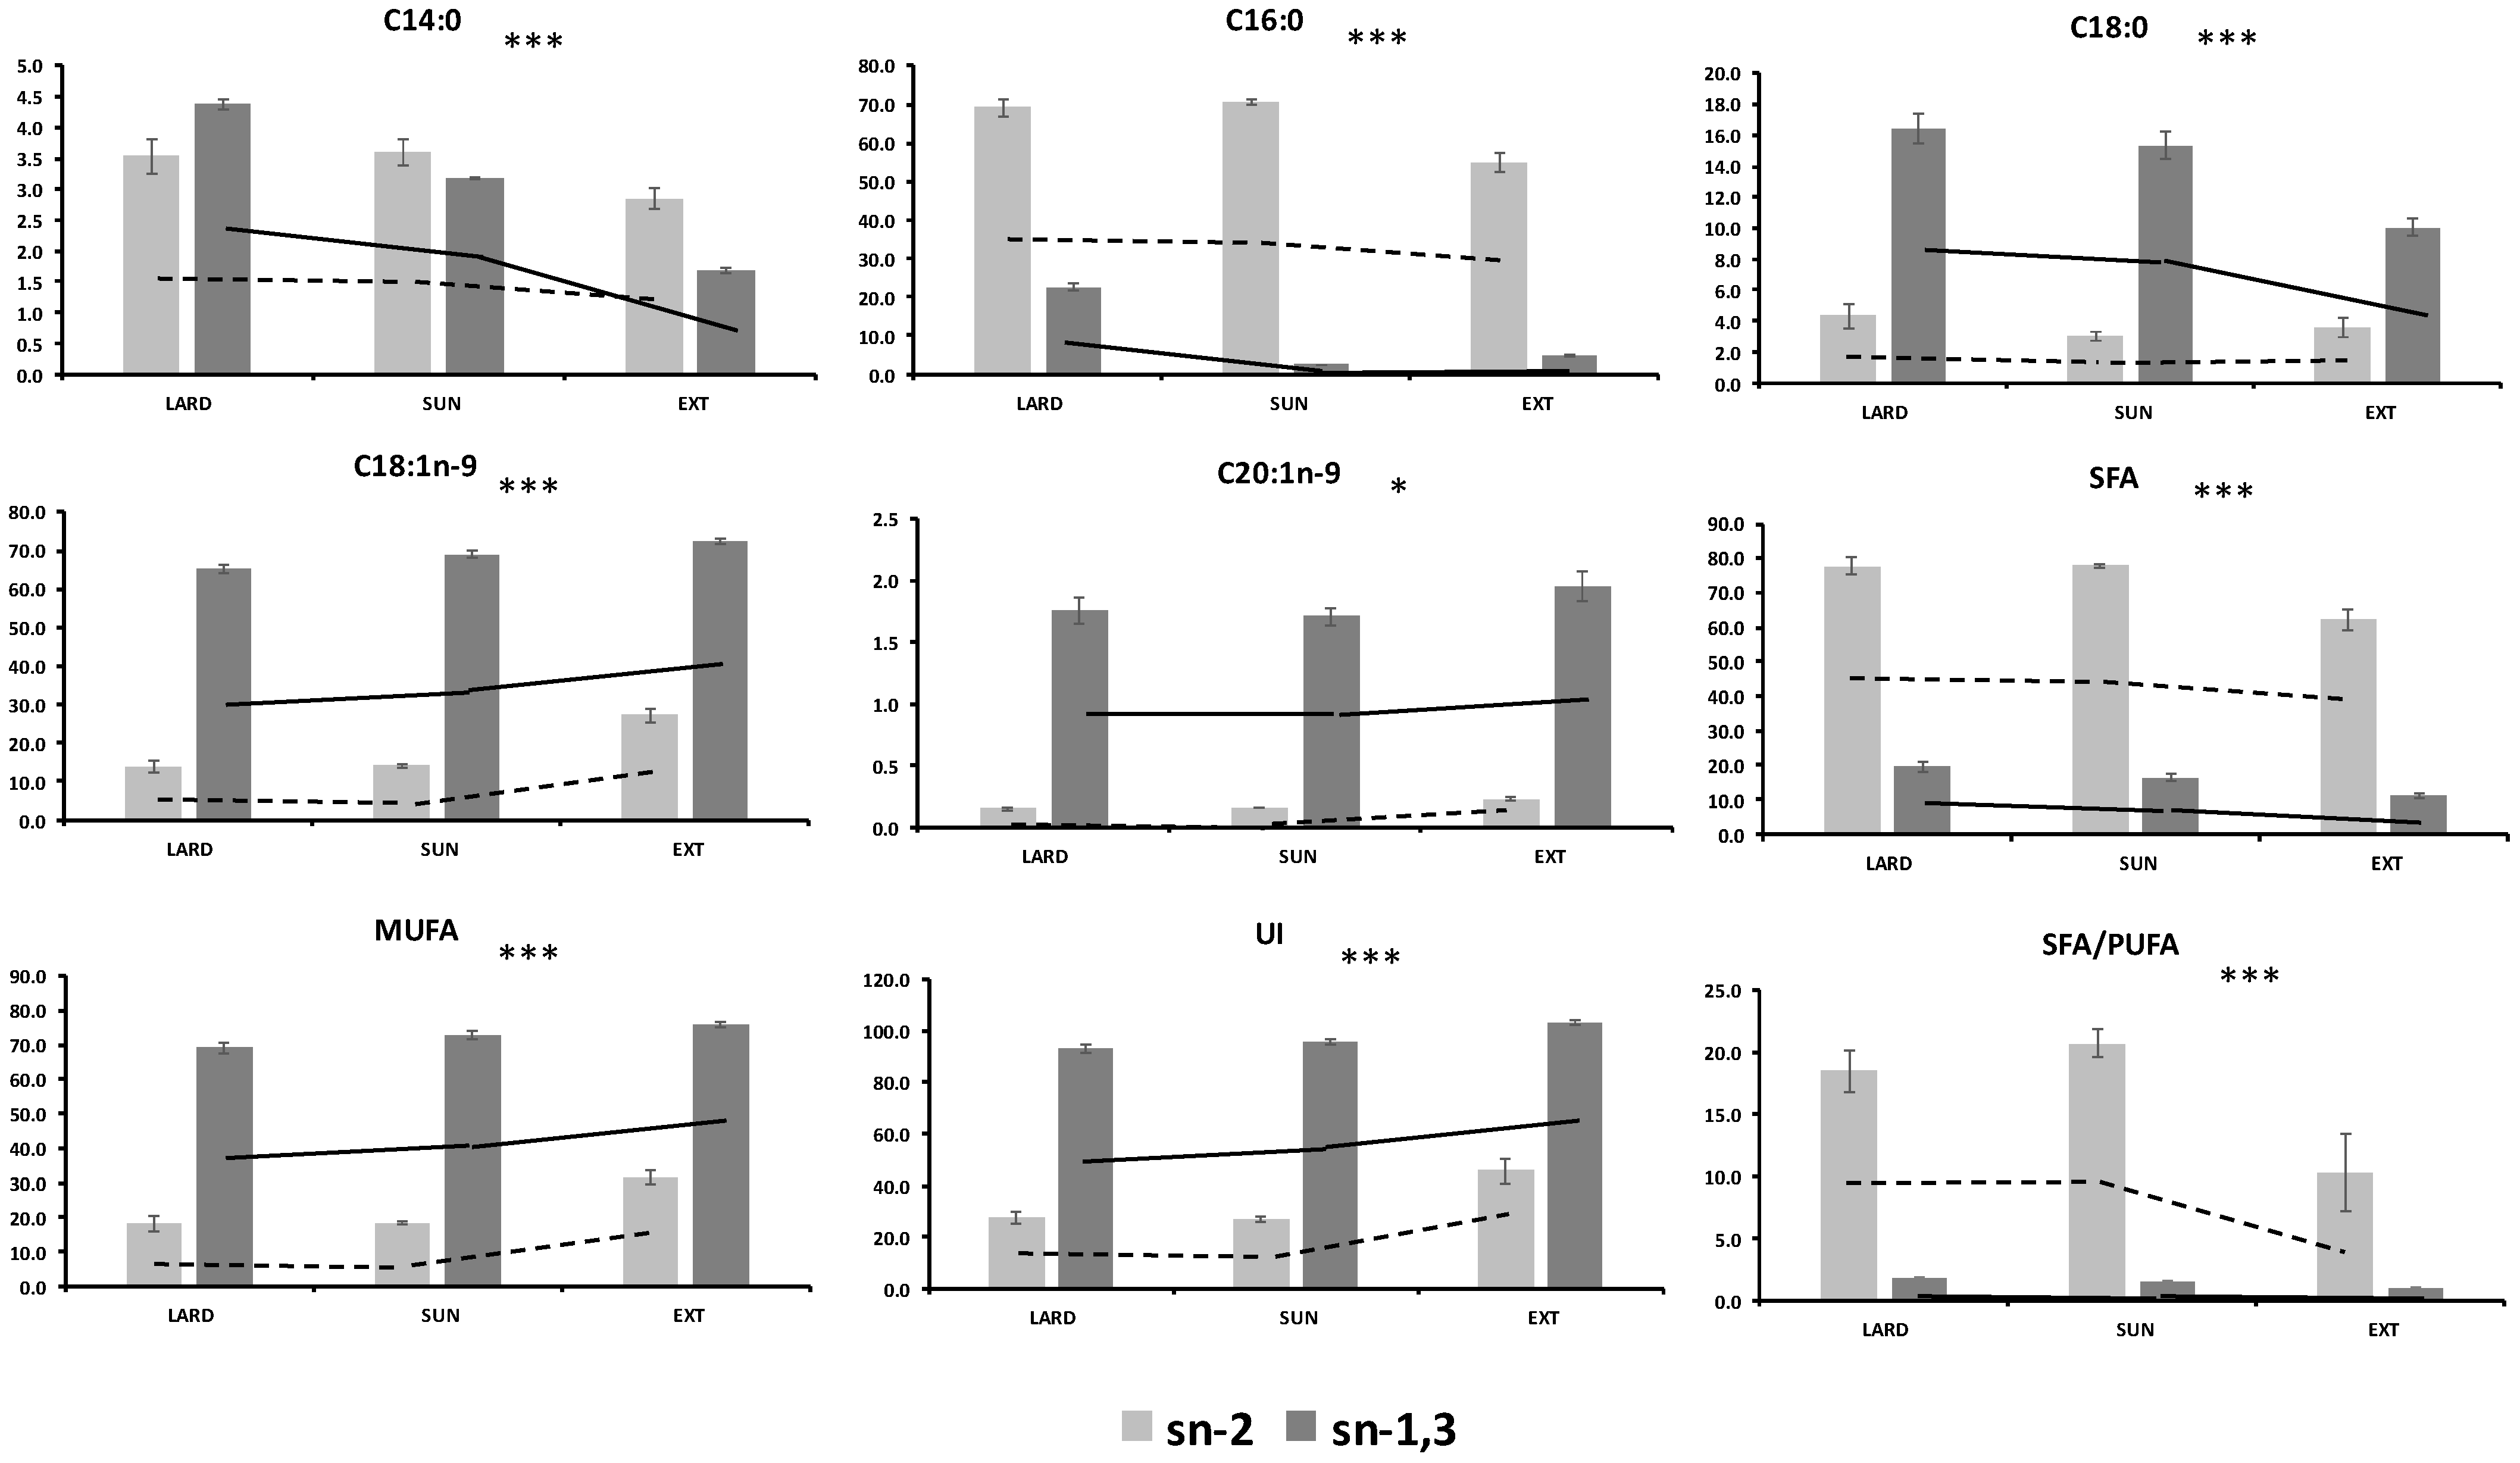
| LARD 3 | SUN 4 | EXT 5 | MSE 2 | p-Value 1 | |||||||
|---|---|---|---|---|---|---|---|---|---|---|---|
| D | P | D × P | |||||||||
| C14:0 | sn-2 | 3.54 | a | 3.61 | a | 2.85 | b | 0.0270 | 0.0001 | 0.0001 | 0.0010 |
| sn-1,3 | 0.439 | a | 0.318 | b | 0.168 | c | |||||
| C15:0 | sn-2 | 0.146 | a | 0.117 | b | 0.150 | a | 0.0003 | 0.0281 | 0.0001 | 0.2167 |
| sn-1,3 | 0.016 | 0.007 | 0.013 | ||||||||
| C16:0 | sn-2 | 69.2 | a | 70.7 | a | 55.0 | b | 2.4494 | 0.0001 | 0.0001 | 0.0001 |
| sn-1,3 | 2.26 | a | 1.23 | b | 0.460 | c | |||||
| C16:1n-7 | sn-2 | 3.76 | 3.76 | 3.69 | 0.1861 | 0.0459 | 0.0001 | 0.1163 | |||
| sn-1,3 | 1.99 | a | 2.00 | a | 1.23 | b | |||||
| C17:0 | sn-2 | 0.425 | b | 0.367 | b | 0.507 | a | 0.0020 | 0.0335 | 0.0001 | 0.0009 |
| sn-1,3 | 0.197 | a | 0.185 | ab | 0.160 | b | |||||
| C17:1 | sn-2 | 0.356 | b | 0.321 | b | 0.417 | a | 0.0022 | 0.1898 | 0.0001 | 0.0008 |
| sn-1,3 | 0.289 | a | 0.244 | ab | 0.198 | b | |||||
| C18:0 | sn-2 | 4.31 | a | 3.01 | b | 3.56 | b | 0.5657 | 0.0001 | 0.0001 | 0.0001 |
| sn-1,3 | 16.4 | a | 15.3 | a | 10.0 | b | |||||
| C18:1n-9 | sn-2 | 13.7 | b | 14.0 | b | 27.2 | a | 1.5760 | 0.0001 | 0.0001 | 0.0001 |
| sn-1,3 | 65.2 | c | 68.1 | b | 72.7 | a | |||||
| C18:2n-6 | sn-2 | 3.33 | b | 2.82 | b | 5.23 | a | 0.3687 | 0.0001 | 0.0001 | 0.8371 |
| sn-1,3 | 9.80 | b | 9.29 | b | 11.4 | a | |||||
| C18:3n-3 | sn-2 | 0.333 | b | 0.297 | b | 0.528 | a | 0.0064 | 0.0001 | 0.0001 | 0.1407 |
| sn-1,3 | 0.727 | b | 0.670 | b | 0.795 | a | |||||
| C20:0 | sn-2 | 0.142 | a | 0.130 | a | 0.090 | b | 0.0015 | 0.1195 | 0.0001 | 0.6713 |
| sn-1,3 | 0.227 | 0.222 | 0.211 | ||||||||
| C20:1n-9 | sn-2 | 0.147 | b | 0.156 | b | 0.220 | a | 0.0054 | 0.0001 | 0.0001 | 0.0309 |
| sn-1,3 | 1.76 | b | 1.71 | b | 1.95 | a | |||||
| C20:3n-6 | sn-2 | 0.456 | 0.542 | 0.471 | 0.0393 | 0.6832 | 0.5952 | 0.9002 | |||
| sn-1,3 | 0.537 | 0.567 | 0.481 | ||||||||
| C20:4n-6 | sn-2 | 0.105 | 0.107 | 0.135 | 0.0010 | 0.5565 | 0.0012 | 0.3539 | |||
| sn-1,3 | 0.164 | 0.155 | 0.156 | ||||||||
| SFA 6 | sn-2 | 77.8 | a | 78.0 | a | 62.1 | b | 3.9942 | 0.0001 | 0.0001 | 0.0001 |
| sn-1,3 | 19.6 | a | 16.3 | b | 11.0 | c | |||||
| MUFA 7 | sn-2 | 18.0 | b | 18.3 | b | 31.5 | a | 2.6230 | 0.0001 | 0.0001 | 0.0001 |
| sn-1,3 | 69.2 | c | 73.0 | b | 76.1 | a | |||||
| PUFA 8 | sn-2 | 4.23 | b | 3.76 | b | 6.36 | a | 0.3805 | 0.0001 | 0.0001 | 0.5854 |
| sn-1,3 | 11.2 | b | 10.7 | b | 12.9 | a | |||||
| UI 9 | sn-2 | 27.4 | b | 26.9 | b | 45.5 | a | 6.1958 | 0.0001 | 0.0001 | 0.0001 |
| sn-1,3 | 93.3 | b | 95.9 | b | 103.4 | a | |||||
| Σn-6/Σn-3 10 | sn-2 | 11.7 | 11.7 | 11.4 | 1.2720 | 0.8128 | 0.0001 | 0.4744 | |||
| sn-1,3 | 14.5 | 14.9 | 15.3 | ||||||||
| SFA/PUFA | sn-2 | 18.5 | a | 20.8 | a | 10.3 | b | 2.5737 | 0.0001 | 0.0001 | 0.0001 |
| sn-1,3 | 1.74 | a | 1.53 | b | 0.859 | c | |||||
| LARD | SUN | EXT | MSE 3 | p-Value 2 | ||||
|---|---|---|---|---|---|---|---|---|
| Moisture (%) | 6.5 | a | 5.7 | b | 4.80 | c | 0.16 | 0.0001 |
| Melting Point (°C) | 30.5 | a | 29.4 | b | 26.4 | c | 0.19 | 0.0001 |
| Hardness (N) | 44.1 | a | 40.6 | b | 32.9 | c | 1.14 | 0.0039 |
| Adhesiveness (N × s) | −0.41 | a | -0.27 | b | -0.07 | c | 0.04 | 0.0001 |
| Springiness (×10−3) (m) | 1.11 | a | 0.47 | b | 0.67 | ab | 0.20 | 0.1001 |
| Cohesiveness | 0.56 | a | 0.59 | a | 0.50 | b | 0.02 | 0.0225 |
| Gumminess (N) | 25.0 | a | 24.0 | a | 16.6 | b | 1.67 | 0.0038 |
| Chewiness (×10−2) (J) | 2.82 | a | 1.11 | b | 1.09 | b | 0.49 | 0.0400 |
Publisher’s Note: MDPI stays neutral with regard to jurisdictional claims in published maps and institutional affiliations. |
© 2021 by the authors. Licensee MDPI, Basel, Switzerland. This article is an open access article distributed under the terms and conditions of the Creative Commons Attribution (CC BY) license (https://creativecommons.org/licenses/by/4.0/).
Share and Cite
Segura, J.; Rey, A.I.; Olivares, Á.; Cambero, M.I.; Escudero, R.; Ávila, M.D.R.d.; Palomo, A.; López-Bote, C. Free-Range Feeding Alters Fatty Acid Composition at the sn-2 Position of Triglycerides and Subcutaneous Fat Physicochemical Properties in Heavy Pigs. Animals 2021, 11, 2802. https://doi.org/10.3390/ani11102802
Segura J, Rey AI, Olivares Á, Cambero MI, Escudero R, Ávila MDRd, Palomo A, López-Bote C. Free-Range Feeding Alters Fatty Acid Composition at the sn-2 Position of Triglycerides and Subcutaneous Fat Physicochemical Properties in Heavy Pigs. Animals. 2021; 11(10):2802. https://doi.org/10.3390/ani11102802
Chicago/Turabian StyleSegura, José, Ana Isabel Rey, Álvaro Olivares, María Isabel Cambero, Rosa Escudero, María Dolores Romero de Ávila, Antonio Palomo, and Clemente López-Bote. 2021. "Free-Range Feeding Alters Fatty Acid Composition at the sn-2 Position of Triglycerides and Subcutaneous Fat Physicochemical Properties in Heavy Pigs" Animals 11, no. 10: 2802. https://doi.org/10.3390/ani11102802
APA StyleSegura, J., Rey, A. I., Olivares, Á., Cambero, M. I., Escudero, R., Ávila, M. D. R. d., Palomo, A., & López-Bote, C. (2021). Free-Range Feeding Alters Fatty Acid Composition at the sn-2 Position of Triglycerides and Subcutaneous Fat Physicochemical Properties in Heavy Pigs. Animals, 11(10), 2802. https://doi.org/10.3390/ani11102802