Bone Health or Performance? Adaptation Response of Genetically Divergent Chicken Layer Lines to a Nutritive Calcium Depletion

 ,
, 
Simple Summary
Abstract
1. Introduction
2. Materials and Methods
2.1. Ethical Note
2.2. Animals and Housing
2.3. Experimental Procedure
2.4. Statistical Analyses
3. Results
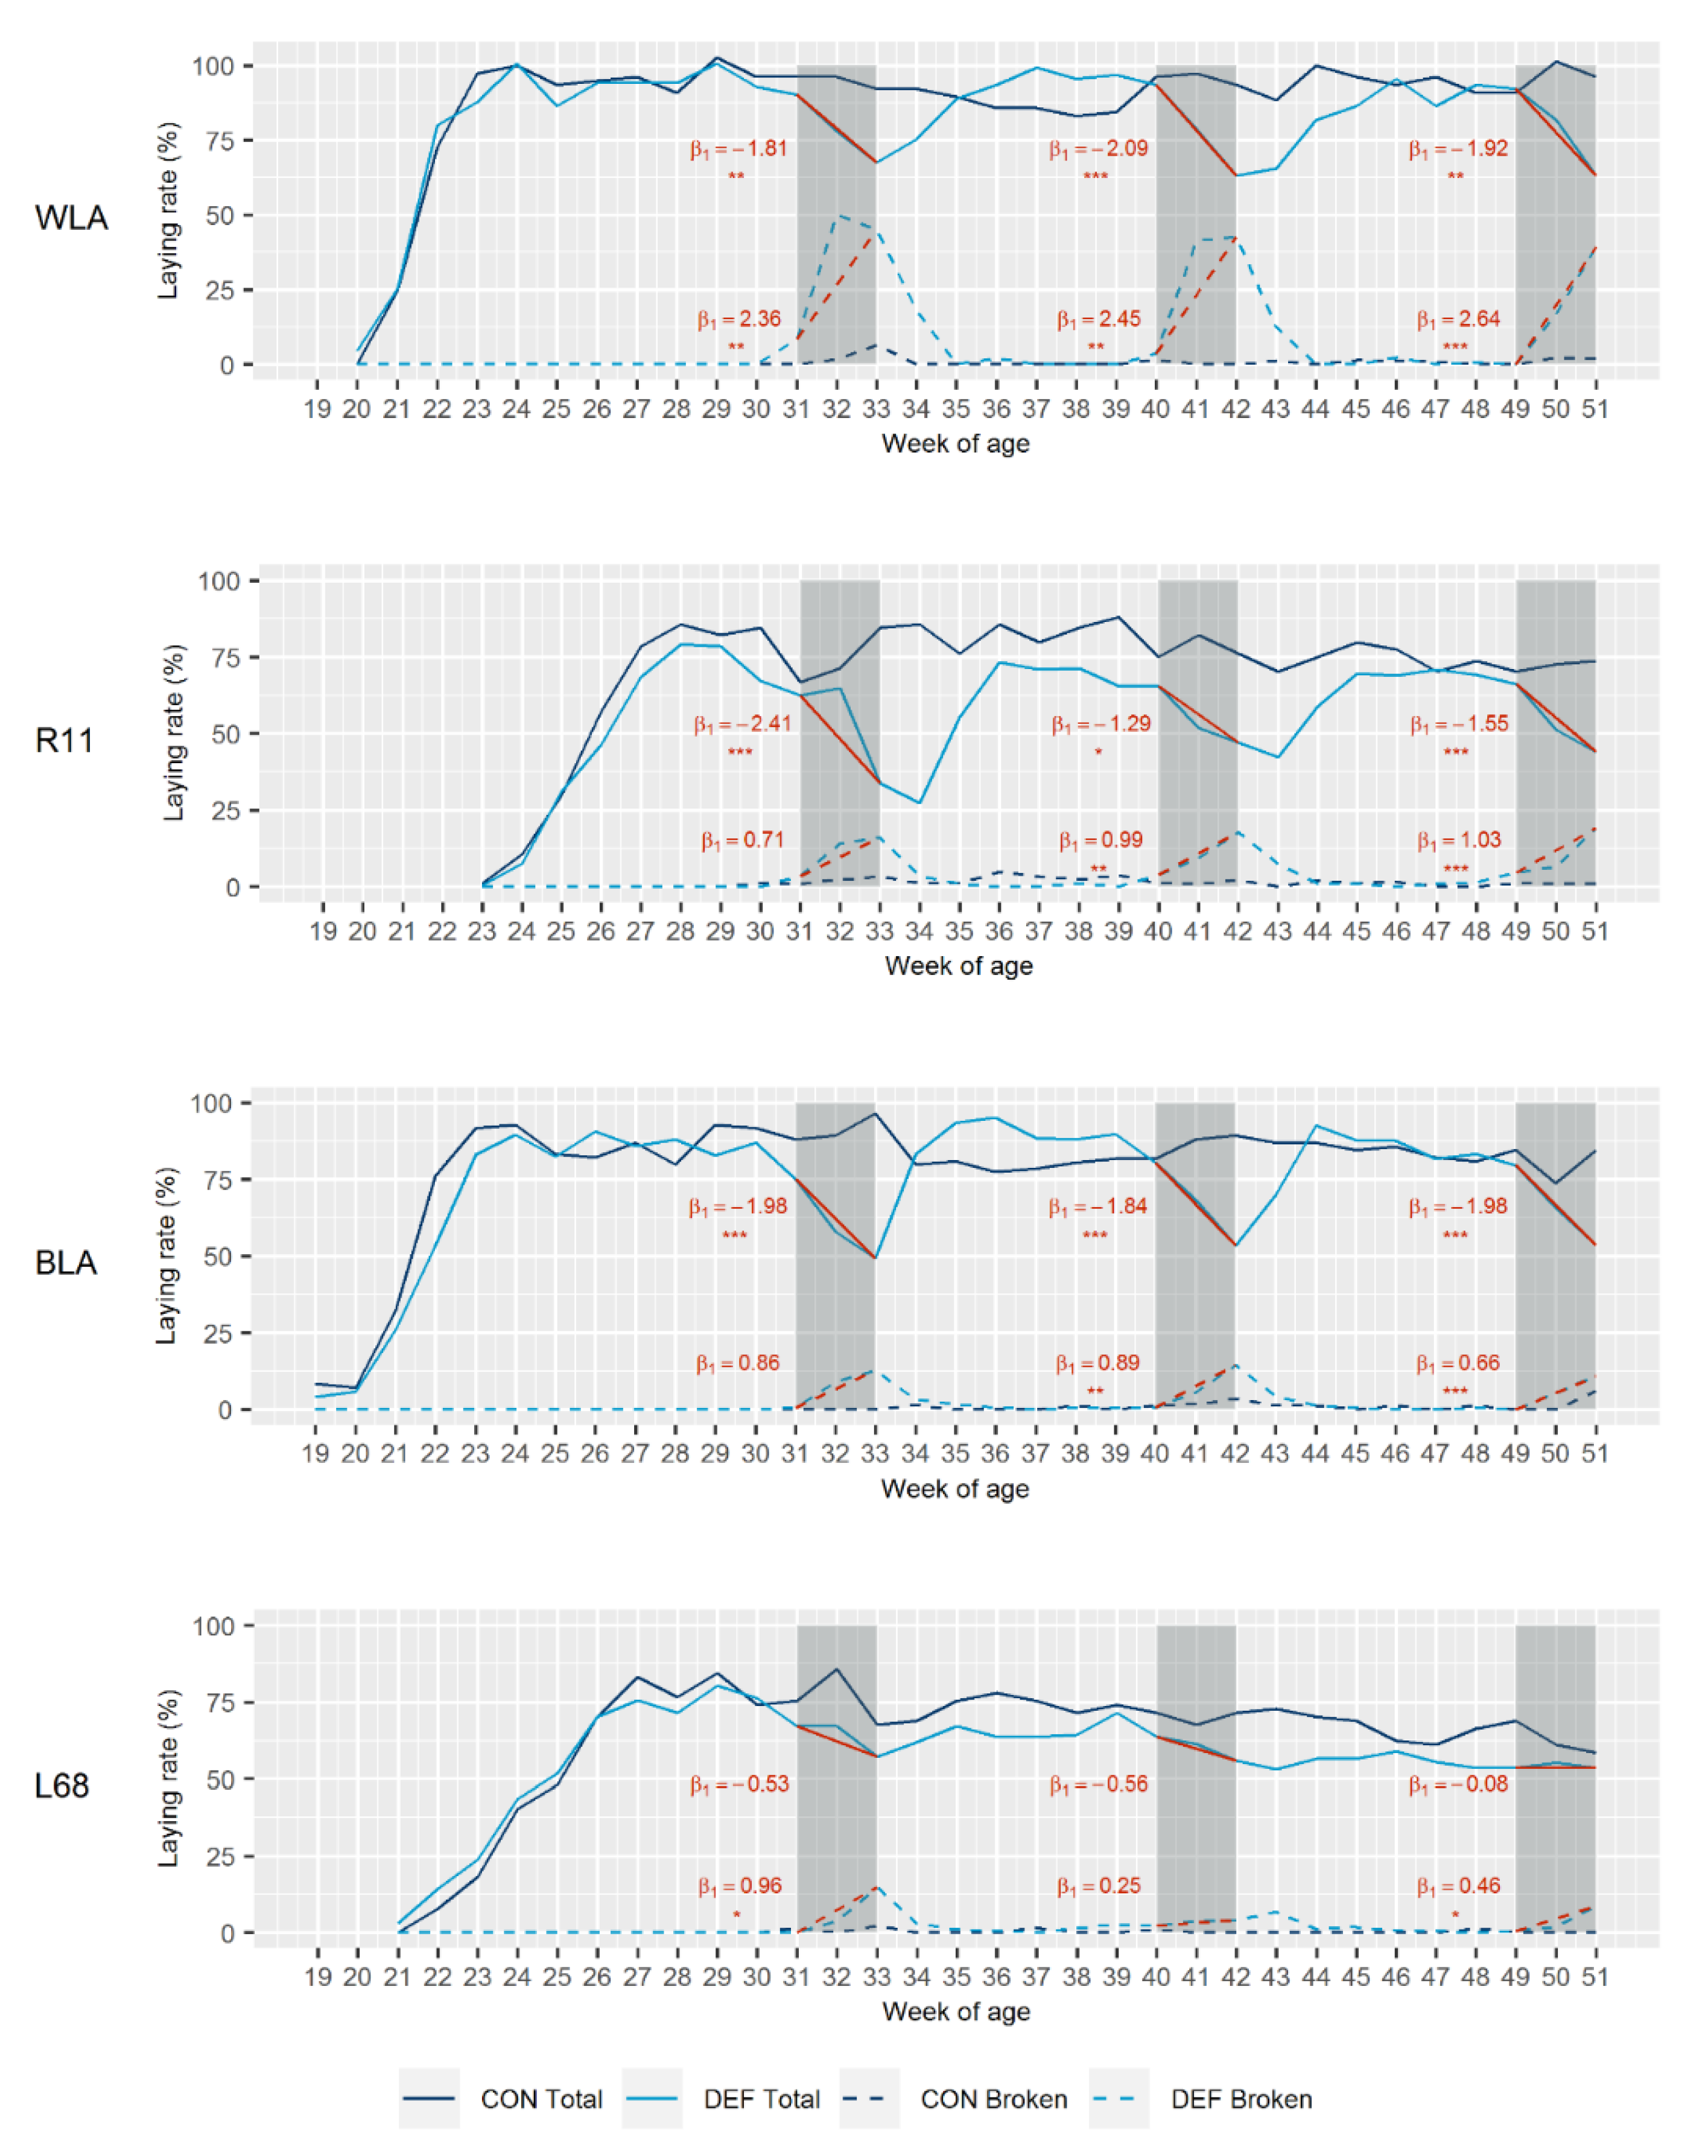
3.1. Laying Performance
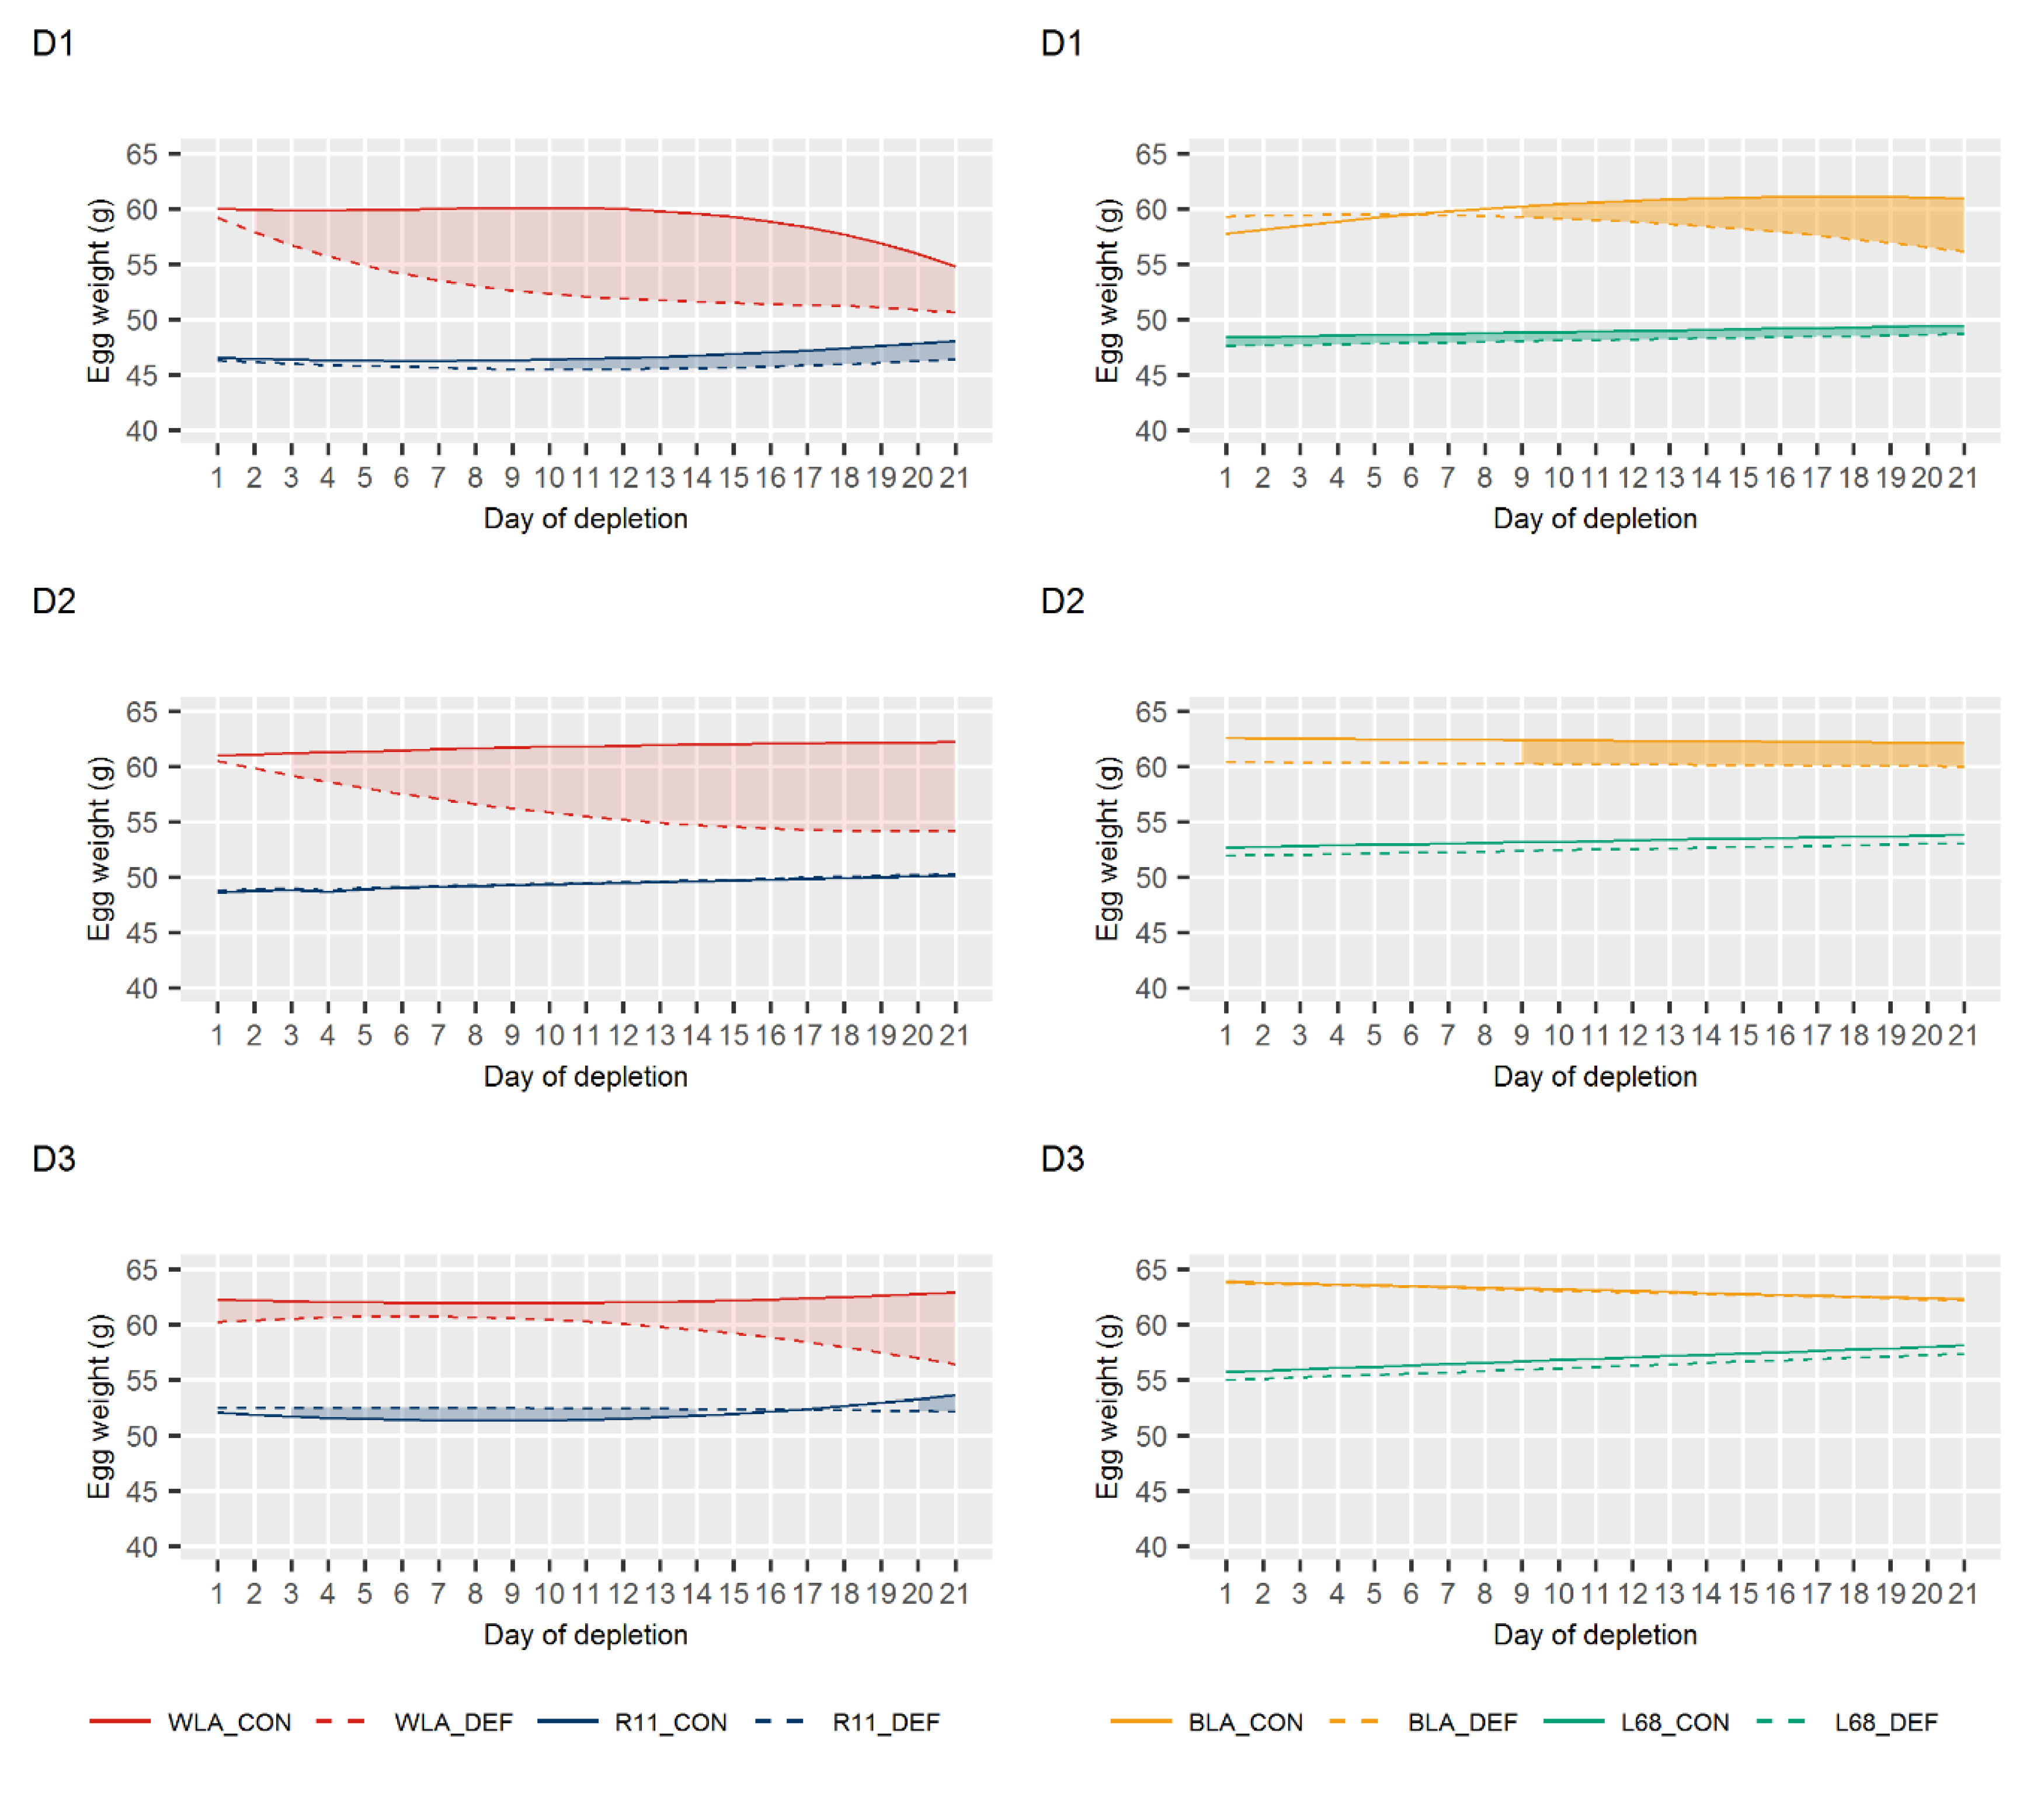
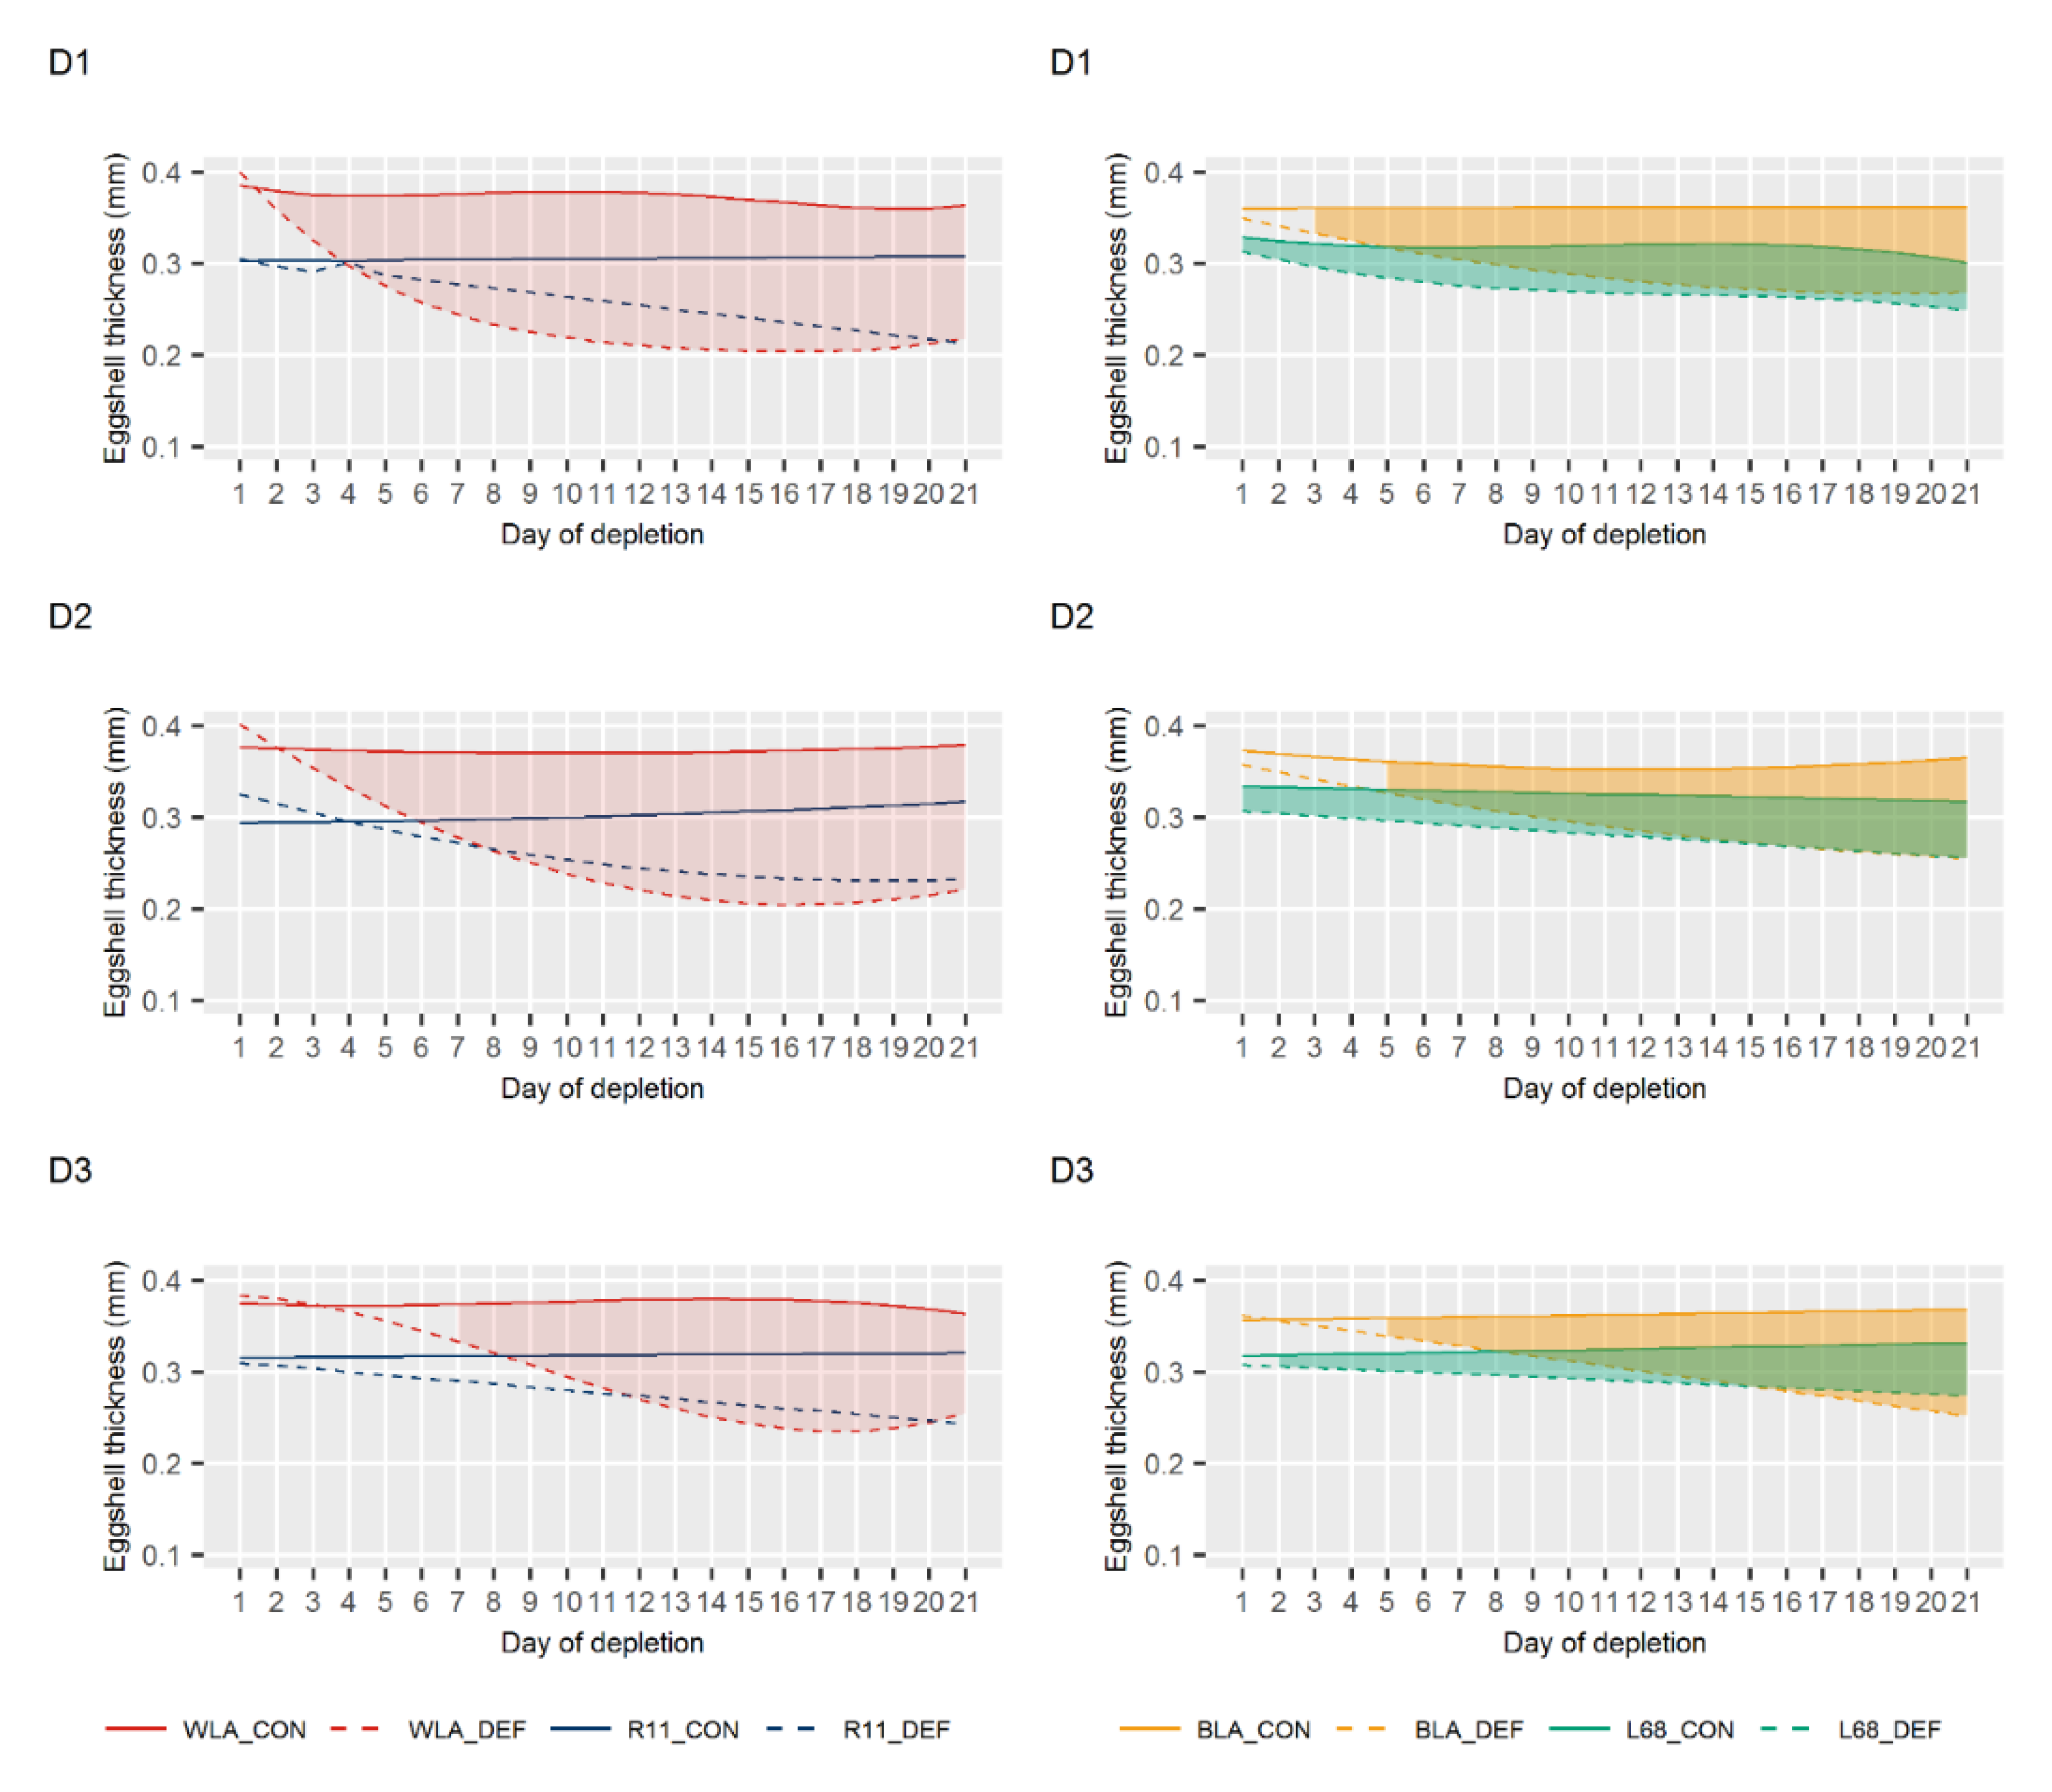
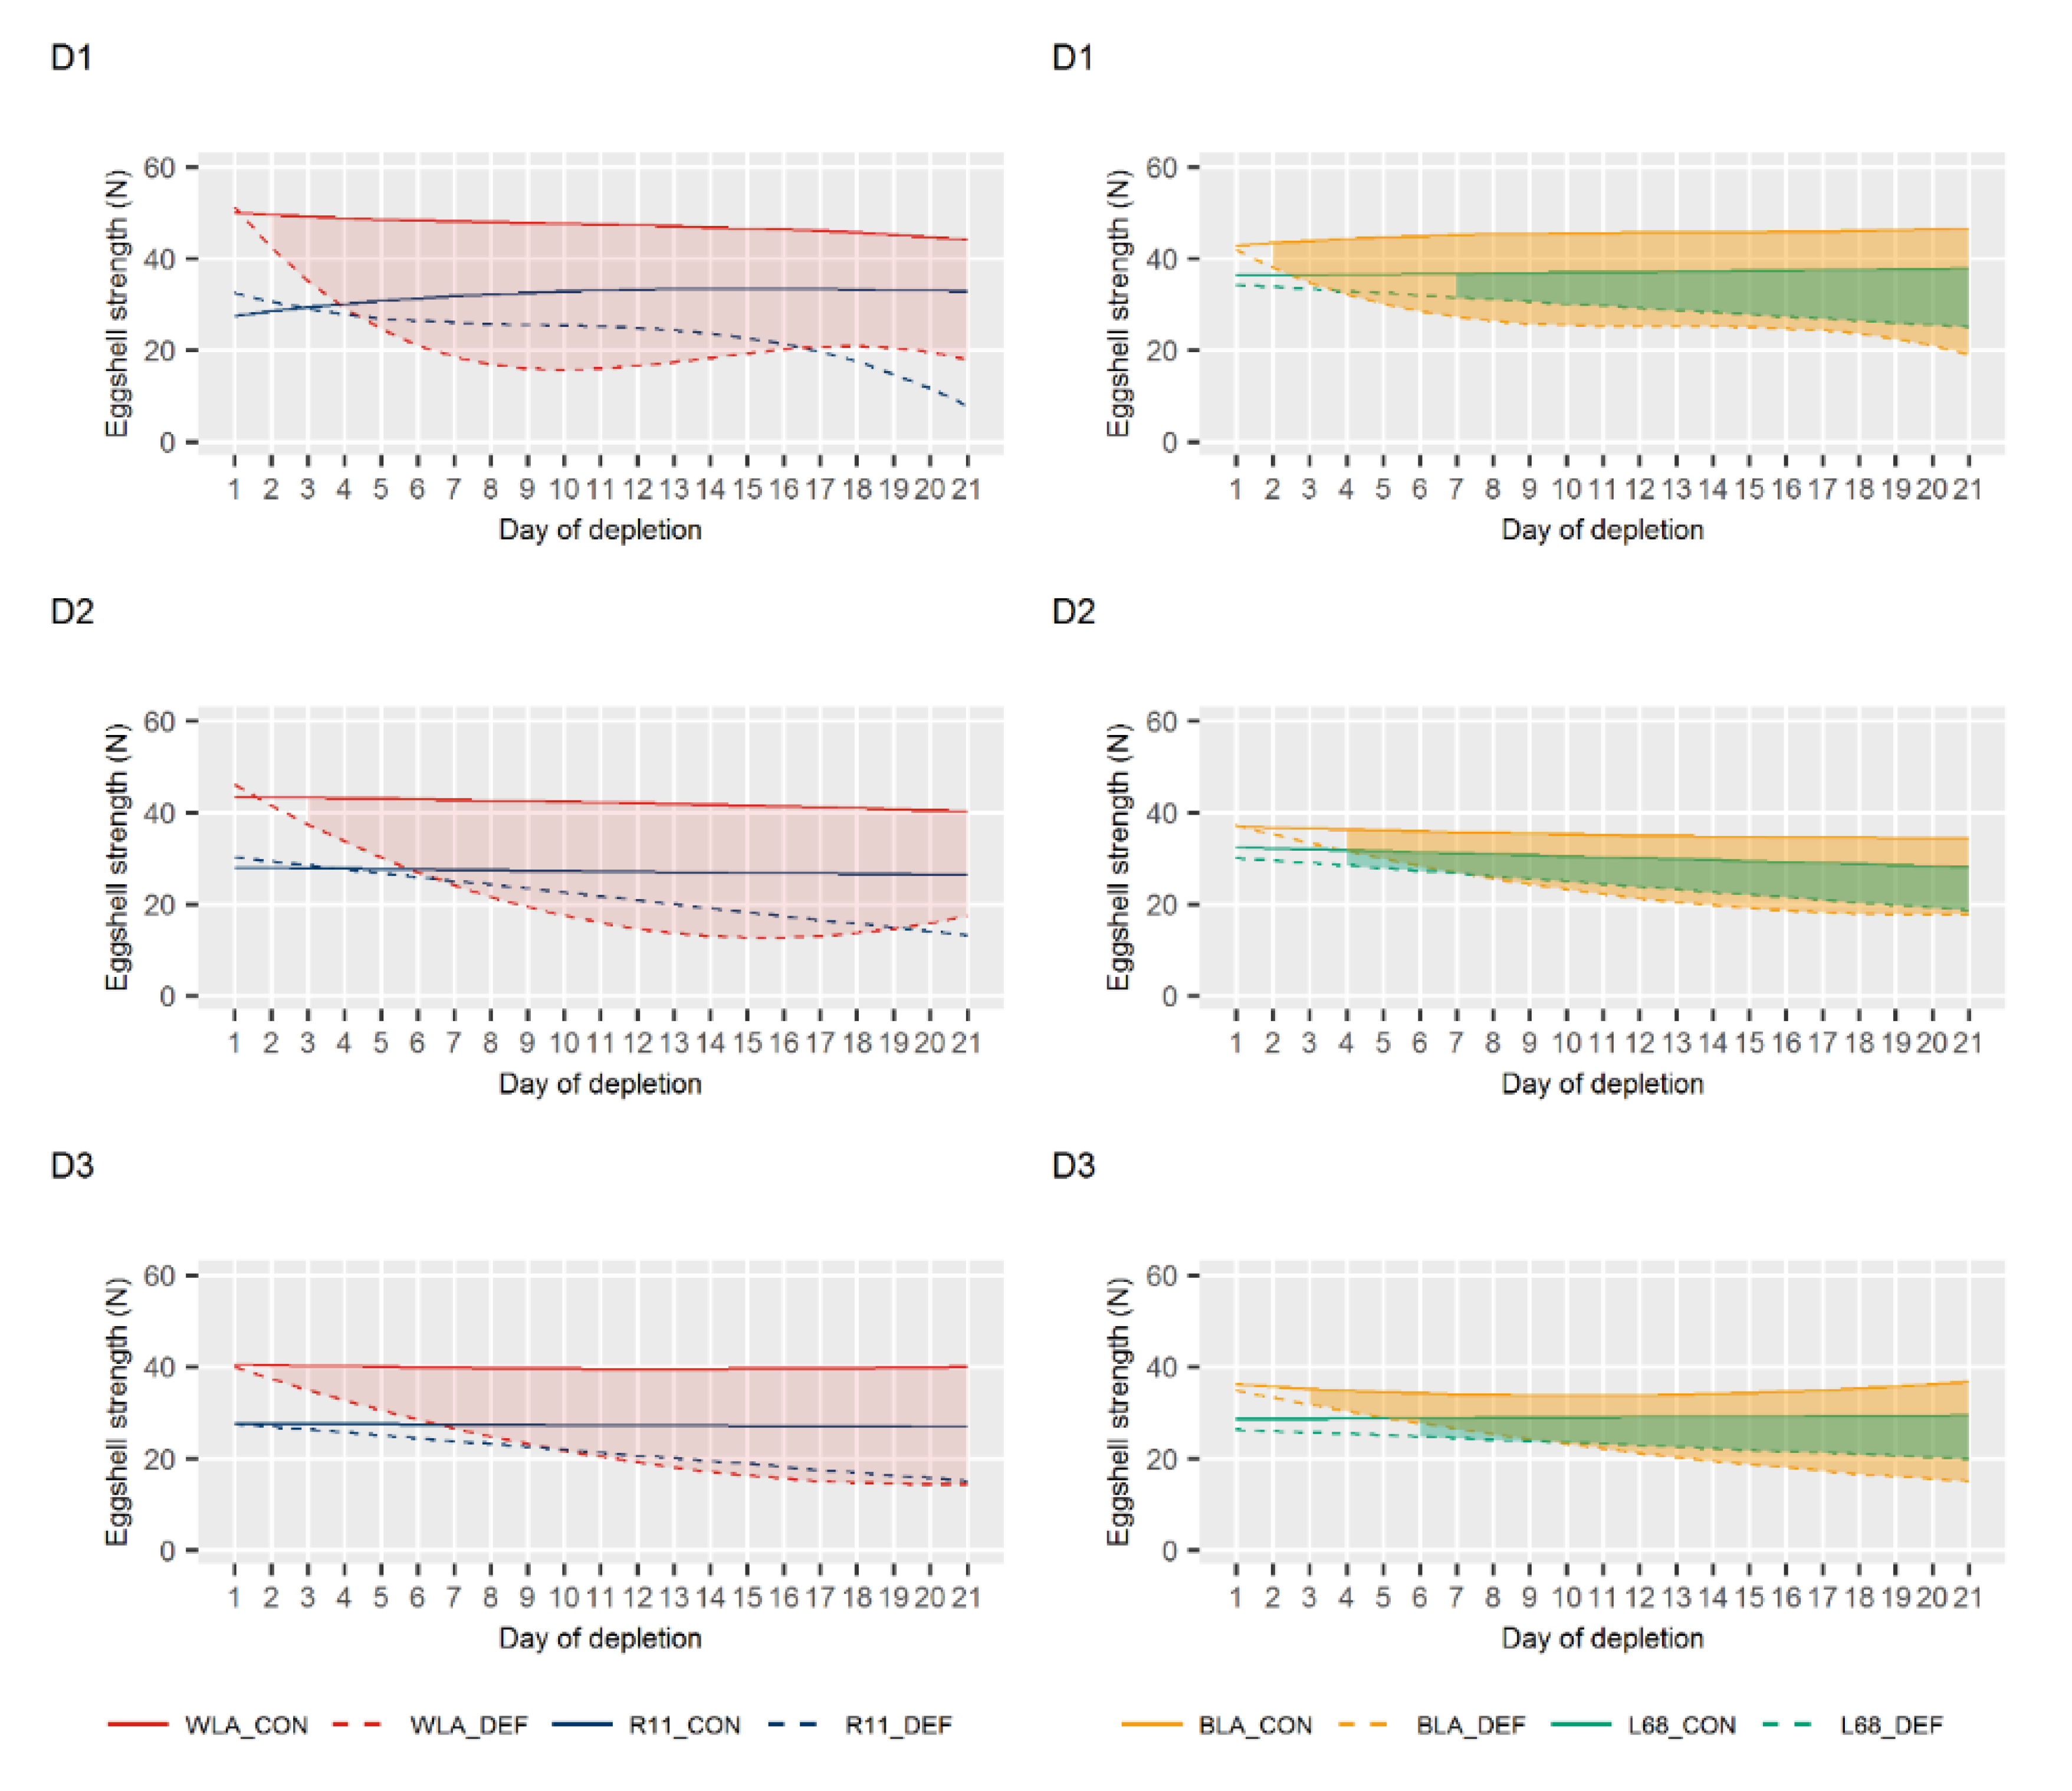
3.2. Egg Quality
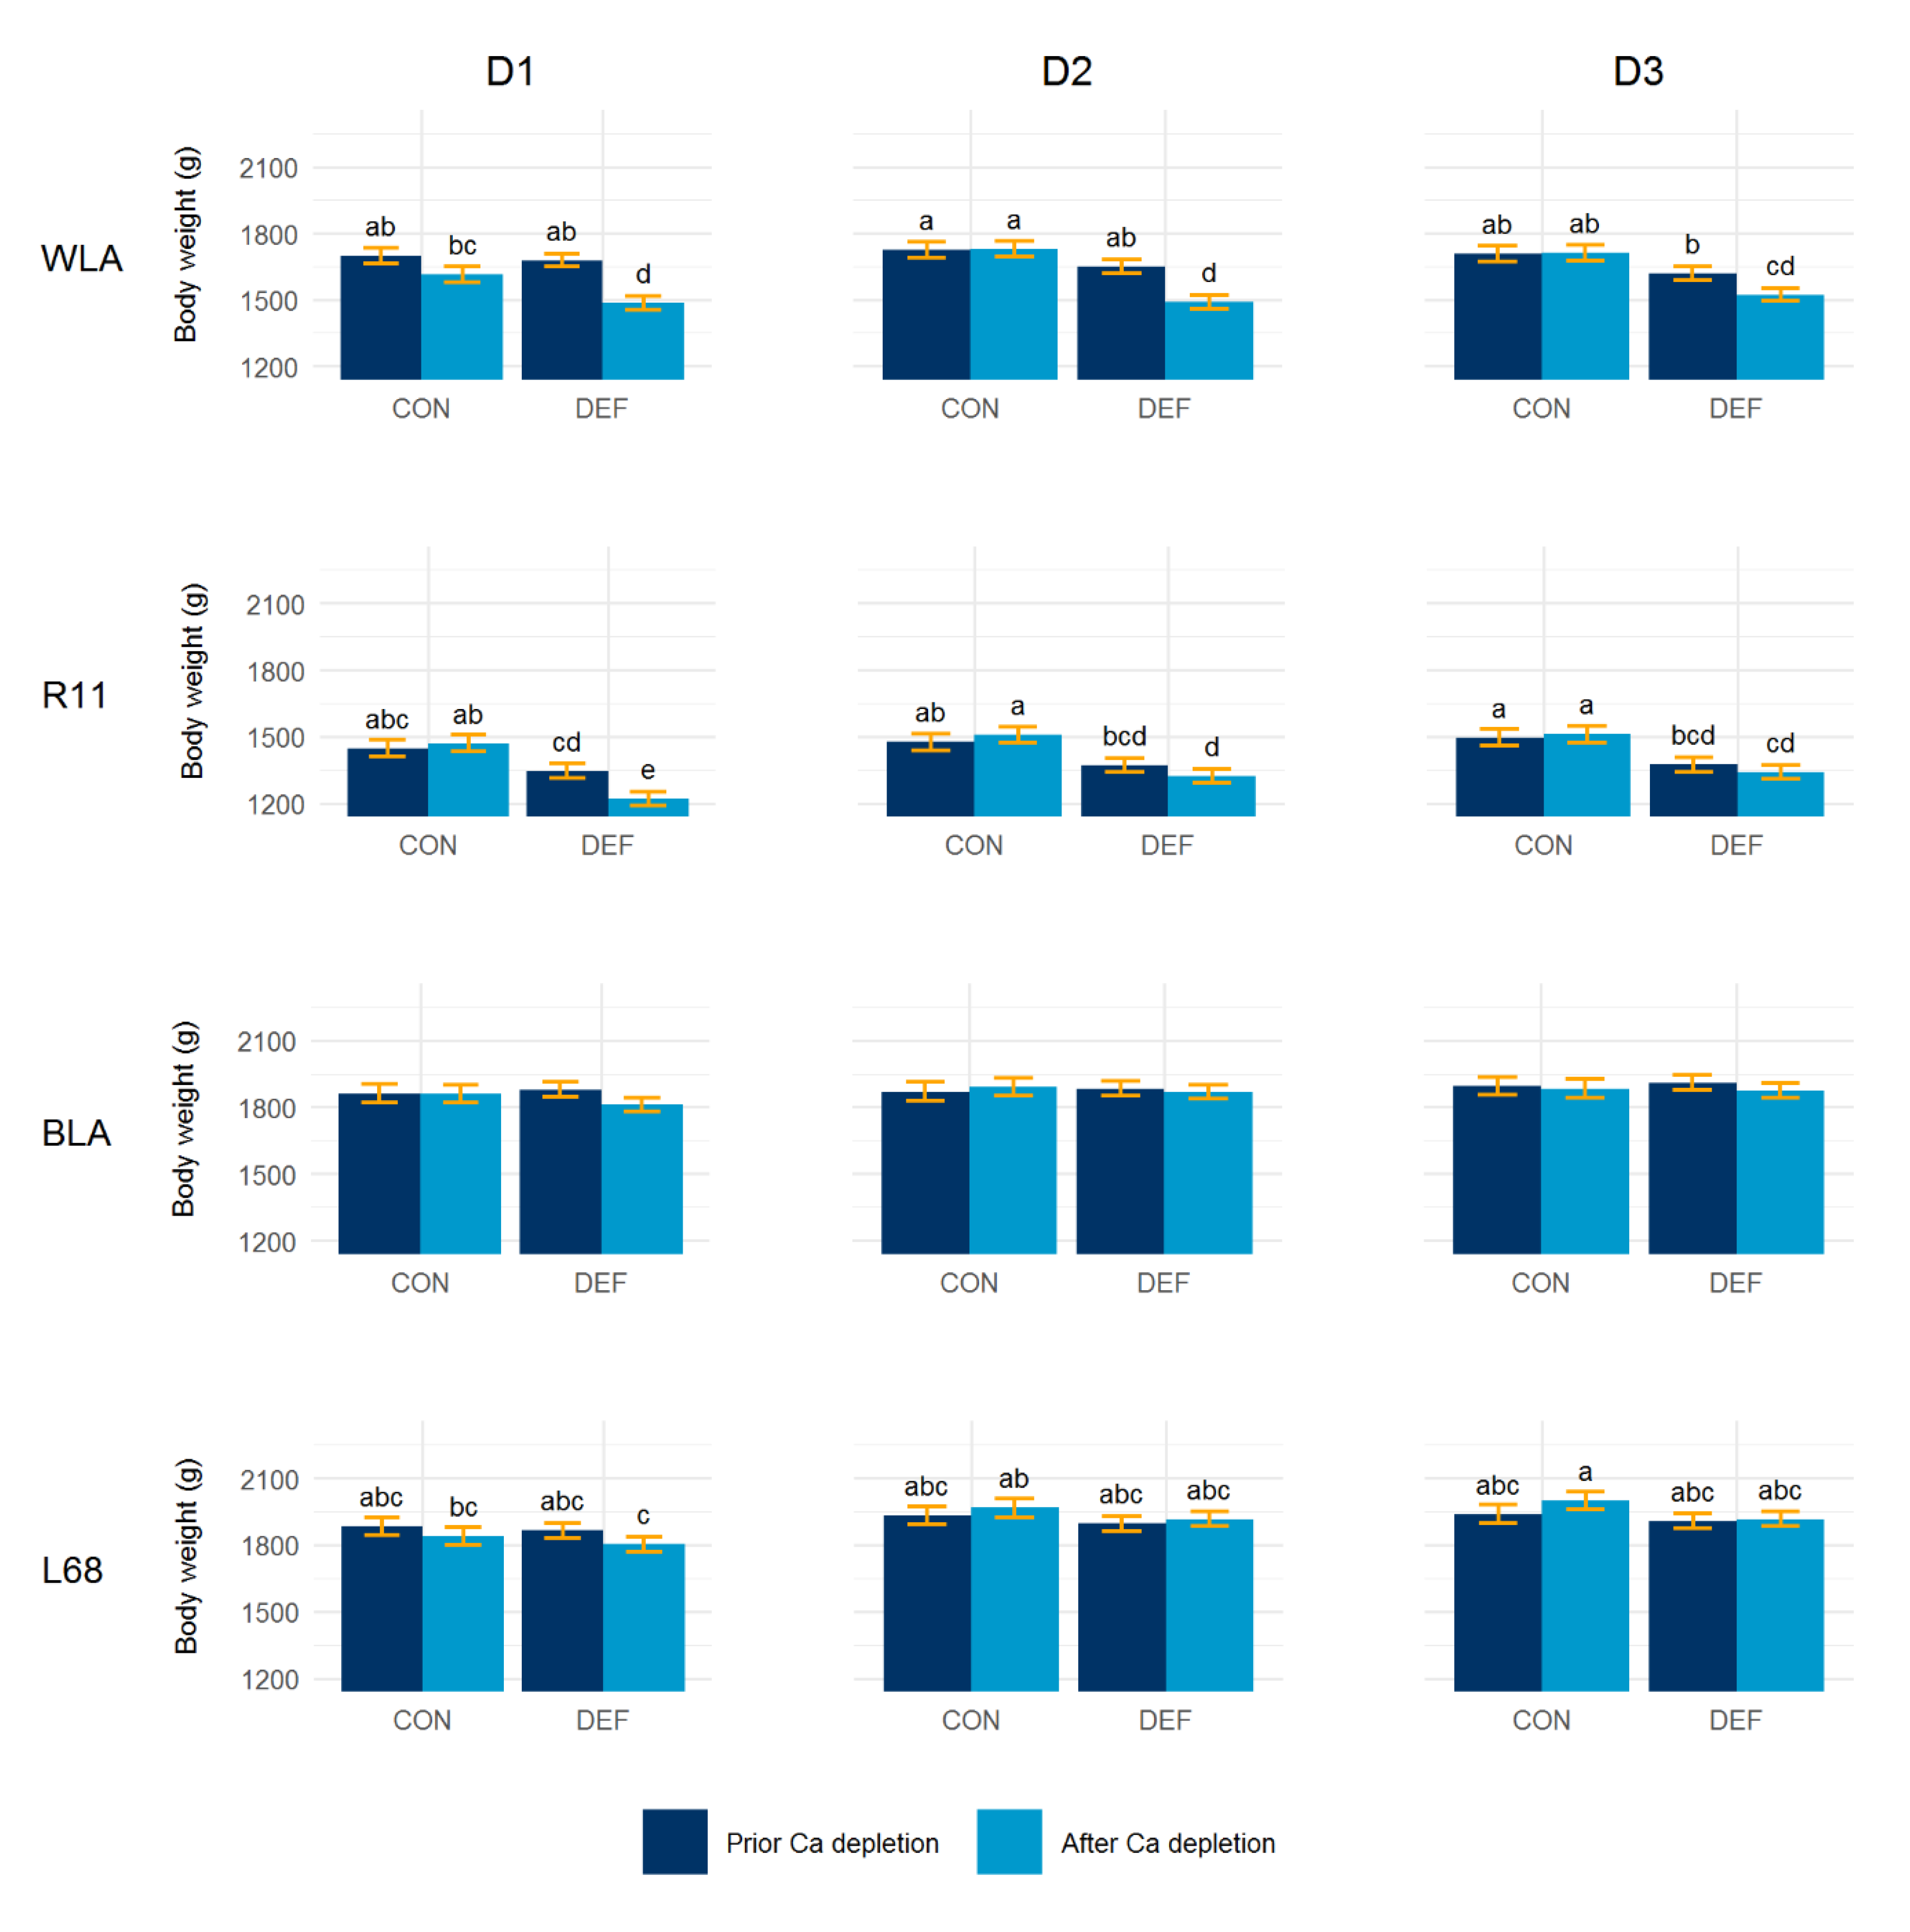
3.3. Body Weight
3.4. Feed Consumption
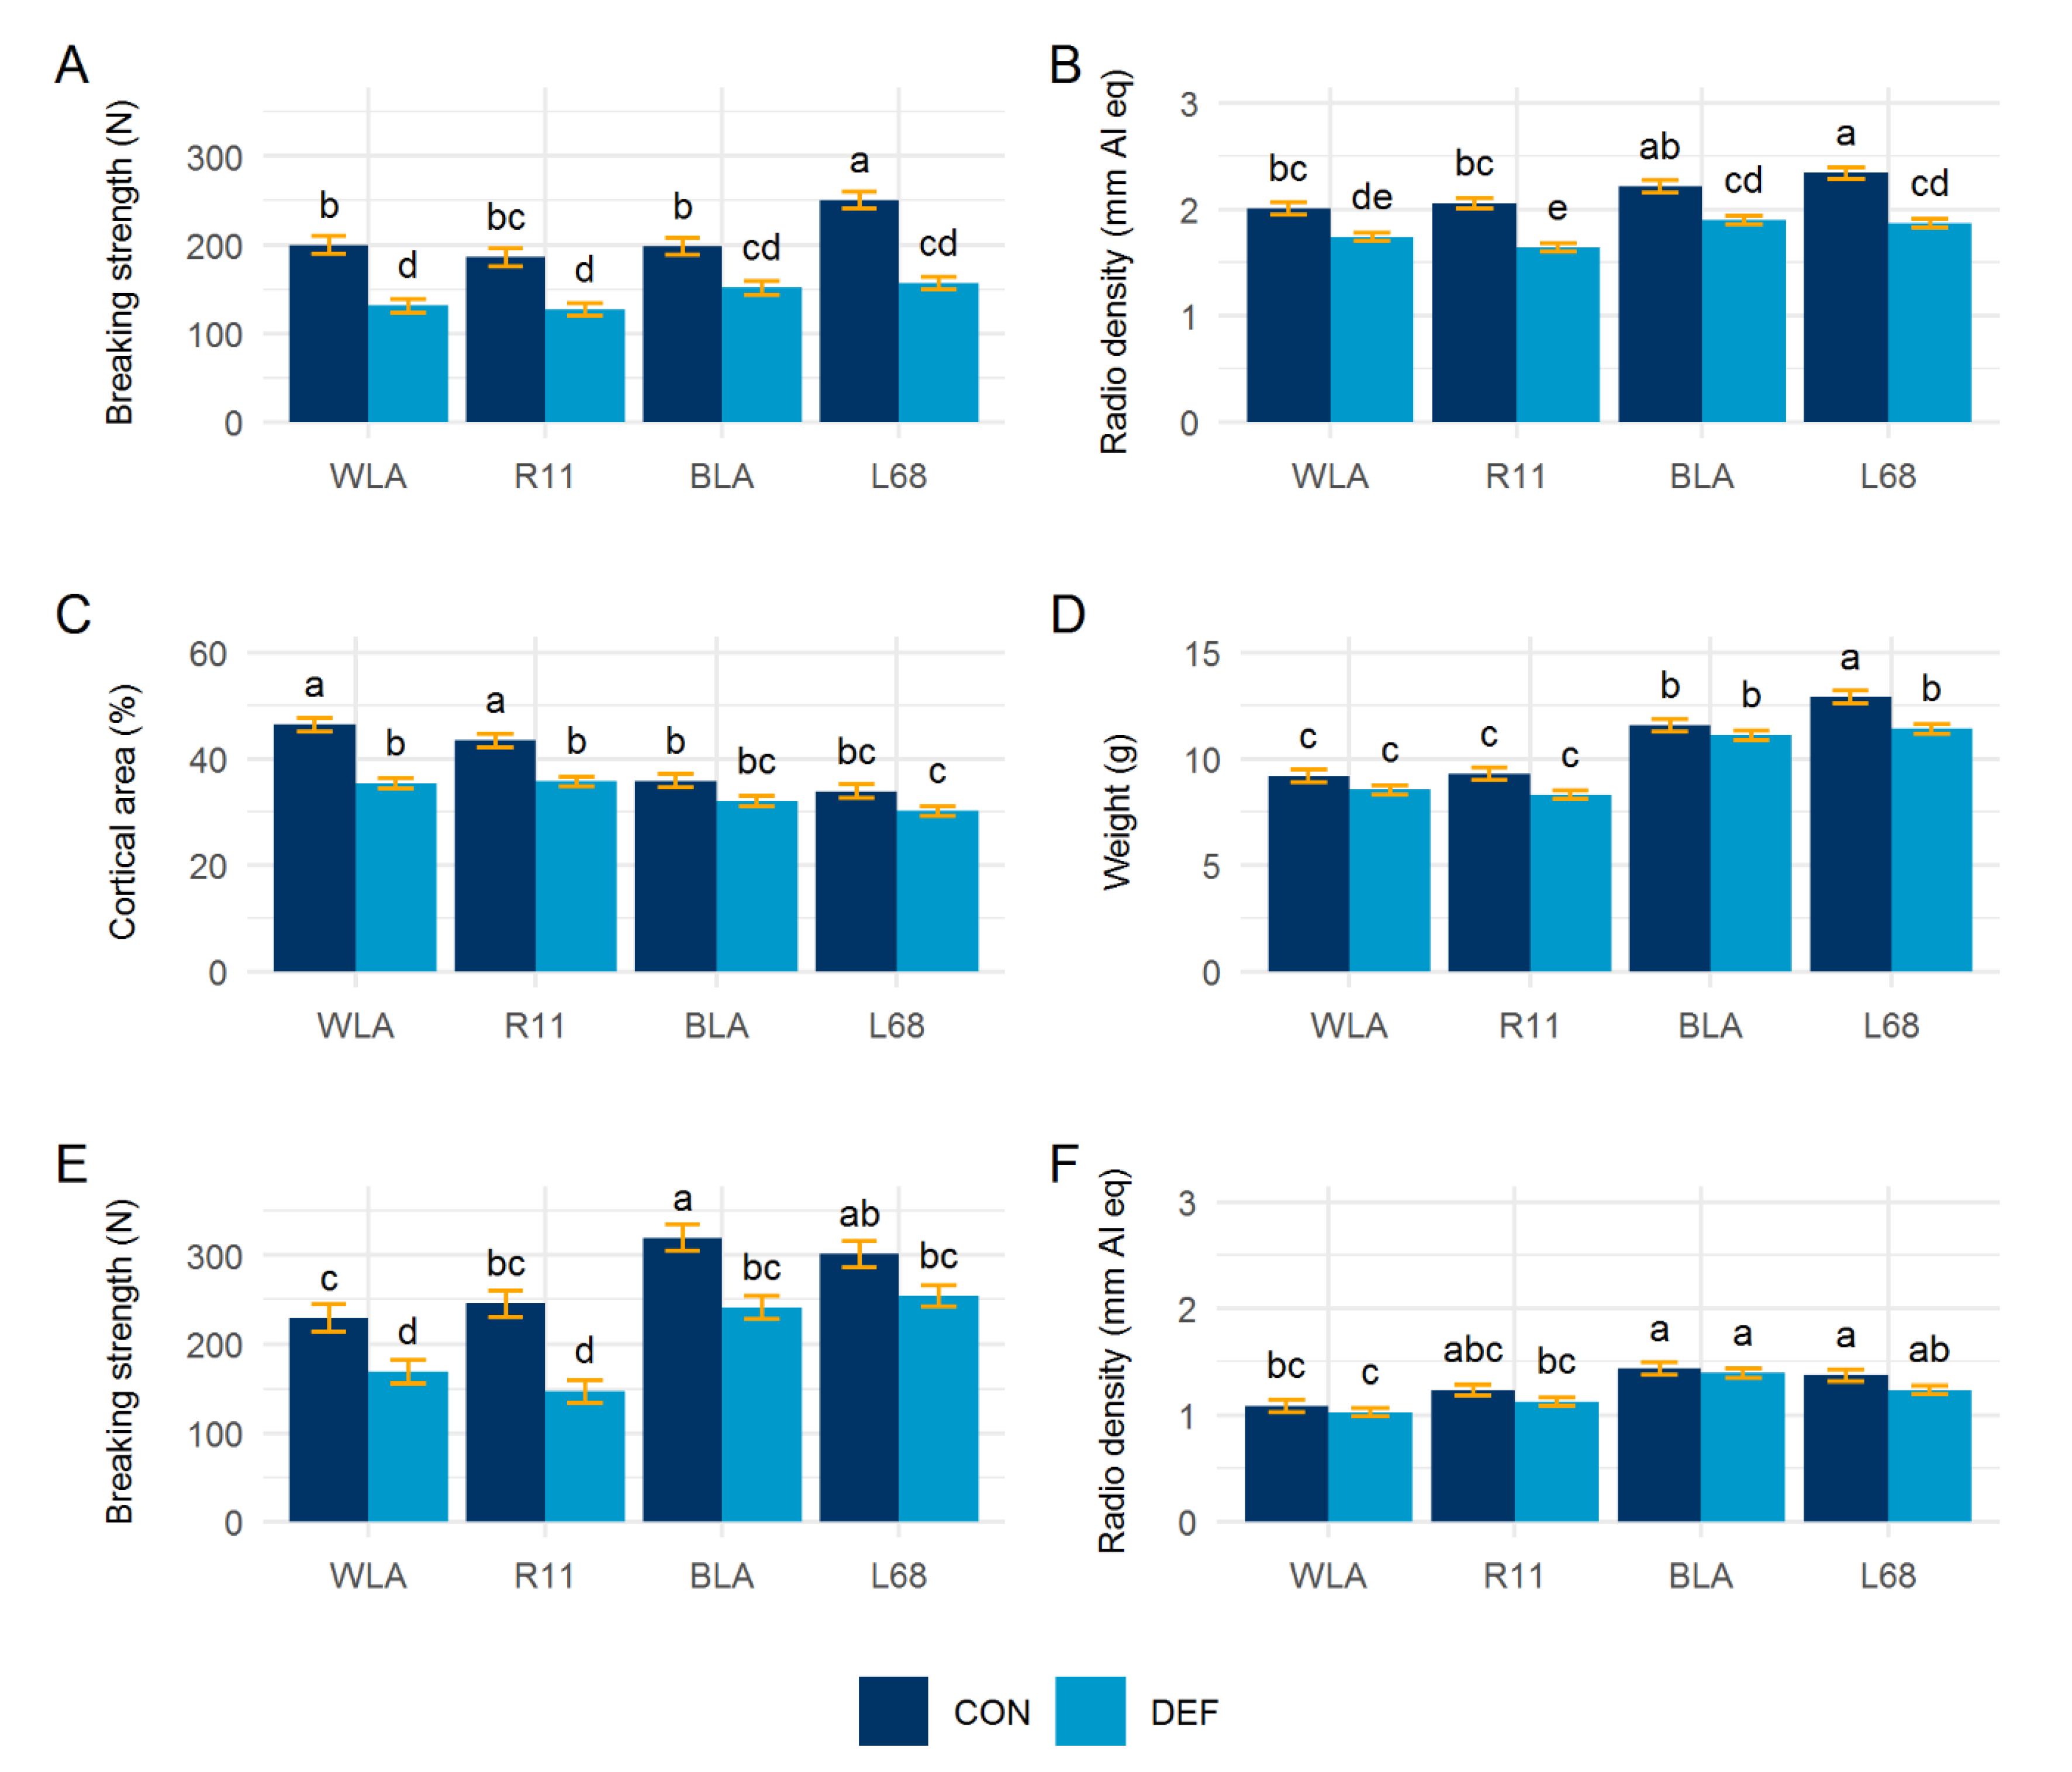
3.5. Bone Characteristics
4. Discussion
5. Conclusions
Supplementary Materials
Author Contributions
Funding
Acknowledgments
Conflicts of Interest
References
- Preisinger, R. Innovative layer genetics to handle global challenges in egg production. Br. Poult. Sci. 2018, 59, 1–6. [Google Scholar] [CrossRef]
- Roberts, J.R. Factors affecting egg internal quality and egg shell quality in laying hens. J. Poult. Sci. 2004, 41, 161–177. [Google Scholar] [CrossRef]
- Bar, A. Calcium transport in strongly calcifying laying birds: Mechanisms and regulation. Comp. Biochem. Physiol. 2009, 152A, 447–469. [Google Scholar] [CrossRef] [PubMed]
- Dacke, C.G.; Arkle, S.; Cook, D.J.; Wormstone, I.M.; Jones, S.; Zaidi, M.; Bascal, Z.A. Medullary bone and avian calcium regulation. J. Exp. Biol. 1993, 184, 63–88. [Google Scholar]
- Kim, W.K.; Donalson, L.M.; Bloomfield, S.A.; Hogan, H.A.; Kubena, L.F.; Nisbet, D.J.; Ricke, S.C. Molt Performance and bone density of cortical, medullary, and cancellous bone in laying hens during feed restriction or alfalfa-based feed molt. Poult. Sci. 2007, 86, 1821–1830. [Google Scholar] [CrossRef]
- Whitehead, C.C. Overview of bone biology in the egg-laying hen. Poult. Sci. 2004, 83, 193–199. [Google Scholar] [CrossRef] [PubMed]
- Wilson, S.; Thorp, B.H. Estrogen and cancellous bone loss in the fowl. Calcif. Tissue Int. 1998, 62, 506–511. [Google Scholar] [CrossRef]
- Whitehead, C.C.; Fleming, R.H. Osteoporosis in cage layers. Poult. Sci. 2000, 79, 1033–1041. [Google Scholar] [CrossRef] [PubMed]
- Fleming, R.H.; McCormack, H.A.; McTeir, L.; Whitehead, C.C. Relationships between genetic, environmental and nutritional factors influencing osteoporosis in laying hens. Br. Poult. Sci. 2006, 47, 742–755. [Google Scholar] [CrossRef]
- Webster, A.B. Welfare implications of avian osteoporosis. Poult. Sci. 2004, 83, 184–192. [Google Scholar] [CrossRef]
- Petrik, M.T.; Guerin, M.T.; Widowski, T.M. On-farm comparison of keel fracture prevalence and other welfare indicators in conventional cage and floor-housed laying hens in Ontario, Canada. Poult. Sci. 2015, 94, 579–585. [Google Scholar] [CrossRef] [PubMed]
- Sandilands, V. The laying hen and bone fractures. Vet. Rec. 2011, 169, 411. [Google Scholar] [CrossRef]
- Nasr, M.A.F.; Nicol, C.J.; Murrell, J.C. Do laying hens with keel bone fractures experience pain? PLoS ONE 2012, 7, e42420. [Google Scholar] [CrossRef] [PubMed]
- Riber, A.B.; Casey-Trott, T.M.; Herskin, M.S. The influence of keel bone damage on welfare of laying hens. Front. Vet. Sci. 2018, 5. [Google Scholar] [CrossRef] [PubMed]
- Rauw, W.M.; Kanis, E.; Noordhuizen-Stassen, E.N.; Grommers, F.J. Undesirable side effects of selection for high production efficiency in farm animals: A review. Livest. Prod. Sci. 1998, 56, 15–33. [Google Scholar] [CrossRef]
- Glazier, D.S. Resource allocation patterns. In Resource Allocation Theory Applied to Farm Animal Production; Rauw, W.M., Ed.; CAB International: Wallingford, Oxfordshire, UK, 2008; pp. 22–43. [Google Scholar]
- Van der Waaij, E.H. A resource allocation model describing consequences of artificial selection under metabolic stress. J. Anim. Sci. 2004, 82, 973–981. [Google Scholar] [CrossRef]
- Mirkena, T.; Duguma, G.; Haile, A.; Tibbo, M.; Okeyo, A.M.; Wurzinger, M.; Sölkner, J. Genetics of adaptation in domestic farm animals: A review. Livest. Sci. 2010, 132, 1–12. [Google Scholar] [CrossRef]
- Huber, K. Invited review: Resource allocation mismatch as pathway to disproportionate growth in farm animals—Prerequisite for a disturbed health. Animal 2018, 12, 528–536. [Google Scholar] [CrossRef]
- Tixier-Boichard, M.; Bed’hom, B.; Rognon, X. Chicken domestication: From archeology to genomics. C. R. Biol. 2011, 334, 197–204. [Google Scholar] [CrossRef]
- Malomane, D.K.; Simianer, H.; Weigend, A.; Reimer, C.; Schmitt, A.O.; Weigend, S. The SYNBREED chicken diversity panel: A global resource to assess chicken diversity at high genomic resolution. BMC Genomics 2019, 20, 345. [Google Scholar] [CrossRef]
- Jansen, S.; Baulain, U.; Habig, C.; Weigend, A.; Halle, I.; Scholz, A.M.; Simianer, H.; Sharifi, A.R.; Weigend, S. Relationship between Bone Stability and Egg Production in Genetically Divergent Chicken Layer Lines. Animals 2020, 10, 850. [Google Scholar] [CrossRef] [PubMed]
- Lieboldt, M.-A.; Halle, I.; Frahm, J.; Schrader, L.; Baulain, U.; Henning, M.; Preisinger, R.; Dänicke, S.; Weigend, S. Phylogenic versus selection effects on growth development, egg laying and egg quality in purebred laying hens. Eur. Poult. Sci. 2015, 79. [Google Scholar]
- Dudde, A.; Weigend, S.; Krause, E.T.; Jansen, S.; Habig, C.; Schrader, L. Chickens in motion: Effects of egg production level and pen size on the motor abilities and bone stability of laying hens (Gallus gallus forma domestica). Appl. Anim. Behav. Sci. 2020, 227, 104998. [Google Scholar] [CrossRef]
- Icken, W.; Cavero, D.; Schmutz, M.; Preisinger, R. New phenotypes for new breeding goals in layers. Worlds Poult. Sci. J. 2012, 68, 387–400. [Google Scholar] [CrossRef]
- NRC. Nutrient Requirements of Poultry, 9th ed.; Natl. Acad. Press: Washington, DC, USA, 1994; p. 176. [Google Scholar]
- Eusemann, B.K.; Patt, A.; Schrader, L.; Weigend, S.; Thöne-Reineke, C.; Petow, S. The role of egg production in the etiology of keel bone damage in laying hens. Front. Vet. Sci. 2020, 7. [Google Scholar] [CrossRef]
- Habig, C.; Baulain, U.; Henning, M.; Scholz, A.; Sharifi, A.; Janisch, S.; Simianer, H.; Weigend, S. How bone stability in laying hens is affected by phylogenetic background and performance level. Eur. Poult. Sci. 2017, 81. [Google Scholar]
- Littell, R.C.; Milliken, G.A.; Stroup, W.W.; Wolfinger, R.D.; Schabenberger, O. SAS for Mixed Models, 2nd ed.; SAS Institute Inc: Cary, NC, USA, 2006. [Google Scholar]
- Gilbert, A.B.; Blair, R. A comparison of the effects of two low-calcium diets on egg production in the domestic fowl. Br. Poult. Sci. 1975, 16, 547–552. [Google Scholar] [CrossRef]
- Summers, J.D.; Grandhi, R.; Leeson, S. Calcium and phosphorus requirements of the laying hen. Poult. Sci. 1976, 55, 402–413. [Google Scholar] [CrossRef]
- Mehring, A.L., Jr.; Titus, H.W. The effects of low levels of calcium in the diet of laying chickens. Poult. Sci. 1964, 43, 1405–1414. [Google Scholar] [CrossRef]
- Clunies, M.; Emslie, J.; Leeson, S. Effect of dietary calcium level on medullary bone calcium reserves and shell weight of Leghorn hens. Poult. Sci. 1992, 71, 1348–1356. [Google Scholar] [CrossRef]
- Keshavarz, K. The effect of variation of calcium intake on production performance and shell quality. Poult. Sci. 1986, 65, 2120–2125. [Google Scholar] [CrossRef] [PubMed]
- Jiang, S.; Cui, L.; Shi, C.; Ke, X.; Luo, J.; Hou, J. Effects of dietary energy and calcium levels on performance, egg shell quality and bone metabolism in hens. Vet. J. 2013, 198, 252–258. [Google Scholar] [CrossRef] [PubMed]
- Luck, M.R.; Scanes, C.G. The relationship between reproductive activity and blood calcium in the calcium-deficient hen. Br. Poult. Sci. 1979, 20, 559–564. [Google Scholar] [CrossRef] [PubMed]
- Bar, A.; Rosenberg, J.; Hurwitz, S. The lack of relationships between vitamin D3 metabolites and calcium-binding protein in the eggshell gland of laying birds. Comp. Biochem. Physiol. 1984, 78B, 75–79. [Google Scholar] [CrossRef]
- Ruschkowski, S.R.; Hart, L.E. Ionic and endocrine characteristics of reproductive failure in calcium-deficient and vitamin D-deficient laying hens. Poult. Sci. 1992, 71, 1722–1732. [Google Scholar] [CrossRef] [PubMed]
- Roland, D.A.; Farmer, M.; Marple, D. Calcium and its relationship to excess feed consumption, body weight, egg Size, fat deposition, shell quality, and fatty liver hemorrhagic syndrome. Poult. Sci. 1985, 64, 2341–2350. [Google Scholar] [CrossRef] [PubMed]
- Schreiweis, M.; Orban, J.; Ledur, M.; Hester, P. The use of densitometry to detect differences in bone mineral density and content of live White Leghorns fed varying levels of dietary calcium. Poult. Sci. 2003, 82, 1292–1301. [Google Scholar] [CrossRef] [PubMed]
- Elaroussi, M.A.; Forte, L.R.; Eber, S.L.; Biellier, H.V. Calcium homeostasis in the laying hen.: 1. age and dietary calcium effects. Poult. Sci. 1994, 73, 1581–1589. [Google Scholar] [CrossRef]
- Zambonin Zallone, A.; Mueller, W.J. Medullary bone of laying hens during calcium depletion and repletion. Calcif. Tissue Res. 1969, 4, 136–146. [Google Scholar] [CrossRef]
- Dacke, C.G.; Sugiyama, T.; Gay, C.V. Chapter 25—The Role of Hormones in the Regulation of Bone Turnover and Eggshell Calcification. In Sturkie’s Avian Physiology; Scanes, C.G., Ed.; Academic Press: San Diego, CA, USA, 2015; pp. 549–575. [Google Scholar]
- Glazier, D.S. Trade-offs. In Resource Allocation Theory Applied to Farm Animal Production; Rauw, W.M., Ed.; CAB International: Wallingford, Oxfordshire, UK, 2008; pp. 44–60. [Google Scholar]


© 2020 by the authors. Licensee MDPI, Basel, Switzerland. This article is an open access article distributed under the terms and conditions of the Creative Commons Attribution (CC BY) license (http://creativecommons.org/licenses/by/4.0/).
Share and Cite
Jansen, S.; Bues, M.; Baulain, U.; Habig, C.; Halle, I.; Petow, S.; Sharifi, A.R.; Weigend, A.; Wilkens, M.R.; Weigend, S. Bone Health or Performance? Adaptation Response of Genetically Divergent Chicken Layer Lines to a Nutritive Calcium Depletion. Animals 2020, 10, 1645. https://doi.org/10.3390/ani10091645
Jansen S, Bues M, Baulain U, Habig C, Halle I, Petow S, Sharifi AR, Weigend A, Wilkens MR, Weigend S. Bone Health or Performance? Adaptation Response of Genetically Divergent Chicken Layer Lines to a Nutritive Calcium Depletion. Animals. 2020; 10(9):1645. https://doi.org/10.3390/ani10091645
Chicago/Turabian StyleJansen, Simon, Mara Bues, Ulrich Baulain, Christin Habig, Ingrid Halle, Stefanie Petow, Ahmad Reza Sharifi, Annett Weigend, Mirja Rosmarie Wilkens, and Steffen Weigend. 2020. "Bone Health or Performance? Adaptation Response of Genetically Divergent Chicken Layer Lines to a Nutritive Calcium Depletion" Animals 10, no. 9: 1645. https://doi.org/10.3390/ani10091645
APA StyleJansen, S., Bues, M., Baulain, U., Habig, C., Halle, I., Petow, S., Sharifi, A. R., Weigend, A., Wilkens, M. R., & Weigend, S. (2020). Bone Health or Performance? Adaptation Response of Genetically Divergent Chicken Layer Lines to a Nutritive Calcium Depletion. Animals, 10(9), 1645. https://doi.org/10.3390/ani10091645