Overview of Quantitative Methodologies to Understand Antimicrobial Resistance via Minimum Inhibitory Concentration


Simple Summary
Abstract
1. Introduction
2. Regression for Dichotomized Minimum Inhibitory Concentration (MIC) Data
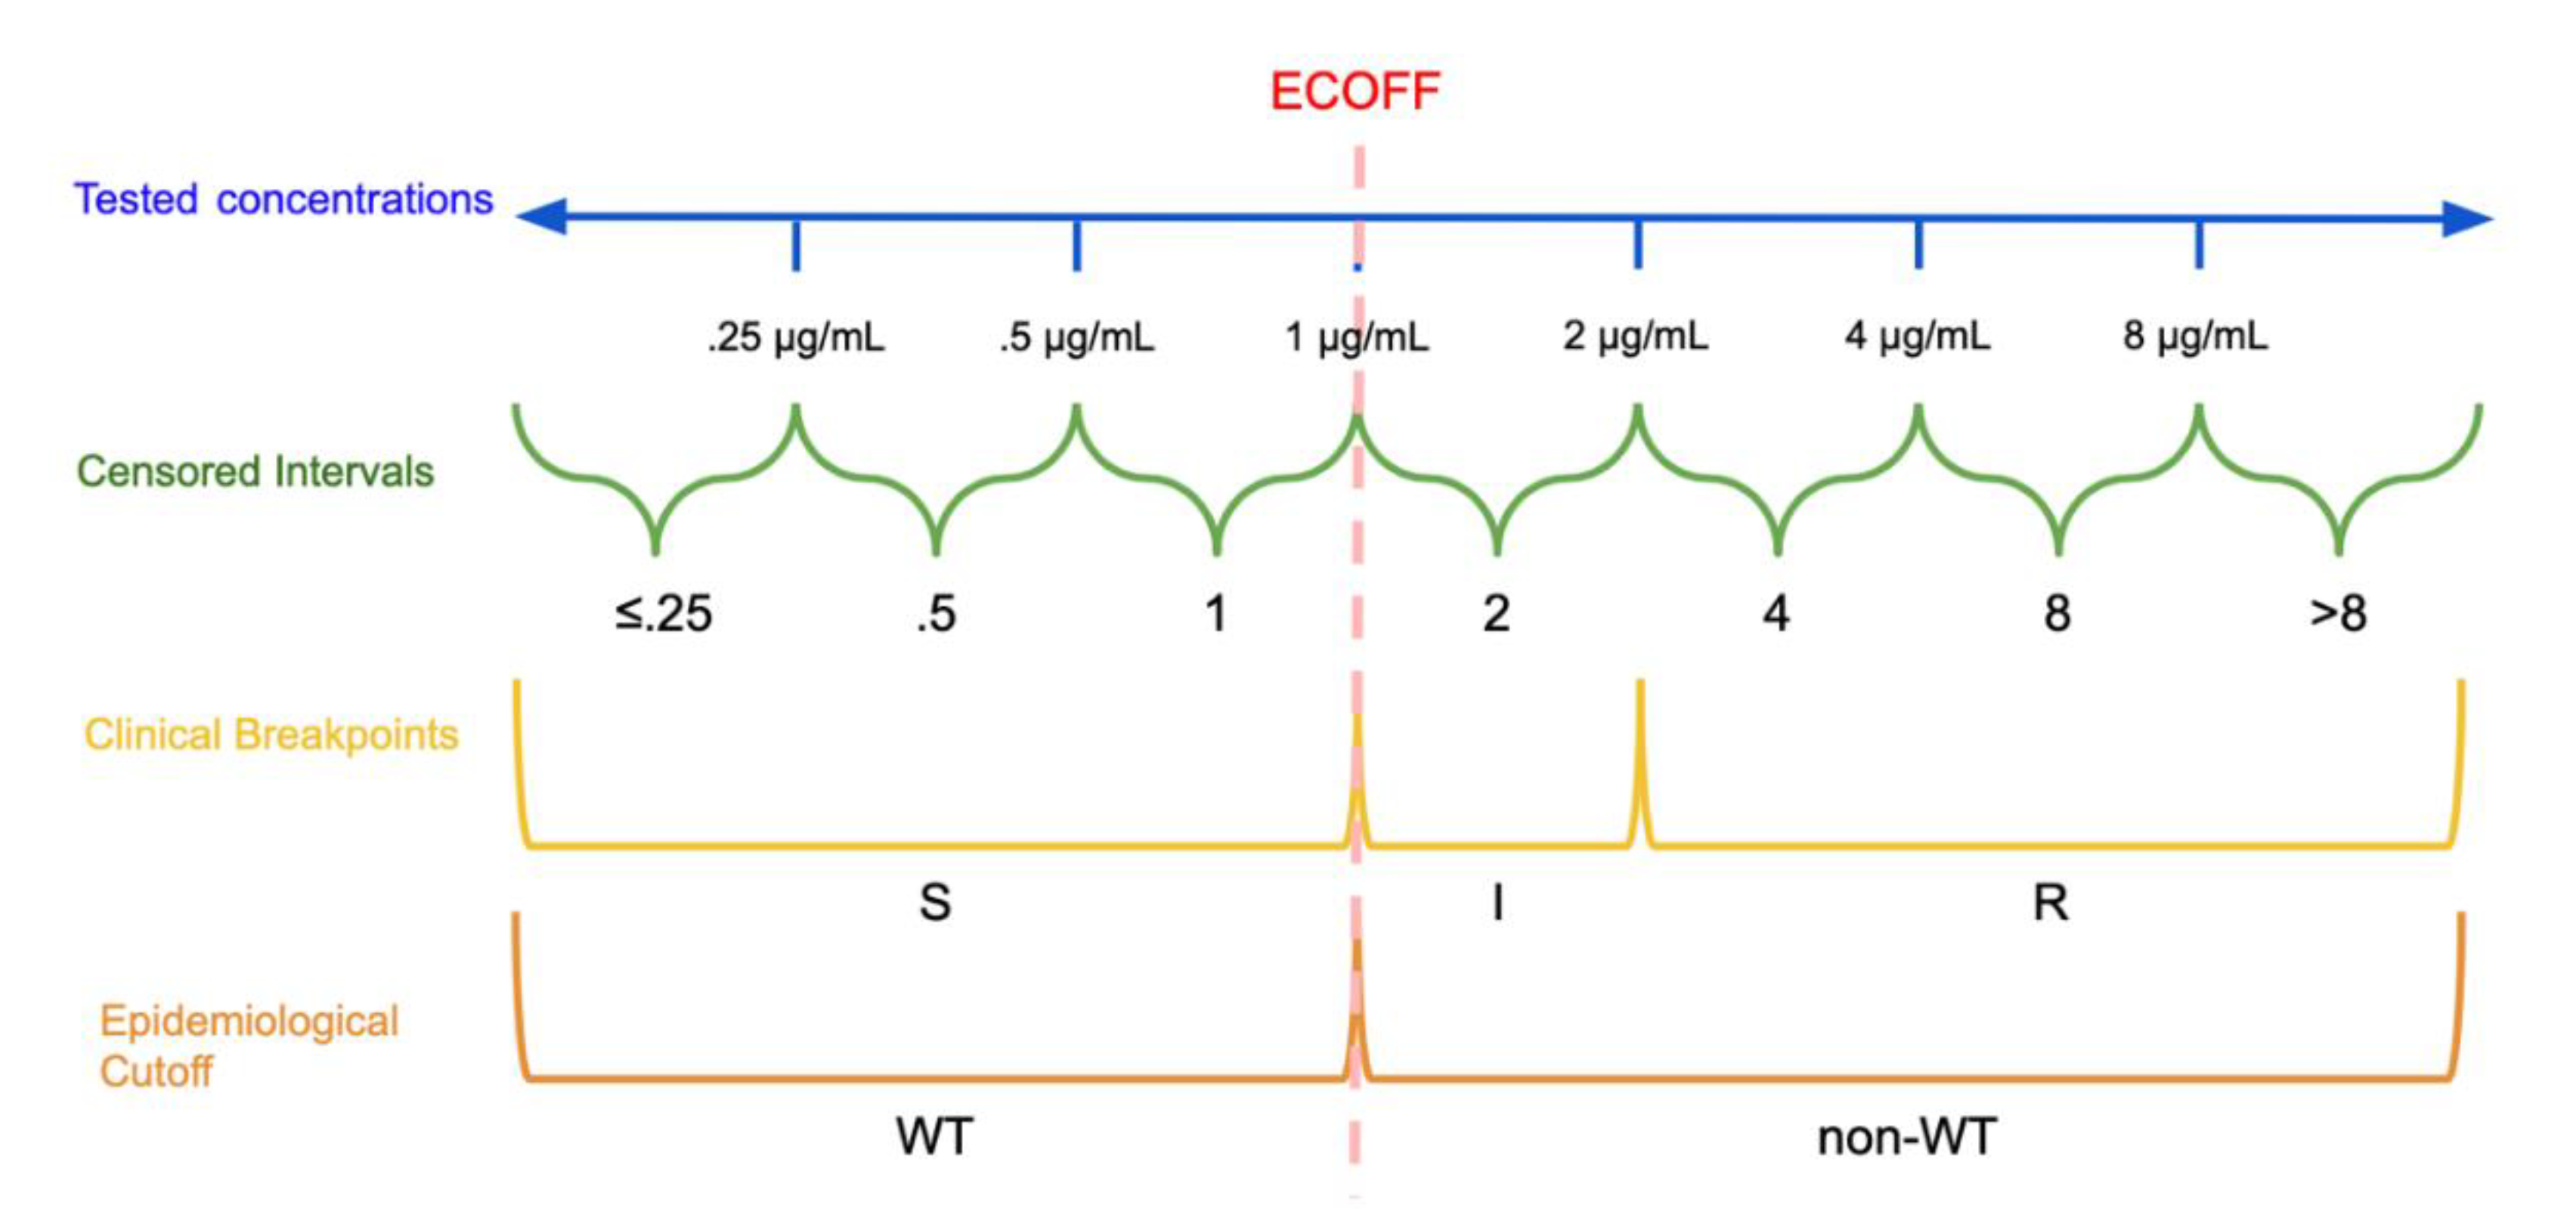
2.1. Epidemiological Cutoffs and Clinical Breakpoints
2.2. Logistic Regression
2.3. Considerations
2.4. Information Loss and Minimum Inhibitory Concentration (MIC) Creep
3. Models for Ordinal Data
3.1. Cumulative Logistic Regression
3.2. Applications of Regression Approaches for Ordinal Data
3.3. Considerations for Cumulative Logistic Regression
4. Models on the Continuous Scale for Interval-Censored Data
4.1. Mixture Models
4.2. Considerations for Mixture Models
4.3. Accelerated Failure Time Models
4.4. Considerations for Accelerated Failure Time Models
5. Conclusions
Author Contributions
Funding
Conflicts of Interest
References
- World Health Organization. Antimicrobial Resistance: Global Report on Surveillance; WHO Press: Geneva, Switzerland, 2014. [Google Scholar]
- Centers for Disease Control and Prevention. About Antibiotic Resistance. Available online: https://www.cdc.gov/drugresistance/about.html (accessed on 5 May 2020).
- Naylor, N.R.; Atun, R.; Zhu, N.; Kulasabanathan, K.; Silva, S.; Chatterjee, A.; Knight, G.M.; Robotham, J.V. Estimating the burden of antimicrobial resistance: A systematic literature review. Antimicrob. Resist. Infect. Control 2018, 7, 58. [Google Scholar] [CrossRef] [PubMed]
- World Health Organization. Integrated Surveillance of Antimicrobial Resistance: Guidance from a WHO Advisory Group; WHO Press: Geneva, Switzerland, 2013. [Google Scholar]
- Karp, B.E.; Tate, H.; Plumblee, J.R.; Dessai, U.; Whichard, J.M.; Thacker, E.L.; Hale, K.R.; Wilson, W.; Friedman, C.R.; Griffin, P.M.; et al. National Antimicrobial Resistance Monitoring System: Two Decades of Advancing Public Health Through Integrated Surveillance of Antimicrobial Resistance. Foodborne Pathog. Dis. 2017, 14, 545–557. [Google Scholar] [CrossRef] [PubMed]
- Ericsson, H.M.; Sherris, J.C. Antibiotic sensitivity testing. Report of an international collaborative study. Acta Pathol. Microbiol. Scand. 1971, 217, 90. [Google Scholar]
- European Committee for Antimicrobial Susceptibility Testing (EUCAST) of the European Society of Clinical Microbiology and Infectious Diseases. Determination of minimum inhibitory concentrations (MICs) of antibacterial agents by agar dilution. Clin. Microbiol. Infect. 2000, 6, 509–515. [Google Scholar] [CrossRef] [PubMed]
- Reller, L.B.; Weinstein, M.; Jorgensen, J.H.; Ferraro, M.J. Antimicrobial Susceptibility Testing: A Review of General Principles and Contemporary Practices. Clin. Infect. Dis. 2009, 49, 1749–1755. [Google Scholar] [CrossRef]
- Fernández, L.; Breidenstein, E.B.M.; Hancock, R.E.W. Creeping baselines and adaptive resistance to antibiotics. Drug Resist. Updates 2011, 14, 1–21. [Google Scholar] [CrossRef]
- Donlan, R.M. Role of biofilms in antimicrobial resistance. ASAIO J. 2000, 46, S47–S52. [Google Scholar] [CrossRef]
- Ceri, H.; Olson, M.; Morck, D.; Storey, D.; Read, R.; Buret, A.; Olson, B. The MBEC assay system: Multiple equivalent biofilms for antibiotic and biocide susceptibility testing. In Methods in Enzymology; Doyle, R.J., Ed.; Academic Press: Cambridge, MA, USA, 2001; Volume 337, pp. 377–385. [Google Scholar]
- Girard, L.P.; Ceri, H.; Gibb, A.P.; Olson, M.; Sepandj, F. MIC versus MBEC to Determine the Antibiotic Sensitivity of Staphylococcus aureus in Peritoneal Dialysis Peritonitis. Perit. Dial. Int. 2010, 30, 652–656. [Google Scholar] [CrossRef]
- Rosengren, L.B.; Waldner, C.L.; Reid-Smith, R.J. Associations between antimicrobial resistance phenotypes, antimicrobial resistance genes, and virulence genes of fecal Escherichia coli isolates from healthy grow-finish pigs. Appl. Environ. Microbiol. 2009, 75, 1373–1380. [Google Scholar] [CrossRef]
- Tyson, G.H.; McDermott, P.F.; Li, C.; Chen, Y.; Tadesse, D.A.; Mukherjee, S.; Bodeis-Jones, S.; Kabera, C.; Gaines, S.A.; Loneragan, G.H.; et al. WGS accurately predicts antimicrobial resistance in Escherichia coli. J. Antimicrob. Chemother. 2015, 70, 2763–2769. [Google Scholar] [CrossRef]
- Zhao, S.; Tyson, G.H.; Chen, Y.; Li, C.; Mukherjee, S.; Young, S.; Lam, C.; Folster, J.P.; Whichard, J.M.; McDermott, P.F. Whole-Genome Sequencing Analysis Accurately Predicts Antimicrobial Resistance Phenotypes in Campylobacter spp. Appl. Environ. Microbiol. 2016, 82, 459–466. [Google Scholar] [CrossRef] [PubMed]
- Nguyen, M.; Long, S.W.; McDermott, P.F.; Olsen, R.J.; Olson, R.; Stevens, R.L.; Tyson, G.H.; Zhao, S.; Davis, J.J. Using Machine Learning To Predict Antimicrobial MICs and Associated Genomic Features for Nontyphoidal Salmonella. J. Clin. Microbiol. 2018, 57, e01260-18. [Google Scholar] [CrossRef] [PubMed]
- Khan, Z.A.; Siddiqui, M.F.; Park, S. Current and Emerging Methods of Antibiotic Susceptibility Testing. Diagnostics 2019, 9, 49. [Google Scholar] [CrossRef] [PubMed]
- Ellington, M.J.; Ekelund, O.; Aarestrup, F.M.; Canton, R.; Doumith, M.; Giske, C.; Grundman, H.; Hasman, H.; Holden, M.T.G.; Hopkins, K.L.; et al. The role of whole genome sequencing in antimicrobial susceptibility testing of bacteria: Report from the EUCAST Subcommittee. Clin. Microbiol. Infect. 2017, 23, 2–22. [Google Scholar] [CrossRef]
- Su, M.; Satola, S.W.; Read, T.D. Genome-Based Prediction of Bacterial Antibiotic Resistance. J. Clin. Microbiol. 2018, 57, e01405-18. [Google Scholar] [CrossRef]
- Argimón, S.; Masim, M.A.L.; Gayeta, J.M.; Lagrada, M.L.; Macaranas, P.K.V.; Cohen, V.; Limas, M.T.; Espiritu, H.O.; Palarca, J.C.; Chilam, J.; et al. See and Sequence: Integrating Whole-Genome Sequencing Within the National Antimicrobial Resistance Surveillance Program in the Philippines. bioRxiv 2020. [Google Scholar] [CrossRef]
- Ängeby, K.; Juréen, P.; Kahlmeter, G.; Hoffner, S.E.; Schön, T. Challenging a dogma: Antimicrobial susceptibility testing breakpoints for Mycobacterium tuberculosis. Bull. World Health Organ. 2012, 90, 693–698. [Google Scholar] [CrossRef]
- European Committee on Antimicrobial Susceptibility Testing (EUCAST). MIC Distributions and Epidemiological Cut-Off Value (ECOFF) Setting. 2019. Volume SOP 10.1. Available online: www.eucast.org (accessed on 27 June 2020).
- Turnidge, J.; Kahlmeter, G.; Kronvall, G. Statistical characterisation of bacterial wild-type MIC value distributions and the determination of epidemiological cut-off values. Clin. Microbiol. Infect. 2006, 12, 418–425. [Google Scholar] [CrossRef]
- MIC and Zone Diameter Distributions and ECOFFs. Available online: https://www.eucast.org/mic_distributions_and_ecoffs/ (accessed on 12 June 2020).
- Clinical and Laboratory Standards Institute (CLSI). M57: Principles and Procedures for the Development of Epidemiological Cut-Off Values for Antifungal Susceptibility Testing; Clinical and Laboratory Standards Institute: Wayne, PA, USA, 2016. [Google Scholar]
- Clinical and Laboratory Standards Institute (CLSI). Performance Standards for Antimicrobial Susceptibility Testing; Clinical Laboratory Standards Institute: Wayne, PA, USA, 2020. [Google Scholar]
- Kahlmeter, G. Redefining Susceptibility Testing Categories S, I, and R; European Committee on Antimicrobial Susceptibility Testing (EUCAST): Växjö, Sweden, 2019. [Google Scholar]
- Humphries, R.M.; Abbott, A.N.; Hindler, J.A. Understanding and Addressing CLSI Breakpoint Revisions: A Primer for Clinical Laboratories. J. Clin. Microbiol. 2019, 57, e00203-19. [Google Scholar] [CrossRef]
- Arendrup, M.C.; Kahlmeter, G.; Rodriguez-Tudela, J.L.; Donnelly, J.P. Breakpoints for Susceptibility Testing Should Not Divide Wild-Type Distributions of Important Target Species. Antimicrob. Agents Chemother. 2009, 53, 1628–1629. [Google Scholar] [CrossRef]
- Mazloom, R.; Jaberi-Douraki, M.; Comer, J.R.; Volkova, V. Potential Information Loss Due to Categorization of Minimum Inhibitory Concentration Frequency Distributions. Foodborne Pathog. Dis. 2018, 15, 44–54. [Google Scholar] [CrossRef] [PubMed]
- Fedorov, V.; Mannino, F.; Zhang, R. Consequences of dichotomization. Pharm. Stat. 2009, 8, 50–61. [Google Scholar] [CrossRef] [PubMed]
- Zawack, K.; Li, M.; Booth, J.G.; Love, W.; Lanzas, C.; Gröhn, Y.T. Monitoring Antimicrobial Resistance in the Food Supply Chain and Its Implications for FDA Policy Initiatives. Antimicrob. Agents Chemother. 2016, 60, 5302–5311. [Google Scholar] [CrossRef]
- Van der Bij, A.K.; Van Dijk, K.; Muilwijk, J.; Thijsen, S.F.T.; Notermans, D.W.; De Greeff, S.; Van de Sande-Bruinsma, N. Clinical breakpoint changes and their impact on surveillance of antimicrobial resistance in Escherichia coli causing bacteraemia. Clin. Microbiol. Infect. 2012, 18, E466–E472. [Google Scholar] [CrossRef]
- Bjork, K.E.; Kopral, C.A.; Wagner, B.A.; Dargatz, D.A. Comparison of mixed effects models of antimicrobial resistance metrics of livestock and poultry Salmonella isolates from a national monitoring system. Prev. Vet. Med. 2015, 122, 265–272. [Google Scholar] [CrossRef]
- Adams, R.; Smith, J.; Locke, S.; Phillips, E.; Erol, E.; Carter, C.; Odoi, A. An epidemiologic study of antimicrobial resistance of Staphylococcus species isolated from equine samples submitted to a diagnostic laboratory. BMC Vet. Res. 2018, 14, 42. [Google Scholar] [CrossRef]
- Conner, J.G.; Smith, J.; Erol, E.; Locke, S.; Phillips, E.; Carter, C.N.; Odoi, A. Temporal trends and predictors of antimicrobial resistance among Staphylococcus spp. isolated from canine specimens submitted to a diagnostic laboratory. PLoS ONE 2018, 13, e0200719. [Google Scholar] [CrossRef]
- Kahlmeter, G.; Giske, C.G.; Kirn, T.J.; Sharp, S.E. Point-Counterpoint: Differences between the European Committee on Antimicrobial Susceptibility Testing and Clinical and Laboratory Standards Institute Recommendations for Reporting Antimicrobial Susceptibility Results. J. Clin. Microbiol. 2019, 57, e01129-19. [Google Scholar] [CrossRef]
- Aerts, M.; Faes, C.; Nysen, R. Development of statistical methods for the evaluation of data on antimicrobial resistance in bacterial isolates from animals and food. EFSA Support. Publ. 2011, 8, 186. [Google Scholar] [CrossRef]
- Saini, V.; McClure, J.T.; Scholl, D.T.; DeVries, T.J.; Barkema, H.W. Herd-level relationship between antimicrobial use and presence or absence of antimicrobial resistance in gram-negative bovine mastitis pathogens on Canadian dairy farms. J. Dairy Sci. 2013, 96, 4965–4976. [Google Scholar] [CrossRef]
- European Centre for Disease Prevention and Control (ECDC); European Food Safety Authority (EFSA); European Medicines Agency (EMA). ECDC/EFSA/EMA Second joint report on the integrated analysis of the consumption of antimicrobial agents and occurrence of antimicrobial resistance in bacteria from humans and food-producing animals. EFSA J. 2017, 15, e04872. [Google Scholar] [CrossRef]
- Centers for Disease Control and Prevention. National Antimicrobial Resistance Monitoring System for Enteric Bacteria (NARMS): Human Isolates Surveillance Report for 2014; CDC: Atlanta, Georgia, 2016.
- Lewis, J.A. In defence of the dichotomy. Pharm. Stat. 2004, 3, 77–79. [Google Scholar] [CrossRef]
- Hanon, J.-B.; Jaspers, S.; Butaye, P.; Wattiau, P.; Méroc, E.; Aerts, M.; Imberechts, H.; Vermeersch, K.; Van der Stede, Y. A trend analysis of antimicrobial resistance in commensal Escherichia coli from several livestock species in Belgium (2011–2014). Prev. Vet. Med. 2015, 122, 443–452. [Google Scholar] [CrossRef]
- Leite-Martins, L.R.; Mahú, M.I.M.; Costa, A.L.; Mendes, Â.; Lopes, E.; Mendonça, D.M.V.; Niza-Ribeiro, J.J.R.; De Matos, A.J.F.; Da Costa, P.M. Prevalence of antimicrobial resistance in enteric Escherichia coli from domestic pets and assessment of associated risk markers using a generalized linear mixed model. Prev. Vet. Med. 2014, 117, 28–39. [Google Scholar] [CrossRef] [PubMed]
- Austi, P.C.; Tu, J.V.; Alte, D.A. Comparing hierarchical modeling with traditional logistic regression analysis among patients hospitalized with acute myocardial infarction: Should we be analyzing cardiovascular outcomes data differently? Am. Heart J. 2003, 145, 27–35. [Google Scholar] [CrossRef] [PubMed]
- Yeh, Y.-C.; Yeh, K.-M.; Lin, T.-Y.; Chiu, S.-K.; Yang, Y.-S.; Wang, Y.-C.; Lin, J.-C. Impact of vancomycin MIC creep on patients with methicillin-resistant Staphylococcus aureus bacteremia. J. Microbiol. Immunol. Infect. 2012, 45, 214–220. [Google Scholar] [CrossRef]
- Steinkraus, G.; White, R.; Friedrich, L. Vancomycin MIC creep in non-vancomycin-intermediate Staphylococcus aureus (VISA), vancomycin-susceptible clinical methicillin-resistant S. aureus (MRSA) blood isolates from 2001–2005. J. Antimicrob. Chemother. 2007, 60, 788–794. [Google Scholar] [CrossRef]
- Diaz, R.; Afreixo, V.; Ramalheira, E.; Rodrigues, C.; Gago, B. Evaluation of vancomycin MIC creep in methicillin-resistant Staphylococcus aureus infections—A systematic review and meta-analysis. Clin. Microbiol. Infect. 2018, 24, 97–104. [Google Scholar] [CrossRef]
- Van de Kassteele, J.; Van Santen-Verheuvel, M.G.; Koedijk, F.D.; Van Dam, A.P.; Van der Sande, M.A.; De Neeling, A.J. New statistical technique for analyzing MIC-based susceptibility data. Antimicrob. Agents Chemother. 2012, 56, 1557–1563. [Google Scholar] [CrossRef]
- Annis, D.H.; Craig, B.A. Statistical properties and inference of the antimicrobial MIC test. Stat. Med. 2005, 24, 3631–3644. [Google Scholar] [CrossRef]
- Berge, A.C.B.; Atwill, E.R.; Sischo, W.M. Animal and farm influences on the dynamics of antibiotic resistance in faecal Escherichia coli in young dairy calves. Prev. Vet. Med. 2005, 69, 25–38. [Google Scholar] [CrossRef]
- Agga, G.E.; Scott, H.M. Use of generalized ordered logistic regression for the analysis of multidrug resistance data. Prev. Vet. Med. 2015, 121, 374–379. [Google Scholar] [CrossRef] [PubMed]
- Agresti, A. Logistic Regression Models Using Cumulative Logits. In Analysis of Ordinal Categorical Data; Wiley & Sons: Hoboken, NJ, USA, 2010; pp. 44–87. [Google Scholar]
- Williams, R. Understanding and interpreting generalized ordered logit models. J. Math. Sociol. 2016, 40, 7–20. [Google Scholar] [CrossRef]
- MacKinnon, M.C.; Pearl, D.L.; Carson, C.A.; Parmley, E.J.; McEwen, S.A. A comparison of modelling options to assess annual variation in susceptibility of generic Escherichia coli isolates to ceftiofur, ampicillin and nalidixic acid from retail chicken meat in Canada. Prev. Vet. Med. 2018, 160, 123–135. [Google Scholar] [CrossRef] [PubMed]
- Catania, S.; Bottinelli, M.; Fincato, A.; Gastaldelli, M.; Barberio, A.; Gobbo, F.; Vicenzoni, G. Evaluation of Minimum Inhibitory Concentrations for 154 Mycoplasma synoviae isolates from Italy collected during 2012–2017. PLoS ONE 2019, 14, e0224903. [Google Scholar] [CrossRef] [PubMed]
- Bote, K.; Pöppe, J.; Merle, R.; Makarova, O.; Roesler, U. Minimum Inhibitory Concentration of Glyphosate and of a Glyphosate-Containing Herbicide Formulation for Escherichia coli Isolates—Differences between Pathogenicand Non-pathogenic Isolates and between Host Species. Front. Microbiol. 2019, 10. [Google Scholar] [CrossRef]
- Jaillard, M.; Van Belkum, A.; Cady, K.C.; Creely, D.; Shortridge, D.; Blanc, B.; Barbu, E.M.; Dunne, W.M.; Zambardi, G.; Enright, M.; et al. Correlation between phenotypic antibiotic susceptibility and the resistome in Pseudomonas aeruginosa. Int. J. Antimicrob. Agents 2017, 50, 210–218. [Google Scholar] [CrossRef]
- Berge, A.C.B.; Moore, D.A.; Sischo, W.M. Field Trial Evaluating the Influence of Prophylactic and Therapeutic Antimicrobial Administration on Antimicrobial Resistance of Fecal Escherichia coli in Dairy Calves. Appl. Environ. Microbiol. 2006, 72, 3872–3878. [Google Scholar] [CrossRef]
- Zhang, M.; Wang, C.; O’Connor, A. A hierarchical Bayesian latent class mixture model with censorship for detection of linear temporal changes in antibiotic resistance. PLoS ONE 2020, 15, e0220427. [Google Scholar] [CrossRef]
- Grazian, C. Estimating MIC distributions and cutoffs through mixture models: An application to establish M. Tuberculosis resistance. bioRxiv 2019. [Google Scholar] [CrossRef]
- Jaspers, S.; Aerts, M.; Verbeke, G.; Beloeil, P.-A. Estimation of the wild-type minimum inhibitory concentration value distribution. Stat. Med. 2013, 33, 289–303. [Google Scholar] [CrossRef] [PubMed]
- Jaspers, S.; Aerts, M.; Verbeke, G.; Beloeil, P.-A. A new semi-parametric mixture model for interval censored data, with applications in the field of antimicrobial resistance. Comput. Stat. Data Anal. 2014, 71, 30–42. [Google Scholar] [CrossRef]
- Jaspers, S.; Verbeke, G.; Böhning, D.; Aerts, M. Application of the Vertex Exchange Method to estimate a semi-parametric mixture model for the MIC density of Escherichia coli isolates tested for susceptibility against ampicillin. Biostatistics 2015, 17, 94–107. [Google Scholar] [CrossRef] [PubMed]
- McLachlan, G.J.; Jones, P.N. Fitting Mixture Models to Grouped and Truncated Data via the EM Algorithm. Biometrics 1988, 44, 571–578. [Google Scholar] [CrossRef]
- Jaspers, S.; Lambert, P.; Aerts, M. A Bayesian approach to the semiparametric estimation of a minimum inhibitory concentration distribution. Ann. Appl. Stat. 2016, 10, 906–924. [Google Scholar] [CrossRef]
- Jaspers, S.; Komárek, A.; Aerts, M. Bayesian estimation of multivariate normal mixtures with covariate-dependent mixing weights, with an application in antimicrobial resistance monitoring. Biom. J. 2017, 60, 7–19. [Google Scholar] [CrossRef]
- Wagenmakers, E.-J.; Morey, R.D.; Lee, M.D. Bayesian Benefits for the Pragmatic Researcher. Curr. Dir. Psychol. Sci. 2016, 25, 169–176. [Google Scholar] [CrossRef]
- Stegeman, J.A.; Vernooij, J.C.M.; Khalifa, O.A.; Van den Broek, J.; Mevius, D.J. Establishing the change in antibiotic resistance of Enterococcus faecium strains isolated from Dutch broilers by logistic regression and survival analysis. Prev. Vet. Med. 2006, 74, 56–66. [Google Scholar] [CrossRef]
- Pan, W. Using Frailties in the Accelerated Failure Time Model. Lifetime Data Anal. 2001, 7, 55–64. [Google Scholar] [CrossRef]
- Zhang, D. Modeling Survival Data with Parametric Regression Models: 5.1 The Accelerated Failure Time Model. Available online: https://www4.stat.ncsu.edu/~dzhang2/st745/chap5.pdf (accessed on 3 August 2020).
- Wei, L.J. The accelerated failure time model: A useful alternative to the cox regression model in survival analysis. Stat. Med. 1992, 11, 1871–1879. [Google Scholar] [CrossRef]
- Lawless, J.F. Statistical Models and Methods for Lifetime Data; Wiley & Sons: Hoboken, NJ, USA, 2011; Volume 362. [Google Scholar]
- Kalbfleisch, J.D.; Prentice, R.L. The Statistical Analysis of Failure Time Data; Wiley & Sons: Hoboken, NJ, USA, 2011; Volume 360. [Google Scholar]


| Model | Data Type | Advantages | Disadvantages |
|---|---|---|---|
| Logistic regression | Dichotomous |
|
|
| Proportional odds cumulative logit model | Ordinal |
|
|
| Generalized ordered logit model | Ordinal |
|
|
| Mixture models | Interval-Censored |
|
|
| Accelerated failure time model with frailties | Interval-Censored |
|
|
© 2020 by the authors. Licensee MDPI, Basel, Switzerland. This article is an open access article distributed under the terms and conditions of the Creative Commons Attribution (CC BY) license (http://creativecommons.org/licenses/by/4.0/).
Share and Cite
Michael, A.; Kelman, T.; Pitesky, M. Overview of Quantitative Methodologies to Understand Antimicrobial Resistance via Minimum Inhibitory Concentration. Animals 2020, 10, 1405. https://doi.org/10.3390/ani10081405
Michael A, Kelman T, Pitesky M. Overview of Quantitative Methodologies to Understand Antimicrobial Resistance via Minimum Inhibitory Concentration. Animals. 2020; 10(8):1405. https://doi.org/10.3390/ani10081405
Chicago/Turabian StyleMichael, Alec, Todd Kelman, and Maurice Pitesky. 2020. "Overview of Quantitative Methodologies to Understand Antimicrobial Resistance via Minimum Inhibitory Concentration" Animals 10, no. 8: 1405. https://doi.org/10.3390/ani10081405
APA StyleMichael, A., Kelman, T., & Pitesky, M. (2020). Overview of Quantitative Methodologies to Understand Antimicrobial Resistance via Minimum Inhibitory Concentration. Animals, 10(8), 1405. https://doi.org/10.3390/ani10081405