Estimation of between-Cow Variability in Nutrient Digestion of Lactating Dairy Cows Fed Corn-Based Diets

 , ,
, ,
Simple Summary
Abstract
1. Introduction
2. Materials and Methods
2.1. Experimental Design, Animals and Diets
2.2. Measurements and Sample Collection
2.3. Laboratory Analysis of TMR, Orts and Fecal Samples
2.4. Statistical Analysis
3. Results
3.1. Descriptive Statistics and Statistical Power Estimates of Original Five Sample Sizes and Bootstrap Replicates
3.2. Effect of Diet on Body Weight and DMI of Dairy Cows Fed Corn-Based Diets
3.3. Effect of Diet on Nutrient Digestibility of Dairy Cows Fed Corn-Based Diets
3.4. Effect of Diet on Lactation Performance of Dairy Cows Fed Corn-Based Diets
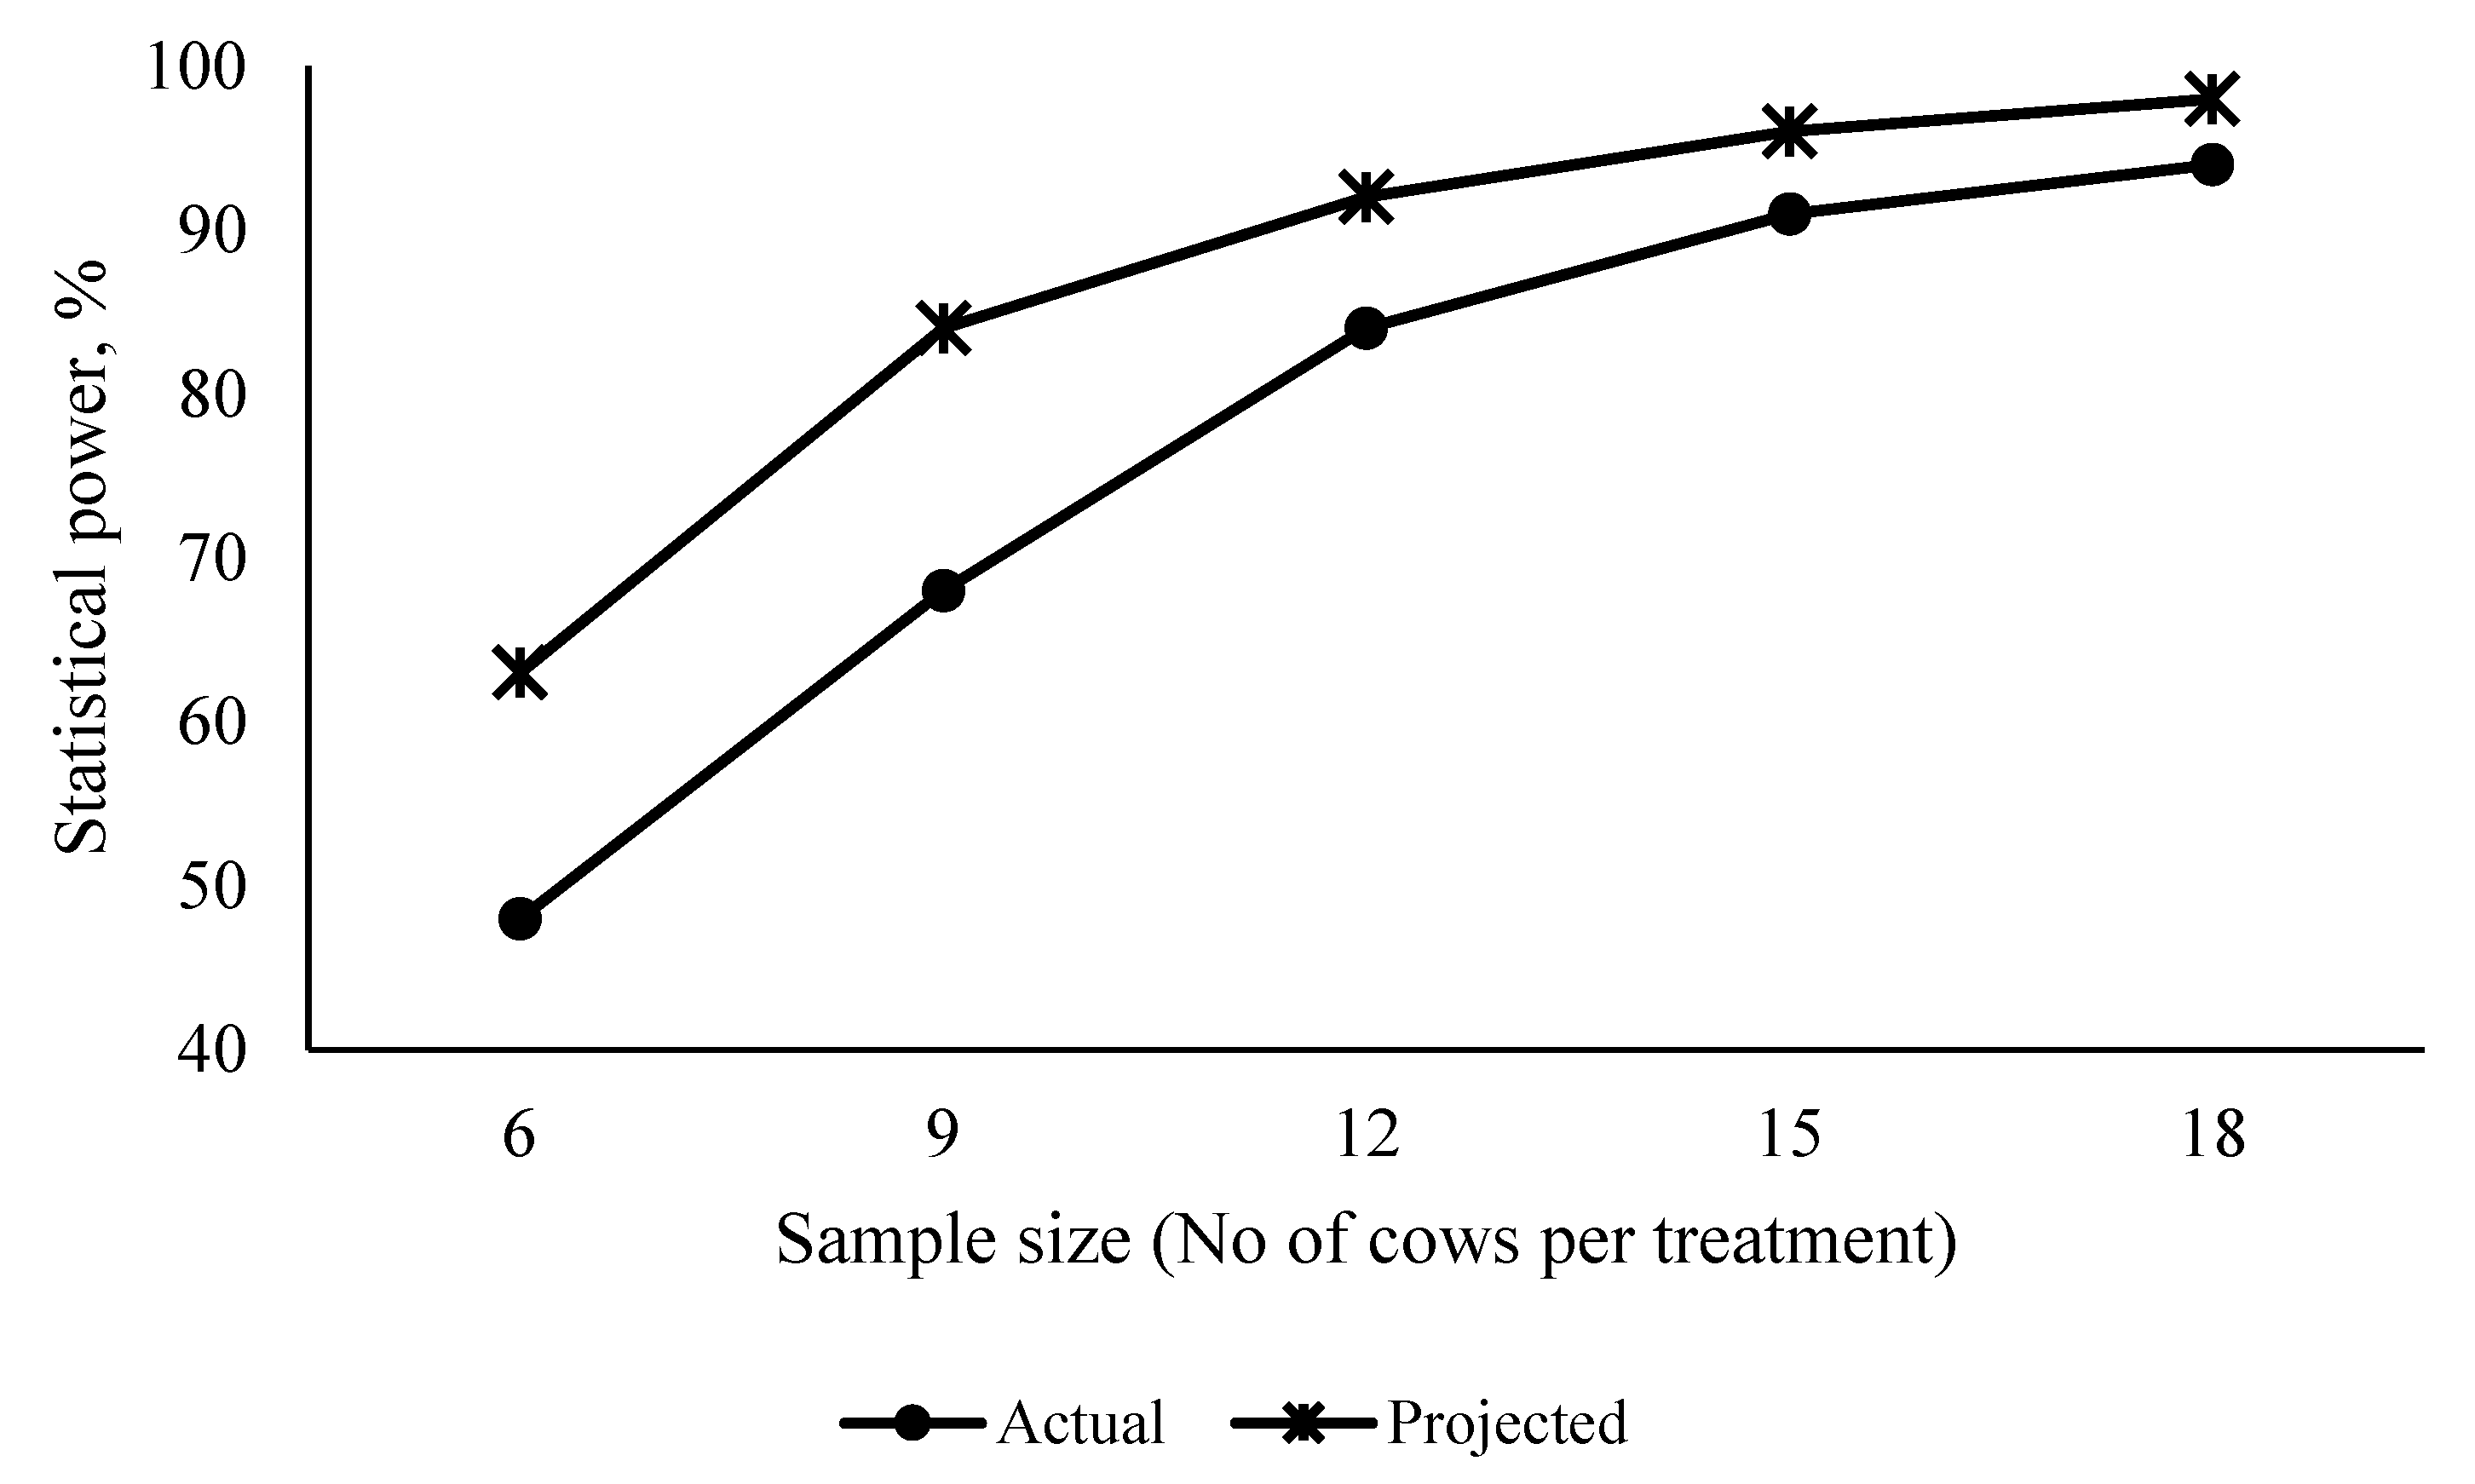
3.5. Effect of Cow Variability on Sample Size Determination and the Statistical Power Change with the Sample Size
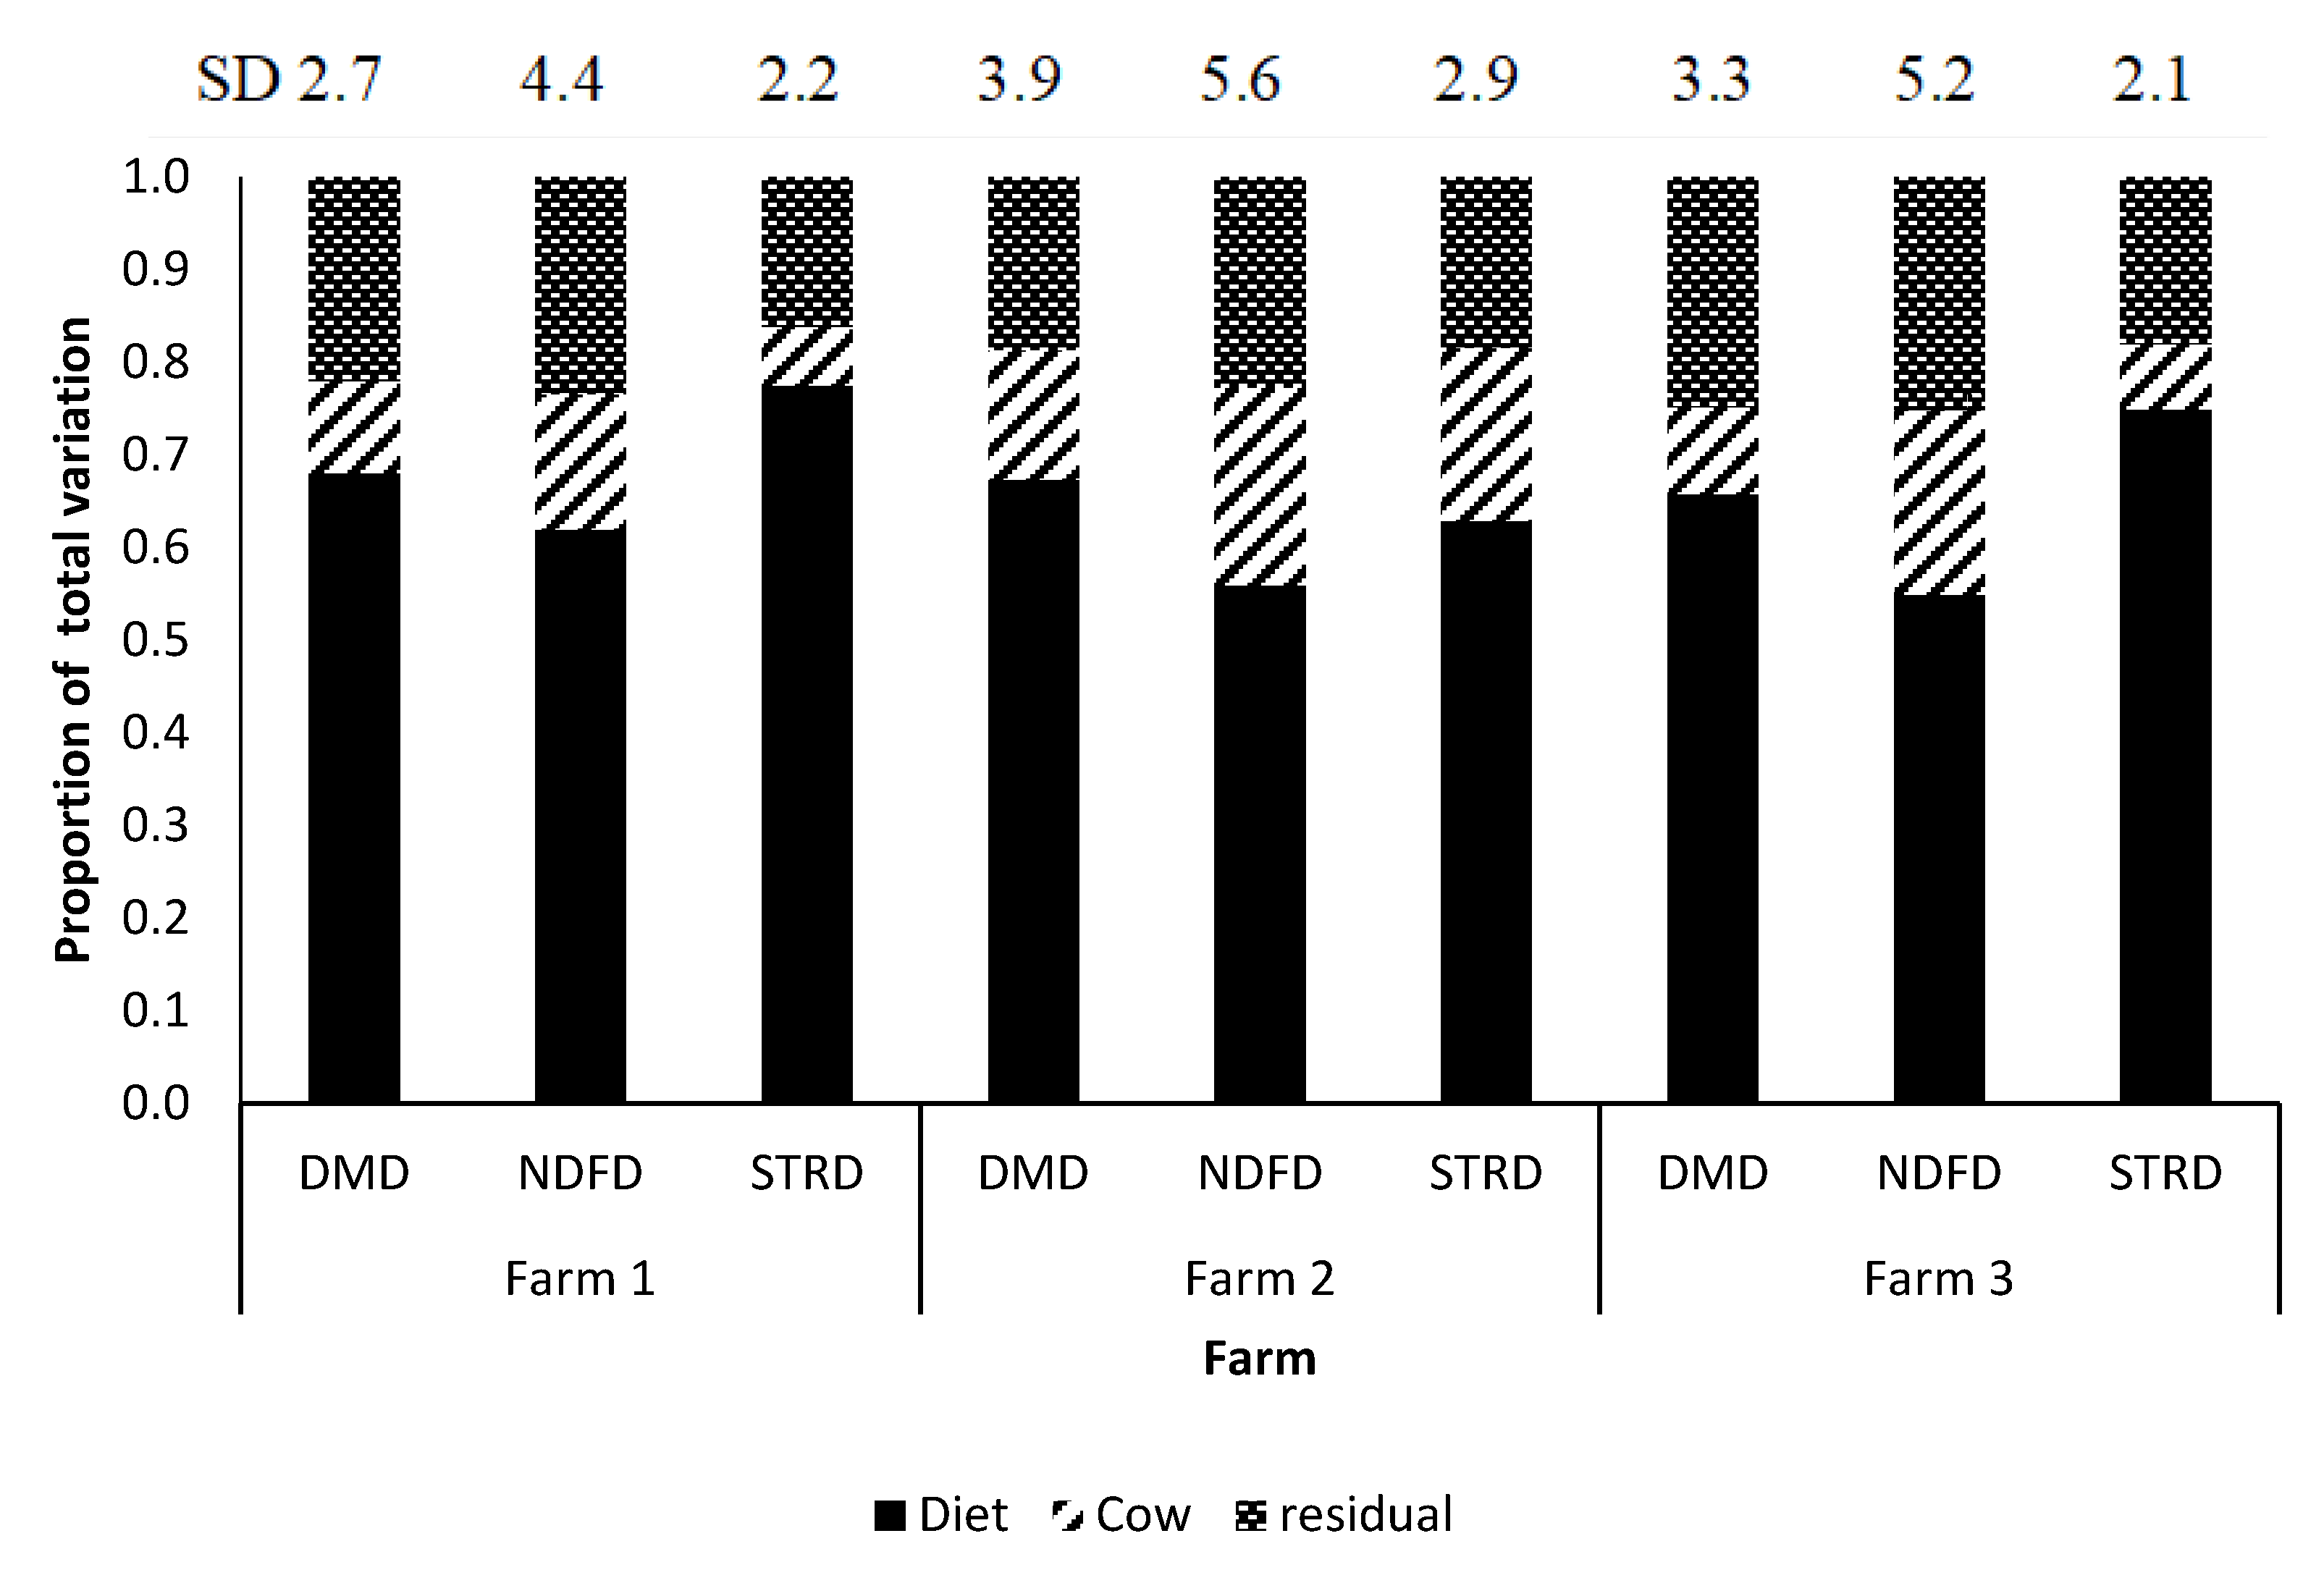
3.6. Variance Components Associated with Nutrient Digestibility between and Within-Farm
4. Discussion
5. Conclusions
Author Contributions
Funding
Acknowledgments
Conflicts of Interest
References
- Danielsson, R.; Ramin, M.; Bertilsson, J.; Lund, P.; Huhtanen, P. Evaluation of a gas in vitro system for predicting methane production in vivo. J. Dairy Sci. 2017, 100, 8881–8894. [Google Scholar] [CrossRef] [PubMed]
- Zanton, G.I. Effect of experimental design on responses to 2 concentrations of metabolizable protein in multiparous dairy cows. J. Dairy Sci. 2019, 102, 5094–5108. [Google Scholar] [CrossRef]
- Festing, M.F.W. Design and statistical methods in studies using animal models of development. ILAR J. 2006, 47, 5–14. [Google Scholar] [CrossRef]
- Smith, D.R.; Hardy, I.C.W.; Gammell, M.P. Power rangers: No improvement in the statistical power of analyses published in Animal Behaviour. Anim. Behav. 2011, 81, 347–352. [Google Scholar] [CrossRef]
- Tempelman, R.J. Invited review: Assessing experimental designs for research conducted on commercial dairies. J. Dairy Sci. 2009, 92, 1–15. [Google Scholar] [CrossRef]
- Charan, J.; Kantharia, N. How to calculate sample size in animal studies? J. Pharmacol. Pharmacother. 2013, 4, 303–306. [Google Scholar] [CrossRef]
- Kononoff, P.J.; Hanford, K.J. Technical note: Estimating statistical power of mixed models used in dairy nutrition experiments. J. Dairy Sci. 2006, 89, 3968–3971. [Google Scholar] [CrossRef]
- Tomczak, M.; Tomczak, E.; Kleka, P.; Lew, R. Using power analysis to estimate appropriate sample size. Trends Sport Sci. 2014, 4, 195–206. [Google Scholar]
- Wang, Z.; Goonewardene, L.A. The use of MIXED models in the analysis of animal experiments with repeated measures data. Can. J. Anim. Sci. 2004, 84, 1–11. [Google Scholar] [CrossRef]
- Promkot, C.; Wanapat, M.; Mansathit, J. Effects of yeast fermented-cassava chip protein (YEFECAP) on dietary intake and milk production of Holstein crossbred heifers and cows during pre- and post-partum period. Livest. Sci. 2013, 154, 112–116. [Google Scholar] [CrossRef]
- Wanapat, M.; Wongnen, N.; Sangkloy, W.; Pilajun, R.; Kanpukdee, S. On-farm use of legume (Phaseolus calcaratus) and Ruzi grass on rumen fermentation and milk production in lactating dairy cows. Agric. Sci. 2012, 3, 355–360. [Google Scholar] [CrossRef]
- St-Pierre, N.R. Design and analysis of pen studies in the animal sciences. J. Dairy Sci. 2007, 90, E87–E99. [Google Scholar] [CrossRef] [PubMed]
- NRC. Nutrient Requirements of Dairy Cattle, 7th rev ed.; National Academy Press: Washington, DC, USA, 2001. [Google Scholar]
- Lopes, J.C.; Shaver, R.D.; Hoffman, P.C.; Akins, M.S.; Bertics, S.J.; Gencoglu, H.; Coors, J.G. Type of corn endosperm influences nutrient digestibility in lactating dairy cows. J. Dairy Sci. 2009, 92, 4541–4548. [Google Scholar] [CrossRef]
- Morris, D.L.; Rebelo, L.R.; Dieter, P.A.; Lee, C. Validating intrinsic markers and optimizing spot sampling frequency to estimate fecal outputs. J. Dairy Sci. 2018, 101, 7980–7989. [Google Scholar] [CrossRef]
- Association of Official Analytical Chemists. Official Methods of Analysis, 18th ed.; AOAC International: Arlington, VA, USA, 2006. [Google Scholar]
- Van Soest, P.J.; Robertson, J.B.; Lewis, B.A. Methods for Dietary Fiber, Neutral Detergent Fiber, and Nonstarch Polysaccharides in Relation to Animal Nutrition. J. Dairy Sci. 1991, 74, 3583–3597. [Google Scholar] [CrossRef]
- Lee, C.; Hristov, A.N.; Heyler, K.S.; Cassidy, T.W.; Lapierre, H.; Varga, G.A.; Parys, C. Effects of metabolizable protein supply and amino acid supplementation on nitrogen utilization, milk production, and ammonia emissions from manure in dairy cows. J. Dairy Sci. 2012, 95, 5253–5268. [Google Scholar] [CrossRef]
- Ito, K.; Weary, D.M.; von Keyserlingk, M.A.G. Lying behavior: Assessing within- and between- herd variation in free-stall-housed dairy cows. J. Dairy Sci. 2009, 92, 4412–4420. [Google Scholar] [CrossRef]
- Boos, D.D.; Brownie, C. Bootstrap methods for testing homogeneity of variances. Technometrics 1989, 31, 69–82. [Google Scholar] [CrossRef]
- Cahoy, D.O. A bootstrap test for equality of variances. Comput. Stat. Data Anal. 2010, 54, 2306–2316. [Google Scholar] [CrossRef]
- Allen, M.S. Effects of diet on short-term regulation of feed intake by lactating dairy cattle. J. Dairy Sci. 2000, 83, 1598–1624. [Google Scholar] [CrossRef]
- Souza, M.C.; Oliveira, A.S.; Araújo, C.V.; Brito, A.F.; Teixeira, R.M.A.; Moares, E.H.B.K.; Moura, D.C. Short communication: Prediction of intake in dairy cows under tropical conditions. J. Dairy Sci. 2014, 97, 3845–3854. [Google Scholar] [CrossRef] [PubMed]
- Nousiainen, J.; Rinne, M.; Huhtanen, P. A meta-analysis of feed digestion in dairy cows. 1. the effects of forage and concentrate factors on total diet digestibility. J. Dairy Sci. 2009, 92, 5019–5030. [Google Scholar] [CrossRef] [PubMed]
- Lechartier, C.; Peyraud, J.L. The effects of forage proportion and rapidly degradable dry matter from concentrate on ruminal digestion in dairy cows fed corn silage-based diets with fixed neutral detergent fiber and starch contents. J. Dairy Sci. 2010, 93, 666–681. [Google Scholar] [CrossRef]
- Aikman, P.C.; Reynolds, C.K.; Beever, D.E. Diet digestibility, rate of passage, and eating and rumination behavior of Jersey and Holstein cows. J. Dairy Sci. 2008, 91, 1103–1114. [Google Scholar] [CrossRef]
- Ferraretto, L.F.; Crump, P.M.; Shaver, R.D. Effect of cereal grain type and corn grain harvesting and processing methods on intake, digestion, and milk production by dairy cows through a meta-analysis. J. Dairy Sci. 2013, 96, 533–550. [Google Scholar] [CrossRef]
- Beckman, J.L.; Weiss, W.P. Nutrient digestibility of diets with different fiber to starch ratios when fed to lactating dairy cows. J. Dairy Sci. 2005, 88, 1015–1023. [Google Scholar] [CrossRef]
- Zhao, M.; Bu, D.; Wang, J.; Zhou, X.; Zhu, D.; Zhang, T.; Niu, J.; Ma, L. Milk production and composition responds to dietary neutral detergent fiber and starch ratio in dairy cows. Anim. Sci. J. 2015, 87, 756–766. [Google Scholar] [CrossRef]
- Firkins, J.L.; Eastridge, M.L.; St-Pierre, N.R.; Noftsger, S.M. Effects of grain variability and processing on starch utilization by lactating dairy cattle. J. Anim. Sci. 2001, 79, E218. [Google Scholar] [CrossRef]
- Maxin, G.; Rulquin, H.; Glasser, F. Response of milk fat concentration and yield to nutrient supply in dairy cows. Animal 2011, 5, 1299–1310. [Google Scholar] [CrossRef]
- Sun, Y.; Bu, D.P.; Wang, J.Q.; Cui, H.; Zhao, X.W.; Xu, X.Y.; Sun, P.; Zhou, L.Y. Supplementing different ratios of short- and medium-chain fatty acids to long-chain fatty acids in dairy cows: Changes of milk fat production and milk fatty acids composition. J. Dairy Sci. 2013, 96, 2366–2373. [Google Scholar] [CrossRef]
- Jenkins, T.C.; McGuire, M.A. Major advances in nutrition: Impact on milk composition. J. Dairy Sci. 2006, 89, 1302–1310. [Google Scholar] [CrossRef]
- Valadares Filho, S.C.; Broderick, G.A.; Valadares, R.F.D.; Clayton, M.K. Effect of replacing alfalfa silage with high moisture corn on nutrient utilization and milk production. J. Dairy Sci. 2000, 83, 106–114. [Google Scholar] [CrossRef]
- Zhu, W.; Fu, Y.; Wang, B.; Wang, C.; Ye, J.A.; Wu, Y.M.; Liu, J.X. Effects of dietary forage sources on rumen microbial protein synthesis and milk performance in early lactating dairy cows. J. Dairy Sci. 2013, 96, 1727–1734. [Google Scholar] [CrossRef]
- Dong, N.; Maynard, R. PowerUp!: A Tool for Calculating Minimum Detectable Effect Sizes and Minimum Required Sample Sizes for Experimental and Quasi-Experimental Design Studies. J. Res. Educ. Eff. 2013, 6, 24–67. [Google Scholar] [CrossRef]
- Wilson Van Voorhis, C.R.; Morgan, B.L. Understanding Power and Rules of Thumb for Determining Sample Sizes. Tutor. Quant. Methods Psychol. 2007, 3, 43–50. [Google Scholar] [CrossRef]
- Biau, D.J.; Kernéis, S.; Porcher, R. Statistics in brief: The importance of sample size in the planning and interpretation of medical research. Clin. Orthop. Relat. Res. 2008, 466, 2282–2288. [Google Scholar] [CrossRef]
- Huhtanen, P.; Cabezas-Garcia, E.H.; Krizsan, S.J.; Shingfield, K.J. Evaluation of between-cow variation in milk urea and rumen ammonia nitrogen concentrations and the association with nitrogen utilization and diet digestibility in lactating cows. J. Dairy Sci. 2015, 98, 3182–3196. [Google Scholar] [CrossRef]
- Chapuis-Lardy, L.; Fiorini, J.; Toth, J.; Dou, Z. Phosphorus concentration and solubility in dairy feces: Variability and affecting factors. J. Dairy Sci. 2004, 87, 4334–4341. [Google Scholar] [CrossRef]
- Beecher, M.; Buckley, F.; Waters, S.M.; Boland, T.M.; Enriquez-Hidalgo, D.; Deighton, M.H.; O’Donovan, M.; Lewis, E. Gastrointestinal tract size, total-tract digestibility, and rumen microflora in different dairy cow genotypes. J. Dairy Sci. 2014, 97, 3906–3917. [Google Scholar] [CrossRef]
- Cabezas-Garcia, E.H.; Krizsan, S.J.; Shingfield, K.J.; Huhtanen, P. Between-cow variation in digestion and rumen fermentation variables associated with methane production. J. Dairy Sci. 2017, 100, 4409–4424. [Google Scholar] [CrossRef]
- Owens, C.E.; Zinn, R.A.; Hassen, A.; Owens, F.N. Mathematical linkage of total-tract digestion of starch and neutral detergent fiber to their fecal concentrations and the effect of site of starch digestion on extent of digestion and energetic efficiency of cattle. Prof. Anim. Sci. 2016, 32, 531–549. [Google Scholar] [CrossRef]
- Allen, M.S. Starch Availability, Measurement and Implications for Ration Formulation. In Proceedings of the Herd Health and Nutrition Conference, Cornell University, Ithaca, NY, USA, 17 March 2015; pp. 113–117. [Google Scholar]
- Oba, M.; Allen, M.S. Effects of corn grain conservation method on ruminal digestion kinetics for lactating dairy cows at two dietary starch concentrations. J. Dairy Sci. 2003, 86, 184–194. [Google Scholar] [CrossRef]
- Voelker, J.A.; Allen, M.S. Pelleted beet pulp substituted for high-moisture corn: 2. Effects on digestion and ruminal digestion kinetics in lactating dairy cows. J. Dairy Sci. 2003, 86, 3553–3561. [Google Scholar] [CrossRef]
- Moharrery, A.; Larsen, M.; Weisbjerg, M.R. Starch digestion in the rumen, small intestine, and hind gut of dairy cows—A meta-analysis. Anim. Feed Sci. Technol. 2014, 192, 1–14. [Google Scholar] [CrossRef]
- Knowlton, K.F.; Glenn, B.P.; Erdman, R.A. Performance, Ruminal Fermentation, and Site of Starch Digestion in Early Lactation Cows Fed Corn Grain Harvested and Processed Differently. J. Dairy Sci. 1998, 81, 1972–1984. [Google Scholar] [CrossRef]
- Khan, M.; Mahr-Un-Nisa, A.; Sarwar, M. Techniques Measuring Evaluation of Feeds Digestibility for the Nutritional Evaluation of Feeds. Int. J. Agric. Biol. 2003, 5, 91–94. [Google Scholar]
- Sampaio, C.B.; Detmann, E.; Valente, T.N.P.; Costa, V.A.C.; Filho, S.d.C.V.; de Queiroz, A.C. Perfis de excreção fecal e vício de tempo curto de indicadores internos e externos em ensaio de digestão com bovinos. Rev. Bras. Zootec. 2011, 40, 657–665. [Google Scholar] [CrossRef]
- Fredin, S.M.; Ferraretto, L.F.; Akins, M.S.; Hoffman, P.C.; Shaver, R.D. Fecal starch as an indicator of total-tract starch digestibility by lactating dairy cows. J. Dairy Sci. 2014, 97, 1862–1871. [Google Scholar] [CrossRef]
- Olmos Colmenero, J.J.; Broderick, G.A. Effect of dietary crude protein concentration on milk production and nitrogen utilization in lactating dairy cows. J. Dairy Sci. 2006, 89, 1704–1712. [Google Scholar] [CrossRef]


| Variable | Diets 1 | ||
|---|---|---|---|
| D1 | D2 | D3 | |
| Ingredient Composition, (g/kg of Dry Matter) | |||
| Corn silage | 426 | 426 | 426 |
| Dry ground corn | 277 | 273 | 233 |
| Soy Bean Meal, 48% CP | 212 | 206 | 215 |
| Soy hulls | 41 | 46 | 63 |
| Whole cottonseed | 12 | 18 | 32 |
| Animal fat | 1.8 | 1.7 | 1.4 |
| Vitamin and Mineral Mixture | 30.2 | 29.3 | 29.6 |
| Chemical composition (g/kg of Dry Matter) DM | 564 | 579 | 583 |
| NDF | 239 | 273 | 302 |
| CP | 171 | 166 | 162 |
| Ether extract | 41 | 43 | 42 |
| Ash | 56 | 62 | 64 |
| iNDF | 84.2 | 89.5 | 92.4 |
| Starch | 343 | 267 | 232 |
| NDF:starch ratio | 0.7 | 1.0 | 1.3 |
| Variables 1 | Sample Size 3 | ||||||||||||
|---|---|---|---|---|---|---|---|---|---|---|---|---|---|
| N18 | N15 | N12 | N9 | N6 | |||||||||
| M18 | M15 | Bootstrap Rep 2 | M12 | Bootstrap Rep | M9 | Bootstrap Rep | M6 | Bootstrap Rep | |||||
| BSM | CI | BSM | CI | BSM | CI | BSM | CI | ||||||
| DMD | 0.678 | 0.682 | 0.683 | 0.66–0.70 | 0.666 | 0.670 | 0.64–0.67 | 0.718 | 0.713 | 0.69–0.73 | 0.741 | 0.743 | 0.70–0.75 |
| NDFD | 0.452 | 0.461 | 0.464 | 0.44–0.47 | 0.449 | 0.451 | 0.42–0.48 | 0.488 | 0.491 | 0.45–0.51 | 0.496 | 0.494 | 0.46–0.52 |
| STRD | 0.966 | 0.941 | 0.943 | 0.90–0.96 | 0.952 | 0.953 | 0.91–0.97 | 0.893 | 0.901 | 0.87–0.92 | 0.902 | 0.901 | 0.88–0.95 |
| VDMD | 3.8 | 3.9 | 3.8 | 3.6–4.1 | 4.2 | 4.6 | 3.8–4.8 | 5.1 | 5.3 | 4.7–5.6 | 6.3 | 6.8 | 6.2–6.9 |
| VNDFD | 5.1 | 5.4 | 5.9 | 5.1–6.2 | 6.3 | 6.6 | 6.0–6.8 | 7.4 | 7.9 | 7.1–8.2 | 9.3 | 9.8 | 8.9–10.4 |
| VSTRD | 3.3 | 3.4 | 3.7 | 3.0–4.2 | 3.8 | 3.9 | 3.5–4.3 | 4.1 | 4.5 | 3.9–4.8 | 5.6 | 5.8 | 5.1–6.7 |
| Power | 0.98 | 0.92 | 0.92 | 0.90–0.93 | 0.89 | 0.88 | 0.86–0.92 | 0.84 | 0.83 | 0.81–0.89 | 0.63 | 0.61 | 0.58–0.64 |
| Variable 1 | Sample Size Group 2 | Diet 3 | SEM 4 | p-Value 5 | |||
|---|---|---|---|---|---|---|---|
| D1 | D2 | D3 | L | Q | |||
| DMI, kg/d | N18 | 20.9 | 20.6 | 19.7 | 0.09 | NS | NS |
| N15 | 20.6 | 20.2 | 20.2 | 0.11 | NS | NS | |
| N12 | 20.7 | 20.4 | 20.4 | 0.11 | NS | NS | |
| N9 | 21.0 | 20.3 | 20.8 | 0.19 | NS | NS | |
| N6 | 21.0 | 20.8 | 20.5 | 0.24 | NS | NS | |
| Mean ± SD | 20.8 ± 0.18 | 20.4 ± 0.24 | 20.3 ± 0.4 | ||||
| DMI, %BW | N18 | 3.43 | 3.37 | 3.21 | 0.14 | NS | NS |
| N15 | 3.42 | 3.33 | 3.30 | 0.09 | NS | NS | |
| N12 | 3.41 | 3.35 | 3.31 | 0.13 | NS | NS | |
| N9 | 3.44 | 3.33 | 3.44 | 0.12 | NS | NS | |
| N6 | 3.48 | 3.41 | 3.38 | 0.14 | NS | NS | |
| Mean ± SD | 3.43 ± 0.02 | 3.36 ± 0.03 | 3.33 ± 0.09 | ||||
| BW, kg | N18 | 609 | 611 | 615 | 0.42 | NS | NS |
| N15 | 602 | 607 | 612 | 0.35 | NS | NS | |
| N12 | 606 | 608 | 616 | 0.31 | NS | NS | |
| N9 | 610 | 610 | 614 | 0.27 | NS | NS | |
| N6 | 604 | 606 | 615 | 0.38 | NS | NS | |
| Mean ± SD | 606 ± 3.34 | 608 ± 2.07 | 614 ± 1.52 | ||||
| Variable 1 | Sample Size Group 2 | Diet 3 | SEM 4 | p-Value 5 | |||
|---|---|---|---|---|---|---|---|
| D1 | D2 | D3 | L | Q | |||
| DMD | N18 | 0.726 aA | 0.703 bB | 0.678 cB | 0.89 | 0.01 | NS |
| N15 | 0.718 aA | 0.707 bB | 0.681 cB | 0.92 | 0.02 | NS | |
| N12 | 0.721 aA | 0.701 bB | 0.679 cB | 0.94 | 0.04 | NS | |
| N9 | 0.684 bB | 0.689 aC | 0.669 cC | 1.13 | 0.03 | NS | |
| N6 | 0.671 cC | 0.721 aA | 0.691 bA | 1.76 | 0.04 | NS | |
| Mean ± SD | 0.704 ± 0.02 | 0.704 ± 0.01 | 0.670 ± 0.01 | ||||
| NDFD | N18 | 0.447 C | 0.452 C | 0.454 C | 1.20 | 0.07 | NS |
| N15 | 0.451 C | 0.458 C | 0.451 C | 1.43 | 0.08 | NS | |
| N12 | 0.452 C | 0.454 C | 0.455 C | 1.45 | 0.09 | NS | |
| N9 | 0.472 aB | 0.469 bB | 0.468 bB | 2.12 | 0.04 | NS | |
| N6 | 0.481 aA | 0.474 cA | 0.478 bA | 2.45 | 0.03 | NS | |
| Mean ± SD | 0.460 ± 0.01 | 0.46 ± 0.01 | 0.46 ± 0.01 | ||||
| STRD | N18 | 0.916 cC | 0.932 B | 0.961 aA | 0.77 | 0.04 | NS |
| N15 | 0.921 cC | 0.929 B | 0.968 aA | 0.81 | 0.03 | NS | |
| N12 | 0.911 cC | 0.936 B | 0.964 aA | 0.84 | 0.05 | NS | |
| N9 | 0.938 bB | 0.915 cC | 0.948 aC | 0.94 | 0.04 | NS | |
| N6 | 0.952 A | 0.949 A | 0.952 | 0.96 | NS | NS | |
| Mean ± SD | 0.921 ± 0.02 | 0.930 ± 0.01 | 0.95 ± 0.01 | ||||
| Variable 1 | Sample Size Group 2 | Diet 3 | SEM 4 | p-Value 5 | |||
|---|---|---|---|---|---|---|---|
| D1 | D2 | D3 | L | Q | |||
| Milk yield, kg/d | N18 | 32.7 B | 32.2 B | 31.8 B | 1.64 | NS | NS |
| N15 | 32.2 B | 32.5 B | 32.0 B | 1.87 | NS | NS | |
| N12 | 32.9 B | 32.1 B | 31.9 B | 1.95 | NS | NS | |
| N9 | 33.8 aA | 33.2 aA | 32.4 bA | 3.21 | 0.07 | NS | |
| N6 | 31.8 B | 31.5 C | 31.8 B | 3.67 | NS | NS | |
| Mean ± SD | 32.7 ± 0.76 | 32.3 ± 0.62 | 31.9 ± 0.25 | ||||
| 4% FCM, kg/d | N18 | 30.0 | 31.0 | 31.2 | 0.65 | NS | NS |
| N15 | 30.3 | 31.1 | 31.6 | 0.72 | NS | NS | |
| N12 | 30.7 | 31.0 | 30.9 | 0.69 | NS | NS | |
| N9 | 29.2 | 29.9 | 31.5 | 0.89 | NS | NS | |
| N6 | 31.0 | 31.0 | 31.0 | 0.17 | NS | NS | |
| Mean ± SD | 30.2 ± 0.7 | 30.8 ± 0.5 | 31.2 ± 0.3 | ||||
| Milk fat, % | N18 | 3.46 c | 3.78 b | 3.89 a | 0.13 | 0.04 | NS |
| N15 | 3.42 c | 3.72 b | 3.85 a | 0.11 | 0.03 | NS | |
| N12 | 3.45 c | 3.71 b | 3.80 a | 0.19 | 0.05 | NS | |
| N9 | 3.46 b | 3.76 a | 3.76 a | 0.23 | 0.05 | NS | |
| N6 | 3.47 b | 3.77 a | 3.79 a | 0.22 | 0.04 | NS | |
| Mean ± SD | 3.45 ± 0.02 | 3.74 ± 0.03 | 3.81 ± 0.05 | ||||
| Milk fat (g/kg) | N18 | 1.13 | 1.21 | 1.23 | 0.08 | NS | NS |
| N15 | 1.10 | 1.20 | 1.23 | 0.09 | NS | NS | |
| N12 | 1.13 | 1.19 | 1.21 | 0.05 | NS | NS | |
| N9 | 1.16 | 1.24 | 1.21 | 0.09 | NS | NS | |
| N6 | 1.11 | 1.18 | 1.20 | 1.08 | NS | NS | |
| Mean ± SD | 1.12 ± 0.02 | 1.20 ± 0.02 | 1.21 ± 0.01 | ||||
| Milk protein, % | N18 | 3.20 c | 3.16 b | 3.02 a | 0.21 | 0.05 | NS |
| N15 | 3.22 c | 3.20 b | 3.07 a | 0.32 | 0.04 | NS | |
| N12 | 3.19 c | 3.16 b | 3.04 a | 0.29 | 0.05 | NS | |
| N9 | 3.21 b | 3.18 b | 3.01 a | 0.54 | 0.08 | NS | |
| N6 | 3.21 b | 3.19 b | 3.06 a | 0.65 | 0.07 | NS | |
| Mean ± SD | 3.20 ± 0.01 | 3.17 ± 0.01 | 3.04 ± 0.03 | ||||
| Milk protein (g/kg) | N18 | 1.04 | 1.01 | 0.96 | 0.05 | NS | NS |
| N15 | 1.03 | 1.04 | 0.98 | 0.04 | NS | NS | |
| N12 | 1.04 | 1.01 | 0.96 | 0.03 | NS | NS | |
| N9 | 1.08 | 1.05 | 0.97 | 0.09 | NS | NS | |
| N6 | 1.02 | 1.00 | 0.97 | 1.23 | NS | NS | |
| Mean ± SD | 1.04 ± 0.02 | 1.02 ± 0.02 | 0.96 ± 0.01 | ||||
| Item | Total Variability (SD, g/kg) | Within-Farm Variability (SD, g/kg) | |||||
|---|---|---|---|---|---|---|---|
| Farm | Diet | Between-Cow | Residual 1 | Diet | Between-Cow | Residual | |
| DMD 2 | 2.31 | 3.15 | 0.48 | 0.73 | 4.76 | 1.85 | 2.72 |
| NDFD 3 | 3.46 | 4.25 | 1.12 | 1.76 | 6.37 | 3.62 | 4.07 |
| STRD 4 | 1.32 | 4.72 | 0.62 | 0.94 | 6.65 | 2.63 | 3.3 |
© 2020 by the authors. Licensee MDPI, Basel, Switzerland. This article is an open access article distributed under the terms and conditions of the Creative Commons Attribution (CC BY) license (http://creativecommons.org/licenses/by/4.0/).
Share and Cite
Tharangani, H.; Lu, C.; Zhao, L.; Ma, L.; Guo, X.; Weiss, W.P.; Bu, D. Estimation of between-Cow Variability in Nutrient Digestion of Lactating Dairy Cows Fed Corn-Based Diets. Animals 2020, 10, 1363. https://doi.org/10.3390/ani10081363
Tharangani H, Lu C, Zhao L, Ma L, Guo X, Weiss WP, Bu D. Estimation of between-Cow Variability in Nutrient Digestion of Lactating Dairy Cows Fed Corn-Based Diets. Animals. 2020; 10(8):1363. https://doi.org/10.3390/ani10081363
Chicago/Turabian StyleTharangani, Himali, Changwen Lu, Liansheng Zhao, Lu Ma, Xusheng Guo, William P. Weiss, and Dengpan Bu. 2020. "Estimation of between-Cow Variability in Nutrient Digestion of Lactating Dairy Cows Fed Corn-Based Diets" Animals 10, no. 8: 1363. https://doi.org/10.3390/ani10081363
APA StyleTharangani, H., Lu, C., Zhao, L., Ma, L., Guo, X., Weiss, W. P., & Bu, D. (2020). Estimation of between-Cow Variability in Nutrient Digestion of Lactating Dairy Cows Fed Corn-Based Diets. Animals, 10(8), 1363. https://doi.org/10.3390/ani10081363