Accuracy of Broiler Activity Index as Affected by Sampling Time Interval


Simple Summary
Abstract
1. Introduction
2. Materials and Methods
2.1. Housing, Animals and Management
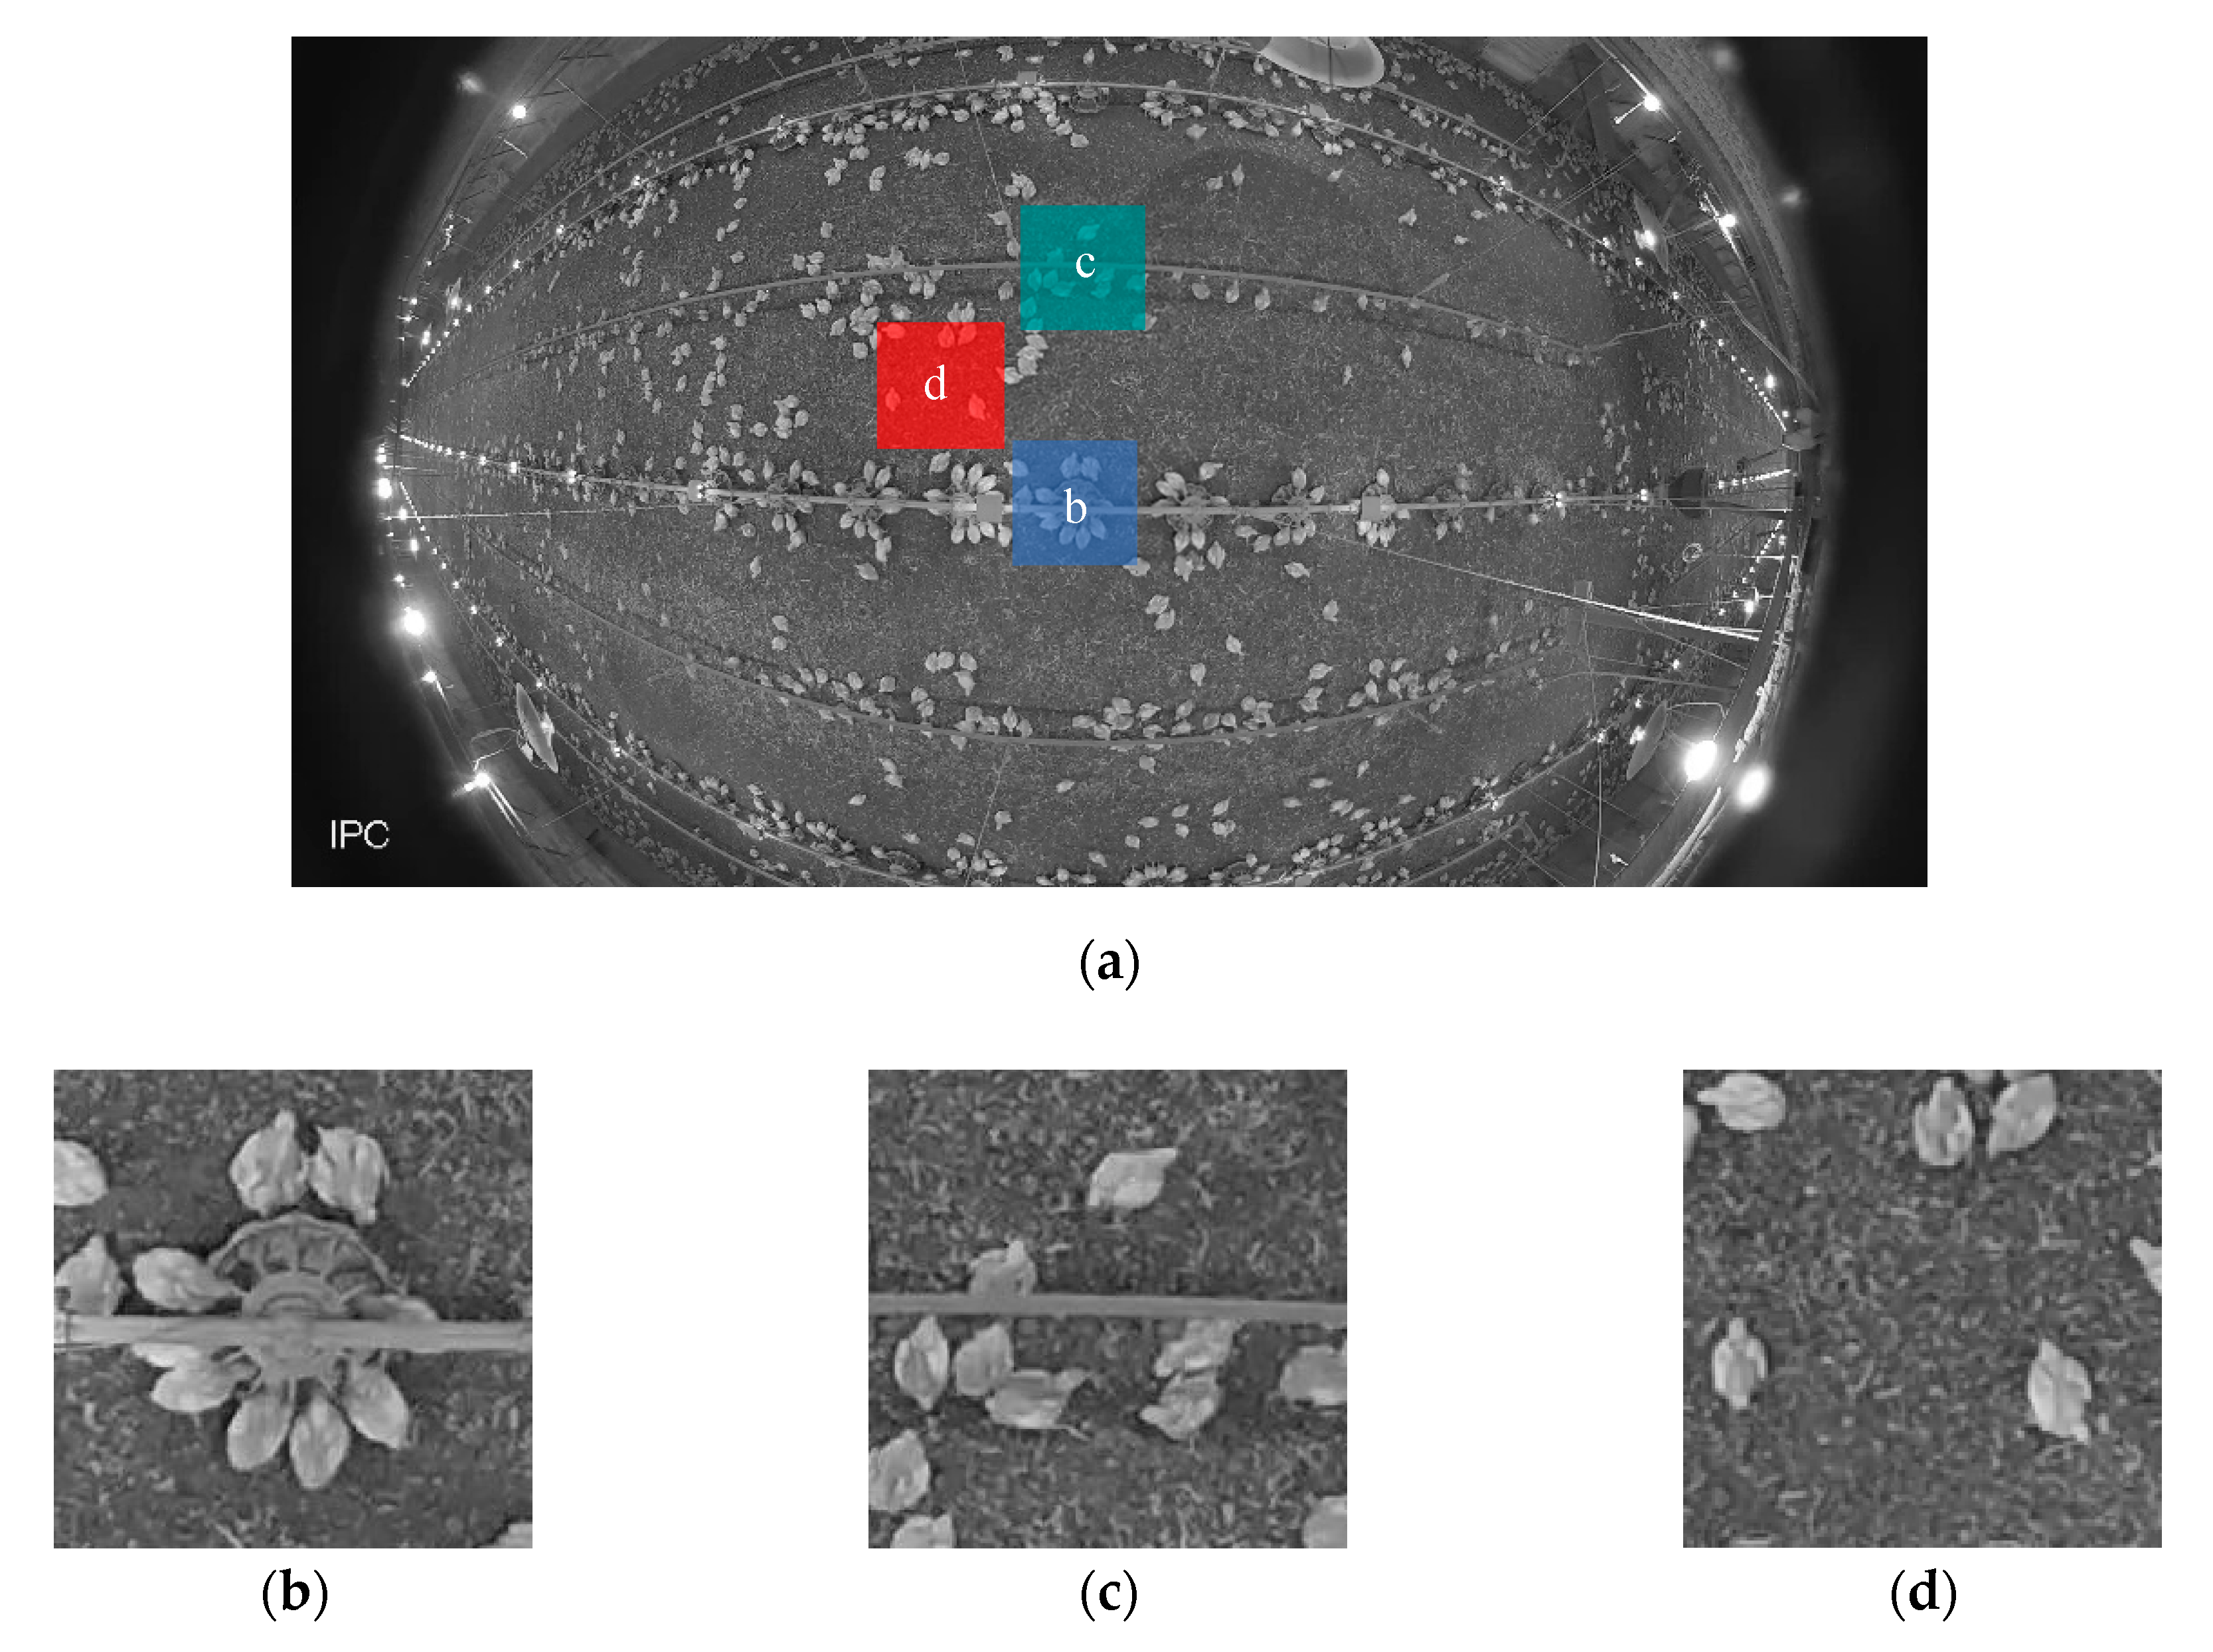
2.2. Camera System
2.3. Activity Index
2.4. Data Preparation and Statistic Analysis
3. Results
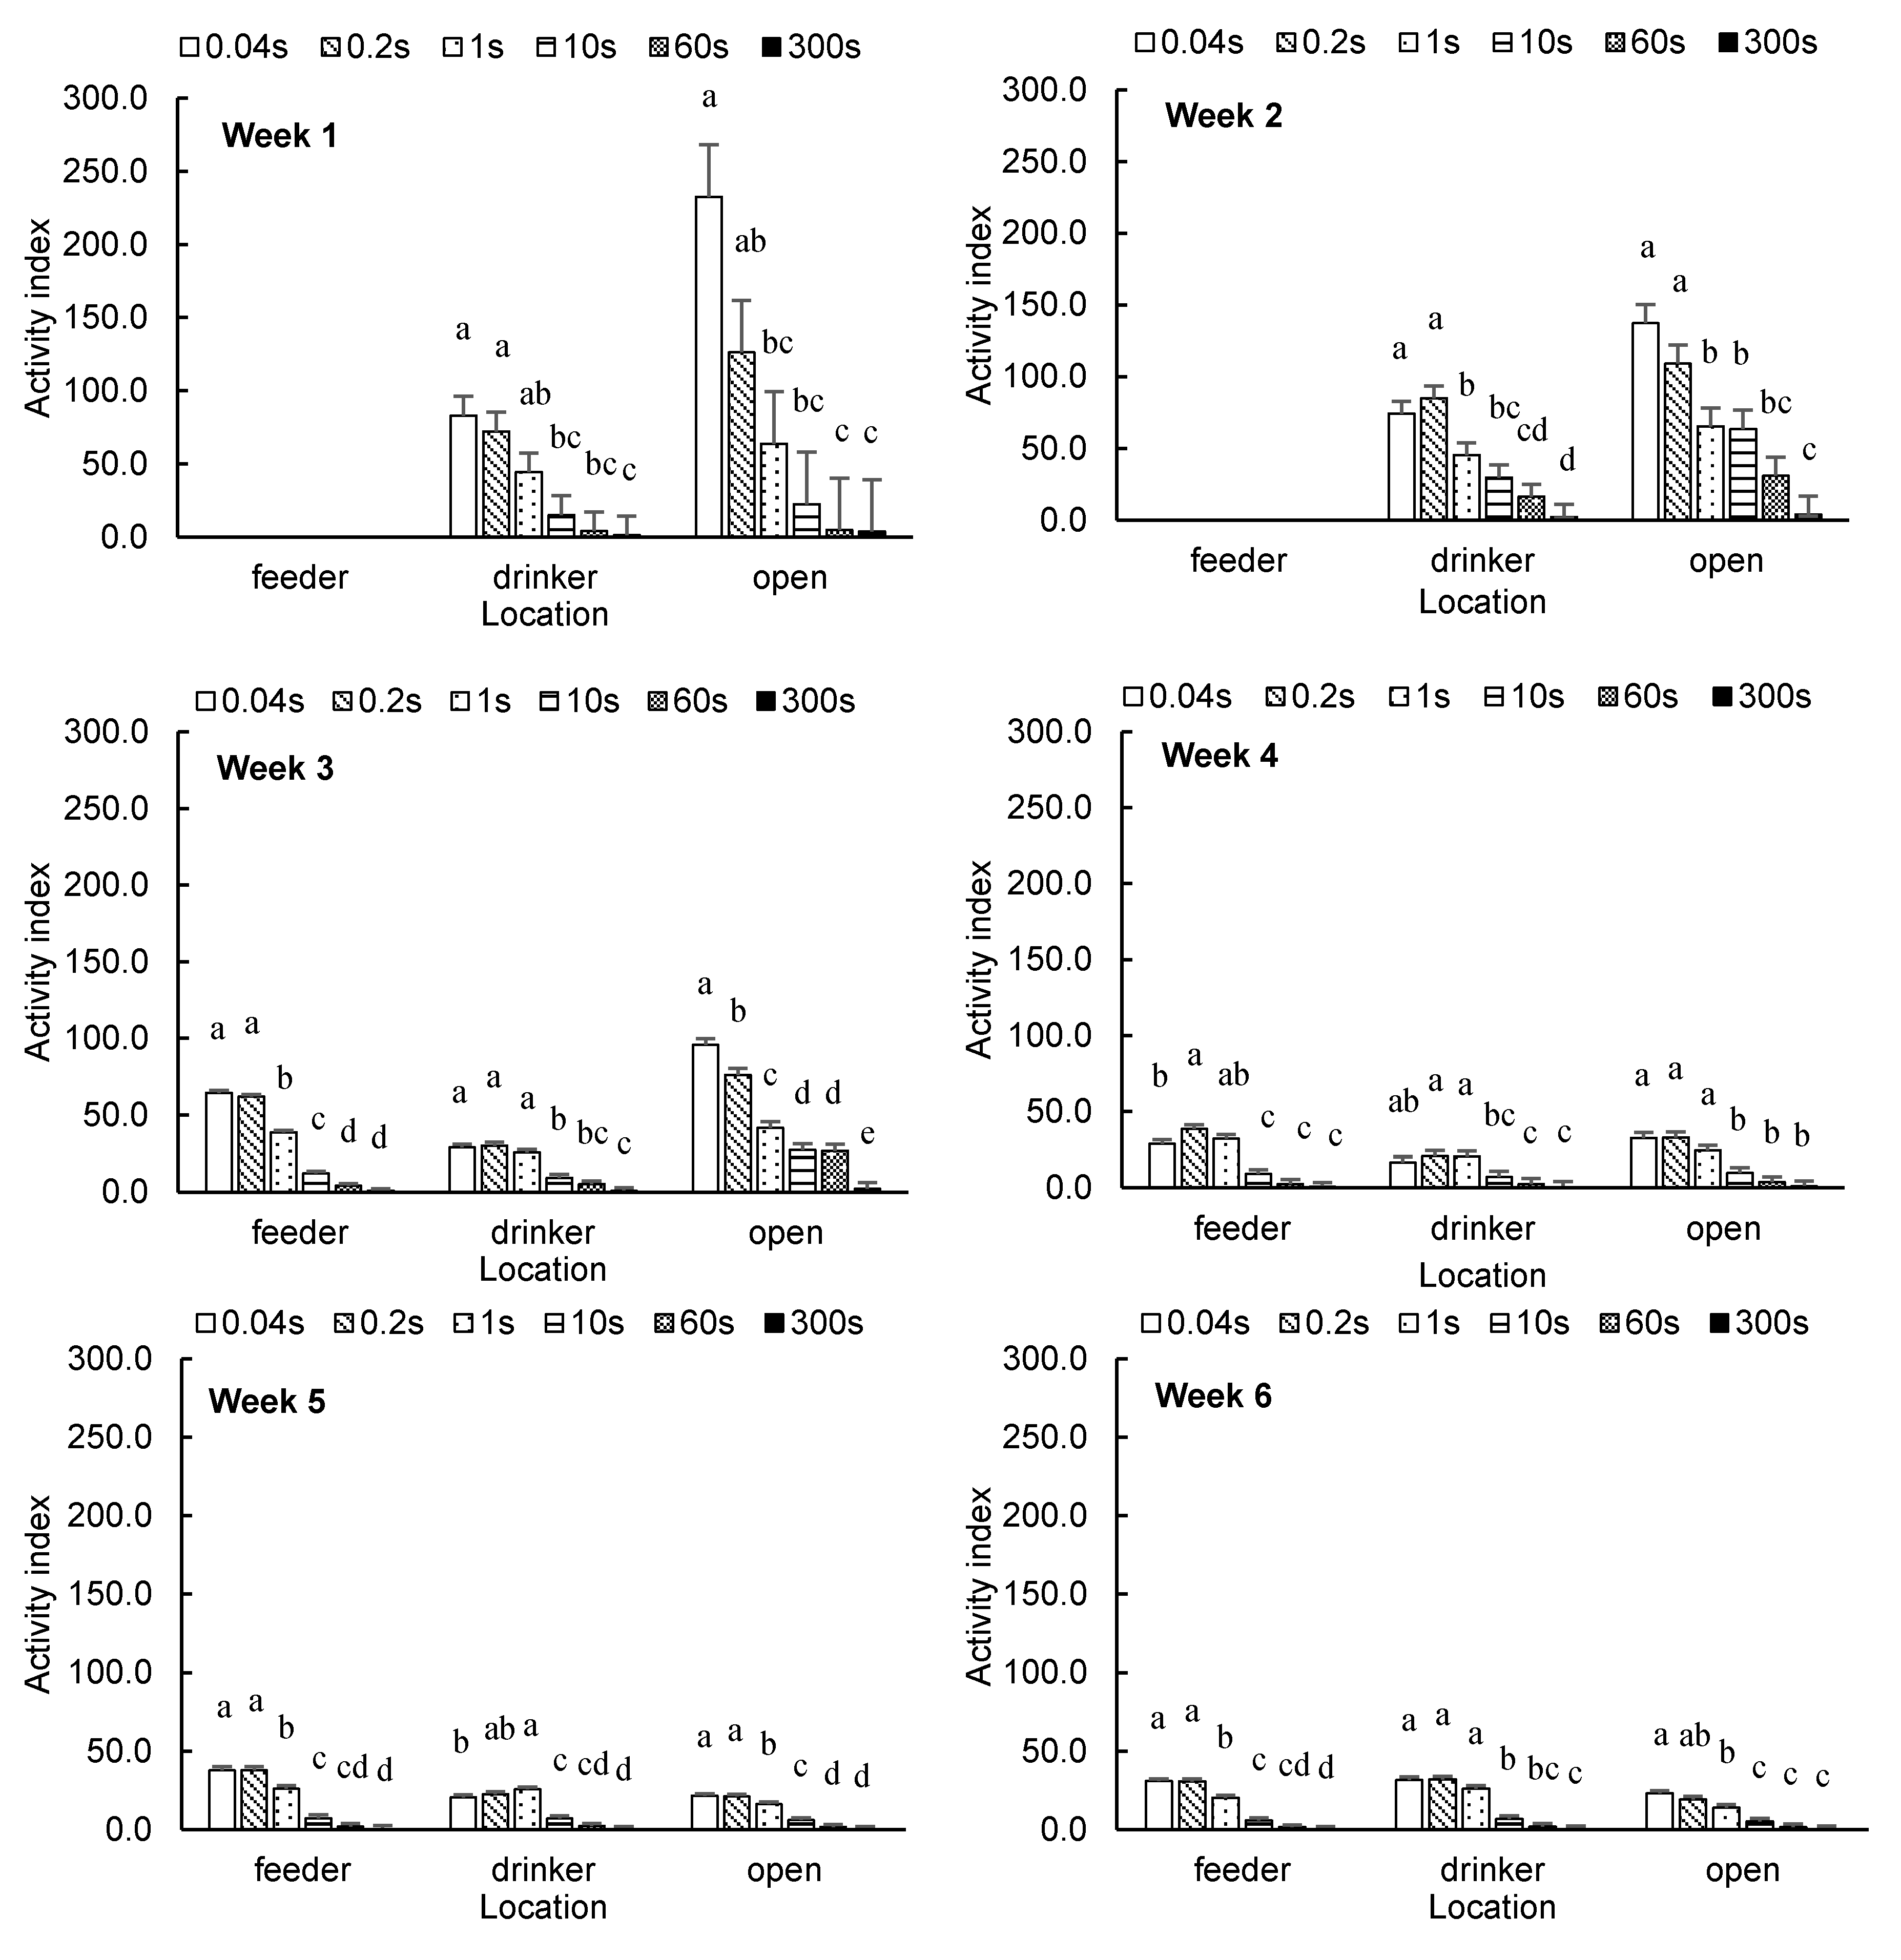
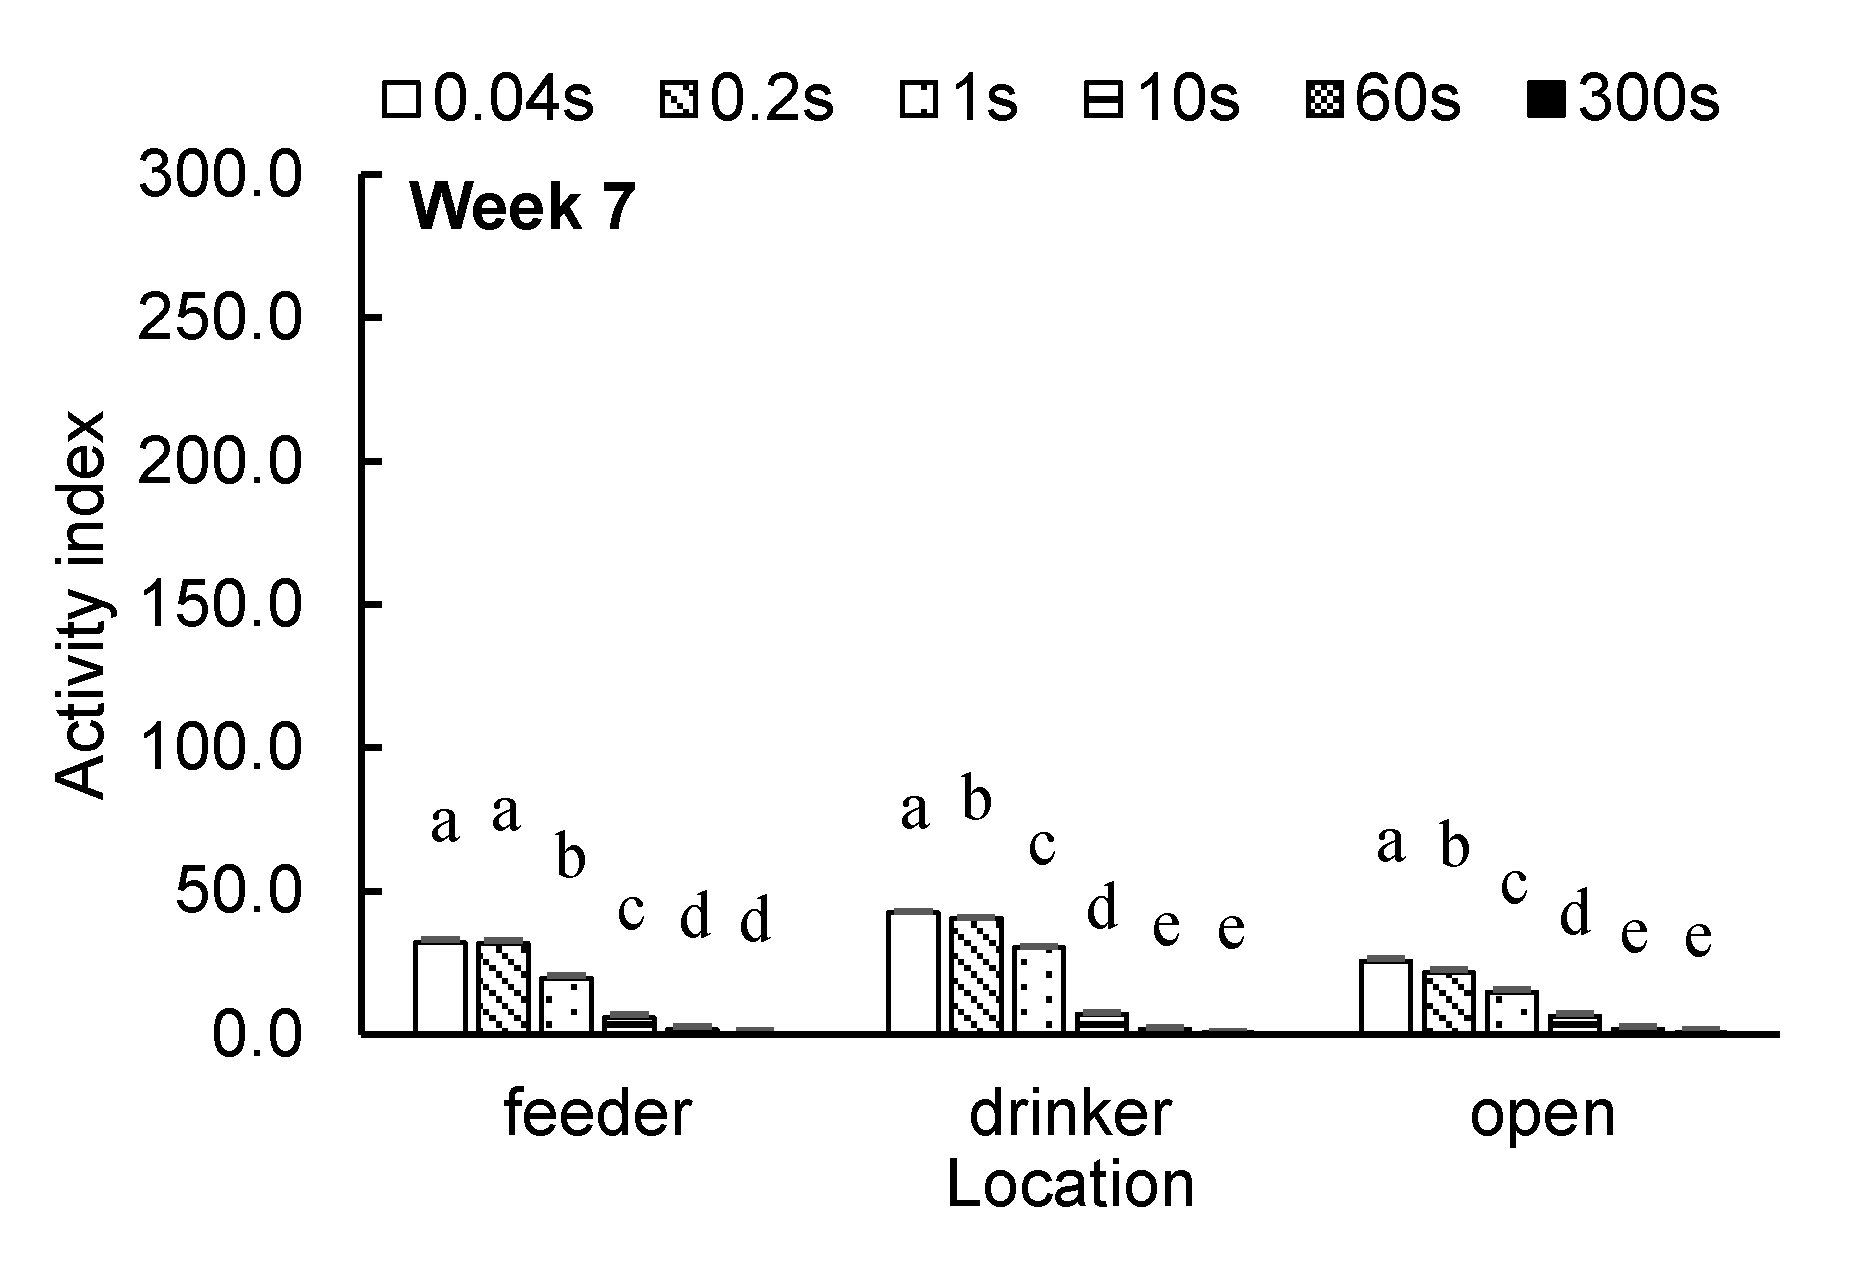
3.1. Time Interval
3.2. Age and Location
3.3. Time of Day
3.4. Selection for Proper Time Interval
4. Discussion
5. Conclusions
Author Contributions
Funding
Acknowledgments
Conflicts of Interest
References
- Bizeray, D.; Estevez, I.; Leterrier, C.; Faure, J.M. Influence of increased environmental complexity on leg condition, performance, and level of fearfulness in broilers. Poult. Sci. 2002, 81, 767–773. [Google Scholar] [CrossRef]
- Simsek, U.G.; Dalkilic, B.; Ciftci, M.; Cerci, I.H.; Bahşi, M. Effects of Enriched Housing Design on Broiler Performance, Welfare, Chicken Meat Composition and Serum Cholesterol. Acta Veter. Brno 2009, 78, 67–74. [Google Scholar] [CrossRef]
- Thorp, B.; Duff, S. Effect of exercise on the vascular pattern in the bone extremities of broiler fowl. Res. Veter. Sci. 1988, 45, 72–77. [Google Scholar] [CrossRef]
- Hester, P.Y. The Role of Environment and Management on Leg Abnormalities in Meat-Type Fowl. Poult. Sci. 1994, 73, 904–915. [Google Scholar] [CrossRef] [PubMed]
- Wilson, J.L.; Weaver, W.D.; Beane, W.L.; Cherry, J.A. Effects of Light and Feeding Space on Leg Abnormalities in Broilers. Poult. Sci. 1984, 63, 565–567. [Google Scholar] [CrossRef] [PubMed]
- Kaukonen, E.; Norring, M.; Valros, A. Effect of litter quality on foot pad dermatitis, hock burns and breast blisters in broiler breeders during the production period. Avian Pathol. 2016, 45, 667–673. [Google Scholar] [CrossRef] [PubMed]
- Shepherd, E.; Fairchild, B. Footpad Dermatitis in Poultry. Poult. Sci. 2010, 89, 2043–2051. [Google Scholar] [CrossRef]
- Haslam, S.; Knowles, T.; Brown, S.; Wilkins, L.; Kestin, S.; Warriss, P.; Nicol, C. Factors affecting the prevalence of foot pad dermatitis, hock burn and breast burn in broiler chicken. Br. Poult. Sci. 2007, 48, 264–275. [Google Scholar] [CrossRef]
- Bloemen, H.; Aerts, J.M.; Berckmans, D.; Goedseels, V. Image analysis to measure activity index of animals. Equine Veter. J. 2010, 29, 16–19. [Google Scholar] [CrossRef]
- Aydin, A.; Cangar, Ö.; Ozcan, S.E.; Bähr, C.; Berckmans, D. Application of a fully automatic analysis tool to assess the activity of broiler chickens with different gait scores. Comput. Electron. Agric. 2010, 73, 194–199. [Google Scholar] [CrossRef]
- Silvera, A.M.; Knowles, T.G.; Butterworth, A.; Berckmans, D.; Vranken, E.; Blokhuis, H. Lameness assessment with automatic monitoring of activity in commercial broiler flocks. Poult. Sci. 2017, 96, 2013–2017. [Google Scholar] [CrossRef] [PubMed]
- Yang, X.; Huo, X.; Li, G.; Purswell, J.L.; Tabler, T.; Chesser, D.; Zhao, Y. Application of Elevated Perching Platform and Robotic Vehicle in Broiler Production. In Proceedings of the ASABE Annual International Meeting, Boston, MA, USA, 7–10 July 2019. [Google Scholar] [CrossRef]
- Kristensen, H.; Aerts, J.; Leroy, T.; Wathes, C.; Berckmans, D. Modelling the dynamic activity of broiler chickens in response to step-wise changes in light intensity. Appl. Anim. Behav. Sci. 2006, 101, 125–143. [Google Scholar] [CrossRef]
- Neves, D.P.; Mehdizadeh, S.A.; Tscharke, M.; de Alencar Nääs, I.M.; Banhazi, T.M. Detection of flock movement and behaviour of broiler chickens at different feeders using image analysis. Inf. Process. Agric. 2015, 2, 177–182. [Google Scholar] [CrossRef]
- Dawkins, M.S.; Lee, H.-J.; Waitt, C.D.; Roberts, S.J. Optical flow patterns in broiler chicken flocks as automated measures of behaviour and gait. Appl. Anim. Behav. Sci. 2009, 119, 203–209. [Google Scholar] [CrossRef]
- Bessei, W. Welfare of broilers: A review. World’s Poult. Sci. J. 2006, 62, 455–466. [Google Scholar] [CrossRef]
- Arnould, C.; Faure, J.M. Use of pen space and activity of broiler chickens reared at two different densities. Appl. Anim. Behav. Sci. 2003, 84, 281–296. [Google Scholar] [CrossRef]
- Kristensen, H.H.; Cornou, C. Automatic detection of deviations in activity levels in groups of broiler chickens—A pilot study. Biosyst. Eng. 2011, 109, 369–376. [Google Scholar] [CrossRef]
- Poursaberi, A.; Bähr, C.; Pluk, A.; Van Nuffel, A.; Berckmans, D. Real-time automatic lameness detection based on back posture extraction in dairy cattle: Shape analysis of cow with image processing techniques. Comput. Electron. Agric. 2010, 74, 110–119. [Google Scholar] [CrossRef]
- Kashiha, M.A.; Bahr, C.; Ott, S.; Moons, C.P.; Niewold, T.; Tuyttens, F.A.; Berckmans, D. Automatic monitoring of pig locomotion using image analysis. Livest. Sci. 2014, 159, 141–148. [Google Scholar] [CrossRef]
- Chapinal, N.; De Passillé, A.; Weary, D.; Von Keyserlingk, M.; Rushen, J. Using gait score, walking speed, and lying behavior to detect hoof lesions in dairy cows. J. Dairy Sci. 2009, 92, 4365–4374. [Google Scholar] [CrossRef]
- Von Wachenfelt, H.; Pinzke, S.; Nilsson, C. Gait and force analysis of provoked pig gait on clean and fouled concrete surfaces. Biosyst. Eng. 2009, 104, 534–544. [Google Scholar] [CrossRef]
- Tickle, P.G.; Hutchinson, J.R.; Codd, J. Energy allocation and behaviour in the growing broiler chicken. Sci. Rep. 2018, 8, 4562. [Google Scholar] [CrossRef]
- Alvino, G.; Archer, G.; Mench, J. Behavioural time budgets of broiler chickens reared in varying light intensities. Appl. Anim. Behav. Sci. 2009, 118, 54–61. [Google Scholar] [CrossRef]
- Bizeray, D.; Leterrier, C.; Constantin, P.; Picard, M.; Faure, J. Early locomotor behaviour in genetic stocks of chickens with different growth rates. Appl. Anim. Behav. Sci. 2000, 68, 231–242. [Google Scholar] [CrossRef]
- EFSA. Scientific Opinion on the influence of genetic parameters on the welfare and the resistance to stress of commercial broilers. EFSA J. 2010, 8, 1666. [Google Scholar] [CrossRef]
- Bruno, L.; Maiorka, A.; Macari, M.; Furlan, R.; Givisiez, P. Water intake behavior of broiler chickens exposed to heat stress and drinking from bell or and nipple drinkers. Rev. Bras. Ciênc. Avíc. 2011, 13, 147–152. [Google Scholar] [CrossRef]
- Kristensen, H.H.; Prescott, N.B.; Perry, G.C.; Ladewig, J.; Ersbøll, A.K.; Overvad, K.C.; Wathes, C.M. The behaviour of broiler chickens in different light sources and illuminances. Appl. Anim. Behav. Sci. 2007, 103, 75–89. [Google Scholar] [CrossRef]
- Svihus, B.; Lund, V.; Borjgen, B.; Bedford, M.; Bakken, M. Effect of intermittent feeding, structural components and phytase on performance and behaviour of broiler chickens. Br. Poult. Sci. 2013, 54, 222–230. [Google Scholar] [CrossRef]
- Baxter, M.; Bailie, C.L.; O’Connell, N. Play behaviour, fear responses and activity levels in commercial broiler chickens provided with preferred environmental enrichments. Animal 2018, 13, 171–179. [Google Scholar] [CrossRef]
- Weeks, C.; Danbury, T.; Davies, H.; Hunt, P.; Kestin, S. The behaviour of broiler chickens and its modification by lameness. Appl. Anim. Behav. Sci. 2000, 67, 111–125. [Google Scholar] [CrossRef]
- Bai, S.P.; Wu, A.M.; Ding, X.M.; Lei, Y.; Bai, J.; Zhang, K.Y.; Chio, J.S. Effects of probiotic-supplemented diets on growth performance and intestinal immune characteristics of broiler chickens. Poult. Sci. 2013, 92, 663–670. [Google Scholar] [CrossRef] [PubMed]
- Sultana, S.; Hassan, R.; Choe, H.S.; Ryu, K.S. The Effect of Monochromatic and Mixed LED Light Colour on the Behaviour and Fear Responses of Broiler Chicken. Avian Boil. Res. 2013, 6, 207–214. [Google Scholar] [CrossRef]
- Ventura, B.A.; Siewerdt, F.; Estevez, I. Access to Barrier Perches Improves Behavior Repertoire in Broilers. PLoS ONE 2012, 7, e29826. [Google Scholar] [CrossRef]
- Hocking, P.M.; Rutherford, K.M.D.; Picard, M. Comparison of time-based frequencies, fractal analysis and T-patterns for assessing behavioural changes in broiler breeders fed on two diets at two levels of feed restriction: A case study. Appl. Anim. Behav. Sci. 2007, 104, 37–48. [Google Scholar] [CrossRef]
- Bizeray, D.; Estevez, I.; Leterrier, C.; Faure, J. Effects of increasing environmental complexity on the physical activity of broiler chickens. Appl. Anim. Behav. Sci. 2002, 79, 27–41. [Google Scholar] [CrossRef]
- Li, G.; Zhao, Y.; Purswell, J.L.; Liang, Y.; Lowe, J.W. Feeding Behaviors of Broilers at Chicken-perceived vs. Human-perceived Light Intensities under Two Light Spectrums. In Proceedings of the ASABE Annual International Meeting, Detroit, MI, USA, 29 July–1 August 2018. [Google Scholar] [CrossRef]
- Rodrigues, I.; Choct, M. Feed intake pattern of broiler chickens under intermittent lighting: Do birds eat in the dark? Anim. Nutr. 2018, 5, 174–178. [Google Scholar] [CrossRef]
- Stahlbaum, C.C.; Rovee-Collier, C.; Fagen, J.W.; Collier, G. Twilight activity and antipredator behavior of young fowl housed in artificial or natural light. Physiol. Behav. 1986, 36, 751–758. [Google Scholar] [CrossRef]
- Xin, H.; Berry, I.; Barton, T.L.; Tabler, G.T. Feeding and Drinking Patterns of Broilers Subjected to Different Feeding and Lighting Programs. J. Appl. Poult. Res. 1993, 2, 365–372. [Google Scholar] [CrossRef]
- Schwean-Lardner, K.; Fancher, B.; Laarveld, B.; Classen, H. Effect of day length on flock behavioural patterns and melatonin rhythms in broilers. Br. Poult. Sci. 2014, 55, 21–30. [Google Scholar] [CrossRef]
- Sherlock, L.; Demmers, T.; Goodship, A.; McCarthy, I.; Wathes, C. The relationship between physical activity and leg health in the broiler chicken. Br. Poult. Sci. 2010, 51, 22–30. [Google Scholar] [CrossRef]


| Time Interval (s) | Location | |||||
|---|---|---|---|---|---|---|
| Feeder | Drinker | Open Area | ||||
| AI | Ratio (%) | AI | Ratio (%) | AI | Ratio (%) | |
| 0.04 | 38.8 a | 100 | 42.5 a | 100 | 81.2 a | 100 |
| 0.2 | 38.5 a | 100 | 41.7 a | 100 | 58.0 ab | 84 |
| 1 | 27.3 b | 74 | 31.1 b | 92 | 34.3 bc | 56 |
| 10 | 8.0 c | 21 | 11.7 c | 32 | 20.1 cd | 27 |
| 60 | 2.3 cd | 6 | 4.9 cd | 12 | 10.2 cd | 13 |
| 300 | 0.6 d | 1 | 0.9 d | 2 | 1.7 d | 2 |
| SEM | 3.1 | 2 | 5.4 | 4 | 13.4 | 3 |
| Bird Age (Week) | Location | |||
|---|---|---|---|---|
| Feeder | Drinker | Open | SEM 1 | |
| 1 | -- | 83.2 Ba | 232.5 Aa | 39.7 |
| 2 | -- | 74.1 Ba | 137.2 Ab | 13.0 |
| 3 | 64.5 Ba | 28.9 Cbc | 95.8 Ab | 7.2 |
| 4 | 28.6 Ac | 16.5 Bc | 32.6 Ac | 1.9 |
| 5 | 37.8 Ab | 20.7 Bc | 21.6 Bc | 1.7 |
| 6 | 30.9 Ac | 31.5 Abc | 23.1 Bc | 1.6 |
| 7 | 31.9 Bbc | 42.4 Ab | 25.5 Cc | 1.8 |
| SEM 2 | 2.1 | 6.1 | 14.8 | -- |
| Bird Age (Week) | Location | |||||||||||
|---|---|---|---|---|---|---|---|---|---|---|---|---|
| Feeder | Drinker | Open | ||||||||||
| 06:00 | 12:00 | 18:00 | SEM | 06:00 | 12:00 | 18:00 | SEM | 06:00 | 12:00 | 18:00 | SEM | |
| 1 | -- | -- | -- | -- | 43.7 B | 136.3 A | 69.5 B | 21.0 | 179.0 | 384.9 | 133.7 | 91.0 |
| 2 | -- | -- | -- | -- | 46.0 B | 97.6 A | 78.7 AB | 11.4 | 91.7 | 159.0 | 160.7 | 28.3 |
| 3 | 60.2 | 64.0 | 69.2 | 6.4 | 31.6 A | 35.9 A | 19.1 B | 3.1 | 98.8 | 85.9 | 102.6 | 20.8 |
| 4 | 24.3 | 30.5 | 31.1 | 2.6 | 6.1 C | 19.6 B | 23.8 A | 1.3 | 22.5 B | 42.3 A | 32.9 AB | 3.7 |
| 5 | 43.4 A | 31.7 B | 38.3 AB | 2.3 | 18.7 | 19.1 | 24.2 | 3.1 | 18.5 | 26.3 | 20.0 | 3.2 |
| 6 | 28.8 B | 28.2 B | 35.7 A | 2.2 | 25.1 B | 31.8 AB | 37.8 A | 2.9 | 17.3 B | 29.1 A | 22.8 AB | 2.5 |
| 7 | 28.9 | 32.2 | 34.6 | 2.8 | 41.3 | 44.2 | 41.7 | 3.2 | 28.7 | 23.6 | 24.1 | 3.5 |
© 2020 by the authors. Licensee MDPI, Basel, Switzerland. This article is an open access article distributed under the terms and conditions of the Creative Commons Attribution (CC BY) license (http://creativecommons.org/licenses/by/4.0/).
Share and Cite
Yang, X.; Zhao, Y.; Tabler, G.T. Accuracy of Broiler Activity Index as Affected by Sampling Time Interval. Animals 2020, 10, 1102. https://doi.org/10.3390/ani10061102
Yang X, Zhao Y, Tabler GT. Accuracy of Broiler Activity Index as Affected by Sampling Time Interval. Animals. 2020; 10(6):1102. https://doi.org/10.3390/ani10061102
Chicago/Turabian StyleYang, Xiao, Yang Zhao, and George T. Tabler. 2020. "Accuracy of Broiler Activity Index as Affected by Sampling Time Interval" Animals 10, no. 6: 1102. https://doi.org/10.3390/ani10061102
APA StyleYang, X., Zhao, Y., & Tabler, G. T. (2020). Accuracy of Broiler Activity Index as Affected by Sampling Time Interval. Animals, 10(6), 1102. https://doi.org/10.3390/ani10061102