Body Size and Bite Force of Stray and Feral Cats—Are Bigger or Older Cats Taking the Largest or More Difficult-to-Handle Prey?


Simple Summary
Abstract
1. Introduction
2. Methods
2.1. Specimens
- Rural: feral cats were trapped and then shot as part of conservation management activities focused around habitats of threatened species (i.e., bushland reserves) or shot while free-roaming on private pastoral properties. These cats live and bre beyond the periphery of dense human settlements and survive independently (i.e., were not fed by people). We did not include animals that had been trapped from around rural refuse sites, as these cats were subsidised to a large extent by human refuse [26].
- Urban: stray cats were identified as unowned (‘semi-feral’) cats trapped in urban and peri-urban residential areas, the premises of private and commercial businesses, private small-holdings and fragmented bush reserves within and on the immediate periphery of the metropolitan area (Perth, Western Australia). Enforced from 2013, the Western Australia Cat Act 2011 requires that, by the age of 6 months, all pet cats must be: (1) desexed, (2) microchipped with sub-dermal ID tag, (3) registered with a local municipal council and (4) wearing a collar with ID and registration tags. Any cat not identifiable as an owned pet trapped within an urban/peri-urban area because of nuisance or welfare concerns, and/or surrendered to a shelter, is therefore considered a stray cat. These stray cats are generally rehomed but may be euthanised if their temperament is not suitable for rehoming. Our stray cats were neither pets nor suitable for rehoming.
2.2. Diet Analysis
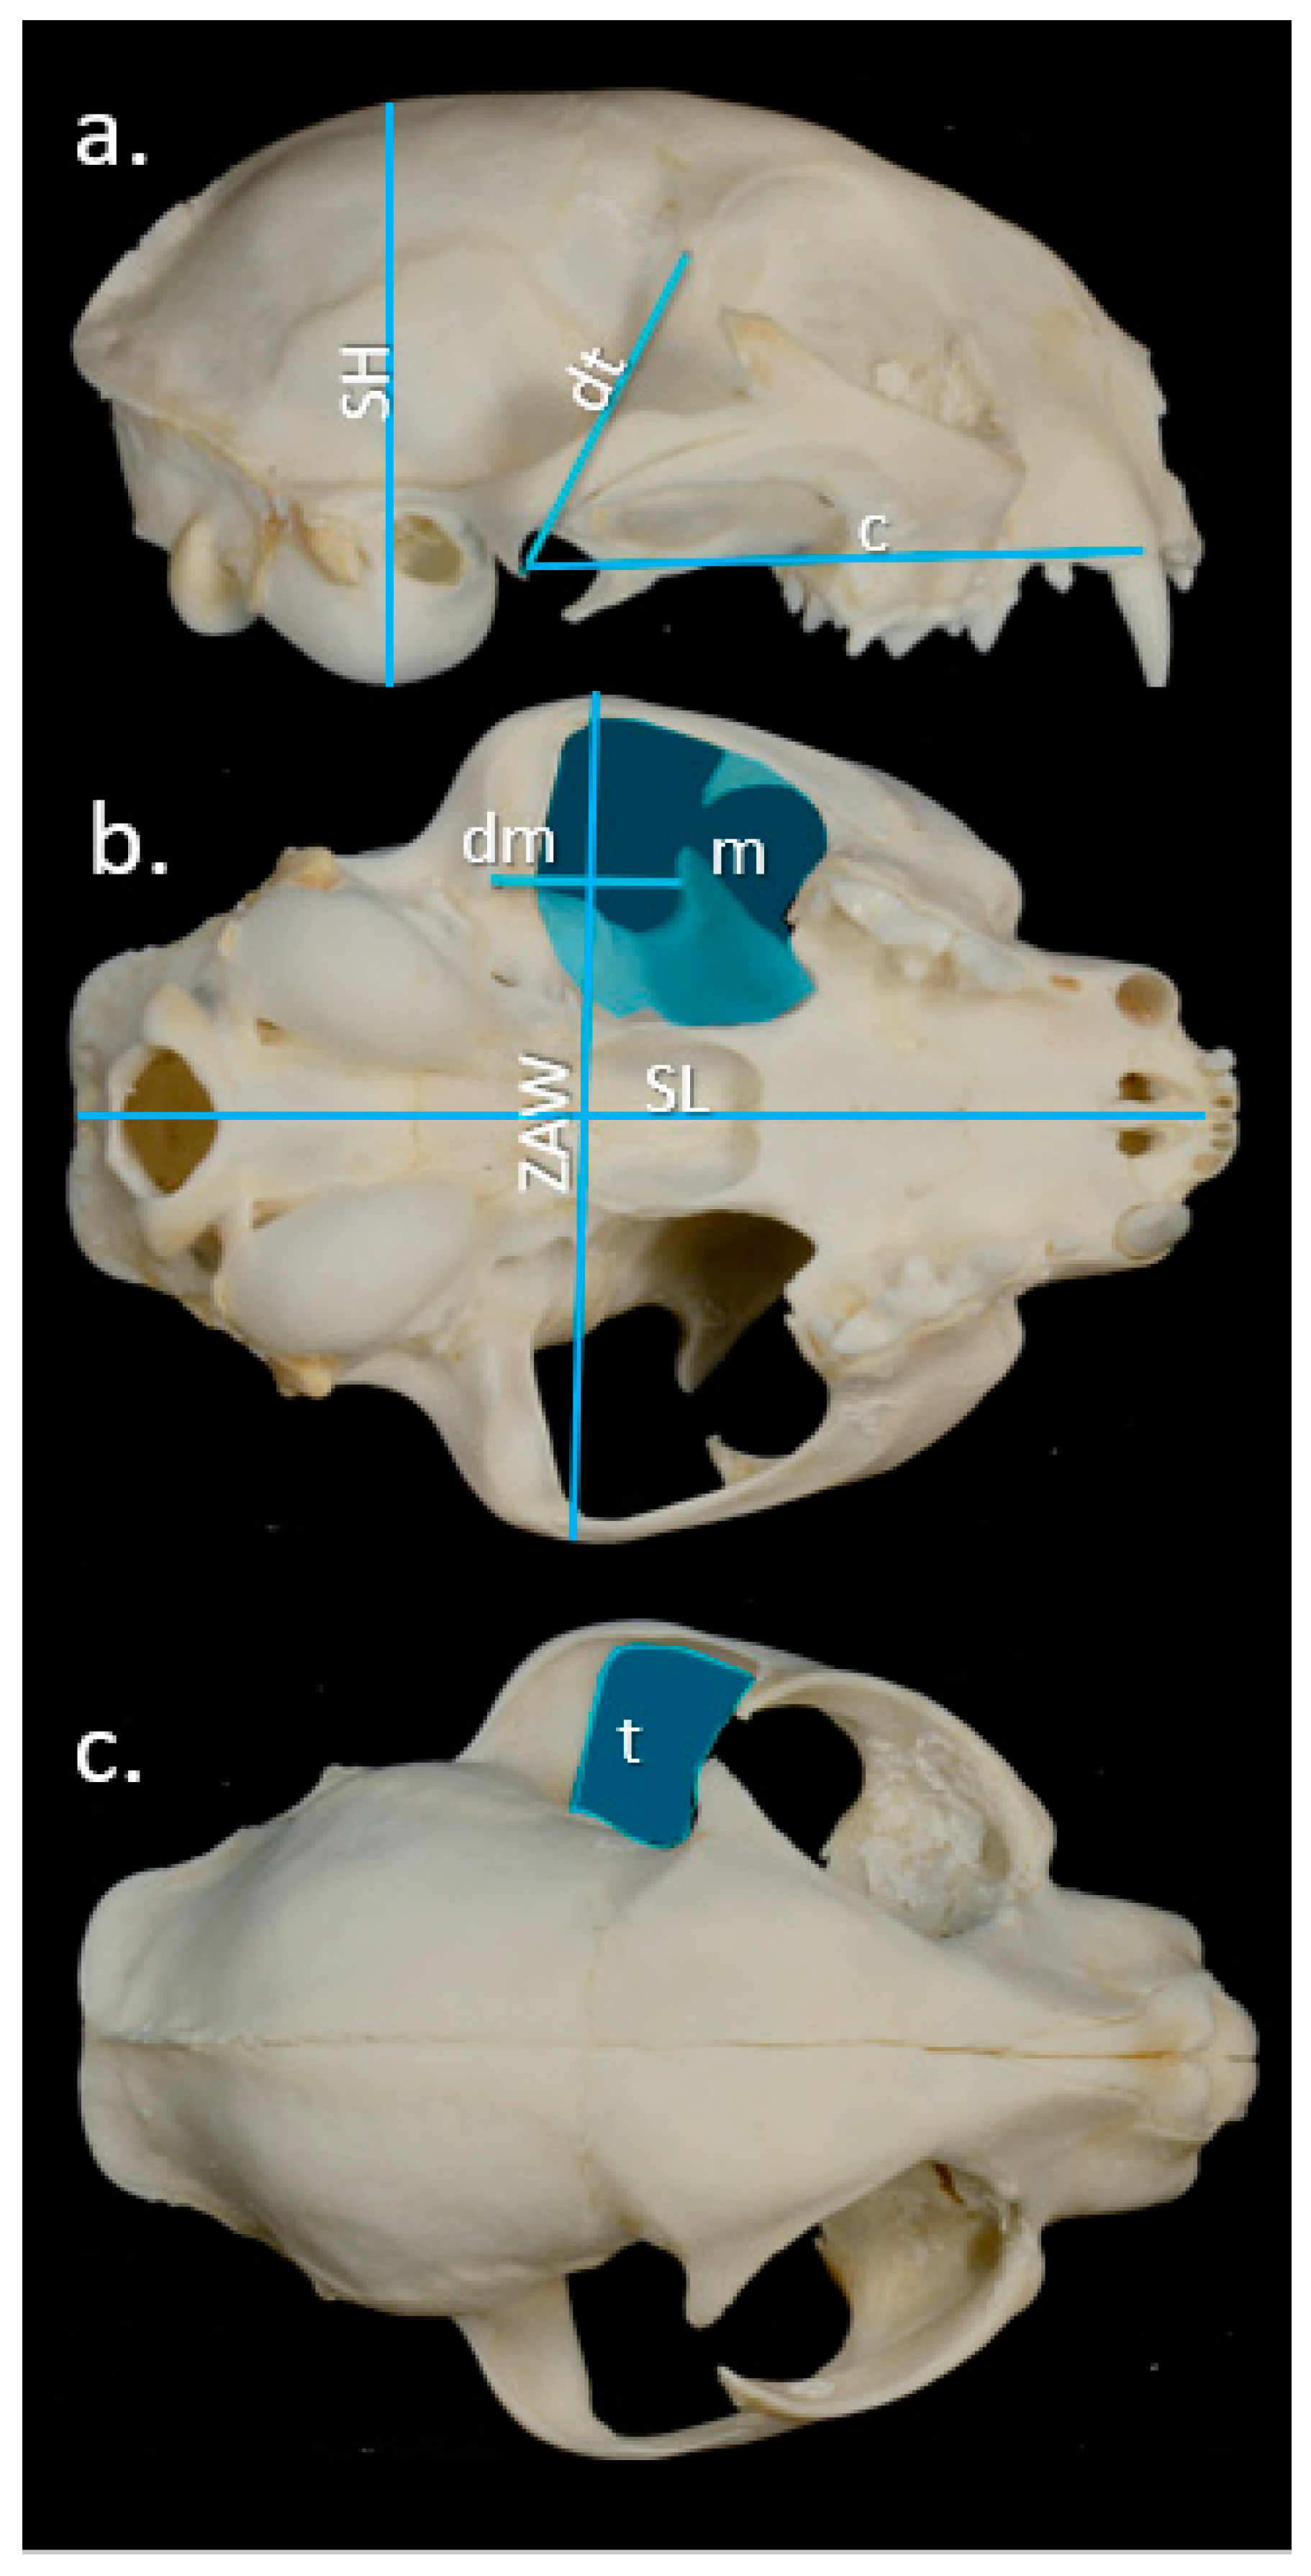
2.3. Bite Force
2.4. Statistical Analyses
3. Results
3.1. Demographics
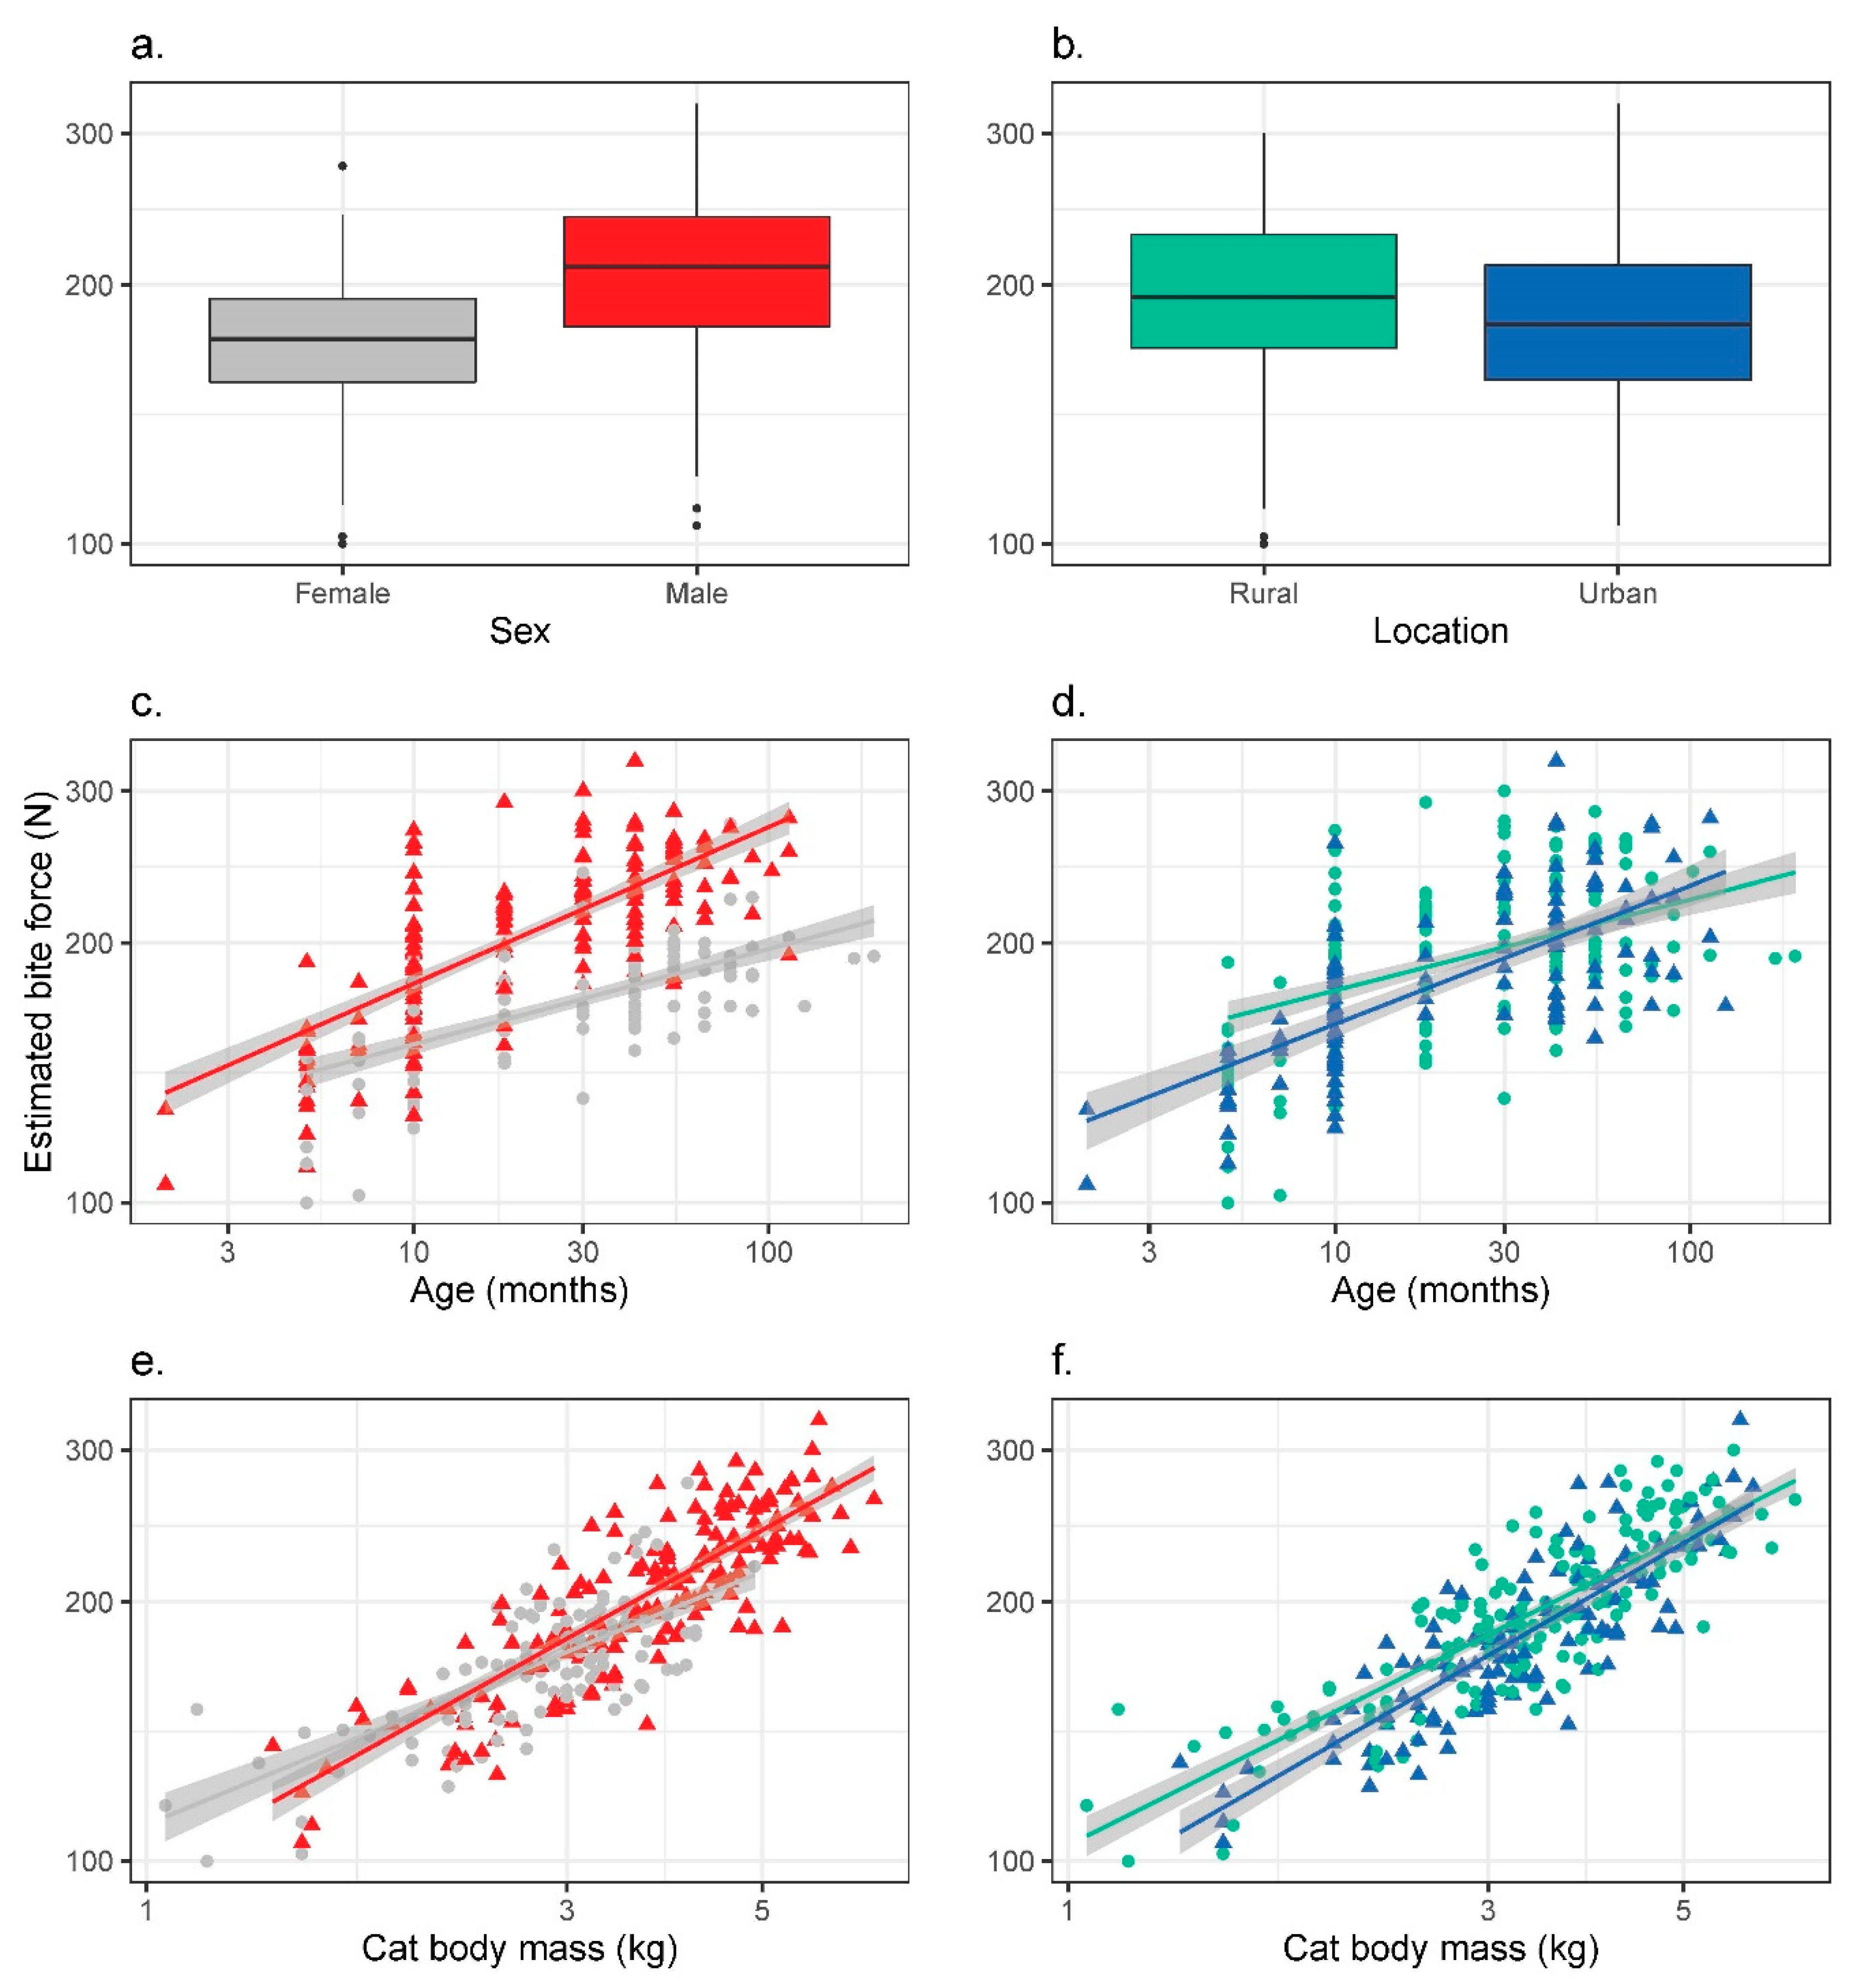
3.2. Bite Force
3.3. Diet Composition
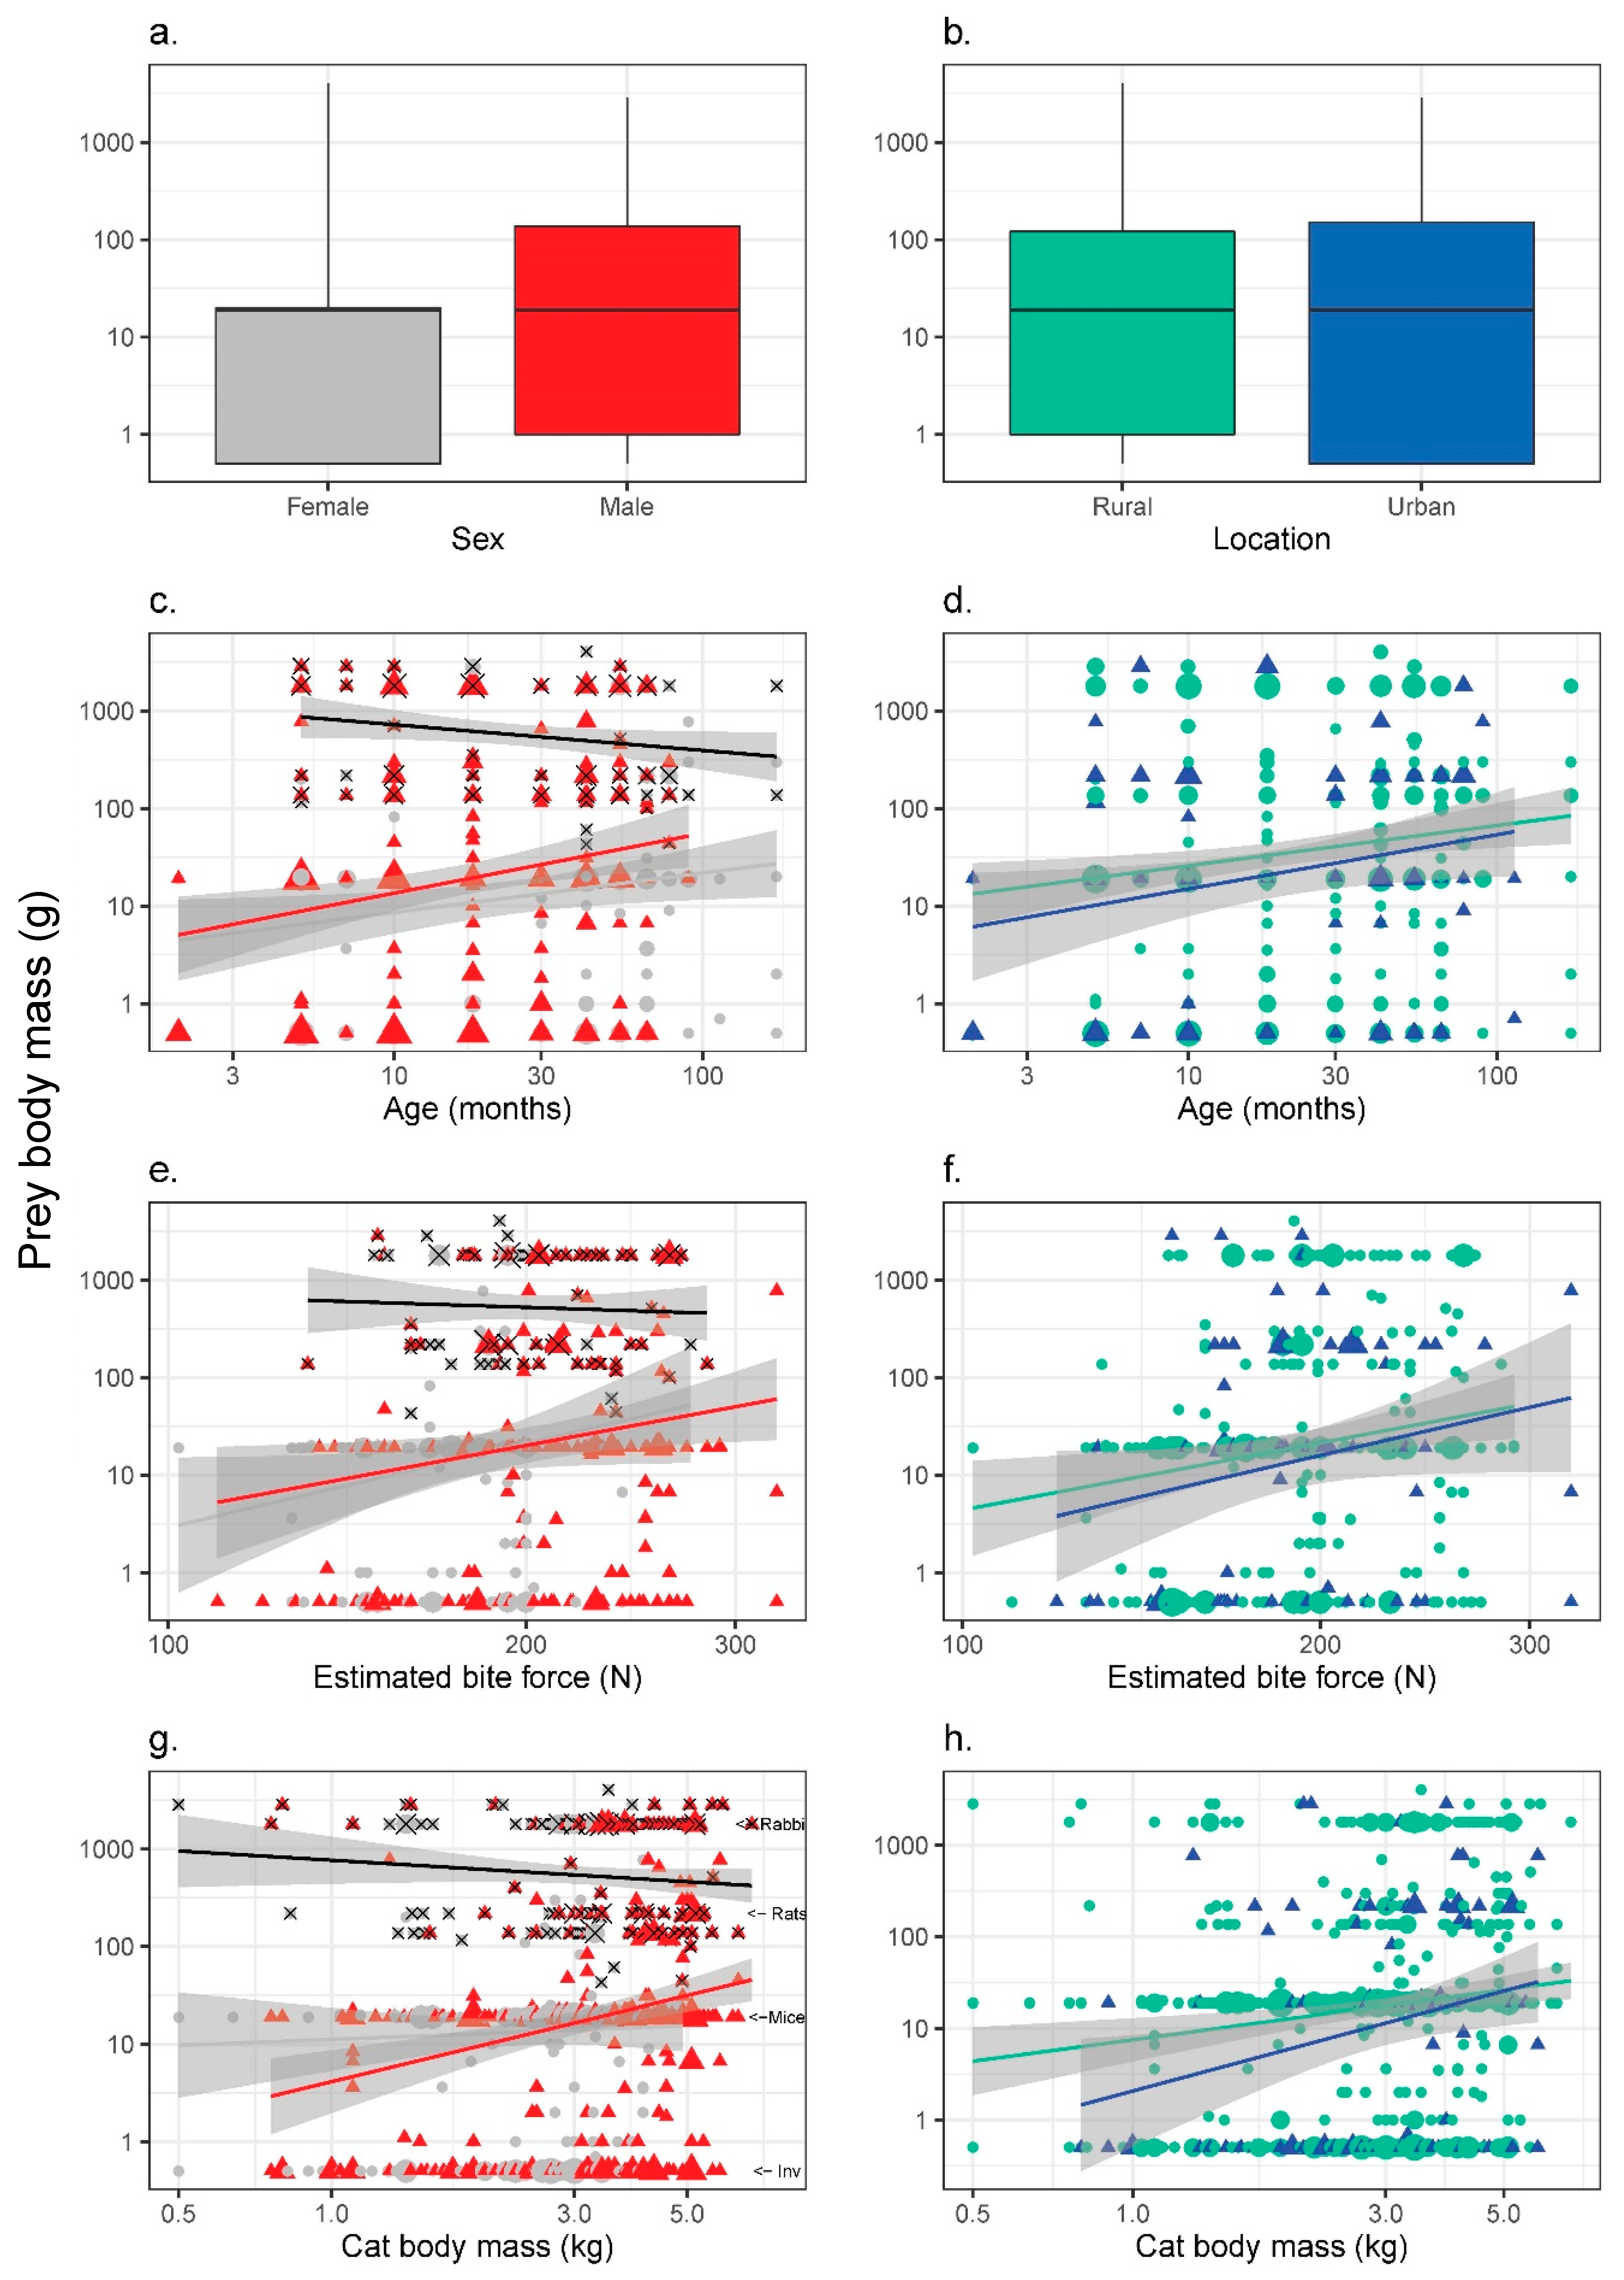
3.4. Prey Size (Average Body Mass for Each Prey Category)
4. Discussion
4.1. Bite Force Anatomy
4.2. Diet Composition
4.3. Prey Size
4.4. Other Considerations—Bite Force and Fighting/Territorial Mating Behaviour
4.5. Limitations of This Study
5. Conclusions
Supplementary Materials
Author Contributions
Funding
Acknowledgments
Conflicts of Interest
References
- Legge, S.; Murphy, B.P.; McGregor, H.; Woinarski, J.C.Z.; Augusteyn, J.; Ballard, G.; Baseler, M.; Buckmaster, T.; Dickman, C.R.; Doherty, T. Enumerating a continental-scale threat: How many feral cats are in Australia? Biol. Conserv. 2017, 206, 293–303. [Google Scholar] [CrossRef]
- Commonwealth of Australia. Background Document for the Threat Abatement Plan for Predation by Feral Cats; Department of the Environment, Australian Government: Canberra, Australia, 2015.
- Woinarski, J.C.Z.; Burbidge, A.A.; Harrison, P.L. Ongoing unraveling of a continental fauna: Decline and extinction of Australian mammals since European settlement. PNAS 2015, 112, 4531–4540. [Google Scholar] [CrossRef]
- Burbidge, A.A.; McKenzie, N.L. Patterns in the modern decline of Western Australia’s vertebrate fauna: Causes and conservation implications. Biol. Conserv. 1989, 50, 143–198. [Google Scholar] [CrossRef]
- Radford, J.Q.; Woinarski, J.C.Z.; Legge, S.; Baseler, M.; Bentley, J.; Burbidge, A.A.; Bode, M.; Copley, P.; Dexter, N.; Dickman, C.R.; et al. Degrees of population-level susceptibility of Australian terrestrial non-volant mammal species to predation by the introduced red fox (Vulpes vulpes) and feral cat (Felis catus). J. Wildl. Res. 2018, 45, 645–657. [Google Scholar] [CrossRef]
- Johnson, C.N.; Isaac, J.L. Body mass and extinction risk in Australian marsupials: The ‘Critical Weight Range’ revisited. Austral Ecol. 2009, 34, 35–40. [Google Scholar] [CrossRef]
- Dickman, C.R. Overview of the Impacts of Feral Cats on Australian Native Fauna; 0642213798; Australian Nature Conservation Agency: Canberra, Australia, 1996.
- Smith, A.P.; Quin, D.G. Patterns and causes of extinction and decline in Australian conilurine rodents. Biol. Conserv. 1996, 77, 243–267. [Google Scholar] [CrossRef]
- EPBC. Species Profile and Threats Database: Listed Key Threatening Processes; Australian Government Department of the Environment and Energy: Canberra, Australia, 2019.
- Woinarski, J.C.Z.; Burbidge, A.A.; Harrison, P.L. The Action Plan for Australian Mammals 2012; CSIRO Publishing: Collingwood, Victoria, 2014. [Google Scholar]
- Doherty, T.S.; Davis, R.A.; Etten, E.J.B.; Algar, D.; Collier, N.; Dickman, C.R.; Edwards, G.; Masters, P.; Palmer, R.; Robinson, S. A continental-scale analysis of feral cat diet in Australia. J. Biogeogr. 2015, 42, 964–975. [Google Scholar] [CrossRef]
- Pitakarnnop, T.; Buddhachat, K.; Euppayo, T.; Kriangwanich, W.; Nganvongpanit, K. Feline (Felis catus) skull and pelvic morphology and morphometry: Gender-related difference? Anat. Histol. Embryol. 2017, 46, 294–303. [Google Scholar] [CrossRef]
- Denny, E. Cat Felis catus. In The Mammals of Australia, 3rd ed.; Van Dyck, S., Strahan, R., Eds.; Reed New Holland: Sydney, Australia, 2008; pp. 742–744. [Google Scholar]
- Litvaitis, J.A.; Stevens, C.L.; Mautz, W.W. Age, sex, and weight of bobcats in relation to winter diet. J. Wildl. Manag. 1984, 48, 632–635. [Google Scholar] [CrossRef]
- Litvaitis, J.A.; Clark, A.G.; Hunt, J.H. Prey selection and fat deposits of bobcats (Felis rufus) during autumn and winter in Maine. J. Mammal. 1986, 67, 389–392. [Google Scholar] [CrossRef]
- Bateman, P.W.; Fleming, P.A. Big city life: Carnivores in urban environments. J. Zool. Lond. 2012, 287, 1–23. [Google Scholar] [CrossRef]
- Moseby, K.E.; Peacock, D.E.; Read, J.L. Catastrophic cat predation: A call for predator profiling in wildlife protection programs. Biol. Conserv. 2015, 191, 331–340. [Google Scholar] [CrossRef]
- Christiansen, P.; Wroe, S. Bite forces and evolutionary adaptations to feeding ecology in carnivores. Ecology 2007, 88, 347–358. [Google Scholar] [CrossRef]
- Therrien, F. Feeding behaviour and bite force of sabretoothed predators. Zool. J. Linn. Soc. 2005, 145, 393–426. [Google Scholar] [CrossRef]
- Baerends-van Roon, J.M.; Baerends, G.P. The Morphogenesis of the Behaviour of the Domestic Cat, with a Special Emphasis on the Development of Prey-Catching; North-Holland Publishing Company: Amsterdam, The Netherlands, 1979; p. 72. [Google Scholar]
- Dickman, C.R.; Newsome, T.M. Individual hunting behaviour and prey specialisation in the house cat Felis catus: Implications for conservation and management. Appl. Anim. Behav. Sci. 2015, 173, 76–87. [Google Scholar] [CrossRef]
- Tabor, R. Cat Behaviour; The Bath Press for David and Charles: Devon, UK, 1997. [Google Scholar]
- Kiltie, R.A. Size ratios among sympatric neotropical cats. Oecologia 1984, 61, 411–416. [Google Scholar] [CrossRef]
- Thomason, J.J. Cranial strength in relation to estimated biting forces in some mammals. Can. J. Zool. 1991, 69, 2326–2333. [Google Scholar] [CrossRef]
- Forbes-Harper, J.L.; Crawford, H.M.; Dundas, S.J.; Warburton, N.M.; Adams, P.J.; Bateman, P.W.; Calver, M.C.; Fleming, P.A. Diet and bite force in red foxes: Ontogenetic and sex differences in an invasive carnivore. J. Zool. 2017, 303, 54–63. [Google Scholar] [CrossRef]
- Crawford, H.M.; Calver, M.C.; Fleming, P.A. Subsidised by junk foods: Factors influencing body condition in stray cats (Felis catus). J. Urban Ecol. 2020, in press. [Google Scholar] [CrossRef]
- Brunner, H.; Triggs, B. Hair ID: An Interactive Tool for Identifying Australian Mammalian Hair; Ecobyte Pty Ltd., Ed.; CSIRO Publishing: Collingwood, Australia, 2002. [Google Scholar]
- Van Dyck, S.; Strahan, R. The Mammals of Australia, 3rd ed.; Reed New Holland: Sydney, Australia, 2008. [Google Scholar]
- WA Museum. Checklist of the Terrestrial Vertebrate Fauna of Western Australia; Western Australian Museum: Perth, Australia, 2019.
- Grue, H.; Jensen, B. Review of the formation of incremental lines in tooth cementum of terrestrial mammals. Dan. Rev. Game Biol. 1979, 11, 1–48. [Google Scholar]
- Damasceno, E.M.; Hingst-Zaher, E.; Astua, D. Bite force and encephalization in the Canidae (Mammalia: Carnivora). J. Zool. Lond. 2013, 290, 246–254. [Google Scholar] [CrossRef]
- Sakamoto, M.; Lloyd, G.T.; Benton, M.J. Phylogenetically structured variance in felid bite force: The role of phylogeny in the evolution of biting performance. J. Evol. Biol. 2010, 23, 463–478. [Google Scholar] [CrossRef] [PubMed]
- Statsoft Inc. Statistica (Data Analysis Software System); Version 8.0; Statsoft Inc.: Tulsa, OK, USA, 2007. [Google Scholar]
- R Core Team. R: A Language and Environment for Statistical Computing; R Foundation for Statistical Computing: Vienna, Austria, 2010. [Google Scholar]
- Burnham, K.P.; Anderson, D.R. Model Selection and Multimodal Inference: A Practical Information-Theoretic Approach, 2nd ed.; Springer: New York, NY, USA, 2002. [Google Scholar]
- Grueber, C.E.; Nakagawa, S.; Laws, R.J.; Jamieson, I.G. Multimodel inference in ecology and evolution: Challenges and solutions. J. Evol. Biol. 2011, 24, 699–711. [Google Scholar] [CrossRef] [PubMed]
- Oksanen, J.; Blanchet, F.G.; Kindt, R.; Legendre, P.; Minchin, P.R.; O’hara, R.; Simpson, G.L.; Solymos, P.; Stevens, M.H.H.; Wagner, H. Package ‘Vegan’. Community Ecology Package, R package version 2; R Foundation for Statistical Computing: Vienna, Austria, 2013; Volume 2, pp. 1–295. [Google Scholar]
- R Development Core Team. R: A Language and Environment for Statistical Computing; R Foundation for Statistical Computing: Vienna, Austria, 2017. [Google Scholar]
- Bradshaw, J.W.S.; Casey, R.A.; Brown, S.L. Hunting and Predation. In The Behaviour of the Domestic Cat, 2nd ed.; CABI Publishers: Oxfordshire, UK, 2012; pp. 128–141. [Google Scholar]
- Sicuro, F.L.; Oliveira, L.F.B. Skull morphology and functionality of extant Felidae (Mammalia: Carnivora): A phylogenetic and evolutionary perspective. Zool. J. Linn. Soc. 2011, 161, 414–462. [Google Scholar] [CrossRef]
- Piras, P.; Maiorino, L.; Teresi, L.; Meloro, C.; Lucci, F.; Kotsakis, T.; Raia, P. Bite of the cats: Relationships between functional integration and mechanical performance as revealed by mandible geometry. Syst. Biol. 2013, 62, 878–900. [Google Scholar] [CrossRef]
- Attard, M.R.G.; Chamoli, U.; Ferrara, T.L.; Rogers, T.L.; Wroe, S. Skull mechanics and implications for feeding behaviour in a large marsupial carnivore guild: The thylacine, Tasmanian devil and spotted-tailed quoll. J. Zool. 2011, 285, 292–300. [Google Scholar] [CrossRef]
- Read, J.; Bowen, Z. Population dynamics, diet and aspects of the biology of feral cats and foxes in arid South Australia. Wildl. Res. 2001, 28, 195–203. [Google Scholar] [CrossRef]
- Read, J.L.; Dagg, E.; Moseby, K.E. Prey selectivity by feral cats at central Australian rock-wallaby colonies. Aust. Mammal. 2019, 41, 132–141. [Google Scholar] [CrossRef]
- Jones, E.; Coman, B.J. Ecology of the feral cat, Felis catus (L.), in south-eastern Australia II.* Reproduction. Wildl. Res. 1982, 9, 111–119. [Google Scholar] [CrossRef]
- Naish, D. Williams and Lang’s Australian Big Cats: Do Pumas, Giant Feral Cats and Mystery Marsupials Stalk the Australian Outback? Available online: https://blogs.scientificamerican.com/tetrapod-zoology/williams-and-langs-australian-big-cats/ (accessed on 15 January 2020).
- Williams, M.; Lang, R. Australian Big Cats: An Unnatural History of Panthers; Strange Nation: Hazelbrook, Australia, 2010; p. 437. ISBN 978-0-646-53007-9. [Google Scholar]
- Dickman, C.R.; Legge, S.M.; Woinarski, J.C.Z. Assessing risks to wildlife from free-roaming hybrid cats: The proposed introduction of pet Savannah cats to Australia as a case study. Animals 2019, 9, 795. [Google Scholar] [CrossRef] [PubMed]
- Markula, A.; Hannan-Jones, M.; Csurhes, S. Serval Hybrids; Hybrids of Leptailurus serval (serval) and Felis catus (Domestic cat), Including the ‘Savannah cat’; Department of Agriculture and Fisheries, Biosecurity Queensland, Queensland Government: Brisbane, Australia, 2016.
- Geertsema, A.A. Aspects of the ecology of the serval Leptailurus serval in the Ngorongoro Crater, Tanzania. Neth. J. Zool. 1985, 35, 527–610. [Google Scholar] [CrossRef]
- Chazeau, C.; Marchal, J.; Hackert, R.; Perret, M.; Herrel, A. Proximate determinants of bite force capacity in the mouse lemur. J. Zool. Lond. 2013, 290, 42–48. [Google Scholar] [CrossRef]
- Binder, W.J.; Van Valkenburgh, B. Development of bite strength and feeding behaviour in juvenile spotted hyenas (Crocuta crocuta). J. Zool. 2000, 252, 273–283. [Google Scholar] [CrossRef]
- Risbey, D.A.; Calver, M.C.; Short, J. The impact of cats and foxes on the small vertebrate fauna of Heirisson Prong, Western Australia. I. Exploring potential impact using diet analysis. Wildl. Res. 1999, 26, 621–630. [Google Scholar]
- Izawa, M.; Doi, T.; Ono, Y. Grouping patterns of feral cats (Felis catus) living on a small island in Japan. Jpn. J. Ecol. 1982, 32, 373–382. [Google Scholar] [CrossRef]
- Brickner-Braun, I.; Geffen, E.; Yom-Tov, Y. The domestic cat as a predator of Israeli wildlife. Isr. J. Ecol. Evol. 2007, 53, 129–142. [Google Scholar] [CrossRef]
- Campos, C.B.; Esteves, C.F.; Ferraz, K.M.P.M.B.; Crawshaw, P.G.; Verdade, L.M. Diet of free-ranging cats and dogs in a suburban and rural environment, south-eastern Brazil. J. Zool. Proc. Zool. Soc. Lond. 2007, 273, 14–20. [Google Scholar] [CrossRef]
- Paltridge, R.; Gibson, D.; Edwards, G. Diet of the feral cat (Felis catus) in central Australia. Wildl. Res. 1997, 24, 67–76. [Google Scholar] [CrossRef]
- Pearre, S.; Maass, R. Trends in the prey size-based trophic niches of feral and house cats Felis catus L. Mammal Rev. 1998, 28, 125–139. [Google Scholar] [CrossRef]
- Leyhausen, P. Cat Behaviour: The Predatory and Social Behaviour of Domestic and Wild Cats; Garland STPM Press: New York, NY, USA, 1979. [Google Scholar]
- Childs, J.E. Size-dependent predation on rats (Rattus norvegicus) by house cats (Felis catus) in an urban setting. J. Mammal. 1986, 67, 196–199. [Google Scholar] [CrossRef]
- Glass, G.E.; Gardner-Santana, L.C.; Holt, R.D.; Chen, J.; Shields, T.M.; Roy, M.; Schachterle, S.; Klein, S.L. Trophic garnishes: Cat–rat interactions in an urban environment. PLoS ONE 2009, 4, e5794. [Google Scholar] [CrossRef]
- Williams, C.K.; Parer, I.; Coman, B.J.; Burley, J.; Braysher, M.L. Managing Vertebrate Pests: Rabbits; Bureau of Resource Sciences/CSIRO Division of Wildlife and Ecology, Australian Government Publishing Service: Canberra, Australia, 1995.
- Jones, E.; Coman, B.J. Ecology of the feral cat, Felis catus (L.), in south-eastern Australia I. Diet. Wildl. Res. 1981, 8, 537–547. [Google Scholar] [CrossRef]
- Catling, P.C. Similarities and contrasts in the diets of foxes, Vulpes vulpes, and cats, Felis catus, relative to fluctuating prey populations and drought. Aust. Wildl. Res. 1988, 15, 307–317. [Google Scholar] [CrossRef]
- Hart, S. The Diet of Foxes (Vulpes vulpes) and Feral cats (Felis catus) in the Flinders Ranges National Park, South Australia. Ph.D. Thesis, University of Adelaide, Adelaide, Australia, 1994. [Google Scholar]
- Grayson, J.; Calver, M.C. Regulation of domestic cat ownership to protect urban wildlife: A justification based on the precautionary principle. In Urban Wildlife: More Than Meets the Eye; Lunney, D., Burgin, S., Eds.; Royal Zoological Society of New South Wales: Mosman, Australia, 2004; pp. 169–178. [Google Scholar]
- Woinarski, J.C.Z.; Murphy, B.P.; Legge, S.M.; Garnett, S.T.; Lawes, M.J.; Comer, S.; Dickman, C.R.; Doherty, T.S.; Edwards, G.; Nankivell, A. How many birds are killed by cats in Australia? Biol. Conserv. 2017, 214, 76–87. [Google Scholar] [CrossRef]
- Woinarski, J.C.Z.; Woolley, L.A.; Garnett, S.T.; Legge, S.M.; Murphy, B.P.; Lawes, M.J.; Comer, S.; Dickman, C.R.; Doherty, T.S.; Edwards, G. Compilation and traits of Australian bird species killed by cats. Biol. Conserv. 2017, 216, 1–9. [Google Scholar] [CrossRef]
- Woinarski, J.C.Z.; Murphy, B.P.; Palmer, R.; Legge, S.M.; Dickman, C.R.; Doherty, T.S.; Edwards, G.; Nankivell, A.; Read, J.L.; Stokeld, D. How many reptiles are killed by cats in Australia? Wildl. Res. 2018, 45, 247–266. [Google Scholar] [CrossRef]
- McGregor, H.; Legge, S.; Jones, M.E.; Johnson, C.N. Feral cats are better killers in open habitats, revealed by animal-borne video. PLoS ONE 2015, 10, e0133915. [Google Scholar] [CrossRef]
- Bonnaud, E.; Medina, F.M.; Vidal, E.; Nogales, M.; Tershy, B.; Zavaleta, E.; Donlan, C.J.; Keitt, B.; Le Corre, M.; Horwath, S.V. The diet of feral cats on islands: A review and a call for more studies. Biol. Invasions 2011, 13, 581–603. [Google Scholar] [CrossRef]
- Woinarski, J.C.Z.; South, S.L.; Drummond, P.; Johnston, G.R.; Nankivell, A. The diet of the feral cat (Felis catus), red fox (Vulpes vulpes) and dog (Canis familiaris) over a three-year period at Witchelina Reserve, in arid South Australia. Aust. Mammal. 2018, 40, 204–213. [Google Scholar] [CrossRef]
- Brooks, S.J.; Calver, M.C.; Dickman, C.R.; Meathrel, C.E.; Bradley, J.S. Does intraspecific variation in the energy value of a prey species to its predators matter in studies of ecological energetics? A case study using insectivorous vertebrates. Ecoscience 1996, 3, 247–251. [Google Scholar]
- National Research Council. Nutrient Requirements of Cats. In Nutrient Requirements of Domestic Animals Revised Edition; National Academy Press: Washington DC, USA, 1986. [Google Scholar]
- Dell’Arte, G.L.; Leonardi, G. The feeding choice of the Red Fox (Vulpes vulpes) in a semi-arid fragmented landscape of North Africa in relation to water and energy contents of prey. Afr. J. Ecol. 2009, 47, 729–736. [Google Scholar]
- Downer, R.G.H.; Matthews, J.R. Patterns of lipid distribution and utilisation in insects. Am. Zool. 1976, 16, 733–745. [Google Scholar]
- Kouřimská, L.; Adámková, A. Nutritional and sensory quality of edible insects. NFS J. 2016, 4, 22–26. [Google Scholar]
- Peters, R.H. The Ecological Implications of Body Size; Cambridge University Press: Cambridge, UK, 1983. [Google Scholar]
- Vézina, A.F. Empirical relationships between predator and prey size in terrestrial vertebrates. Oecologia 1985, 67, 555–565. [Google Scholar]
- Woolley, L.A.; Geyle, H.M.; Murphy, B.P.; Legge, S.M.; Palmer, R.; Dickman, C.R.; Augusteyn, J.; Comer, S.; Doherty, T.S.; Eager, C.; et al. Introduced cats Felis catus eating a continental fauna: Inventory and traits of Australian mammal species killed. Mammal Rev. 2019, 49, 354–368. [Google Scholar]
- Fancourt, B.A. Making a killing: Photographic evidence of predation of a Tasmanian pademelon (Thylogale billardierii) by a feral cat (Felis catus). Aust. Mammal. 2015, 37, 120–124. [Google Scholar]
- Gibson, D.F.; Lundie-Jenkins, G.; Langford, D.G.; Cole, J.R.; Clarke, D.E.; Johnson, K.A. Predation by feral cats, Felis catus, on the rufous hare-wallaby, Lagorchestes hirsutus, in the Tanami Desert. Aust. Mammal. 1994, 17. [Google Scholar]
- Page, K.D.; Ruykys, L.; Miller, D.W.; Adams, P.J.; Bateman, P.W.; Fleming, P.A. Influences of behaviour and physiology on body mass gain in the woylie (Bettongia penicillata ogilbyi) post-translocation. Wildl. Res. 2019, 46, 429–443. [Google Scholar]
- Spencer, P. Evidence of predation by a feral cat, Felis catus (Carnivora: Felidae) on an isolated rock-wallaby colony in tropical Queensland. Aust. Mammal. 1991, 14, 143–144. [Google Scholar]
- Horsup, A.; Evans, M. Predation by feral cats, Felis catus, on an endangered marsupial, the bridled nailtail wallaby, Onychogalea fraenata. Aust. Mammal. 1993, 16, 85–86. [Google Scholar]
- Fisher, D.O.; Blomberg, S.P.; Hoyle, S.D. Mechanisms of drought-induced population decline in an endangered wallaby. Biol. Conserv. 2001, 102, 107–115. [Google Scholar] [CrossRef]
- Hardman, B.; Moro, D.; Calver, M.C. Direct evidence implicates feral cat predation as the primary cause of failure of a mammal reintroduction programme. Ecol. Manag. Restor. 2016, 17, 152–158. [Google Scholar] [CrossRef]
- Marlow, N.J.; Thomas, N.D.; Williams, A.A.E.; Macmahon, B.; Lawson, J.; Hitchen, Y.; Angus, J.; Berry, O. Cats (Felis catus) are more abundant and are the dominant predator of woylies (Bettongia penicillata) after sustained fox (Vulpes vulpes) control. Aust. J. Zool. 2015, 63, 18–27. [Google Scholar] [CrossRef]
- Gomes, V.; Carretero, M.A.; Kaliontzopoulou, A. Run for your life, but bite for your rights? How interactions between natural and sexual selection shape functional morphology across habitats. Sci. Nat. 2018, 105, 9. [Google Scholar] [CrossRef] [PubMed]
- Husak, J.F. Does survival depend on how fast you can run or how fast you do run? Funct. Ecol. 2006, 20, 1080–1086. [Google Scholar] [CrossRef]
- Lappin, A.K.; Hamilton, P.S.; Sullivan, B.K. Bite-performance and head shape in a sexually dimorphic crevice-dwelling lizard, the common chuckwalla [Sauromalus ater (=obesus)]. Biol. J. Linn. Soc. 2006, 88, 215–222. [Google Scholar] [CrossRef]
- Becerra, F.; Echeverría, A.I.; Marcos, A.; Casinos, A.; Vassallo, A.I. Sexual selection in a polygynous rodent (Ctenomys talarum): An analysis of fighting capacity. Zoology 2012, 115, 405–410. [Google Scholar] [CrossRef]
- Calver, M.C.; Adams, G.; Clark, W.; Pollock, K.H. Assessing the safety of collars used to attach predation deterrent devices and ID tags to pet cats. Anim. Welf. 2013, 22, 95–105. [Google Scholar] [CrossRef]
- Finkler, H.; Gunther, I.; Terkel, J. Behavioral differences between urban feeding groups of neutered and sexually intact free-roaming cats following a trap-neuter-return procedure. J. Am. Vet. Med Assoc. 2011, 238, 1141–1149. [Google Scholar] [CrossRef]
- Seidensticker, J.; Lumpkin, S. Cats in Question: The Smithsonian Answer Book; Smithsonian: Washington, DC, USA, 2004. [Google Scholar]
- Bradshaw, J.W.S.; Casey, R.A.; Brown, S.L. Behavioural Development. In The Behaviour of the Domestic Cat, 2nd ed.; CABI Publishers: Oxfordshire, UK, 2012; pp. 63–90. [Google Scholar]
- Fitzgerald, B.M.; Turner, D.C. Hunting behaviour of domestic cats and their impact on prey populations. In The Domestic Cat: The Biology of its Behaviour; Turner, D.C., Bateson, P., Eds.; Cambridge University Press: Cambridge, UK, 2000; pp. 151–176. [Google Scholar]
- Ancillotto, L.; Serangeli, M.T.; Russo, D. Curiosity killed the bat: Domestic cats as bat predators. Mamm. Biol.-Zeitschrift Säugetierkunde 2013, 78, 369–373. [Google Scholar] [CrossRef]
- Risbey, D.A.; Calver, M.C.; Short, J. Control of feral cats for nature conservation. I. Field tests of four baiting methods. Wildl. Res. 1997, 24, 319–326. [Google Scholar] [CrossRef]
- Moseby, K.E.; Hill, B.M. The use of poison baits to control feral cats and red foxes in arid South Australia I. Aerial baiting trials. Wildl. Res. 2011, 38, 338–349. [Google Scholar] [CrossRef]
- Doherty, T.S.; Algar, D. Response of feral cats to a track-based baiting programme using Eradicat® baits. Ecol. Manag. Restor. 2015, 16, 124–130. [Google Scholar] [CrossRef]
- Caro, T.M. Effects of the mother, object play, and adult experience on predation in cats. Behav. Neural Biol. 1980, 29, 29–51. [Google Scholar] [CrossRef]
- Deag, J.M.; Manning, A.; Lawrence, C.E. Factors influencing the mother-kitten relationship. In The Domestic Cat: The Biology of its Behaviour, 2nd ed.; Turner, D.C., Bateson, P., Eds.; Cambridge University Press: Cambridge, UK, 2000; pp. 23–45. [Google Scholar]
- Hilborn, A.; Pettorelli, N.; Orme, C.D.L.; Durant, S.M. Stalk and chase: How hunt stages affect hunting success in Serengeti cheetah. Anim. Behav. 2012, 84, 701–706. [Google Scholar] [CrossRef]
- Holekamp, K.E.; Smale, L.; Berg, R.; Cooper, S.M. Hunting rates and hunting success in the spotted hyena (Crocuta crocuta). J. Zool. 1997, 242, 1–15. [Google Scholar] [CrossRef]
- Rutz, C.; Whittingham, M.J.; Newton, I. Age-dependent diet choice in an avian top predator. Proc. R. Soc. B Biol. Sci. 2006, 273, 579–586. [Google Scholar] [CrossRef]


| (a) Sex | Males | Females | Mann–Whitney U test |
| Body mass | 3.50 ± 1.34 kg, n = 308, max 6.7 kg | 2.57 ± 0.89 kg, n = 260, max 4.9 kg | Zadj = 8.72, p < 0.001 |
| Pregnant | 3.36 ± 0.51 kg, n = 24 | ||
| Non-pregnant | 2.49 ± 0.88 kg, n = 236 | ||
| Head-body length | 551 ± 84 mm, n = 299 | 504 ± 74 mm, n = 247 | Zadj = 7.36, p < 0.001 |
| Head length | 112 ± 14 mm, n = 288 | 103 ± 13 mm, n = 235 | Zadj = 7.01, p < 0.001 |
| Age | 2.42 ± 2.05 years, n = 154 | 3.21 ± 2.88 years, n = 105 | Zadj = 1.98, p = 0.047 |
| (b) Location | Rural (feral cats) | Urban (stray cats) | Mann–Whitney U test |
| Body mass | 3.05 ± 1.26 kg, n = 419, max 6.7 kg | 3.14 ± 1.20 kg, n = 148, max 6.0 kg | Zadj = 0.56, p = 0.575 |
| Head-body length | 527 ± 83 mm, n = 398 | 538 ± 82 mm, n = 148 | Zadj = 1.13, p = 0.257 |
| Head length | 106 ± 15 mm, n = 375 | 110 ± 12 mm, n = 148 | Zadj = 2.60, p = 0.009 |
| Age | 2.87 ± 2.56 years, n = 143 | 2.58 ± 2.30 years, n = 116 | Zadj = 1.11, p = 0.266 |
| Model | df | AIC | Delta AIC | wi | |
|---|---|---|---|---|---|
| 1 | BF ~ Cat mb * Sex + Location * Age | 8 | −828.69 | 0.00 | 0.364 |
| 2 | BF ~ Cat mb * Sex + Location * Age + Location * Sex | 9 | −828.45 | 0.23 | 0.324 |
| 3 | BF ~ Cat mb * Sex + Mass * Location + Location * Age | 9 | −827.15 | 1.54 | 0.169 |
| 4 | BF ~ Cat mb * Sex + Location * Age + Sex * Age | 9 | −826.81 | 1.88 | 0.143 |
| Diet Category | Contribution to Difference in Diet (SIMPER %) | Rural = Feral Cat Mean ± 1 SD Percentage Volume | Urban = Stray Cat Mean ± 1 SD Percentage Volume |
|---|---|---|---|
| Refuse | 35.6 | 9.25 ± 25.72 | 18.83 ± 30.02 |
| House mouse Mus musculus | 15.9 | 28.56 ± 39.57 | 1.49 ± 8.10 |
| Birds | 14.7 | 10.03 ± 25.15 | 5.32 ± 19.38 |
| Invertebrates | 12.0 | 4.32 ± 14.25 | 1.24 ± 4.54 |
| European rabbit Oryctolagus cuniculus | 5.7 | 4.91 ± 18.77 | 0.49 ± 4.95 |
| Reptiles | 5.2 | 2.85 ± 11.28 | 0.01 ± 0.10 |
| Black rat Rattus rattus | 4.7 | 2.36 ± 13.82 | 3.97 ± 17.20 |
| Frogs/Fish | 2.4 | 1.03 ± 9.53 | 0.15 ± 1.49 |
| Total medium native mammal ≥500 g | 2.1 | 0.97 ± 9.08 | 0.90 ± 8.91 |
| Grains/Animal feed | 1.8 | 2.76 ± 13.38 | 0.00 ± 0.00 |
| Total small native mammal <500 g | <0.01 | 0.07 ± 1.09 | 0.00 ± 0.00 |
| Prey Species | Species Name | ‘Dangerous’ | Avg. mb (g) | Eaten by No. Cats |
|---|---|---|---|---|
| Invertebrates | ||||
| (all orders/class/clade grouped) | N | 0.5 | 107 | |
| Cockroaches | Blattodea | |||
| Beetles, weevils | Coleoptera | |||
| Wasps, fly larvae | Hymenoptera | |||
| Moths, moth larvae | Lepidoptera | |||
| Dragonflies | Odonata | |||
| Grasshoppers, crickets, mole-crickets | Orthoptera | |||
| Scorpions | Scorpiones | |||
| Spiders | Araneae | |||
| Earthworms | Haplotaxida | |||
| Centipedes | Chilopoda clade | |||
| Snails | Gastropoda class | |||
| Fish | ||||
| Unknown fish sp. | - | N | - | 6 |
| Amphibian | ||||
| Kunapalari (wheatbelt) frog E | Neobatrachus kunapalari | N | 16 | 1 |
| Western banjo frog E | Limnodynastes dorsalis | N | 19 | 1 |
| Reptile | ||||
| South-western clawless gecko E | Crenadactylus ocellatus | N | 1 | 2 |
| Fine-faced gecko | Diplodactylus pulcher | N | 4 | 2 |
| Tree dtella | Gehyra variegata | N | 4 | 6 |
| Bynoe’s gecko | Heteronotia binoei | N | 2 | 1 |
| Leopard skink | Ctenotus patherinus | N | 8 | 3 |
| Unknown skink sp. | Ctenotus sp. | N | 7 | 3 |
| King’s skink E | Egernia kingii | N | 288 | 1 |
| Southwestern earless skink | Hemiergis initialis | N | 1 | 1 |
| Unknown skink sp. | Morethia sp. | N | 1 | 1 |
| Bobtail skink E | Tiliqua rugosa rugosa | N | 512 | 1 |
| Unknown skink sp. | Family: Scincidae | N | 1 | 2 |
| Western heath dragon | Ctenophorus adelaidensis | N | 2 | 1 |
| Ornate crevice dragon | Ctenophorus ornatus | N | 2 | 1 |
| Western netted dragon | Ctenophorus reticulatus | N | 2 | 1 |
| Western bearded dragon E | Pogona minor minor | N | 31 | 5 |
| Thorny devil | Moloch horridus | N | 38 | 1 |
| Gould’s monitor | Varanus gouldii | Y | 350 | 1 |
| Black-headed monitor | Varanus tristis | Y | 200 | 1 |
| Unknown monitor sp. | Varanus sp. | Y | - | 3 |
| Southern blindsnake | Anilios australis | N | 4.5 ? | 1 |
| Dark-spined blindsnake | Anilios bicolor | N | 4.5 | 1 |
| Pale-headed blindsnake E | Anilios hamatus | N | 20 | 1 |
| Unknown blindsnake sp. | Anilios sp. | N | 20 | 2 |
| Southern shovel-nosed snake | Brachyurophis semifasciata | N | 100 | 1 |
| Bardick snake | Echiopsis curta | Y | 400 | 1 |
| Western crowned snake E | Elapognathus coronatus | Y | 40 | 1 |
| Gould’s hooded snake E | Parasuta gouldii | Y | 200 | 1 |
| Western brown snake | Pseudonaja mengdeni | Y | 700 | 1 |
| Unknown snake sp. | Family: Elapidae | Y | - | 2 |
| Unknown reptile sp. | - | - | - | 1 |
| Bird | ||||
| Domestic chicken *,ƚ | Gallus domesticus | N | 1000 | 8 |
| Laughing dove * | Streptopelia senegalensis | N | 82 | 1 |
| Spotted dove | Streptopelia chinensis | N | 132 | 1 |
| Unknown dove sp. | Family: Columbidae | N | 155 | 2 |
| Brush bronzewing | Phaps elegans | N | 200 | 2 |
| Australian wood duck | Chenonetta jubata | N | 450 | 3 |
| Stubble quail | Coturnix pectoralis | N | 115 | 3 |
| Unknown button-quail sp. | Turnix sp. | N | 110 | 1 |
| Galah | Eolophus roseicapillus | Y | 300 | 7 |
| Rainbow lorikeet * | Trichoglossus haematodus | Y | 116 | 1 |
| Purple-crowned lorikeet | Glossopsitta porphyrocephala | Y | 44 | 1 |
| Western rosella E | Platycercus icterotis | Y | 61 | 3 |
| Red-capped parrot E | Purpureicephalus spurius | Y | 116 | 1 |
| Australian ringneck parrot | Barnardius zonarius | Y | 137 | 33 |
| Elegant parrot | Neophema elegans | Y | 43 | 1 |
| Unknown parrot sp. | Order: Psittaciformes | Y | 149 | 1 |
| Unknown non-passerine sp. | - | N | - | 2 |
| Rufous tree creeper | Climacteris rufa | N | 31 | 1 |
| Unknown fairy wren sp. | Malurus sp. | N | 10 | 1 |
| New Holland honeyeater | Phylidonyris novaehollandiae | N | 20 | 2 |
| White-cheeked honeyeater | Phylidonyris niger | N | 20 | 1 |
| Unknown honeyeater sp. | Phylodonyris sp. | N | 20 | 1 |
| Yellow-throated miner | Manorina flavigula | N | 55 | 1 |
| Rufous whistler | Pachycephala rufiventris | N | 25 | 1 |
| Australian raven | Corvus coronoides | N | 650 | 1 |
| Willie wagtail | Rhipidura leucophrys | N | 20 | 1 |
| Grey fantail | Rhipidura albiscapa | N | 9 | 1 |
| Magpie-lark | Grallina cyanoleuca | N | 83 | 1 |
| Unknown small passerine sp. | - | N | - | 3 |
| Unknown bird sp. | - | - | - | 22 |
| Mammal | ||||
| European rabbit * | Oryctolagus cuniculus | Y | 1800 | 34 |
| House mouse * | Mus musculus | N | 19 | 167 |
| Black rat * | Rattus rattus | Y | 218 | 21 |
| Western bush rat E | Rattus fuscipes fuscipes | Y | 76 | 1 |
| Fat-tailed dunnart | Sminthopsis crassicaudata | N | 15 | 1 |
| Quenda (bandicoot) E,CS | Isoodon fusciventer | N | 755 | 1 |
| Western pygmy possum E | Cercartetus concinnus | N | 45 | 1 |
| Common brushtail possum E | Trichosurus vulpecula hypoleucus | Y | 2850 | 10 |
| Black-footed rock wallaby E,CS | Petrogale lateralis | Y | 4050 | 1 |
| Unknown mammal sp. | - | - | - | 1 |
| Total number of cats eating vertebrates | 256 | |||
| Grand total cats eating invertebrates and vertebrates | 294 | |||
| Prey Species | Average Adult Body Mass (by Sex) | Evidence | Adult/Juvenile | Reference |
|---|---|---|---|---|
| Tammar wallaby (Macropus eugenii) | 6.0 kg | Extirpation from islands | J and A | Dickman [7] |
| Tasmanian pademelon (Thylogale billardierii) | M 7.0 kg (3.8–12.0 kg) F 3.9 kg (2.4–10.0 kg) | Camera trap | A (F ≈ 4 kg) | Fancourt [81] |
| Allied rock-wallaby (Petrogale assimilis) | M 4.7 kg F 4.3 kg | Direct observation, carcasses * | J and A (≈4.0 kg) | Spencer [84] |
| Black-footed rock wallaby (Petrogale lateralis) | M 4.5 kg (4.1–5.0 kg) F 3.5 kg (3.1–3.8 kg) | Stomach contents | J | This study |
| Stomach contents and direct observation of cat feeding at a freshly-killed adult | J and A | Read et al. [44] | ||
| Stomach contents | ? | Paltridge et al. [57] | ||
| Bridled nailtail wallaby (Onychogalea fraenata) | M 6.0 kg (5.0–8.0 kg) F 4.5 kg (4.0–6.0 kg) | Stomach contents | J (≈1.5 kg) | Horsup and Evans [85] |
| Predation ƚ | J (≈3.0 kg) | Fisher, Blomberg and Hoyle [86] | ||
| Spectacled hare-wallaby (Lagorchestes conspicillatus) | Extirpation from islands | J and A | Dickman [7] | |
| Rufous hare-wallaby (Lagorchestes hirsutus) | M 1.6 kg (1.2–1.8 kg) F 1.7 kg (0.8–2.0 kg) | Stomach contents Predation ƚ | ? J and A | Gibson et al. [82] |
| Predation ƚ | A | Hardman et al. [87] | ||
| Stomach contents | ? | Paltridge et al. [57] | ||
| Banded hare-wallaby (Lagostrophus fasciatus) | 1.6 kg (1.0–2.3 kg) | Predation ƚ | A | Hardman et al. [87] |
| Brush-tailed bettong/woylie (Bettongia penicillata) | M 1.27 kg (0.98–1.85 kg) F 1.40 kg (0.75–1.50 kg) | Predation ƚ Loss off islands | A | Marlow et al. [88] Dickman [7] |
| Burrowing bettong/boodie (Bettongia lesueur) | Loss off islands | Dickman [7] |
© 2020 by the authors. Licensee MDPI, Basel, Switzerland. This article is an open access article distributed under the terms and conditions of the Creative Commons Attribution (CC BY) license (http://creativecommons.org/licenses/by/4.0/).
Share and Cite
Fleming, P.A.; Crawford, H.M.; Auckland, C.H.; Calver, M.C. Body Size and Bite Force of Stray and Feral Cats—Are Bigger or Older Cats Taking the Largest or More Difficult-to-Handle Prey? Animals 2020, 10, 707. https://doi.org/10.3390/ani10040707
Fleming PA, Crawford HM, Auckland CH, Calver MC. Body Size and Bite Force of Stray and Feral Cats—Are Bigger or Older Cats Taking the Largest or More Difficult-to-Handle Prey? Animals. 2020; 10(4):707. https://doi.org/10.3390/ani10040707
Chicago/Turabian StyleFleming, Patricia A., Heather M. Crawford, Clare H. Auckland, and Michael C. Calver. 2020. "Body Size and Bite Force of Stray and Feral Cats—Are Bigger or Older Cats Taking the Largest or More Difficult-to-Handle Prey?" Animals 10, no. 4: 707. https://doi.org/10.3390/ani10040707
APA StyleFleming, P. A., Crawford, H. M., Auckland, C. H., & Calver, M. C. (2020). Body Size and Bite Force of Stray and Feral Cats—Are Bigger or Older Cats Taking the Largest or More Difficult-to-Handle Prey? Animals, 10(4), 707. https://doi.org/10.3390/ani10040707