Growth Performance of Local Chicken Breeds, a High-Performance Genotype and Their Crosses Fed with Regional Faba Beans to Replace Soy

 ,
,  , ,
, ,
Simple Summary
Abstract
1. Introduction
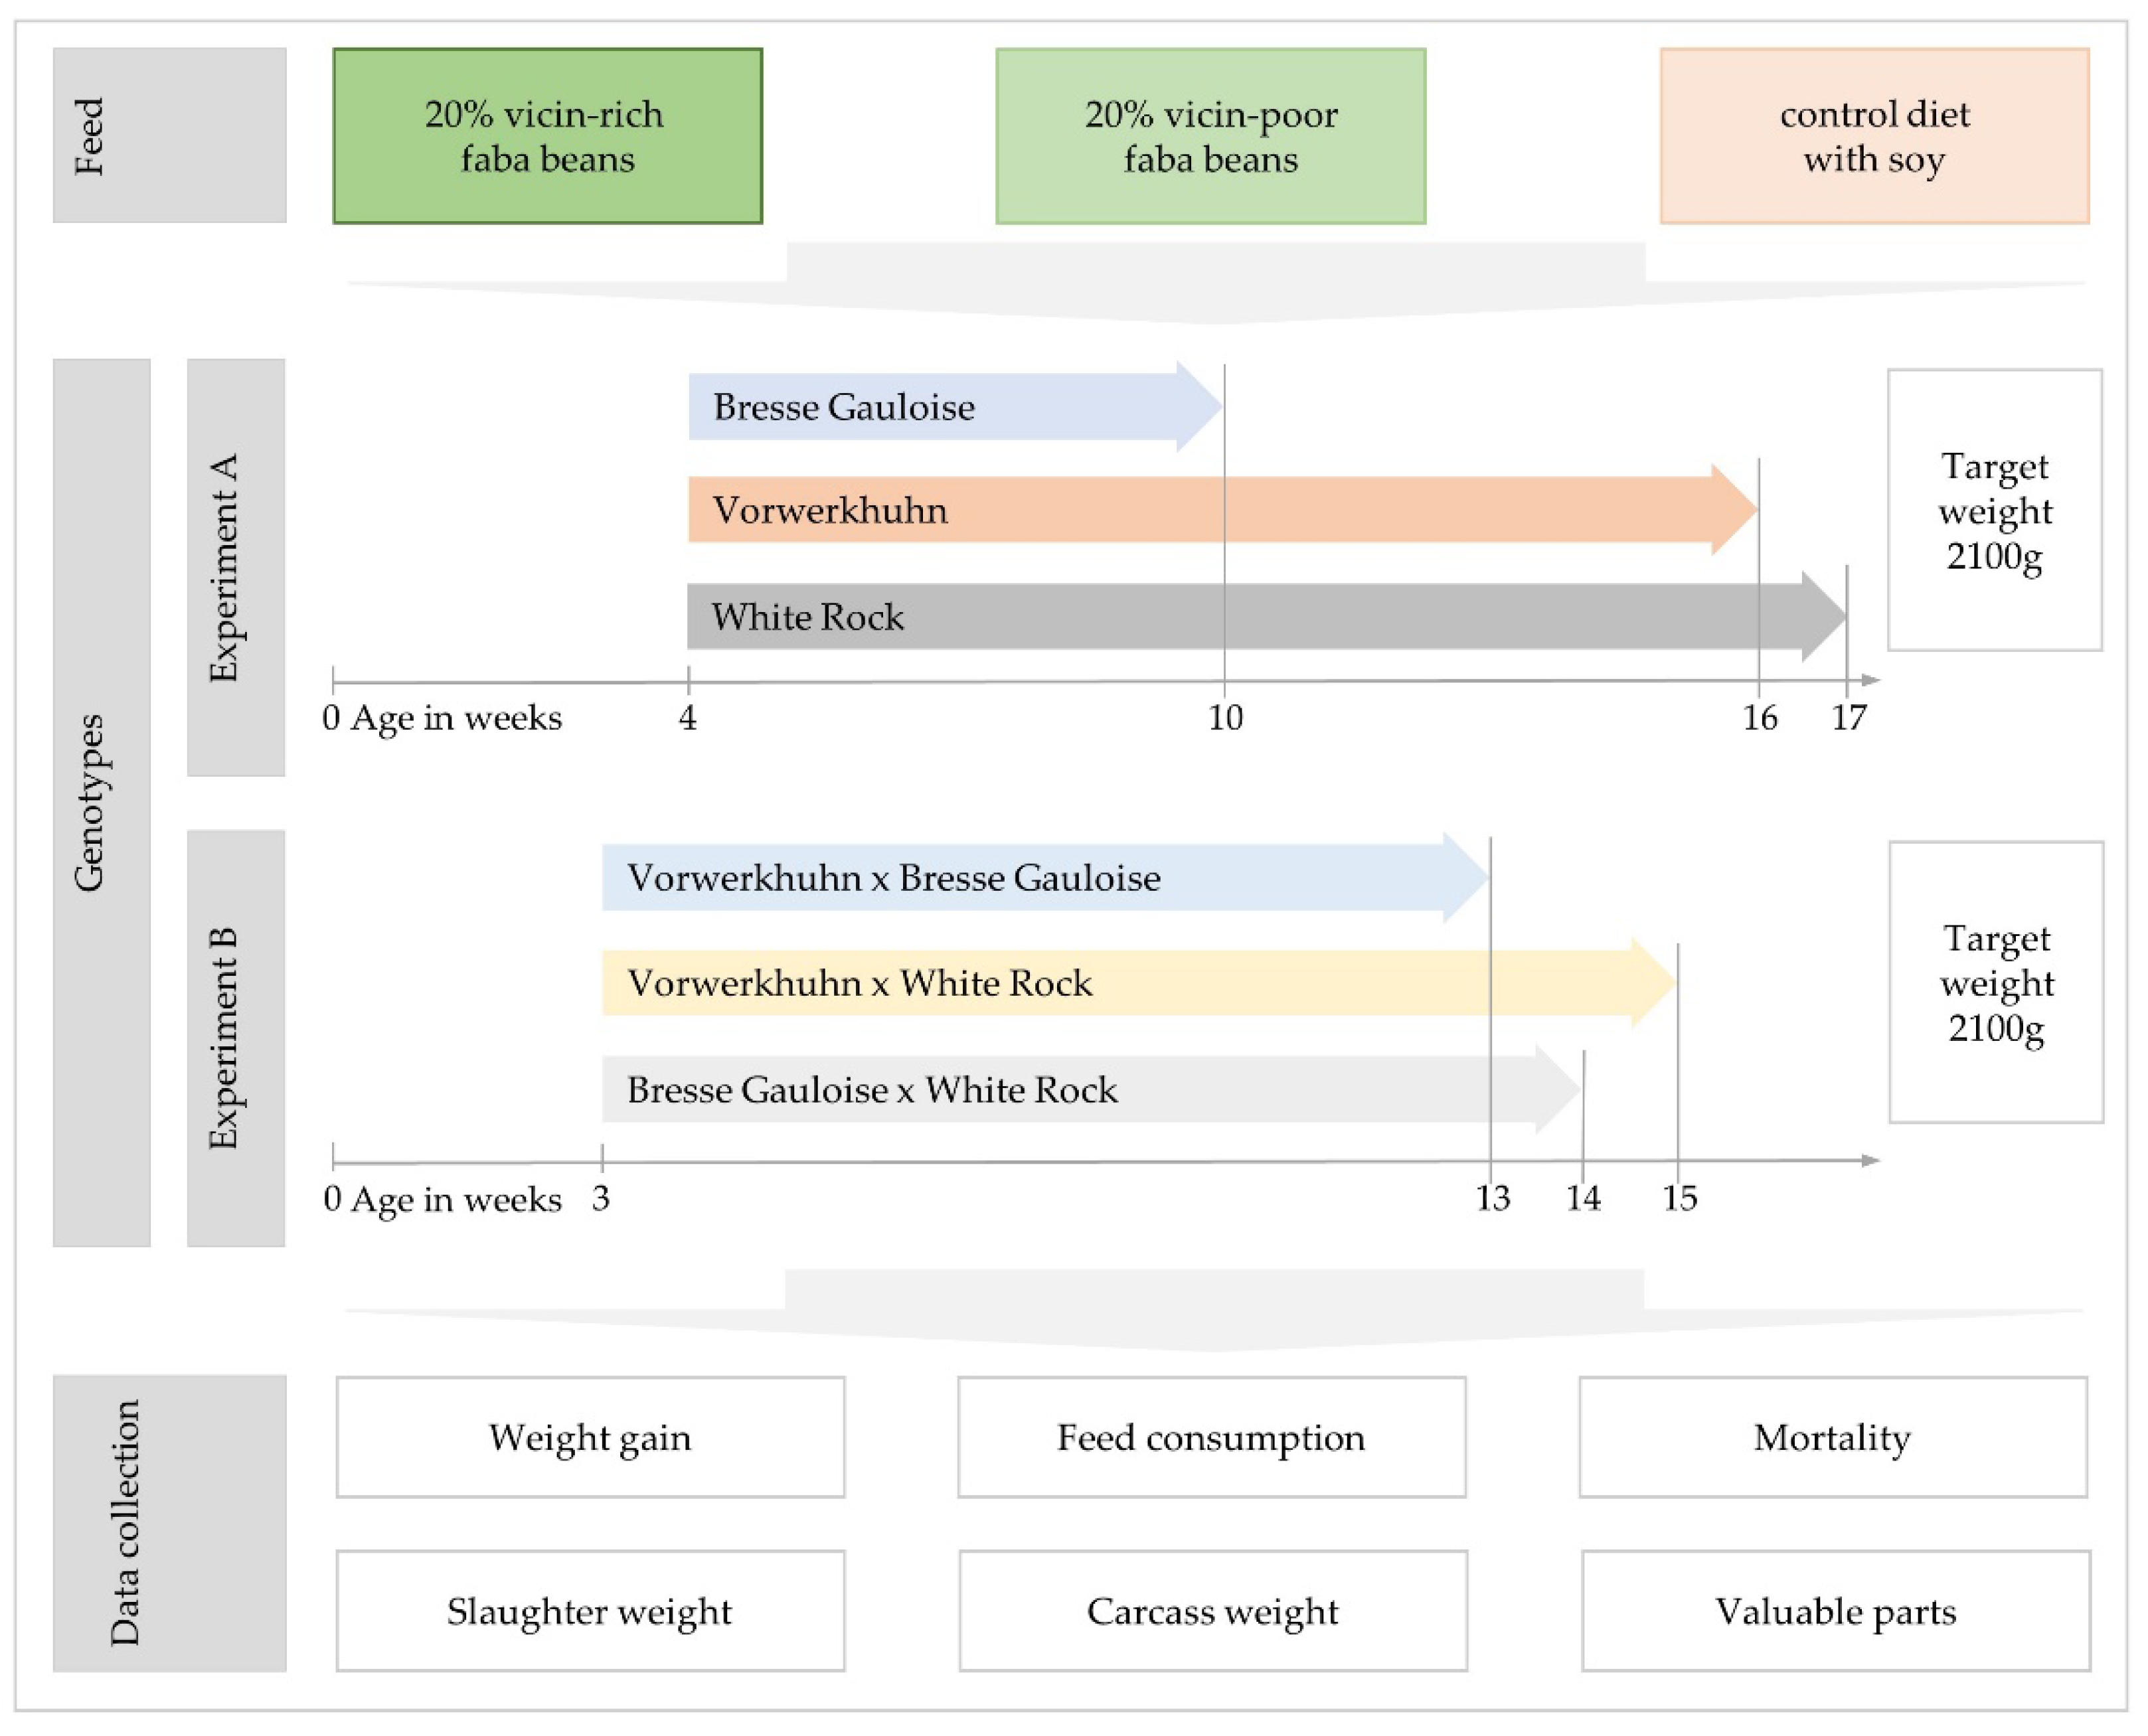
2. Materials and Methods
2.1. Ethical Declaration
2.2. Stock and Husbandry
2.3. Feeding Treatment
2.4. Data Collection
2.5. Statistics
3. Results
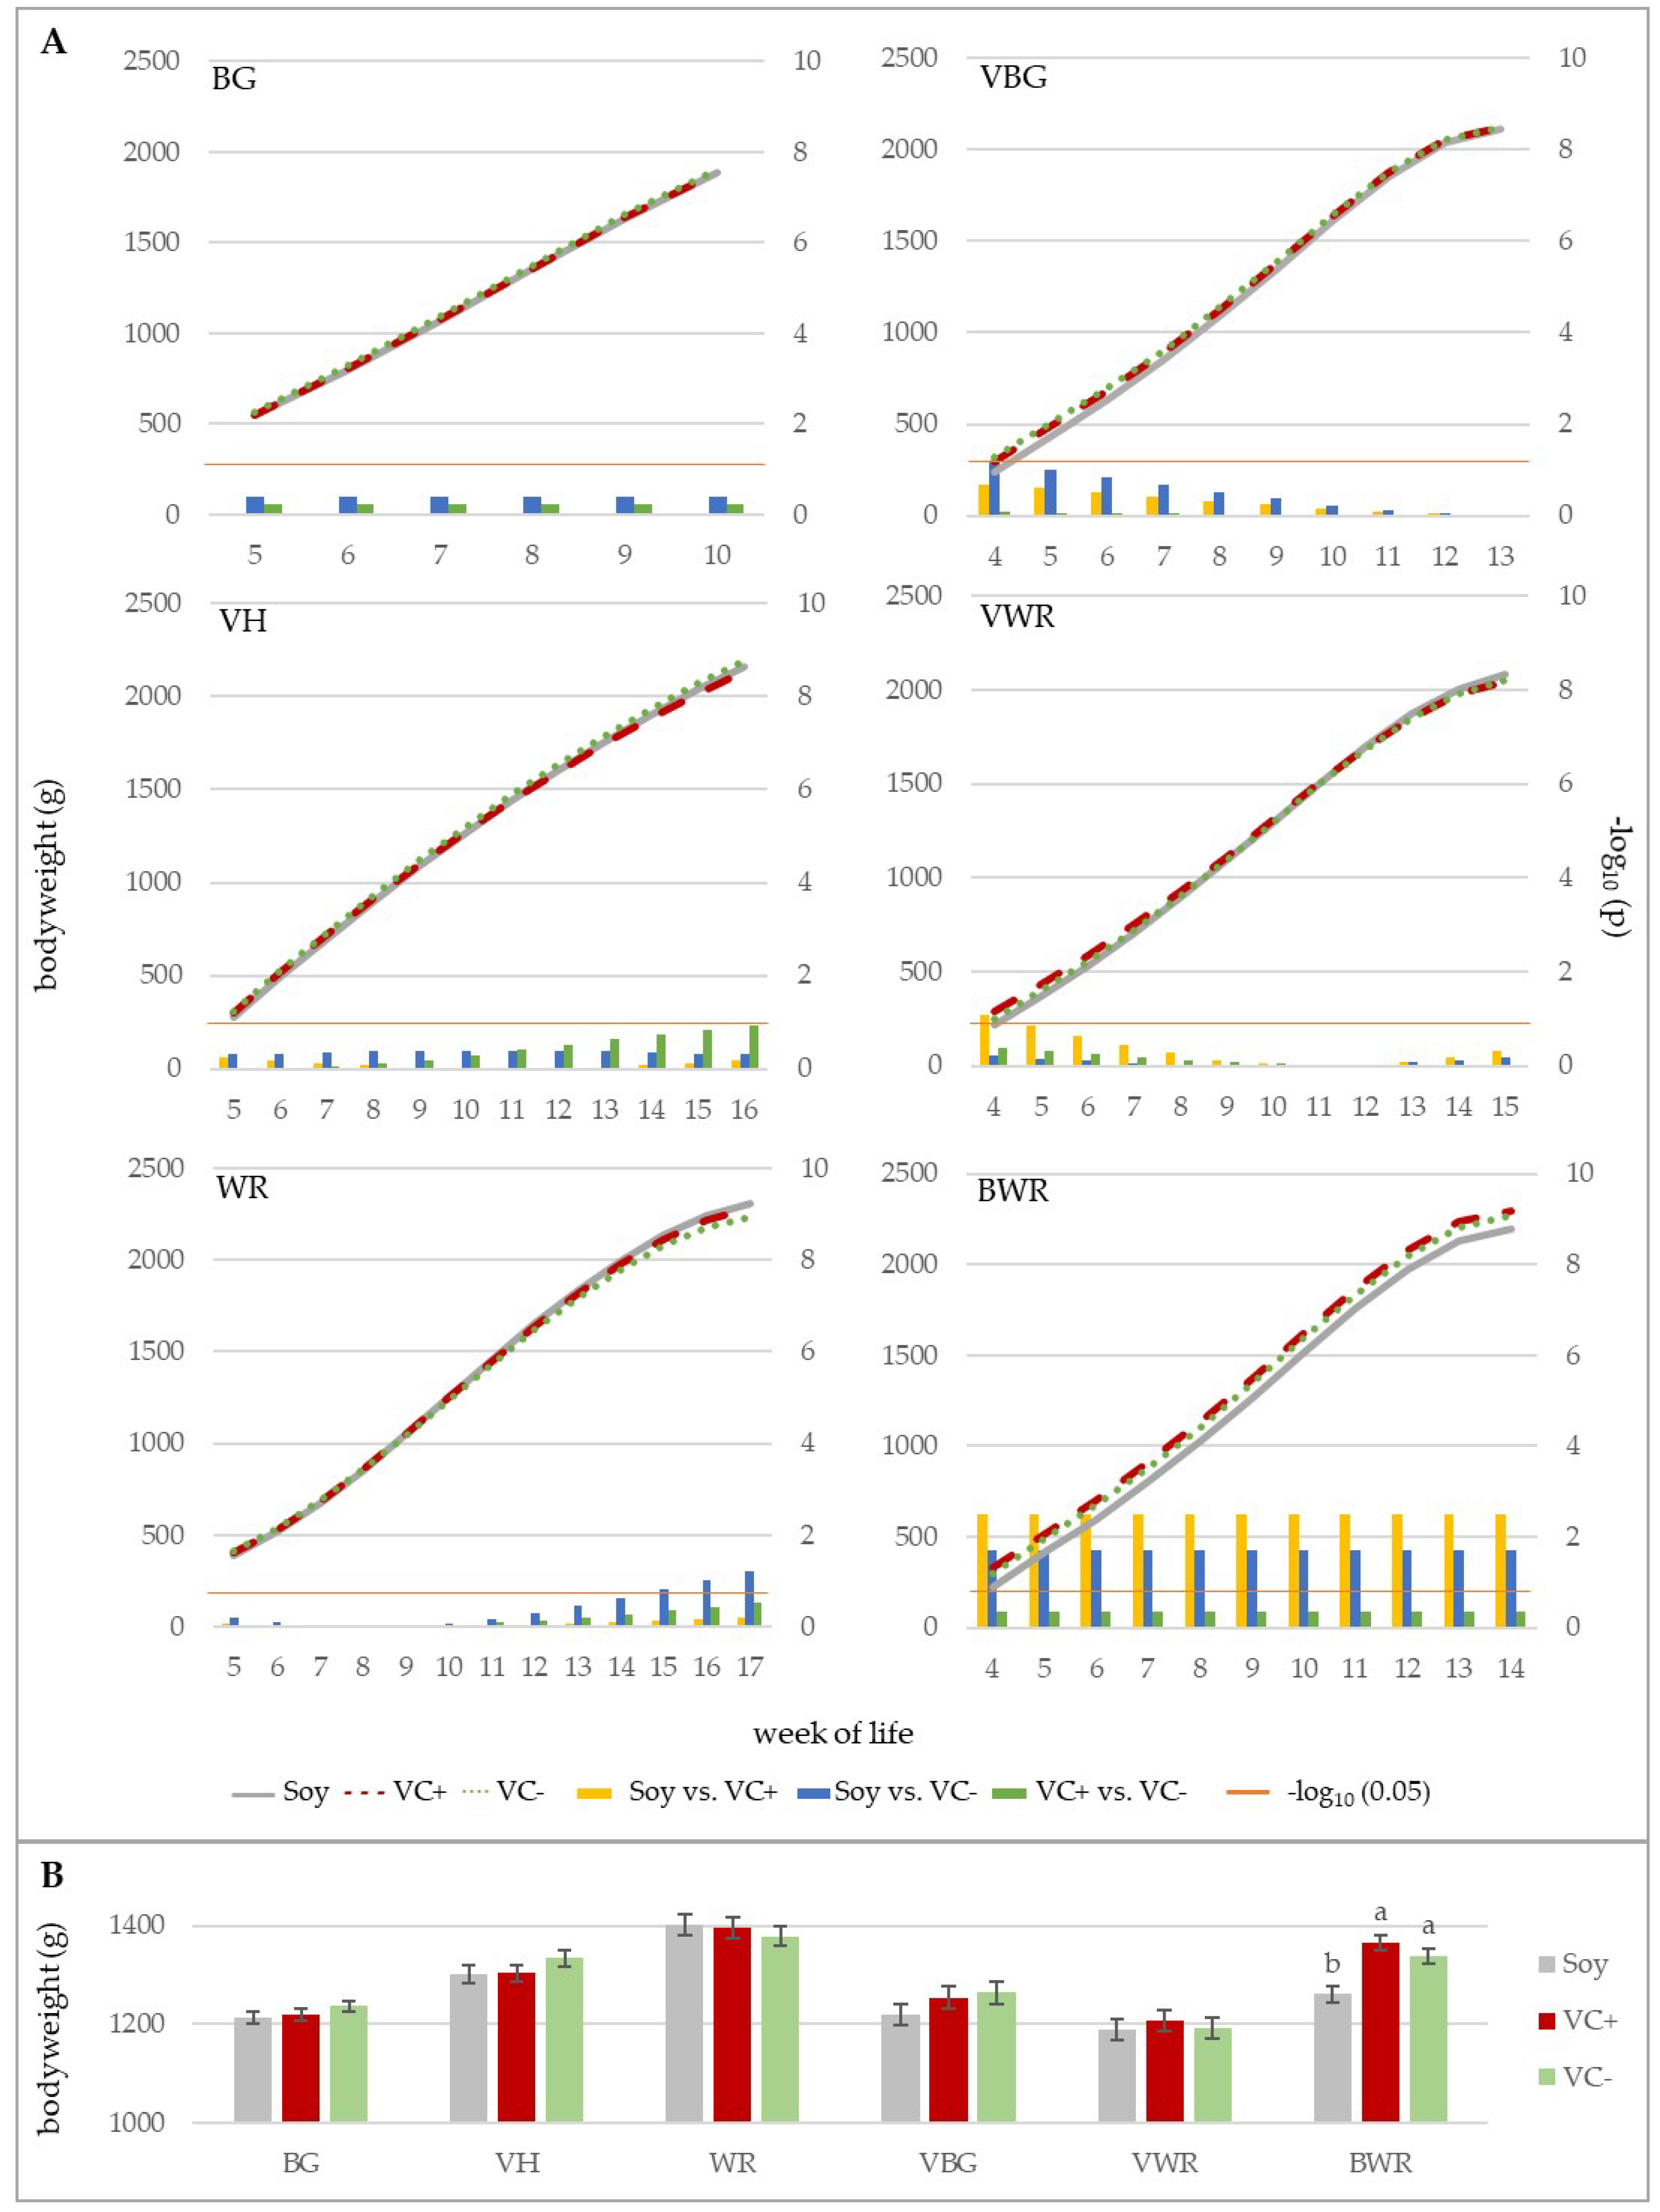
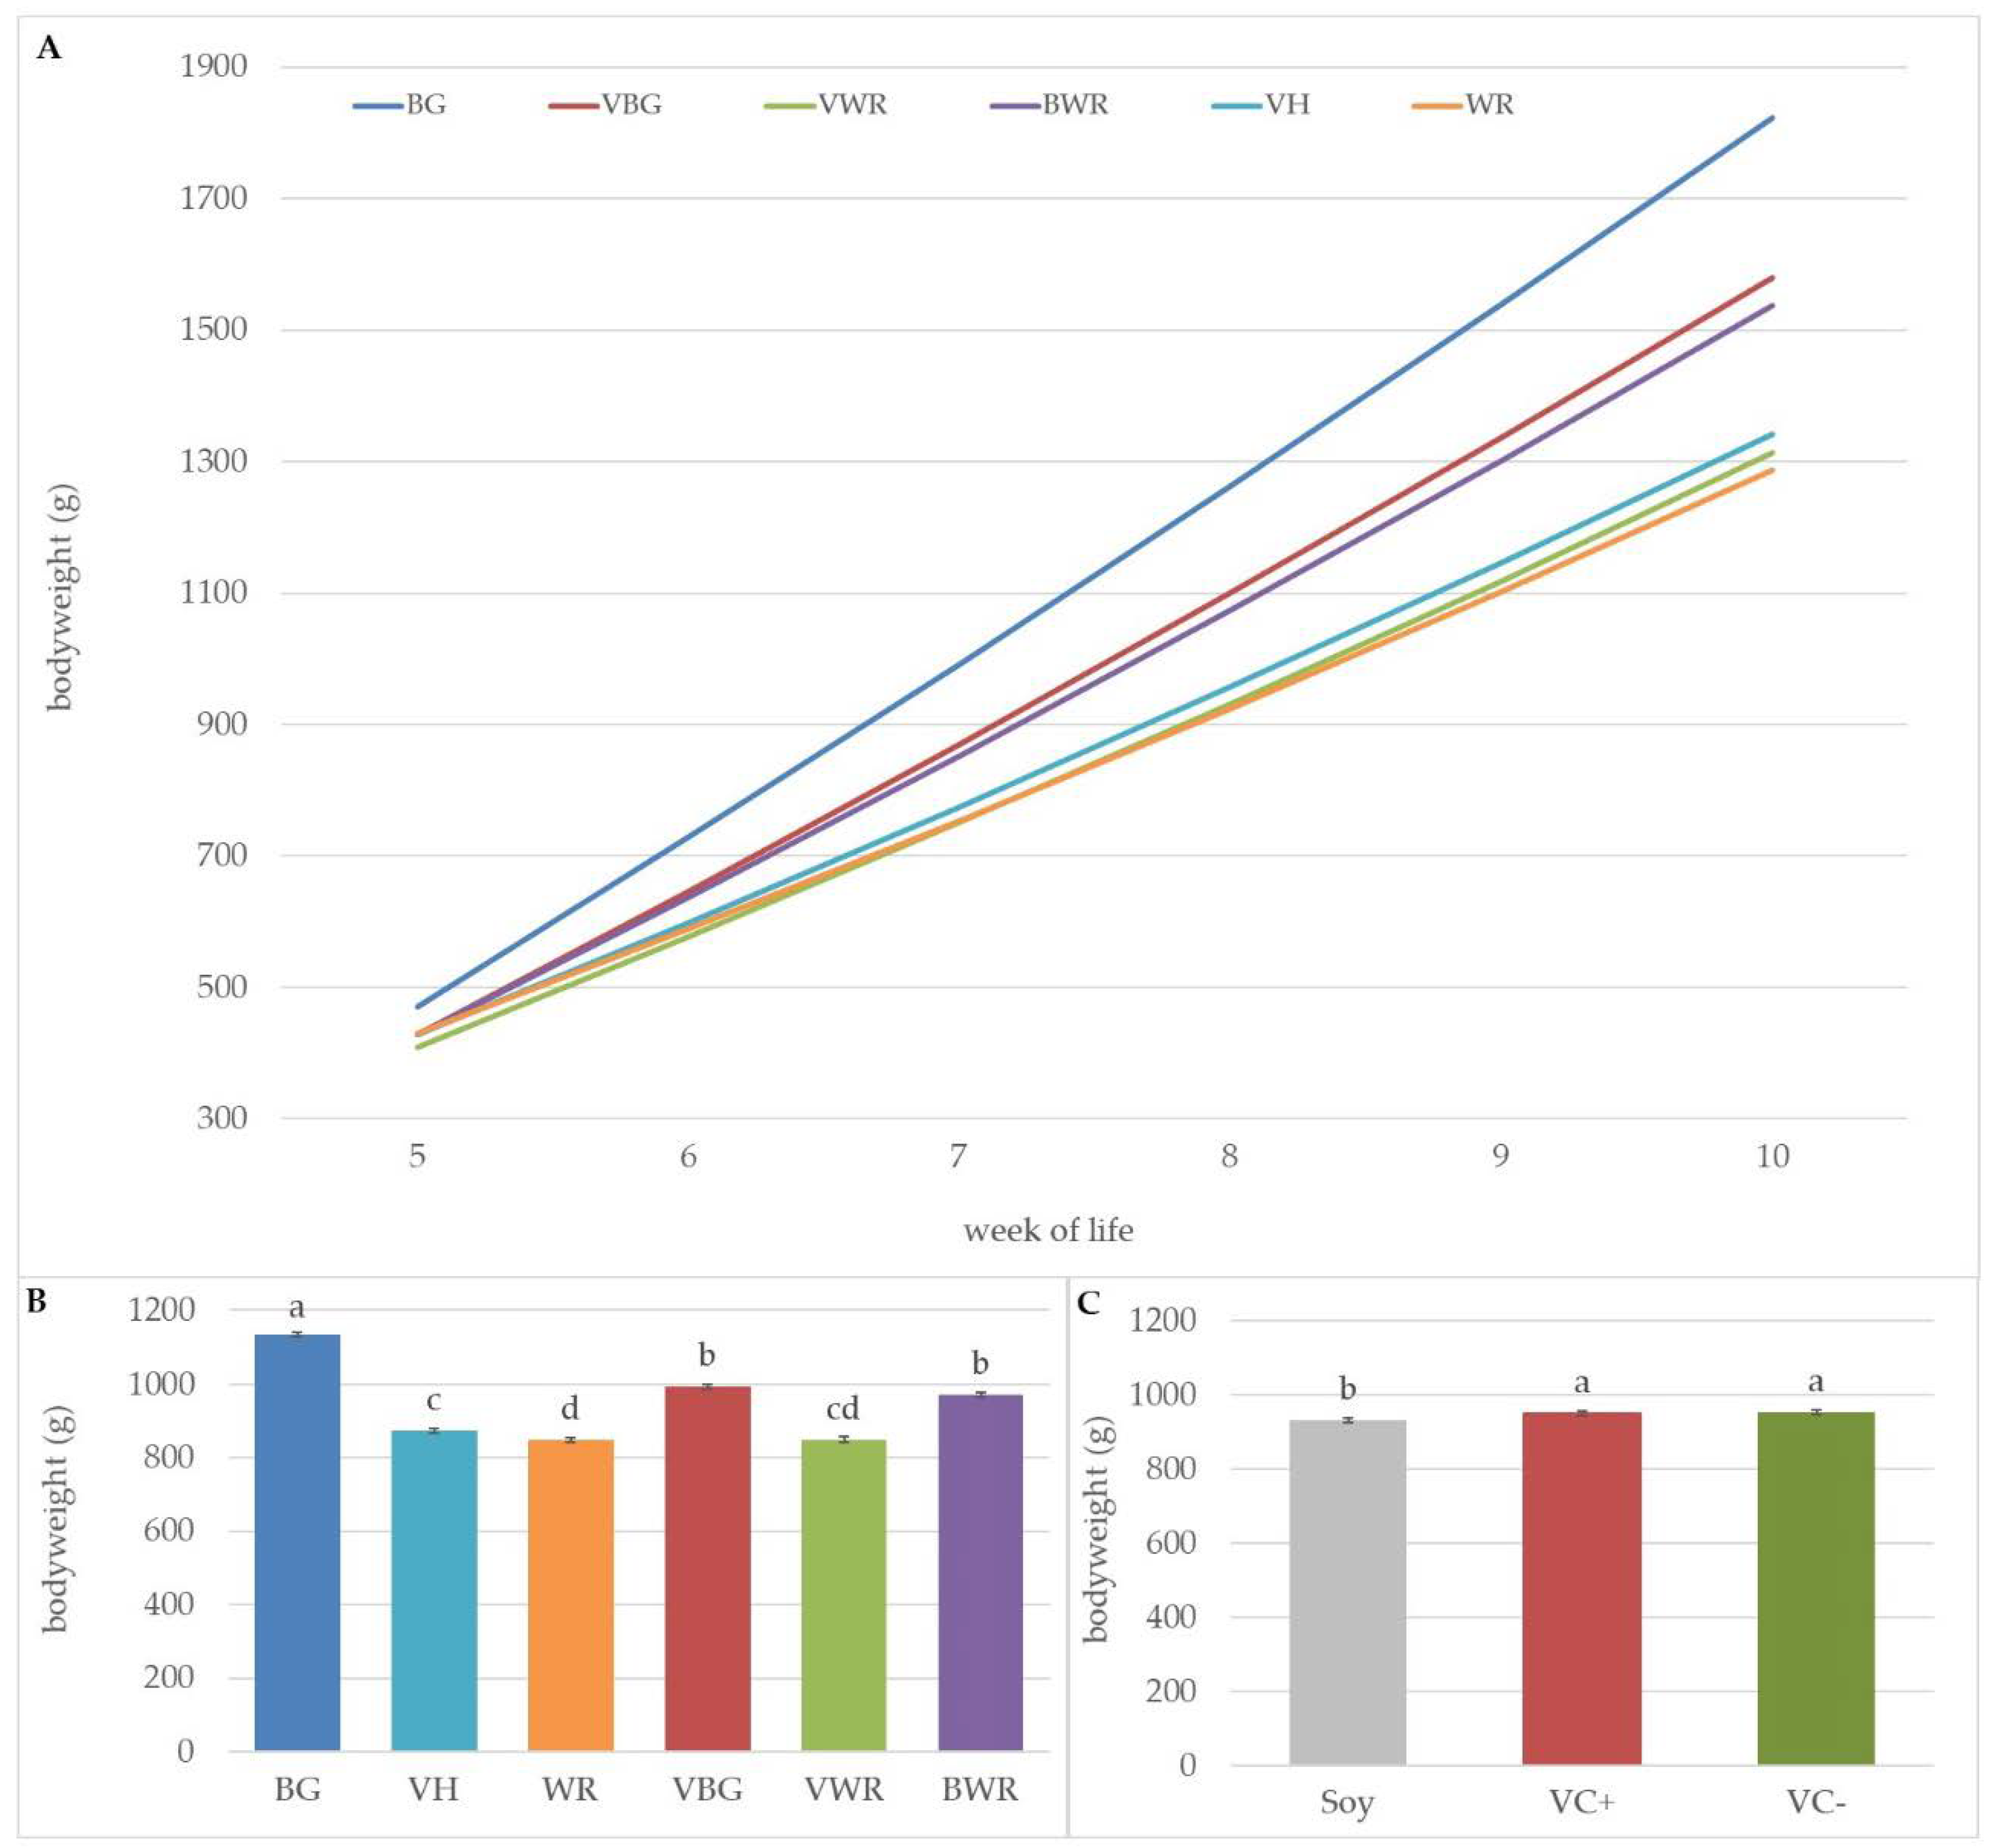
3.1. Weight Gain
3.2. Mortality
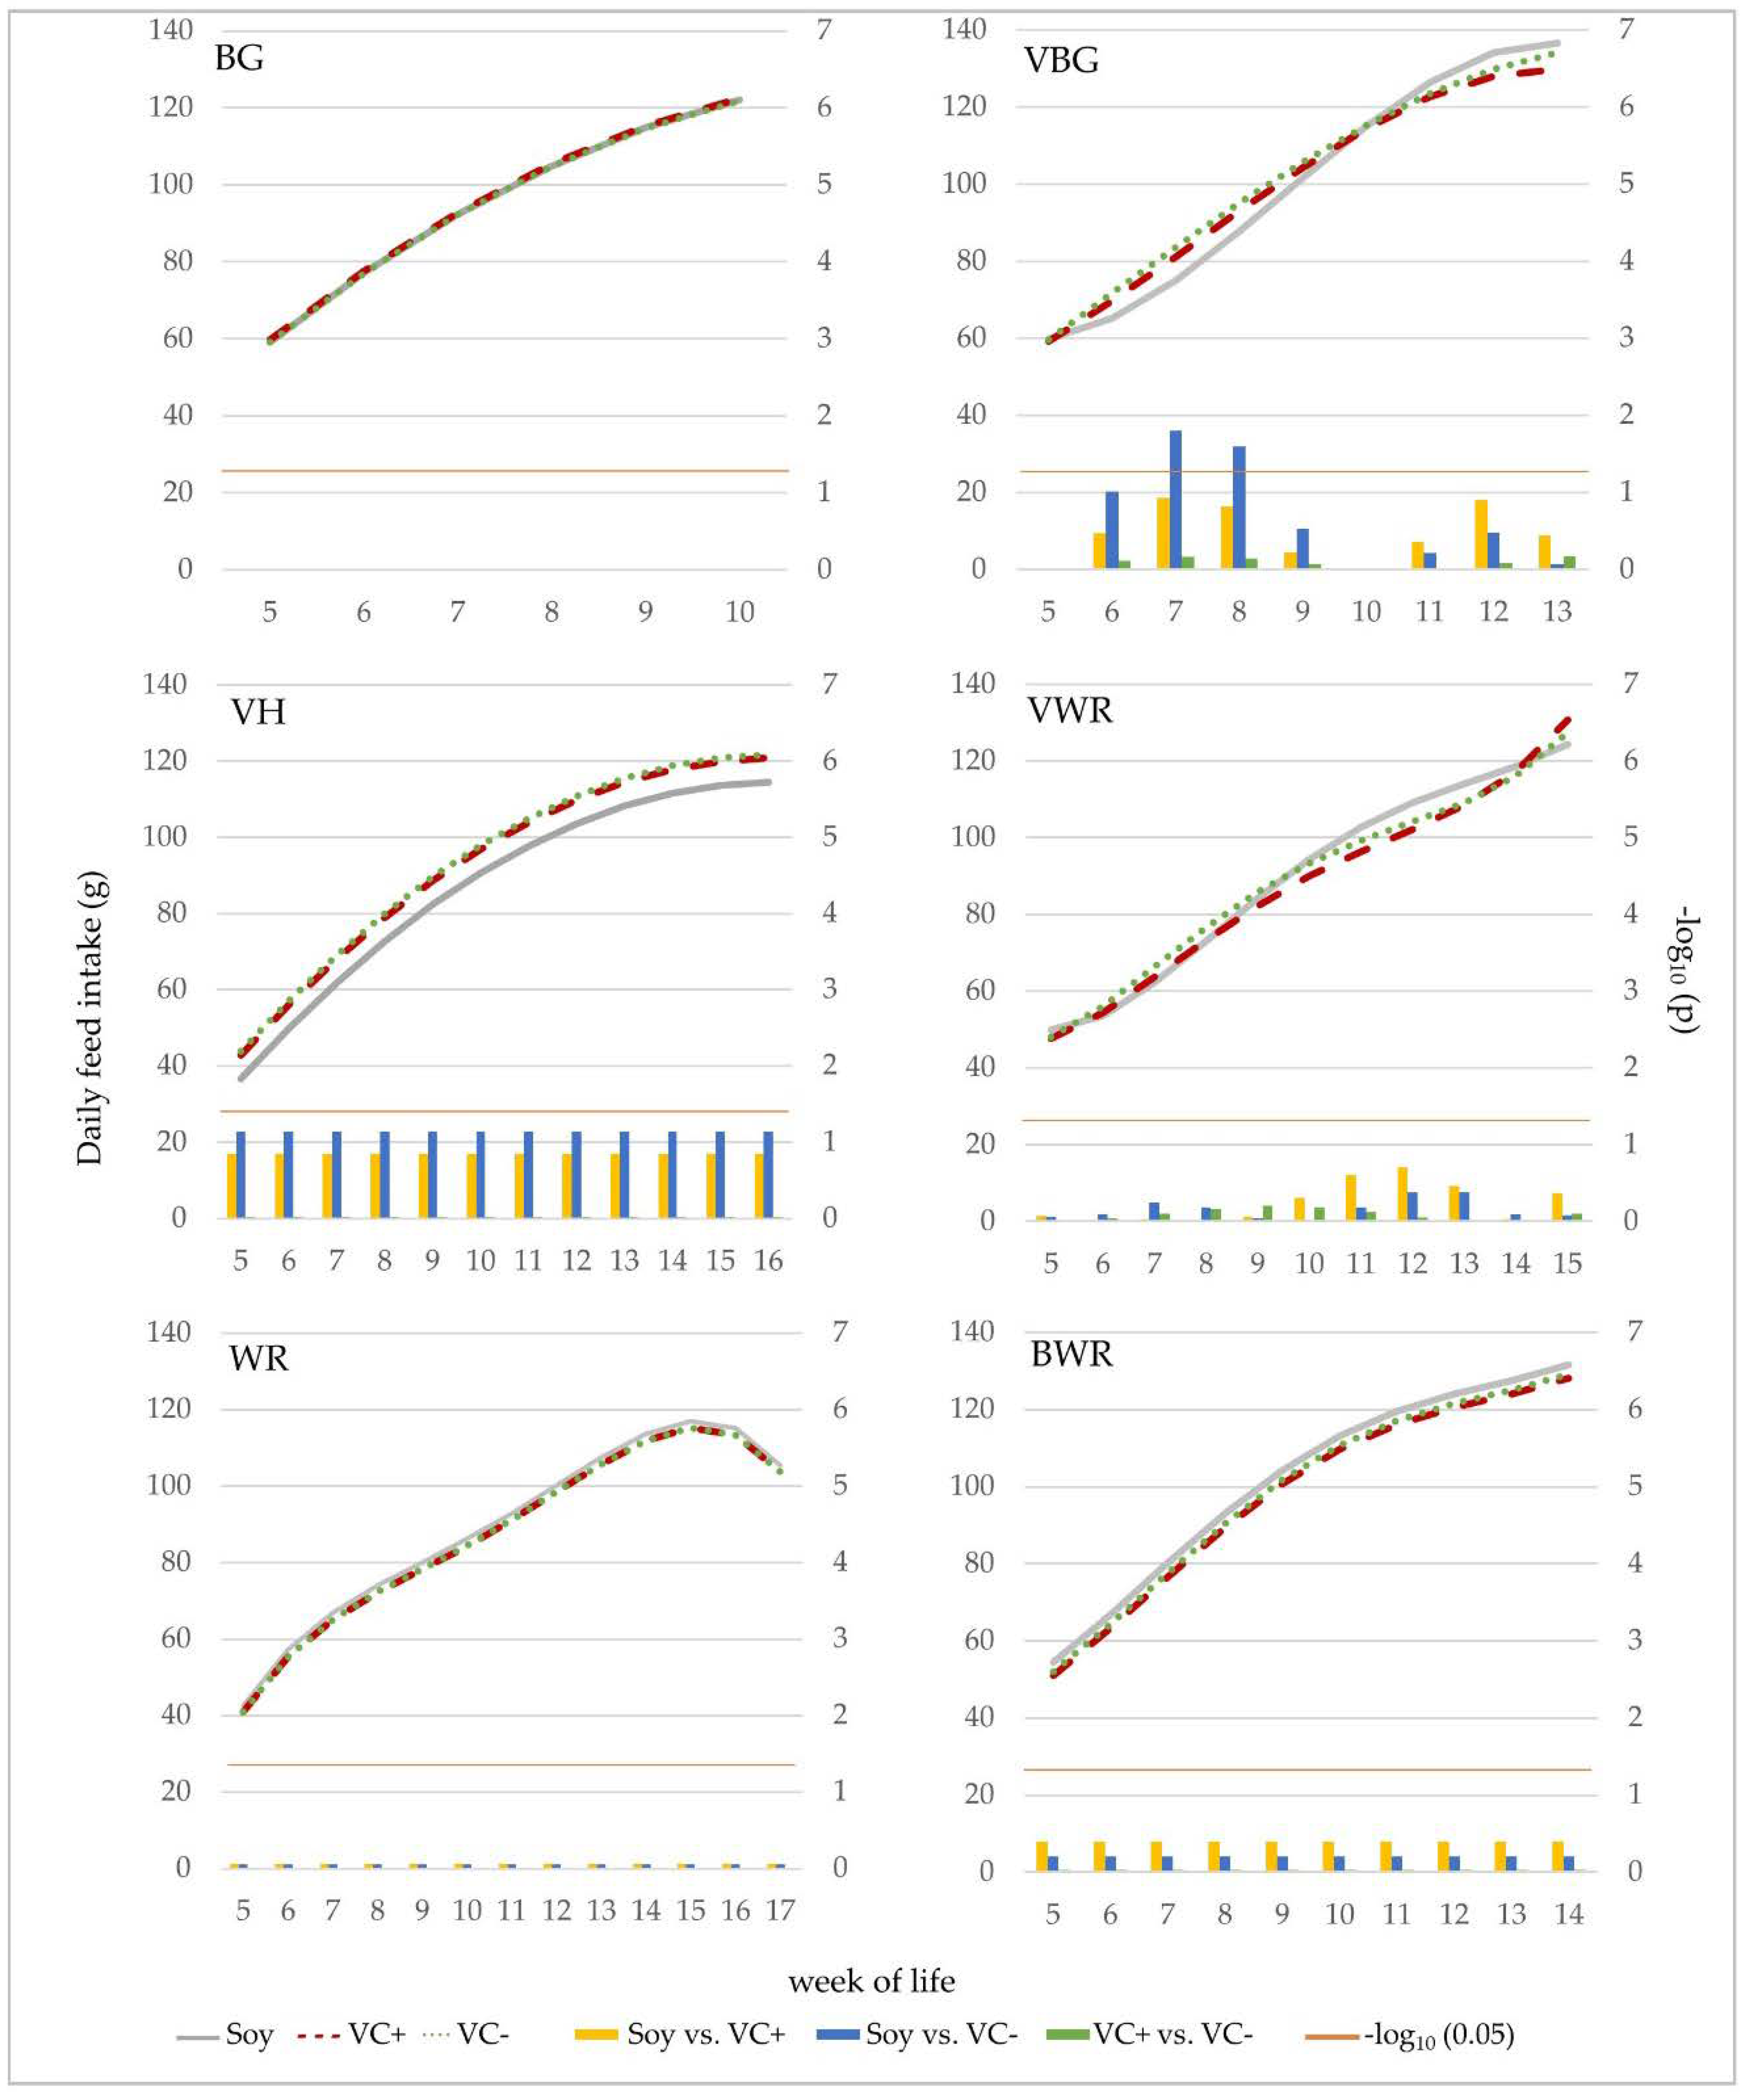
3.3. Feed Intake and Efficiency
3.4. Slaughtering Performance
4. Discussion
5. Conclusions
Author Contributions
Funding
Acknowledgments
Conflicts of Interest
References
- Krautwald-Junghanns, M.-E.; Cramer, K.; Fischer, B.; Förster, A.; Galli, R.; Kremer, F.; Mapesa, E.U.; Meissner, S.; Preisinger, R.; Preusse, G.; et al. Current Approaches to Avoid the Culling of Day-Old Male Chicks in the Layer Industry, with Special Reference to Spectroscopic Methods. Poult. Sci. 2018, 97, 749–757. [Google Scholar] [CrossRef] [PubMed]
- German Federal Statistical Office (Destatis). Geschlüpfte Küken in Deutschland im Zeitraum 2008 bis 2018 nach ausgewählten Geflügelarten. In Fachserie 3, Reihe 4.2.3; German Federal Statistical Office (Detatis): Wiesbaden, Germany, 2019; p. 4. [Google Scholar]
- Hirt, H. Töten männlicher Legeküken—Situationsanalyse Schweiz 2004. Org. eprints 2004, 1–26. [Google Scholar]
- Koenig, M.; Hahn, G.; Damme, K. Nutzung männlicher Legehybriden als Stubenküken: Mastleistung und Schlachtkörperzusammensetzung. Mitteilungsblatt Fleischforsch. Kulmbach 2009, 185, 143–148. [Google Scholar]
- Damme, K.; Ristic, M. Fattening Performance, Meat Yield and Economic Aspects of Meat and Layer Type Hybrids. Worlds Poult. Sci. J. 2003, 59, 50–53. [Google Scholar]
- Kaufmann, F.; Nehrenhaus, U.; Andersson, R. Duale Genetiken als Legehennen für die ökologische Legehennenhaltung. In Ökologischen Landbau weiterdenken: Verantwortung übernehmen, Vertrauen stärken, Beiträge zur 14. Wissenschaftstagung Ökologischer Landbau, Freising-Weihenstephan, 7–10 March 2017; Wolfrum, S., Heuwinkel, H., Reents, H.J., Wiesinger, K., Hülsbergen, K.-J., Eds.; Köster: Berlin, Germany, 2017. [Google Scholar]
- Hahn, G.; Deerberg, F.; Lange, K. Mit Rassegeflügel Fleisch erzeugen? DGS Mag. 1995, 22, 37–40. [Google Scholar]
- Götze, S.; von Lengerken, G. “Alternativ-Ökologische” Eierproduktion: Lassen sich Wirtschaftsgeflügelrassen nutzen? DGS Mag. 1997, 18, 46–49. [Google Scholar]
- German Federal Statistical Office (Destatis). Available online: https://www-genesis.destatis.de/genesis/online/data (accessed on 15 May 2018).
- Barona, E.; Ramankutty, N.; Hyman, G.; Coomes, O.T. The Role of Pasture and Soybean in Deforestation of the Brazilian Amazon. Environ. Res. Lett. 2010, 5, 1–9. [Google Scholar] [CrossRef]
- Hobbs, J.E.; Plunkett, M.D. Genetically Modified Foods: Consumer Issues and the Role of Information Asymmetry. Can. J. Agric. Econ. 1999, 47, 445–455. [Google Scholar] [CrossRef]
- German Federal Ministry of Food and Agriculture (BMEL). Ackerbohne, Erbse und Co. Die Eiweißpflanzenstrategie des Bundesministeriums für Ernährung und Landwirtschaft zur Förderung des Leguminosenanbaus in Deutschland; German Federal Ministry of Agriculture: Berlin, Germany, 2016. [Google Scholar]
- Food and Agriculture Organization of the United Nations (FAO). Faba Bean (Vicia faba). Available online: https://www.feedipedia.org/node/4926 (accessed on 2 March 2020).
- Luzzatto, L.; Arese, P. Favism and glucose-6-phosphate dehydrogenase deficiency. N. Engl. J. Med. 2018, 378, 60–71. [Google Scholar] [CrossRef]
- Duc, G.; Sixdenier, G.; Lila, M.; Furtoss, V. Search of Genetic Variability for Vicine and Convicine Content in Vicia faba L. A First Report of a Gene Which Codes for Nearly Zero-Vicine and Zero-Convicine Contents. In Recent Advances of Research in Antinutritional Factors in Legume Seeds, Proceedings of the First International Workshop on ‘Antinutritional Factors (ANF) in Legume Seeds’, Wageningen, 23–25 November 1988; Huisman, J., van der Poel, A., Liener, I., Eds.; Pudoc: Wageningen, The Netherlands, 1989; pp. 305–312. [Google Scholar]
- German Federal Plant Variety Office. Beschreibende Sortenliste Getreide, Mais, Öl- und Faserpflanzen, Leguminosen, Rüben, Zwischenfrüchte 2019; German Federal Plant Variety Office: Hannover, Germany, 2019; pp. 254–259.
- Olaboro, G.; Marquardt, R.R.; Campbell, L.D.; Fröhlich, A.A. Purification, Identification and Quantification of an Egg-weight-depressing Factor (Vicine) in Fababeans (Vicia faba L.). J. Sci. Food Agric. 1981, 32, 1163–1171. [Google Scholar] [CrossRef]
- Lessire, M.; Gallo, V.; Prato, M.; Akide-Ndunge, O.; Mandili, G.; Marget, P.; Arese, P.; Duc, G. Effects of Faba Beans with Different Concentrations of Vicine and Convicine on Egg Production, Egg Quality and Red Blood Cells in Laying Hens. Animal 2017, 11, 1270–1278. [Google Scholar] [CrossRef] [PubMed]
- Muduuli, D.S.; Marquardt, R.R.; Guenter, W. Effect of Dietary Vicine and Vitamin E Supplementation on the Productive Performance of Growing and Laying Chickens. Br. J. Nutr. 1982, 47, 53–60. [Google Scholar] [CrossRef] [PubMed]
- Halle, I. Einfluss gestaffelter Anteile von je zwei Erbsen- und Ackerbohnensorten im Legehennenfutter auf die Leistungsmerkmale. Landbauforsch. Völkenrode 2005, 55, 149–155. [Google Scholar]
- Rubio, L.A.; Brenes, A.; Castaño, M. The Utilization of Raw and Autoclaved Faba Beans (Vicia faba L., Var. Minor) and Faba Bean Fractions in Diets for Growing Broiler Chickens. Br. J. Nutr. 1990, 63, 419–430. [Google Scholar] [CrossRef]
- Laudadio, V.; Ceci, E.; Tufarelli, V. Productive Traits and Meat Fatty Acid Profile of Broiler Chickens Fed Diets Containing Micronized Fava Beans (Vicia faba L. Var. Minor) as the Main Protein Source. J. Appl. Poult. Res. 2011, 20, 12–20. [Google Scholar] [CrossRef]
- Vilariño, M.; Métayer, J.P.; Crépon, K.; Duc, G. Effects of Varying Vicine, Convicine and Tannin Contents of Faba Bean Seeds (Vicia faba L.) on Nutritional Values for Broiler Chicken. Anim. Feed Sci. Technol. 2009, 150, 114–121. [Google Scholar] [CrossRef]
- Abel, H.; Gerken, M. Ackerbohnen als Futterkomponente des ökologischen Landbaus für Masthühner-Elterntiere und verschiedene Mastbroilerherkünfte. Org. eprints 2004, 1–65. Available online: https://orgprints.org/8941/ (accessed on 23 March 2018). (In German).
- Woyengo, T.A.; Nyachoti, C.M. Ileal Digestibility of Amino Acids for Zero-Tannin Faba Bean (Vicia faba L.) Fed to Broiler Chicks. Poult. Sci. 2012, 91, 439–443. [Google Scholar] [CrossRef]
- Wilson, B.J.; McNab, J.M. The Effect of Autoclaving and Methionine Supplementation on the Growth of Chicks given Diets Containing Field Beans (Vicia faba L.). Br. Poult. Sci. 1972, 13, 67–73. [Google Scholar] [CrossRef]
- Ivarsson, E.; Wall, H. Effects of Toasting, Inclusion Levels and Different Enzyme Supplementations of Faba Beans on Growth Performance of Broiler Chickens. J. Appl. Poult. Res. 2017, 26, 467–475. [Google Scholar] [CrossRef]
- Gous, R.M. Evaluation of Dehulled Faba Bean (Vicia faba Cv. Fiord) as a Protein Source for Broilers. S. Afr. J. Anim. Sci. 2011, 41, 71–78. [Google Scholar] [CrossRef]
- Initiative zur Erhaltung alter Geflügelrassen e.V. Leistungsdaten Vorwerkhuhn. Available online: https://erhaltungszucht-gefluegel.de/index.php?id=39 (accessed on 16 August 2018).
- Schultz, S. Gefluegel-Erhaltungszucht.de—Die Bresse-Gauloise. Available online: http://www.gefluegel-erhaltungszucht.de/bresse-gauloise/ (accessed on 22 May 2018).
- Weigend, S.; Stricker, K.; Röhrssen, F.G. Establishing a Conservation Flock for “Vorwerkhuhn” Chicken Breed—a Case Study of in-Situ Conservation of Local Chicken Breeds in Germany. Anim. Genet. Ressources Inf. 2009, 44, 87–88. [Google Scholar] [CrossRef]
- Association of German Agricultural Analytic and Research Institutes (VDLUFA). Handbuch der landwirtschaftlichen Versuchs- und Untersuchungsmethodik (VDLUFA-Methodenbuch), Bd. III. Die chemische Untersuchung von Futtermitteln; VDLUFA-Publishing: Darmstadt, Germany, 1976. [Google Scholar]
- World Poultry Science Associaton (WPSA). The Prediction of Apparent Metabolizable Energy Values for Poultry in Compound Feeds. Worlds Poult. Sci. J. 1984, 40, 181–182. [Google Scholar]
- Köhn, F.; Sharifi, A.R.; Simianer, H. Modeling the Growth of the Goettingen Minipig. J. Anim. Sci. 2007, 85, 84–92. [Google Scholar] [CrossRef]
- Littel, R.C.; Milliken, G.A.; Stroup, W.W.; Wolfinger, R.D. SAS System for Mixed Models, 4th ed.; SAS Institute Inc.: Cary, NC, USA, 2000. [Google Scholar]
- Farrell, D.J.; Perez-Maldonado, R.A.; Mannion, P.F. Optimum Inclusion of Field Peas, Faba Beans, Chick Peas and Sweet Lupins in Poultry Diets. II. Broiler Experiments. Br. Poult. Sci. 1999, 40, 674–680. [Google Scholar] [CrossRef]
- Koivunen, E.; Tuunainen, P.; Rossow, L.; Valaja, J. Nutritive Value of Faba Bean (Vicia faba L.) Diets for Broilers. In Proceedings of the 19th European Symposium on Poultry Nutriton, Potsdam, Germany, 26–29 August 2013; World’s Poultry Science Association: Potsdam, Germany, 2013. [Google Scholar]
- Moschini, M.; Masoero, F.; Prandini, A.; Fusconi, G.; Morlacchini, M.; Piva, G. Raw Pea (Pisum Sativum), Raw Faba Bean (Vicia faba var. minor) and Raw Lupin (Lupinus albus var. multitalia) as Alternative Protein Sources in Broiler Diets. Ital. J. Anim. Sci. 2005, 4, 59–69. [Google Scholar] [CrossRef]
- Dal Bosco, A.; Ruggeri, S.; Mattioli, S.; Mugnai, C.; Sirri, F.; Castellini, C. Effect of Faba Bean (Vicia faba Var. Minor) Inclusion in Starter and Growing Diet on Performance, Carcass and Meat Characteristics of Organic Slow-Growing Chickens. Ital. J. Anim. Sci. 2013, 12, 472–478. [Google Scholar] [CrossRef]
- Usayran, N.N.; Sha’ar, H.; Barbour, G.W.; Yau, S.K.; Maalouf, F.; Farran, M.T. Nutritional Value, Performance, Carcass Quality, Visceral Organ Size, and Blood Clinical Chemistry of Broiler Chicks Fed 30% Tannin-Free Fava Bean Diets. Poult. Sci. 2014, 93, 2018–2027. [Google Scholar] [CrossRef]
- Jeroch, H.; Lipiec, A.; Abel, H.; Zentek, J.; Grela, E.R.; Bellof, G. Körnerleguminosen als Futter- und Nahrungsmittel; DLG Verlag: Frankfurt (Main), Germany, 2016. (In German) [Google Scholar]
- Muth, P.C.; Ghaziani, S.; Klaiber, I.; Valle Zárate, A. Are Carcass and Meat Quality of Male Dual-Purpose Chickens Competitive Compared to Slow-Growing Broilers Reared under a Welfare-Enhanced Organic System? Org. Agric. 2018, 8, 57–68. [Google Scholar] [CrossRef]
- Pinent, T.; Reis, L.; König, J.D.S. Vergleich von Merkmalen der Mast- und Schlachtleistung sowie von Überlebensraten bedrohter Hühnerrassen in einem standardisierten Versuchsdesign. Züchtungskunde 2015, 87, 423–436. (In German) [Google Scholar]
- Lambertz, C.; Wuthijaree, K.; Gauly, M. Performance, Behavior, and Health of Male Broilers and Laying Hens of 2 Dual-Purpose Chicken Genotypes. Poult. Sci. 2018, 97, 3564–3576. [Google Scholar] [CrossRef] [PubMed]
- Siekmann, L.; Meier-Dinkel, L.; Janisch, S.; Altmann, B.; Kaltwasser, C.; Sürie, C.; Krischek, C. Carcass Quality, Meat Quality and Sensory Properties of the Dual-Purpose Chicken Lohmann Dual. Foods 2018, 7, 156. [Google Scholar] [CrossRef] [PubMed]
- Aviagen Group. Ross 308 AP Broiler: Performance Objectives; Aviagen Group: Huntsville, AL, USA, 2017; p. 4. [Google Scholar]
- Lichovníková, M.; Jandásek, J.; Jürzl, M.; Dračková, E. The Meat Quality of Layer Males from Free Range in Comparison with Fast Growing Chickens. Czech J. Anim. Sci. 2009, 54, 490–497. [Google Scholar] [CrossRef]
- Mueller, S.; Kreuzer, M.; Siegrist, M.; Mannale, K.; Messikommer, R.E.; Gangnat, I.D.M. Carcass and Meat Quality of Dual-Purpose Chickens (Lohmann Dual, Belgian Malines, Schweizerhuhn) in Comparison to Broiler and Layer Chicken Types. Poult. Sci. 2018, 97, 3325–3336. [Google Scholar] [CrossRef]
- Perella, F.; Mugnai, C.; Dal Bosco, A.; Sirri, F.; Cestola, E.; Castellini, C. Faba Bean (Vicia faba var. minor) as a Protein Source for Organic Chickens: Performance and Carcass Characteristics. Ital. J. Anim. Sci. 2010, 8, 575–584. [Google Scholar] [CrossRef]
- Giersberg, M.F.; Kemper, N. Rearing Male Layer Chickens: A German Perspective. Agriculture 2018, 8, 176. [Google Scholar] [CrossRef]


| Item | Experiment A | Experiment B | ||||
|---|---|---|---|---|---|---|
| Soy | VC+ | VC− | Soy | VC+ | VC− | |
| Ingredient (%) | ||||||
| Wheat | 30.0 | 8.00 | 8.00 | 30.0 | 8.00 | 8.00 |
| Corn | 36.0 | 25.2 | 25.2 | 36.0 | 25.2 | 25.2 |
| Soybean meal | 24.4 | 24.4 | ||||
| Blue sweet lupine cv. Boruta | 28.6 | 28.6 | 28.6 | 28.6 | ||
| Field pea cv. Astronaute | 10.5 | 10.5 | 10.5 | 10.5 | ||
| Field bean cv. Fuego | 20.2 | 20.2 | ||||
| Field bean cv. Tiffany | 20.2 | 20.2 | ||||
| Grass meal | 5.6 | 0.1 | 0.1 | 5.6 | 0.1 | 0.1 |
| Soybean oil | 0.2 | 2.7 | 2.7 | 0.2 | 2.7 | 2.7 |
| Dicalcium phosphate | 1.3 | 2.2 | 2.2 | 1.3 | 2.2 | 2.2 |
| Calcium carbonate | 1.0 | 0.7 | 0.7 | 1.0 | 0.7 | 0.7 |
| Cattle salt (NaCl) | 0.3 | 0.4 | 0.4 | 0.3 | 0.4 | 0.4 |
| DL-Methionine | 0.2 | 0.4 | 0.4 | 0.2 | 0.4 | 0.4 |
| Broilerpremix 1 | 1.0 | 1.0 | 1.0 | 1.0 | 1.0 | 1.0 |
| Chemical analysis | ||||||
| Dry matter abs (%) | 90.0 | 90.3 | 90.1 | 89.7 | 90.1 | 90.2 |
| Ash (g/kg DM) | 67.6 | 64.5 | 64.9 | 67.3 | 64.3 | 67.0 |
| Crude protein (g/kg DM) | 211.6 | 220.5 | 228.3 | 213.0 | 213.1 | 214.3 |
| Crude fat (g/kg DM) | 29.7 | 56.2 | 58.7 | 33.5 | 67.0 | 67.3 |
| Crude fibre (g/kg DM) | 43.8 | 60.4 | 68.5 | 45.2 | 72.0 | 74.0 |
| NDF (g/kg DM) | 123.3 | 124.2 | 132.7 | 148.5 | 128.9 | 136.6 |
| Starch (g/kg DM) | 472.2 | 423.7 | 402.6 | 480.2 | 416.6 | 413.1 |
| Sugar (g/kg DM) | 40.7 | 35.2 | 33.0 | 37.0 | 33.5 | 32.3 |
| SFA (g/100g fat) | 17.4 | 15.2 | 15.4 | 13.6 | 14.9 | 14.6 |
| MUFA (g/100g fat) | 22.7 | 26.6 | 26.6 | 24.4 | 26.7 | 26.8 |
| PUFA (g/100g fat) | 59.9 | 58.2 | 58.0 | 62.1 | 58.3 | 58.6 |
| Methionine (%) | 0.49 | 0.48 | 0.43 | 0.46 | 0.50 | 0.49 |
| Cysteine (%) | 0.30 | 0.27 | 0.29 | 0.29 | 0.29 | 0.30 |
| Lysine (%) | 0.97 | 1.01 | 1.07 | 0.90 | 1.08 | 1.09 |
| Threonine (%) | 0.71 | 0.66 | 0.69 | 0.68 | 0.69 | 0.69 |
| Vicin (%) | 0.005 | 0.095 | 0.016 | 0.00 | 0.094 | 0.013 |
| Convicin (%) | 0.003 | 0.043 | 0.006 | 0.00 | 0.042 | 0.003 |
| VC (Vicin + Convicin; %) | 0.008 | 0.138 | 0.022 | 0.00 | 0.136 | 0.016 |
| Tannin (mg/g) | 4.22 | 4.48 | 4.01 | 3.74 | 3.39 | 3.89 |
| Calculated energy content | ||||||
| AMEn (MJ/kg) | 14.1 | 14.3 | 14.1 | 12.9 | 13.0 | 12.9 |
| Genotype | Effect | Type III Sum of Squares | |
|---|---|---|---|
| F Statistic | p Value | ||
| BG | FG | 0.98 | 0.4128 |
| Age | 0.80 | 0.3721 | |
| Age 2 | 5.42 | 0.0202 | |
| Age 3 | 5.40 | 0.0205 | |
| Start | 465.46 | <0.0001 | |
| VH | FG | 1.11 | 0.3396 |
| Age | 1490.51 | <0.0001 | |
| Age 2 | 197.13 | <.0001 | |
| Age × FG | 2.73 | 0.0656 | |
| Start | 524.32 | <0.0001 | |
| WR | FG | 2.24 | 0.1406 |
| Age | 54.46 | <0.0001 | |
| Age 2 | 339.34 | <0.0001 | |
| Age 3 | 405.57 | <0.0001 | |
| Age × FG | 17.64 | <0.0001 | |
| Start | 17.64 | <0.0001 | |
| VBG | FG | 4.23 | 0.0277 |
| Age | 16.96 | <0.0001 | |
| Age 2 | 14.71 | 0.0001 | |
| Age 3 | 23.08 | <0.0001 | |
| Age 4 | 32.76 | <0.0001 | |
| Age × FG | 4.11 | 0.0166 | |
| Start | 255.28 | <0.0001 | |
| VWR | FG | 5.54 | 0.0161 |
| Age | 8.71 | 0.0032 | |
| Age 2 | 3.82 | 0.0509 | |
| Age 3 | 10.43 | 0.0013 | |
| Age 4 | 19.87 | <0.0001 | |
| Age × FG | 18.35 | <0.0001 | |
| Start | 439.35 | <0.0001 | |
| BWR | FG | 10.94 | 0.0034 |
| Age | 8.75 | 0.0032 | |
| Age 2 | 6.33 | 0.0120 | |
| Age 3 | 11.72 | 0.0006 | |
| Age 4 | 18.48 | <0.0001 | |
| Start | 236.78 | <0.0001 | |
| Purebreds | Crossbreds | |||||
|---|---|---|---|---|---|---|
| BG | VH | WR | VBG | VWR | BWR | |
| Soy | 34.9 ± 0.6 | 21.8 ± 0.6 | 22.1 ± 0.6 | 27.8 ± 0.5 | 23.2 ± 0.5 | 27.2 ± 0.6 |
| VC+ | 35.3 ± 0.6 | 21.4 ± 0.6 | 22.1 ± 0.6 | 27.7 ± 0.5 | 22.5 ± 0.5 | 27.8 ± 0.6 |
| VC− | 35.7 ± 0.6 | 22.2 ± 0.6 | 21.2 ± 0.6 | 27.7 ± 0.5 | 23.0 ± 0.5 | 27.6 ± 0.6 |
| Purebreds | Crossbreds | ||||||
|---|---|---|---|---|---|---|---|
| BG | VH | WR | VBG | VWR | BWR | ||
| FCR | Soy | 2.57 ± 0.03 | 3.93 ± 0.28 | 3.97 ± 0.09 | 3.42 ± 0.15 | 3.76 ± 0.13 | 3.75 ± 0.82 |
| VC+ | 2.58 ± 0.03 | 4.25 ± 0.28 | 4.04 ± 0.09 | 3.23 ± 0.15 | 3.76 ± 0.13 | 3.42 ± 0.82 | |
| VC− | 2.54 ± 0.03 | 4.39 ± 0.28 | 4.01 ± 0.09 | 3.56 ± 0.15 | 3.89 ± 0.13 | 3.53 ± 0.82 | |
| DFI | Soy | 95.2 ± 1.6 | 86.9 ± 2.3 | 89.0 ± 2.5 | 95.6 ± 1.5 | 86.7 ± 2.6 | 96.1 ± 1.9 |
| VC+ | 95.7 ± 1.6 | 93.2 ± 2.3 | 87.2 ± 2.5 | 94.7 ± 1.6 | 84.2 ± 2.6 | 92.6 ± 1.9 | |
| VC− | 95.1 ± 1.6 | 94.2 ± 2.3 | 87.3 ± 2.5 | 96.1 ± 1.5 | 85.4 ± 2.6 | 93.6 ± 1.9 | |
| Purebreds | Crossbreds | |||||
|---|---|---|---|---|---|---|
| BG | VH | WR | VBG | VWR | BWR | |
| Soy | 2.57 ± 0.06 a | 2.76 ± 0.06 a,b | 2.86 ± 0.06 b | 2.77 ± 0.06 a,b | 2.90 ± 0.06 b | 2.79 ± 0.06 a,b |
| VC+ | 2.58 ± 0.06 | 2.90 ± 0.06 | 2.86 ± 0.06 | 2.75 ± 0.06 | 2.83 ± 0.06 | 2.70 ± 0.06 |
| VC− | 2.54 ± 0.06 a | 2.79 ± 0.06 a,b | 2.80 ± 0.06 a,b | 2.77 ± 0.06 a,b | 3.00 ± 0.06 b | 2.74 ± 0.06 a,b |
| 2.56 ± 0.04 a | 2.82 ± 0.04 b,c | 2.84 ± 0.04 b,c | 2.76 ± 0.04 b,c | 2.91 ± 0.04 c | 2.74 ± 0.04 b | |
| Feed | Live Weight | Carcass Weight | Yield | Breast Weight | Breast Percentage | Leg Weight | Leg Percentage | |
|---|---|---|---|---|---|---|---|---|
| (g) | (g) | (%) | (g) | (%) | (g) | (%) | ||
| BG | Soy | 1883 ± 14 | 1272 ± 18 | 67.5 ± 0.5 | 170 ± 3 | 13.3 ± 0.1 | 405 ± 9 | 31.8 ± 0.3 |
| VC+ | 1888 ± 14 | 1262 ± 18 | 67.1 ± 0.5 | 163 ± 3 | 12.9 ± 0.1 | 398 ± 9 | 31.5 ± 0.3 | |
| VC− | 1905 ± 14 | 1269 ± 18 | 66.3 ± 0.5 | 165 ± 3 | 13.0 ± 0.1 | 406 ± 9 | 32.0 ± 0.3 | |
| VH | Soy | 2164 ± 21 | 1442 ± 32 | 69.5 ± 0.3 | 155 ± 5 | 10.8 ± 0.2 | 478 ± 12 | 33.1 ± 0.4 |
| VC+ | 2139 ± 21 | 1407 ± 32 | 69.5 ± 0.3 | 152 ± 5 | 10.8 ± 0.2 | 465 ± 12 | 33.0 ± 0.4 | |
| VC− | 2196 ± 21 | 1448 ± 32 | 69.0 ± 0.3 | 156 ± 5 | 10.7 ± 0.2 | 478 ± 12 | 32.9 ± 0.4 | |
| WR | Soy | 2308 ± 21 | 1571 ± 32 | 68.7 ± 0.5 | 169 ± 7 | 10.7 ± 0.3 | 538 ± 8 | 34.3 ± 0.4 |
| VC+ | 2279 ± 21 | 1573 ± 32 | 69.1 ± 0.5 | 170 ± 7 | 10.8 ± 0.3 | 538 ± 8 | 34.2 ± 0.4 | |
| VC− | 2233 ± 21 | 1518 ± 32 | 69.5 ± 0.5 | 161 ± 7 | 10.6 ± 0.3 | 519 ± 8 | 34.2 ± 0.4 | |
| VBG | Soy | 2114 ± 25 | 1431 ± 25 | 68.7 ± 0.3 | 170 ± 4 | 11.9 ± 0.2 | 479 ± 10 | 33.5 ± 0.2 |
| VC+ | 2124 ± 25 | 1481 ± 22 | 68.5 ± 0.2 | 170 ± 4 | 11.5 ± 0.2 | 505 ± 9 | 33.9 ± 0.2 | |
| VC− | 2122 ± 25 | 1482 ± 25 | 68.8 ± 0.3 | 176 ± 4 | 11.8 ± 0.2 | 498 ± 10 | 33.6 ± 0.2 | |
| VWR | Soy | 2081 ± 22 | 1431 ± 18 | 69.4 ± 0.3 | 162 ± 4 | 11.3 ± 0.2 | 492 ± 12 | 34.4 ± 0.3 |
| VC+ | 2042 ± 22 | 1407 ± 19 | 69.3 ± 0.3 | 159 ± 4 | 11.3 ± 0.2 | 487 ± 12 | 34.5 ± 0.3 | |
| VC− | 2052 ± 22 | 1412 ± 18 | 68.6 ± 0.3 | 158 ± 4 | 11.2 ± 0.2 | 488 ± 12 | 34.5 ± 0.3 | |
| BWR | Soy | 2195 ± 20 b | 1505 ± 27 b | 68.9 ± 0.3 | 175 ± 4 b | 11.6 ± 0.2 | 521 ± 10 b | 34.6 ± 0.2 |
| VC+ | 2299 ± 20 a | 1604 ± 26 a | 69.9 ± 0.3 | 192 ± 4 a | 12.0 ± 0.2 | 559 ± 10 a | 34.9 ± 0.2 | |
| VC− | 2271 ± 20 a | 1573 ± 26 a,b | 69.5 ± 0.3 | 185 ± 4 a,b | 11.7 ± 0.2 | 547 ± 10 a,b | 34.7 ± 0.2 |
© 2020 by the authors. Licensee MDPI, Basel, Switzerland. This article is an open access article distributed under the terms and conditions of the Creative Commons Attribution (CC BY) license (http://creativecommons.org/licenses/by/4.0/).
Share and Cite
Nolte, T.; Jansen, S.; Weigend, S.; Moerlein, D.; Halle, I.; Link, W.; Hummel, J.; Simianer, H.; Sharifi, A.R. Growth Performance of Local Chicken Breeds, a High-Performance Genotype and Their Crosses Fed with Regional Faba Beans to Replace Soy. Animals 2020, 10, 702. https://doi.org/10.3390/ani10040702
Nolte T, Jansen S, Weigend S, Moerlein D, Halle I, Link W, Hummel J, Simianer H, Sharifi AR. Growth Performance of Local Chicken Breeds, a High-Performance Genotype and Their Crosses Fed with Regional Faba Beans to Replace Soy. Animals. 2020; 10(4):702. https://doi.org/10.3390/ani10040702
Chicago/Turabian StyleNolte, Tanja, Simon Jansen, Steffen Weigend, Daniel Moerlein, Ingrid Halle, Wolfgang Link, Jürgen Hummel, Henner Simianer, and Ahmad Reza Sharifi. 2020. "Growth Performance of Local Chicken Breeds, a High-Performance Genotype and Their Crosses Fed with Regional Faba Beans to Replace Soy" Animals 10, no. 4: 702. https://doi.org/10.3390/ani10040702
APA StyleNolte, T., Jansen, S., Weigend, S., Moerlein, D., Halle, I., Link, W., Hummel, J., Simianer, H., & Sharifi, A. R. (2020). Growth Performance of Local Chicken Breeds, a High-Performance Genotype and Their Crosses Fed with Regional Faba Beans to Replace Soy. Animals, 10(4), 702. https://doi.org/10.3390/ani10040702