Article

Construction and Operation of a Respiration Chamber of the Head-Box Type for Methane Measurement from Cattle

by
Octavio Alonso Castelán Ortega
1,*,
Paulina Elizabeth Pedraza Beltrán
1,
Gloria Stefanny Hernández Pineda
1,
Mohammed Benaouda
1,†,
Manuel González Ronquillo
1,
Luisa T Molina
2,
Juan Carlos Ku Vera
3,
Hugo Daniel Montelongo Pérez
1 and
María Fernanda Vázquez Carrillo
1
1
Facultad de Medicina Veterinaria y Zootecnia, Instituto Literario 100, Universidad Autónoma del Estado de México, Colonia Centro, 50000 Toluca, Estado de México, Mexico
2
Molina Center for Strategic Studies in Energy and the Environment, La Jolla, CA 92037, USA
3
Facultad de Medicina Veterinaria y Zootecnia, Universidad Autónoma de Yucatán, Carretera Mérida-Xmatkuil km 15.5, 97100 Mérida, Yucatán, Mexico
*
Author to whom correspondence should be addressed.
Current address: AgroSup Dijon, F-21079 Dijon Cedex France - INRA, UMR1213 Herbivores, F-63122, Saint-Genès-Champanelle, France - Clermont Université, VetAgro Sup, BP 10448, F-63000 Clermont-Ferrand, France.
Animals 2020, 10(2), 227; https://doi.org/10.3390/ani10020227
Submission received: 10 January 2020 / Revised: 26 January 2020 / Accepted: 26 January 2020 / Published: 31 January 2020

Abstract

:

Simple Summary

The aim of the present work is to describe the construction and operation of a respiration chamber of the head-box type for measuring methane emissions from bovines. Methane is a greenhouse gas 28 times more potent than CO2 in its capacity of producing the greenhouse effect and global warming. This gas is produced in considerable amounts by cattle as part of its normal digestion process; approximately 37% of the global anthropogenic methane emissions originate from the livestock industry. Measuring emissions of methane by cattle is necessary for inventory calculation and the evaluation of mitigation policies of this gas. The gold standard technique for measuring methane emissions from cattle is the respiration chamber; however, respiration chambers are expensive pieces of equipment that are not easily available for developing countries. Since a large proportion of the world’s cattle population is in the developing countries, a cheaper option is necessary. A respiration chamber of the head-box type is an option because of its low cost and high accuracy in estimating emissions. This chamber can be used to determine in vivo methane emission factors for those countries that do not have full respiration chambers. It can also be used to conduct experiments to evaluate the anti-methanogenic effects of different compounds.

Abstract

This paper aims to describe the construction and operation of a respiration chamber of the head-box type for methane (CH4) measurements in bovines. The system consists of (1) a head box with a stainless steel frame and acrylic walls, floor, and ceiling; (2) a stainless steel feeder; (3) an automatic drinking water bowl; (4) a hood made from reinforced canvas; (5) an infrared (IR) CH4 gas analyzer, a mass flow generator, a data-acquisition system; and (6) a steel metabolic box. Six assays were conducted to determine the pure CH4 recovery rate of the whole system in order to validate it and comply with standards of chamber operation. The gravimetrical method was used for the recovery test and the recovery rate obtained was 1.04 ± 0.05. Once the system was calibrated, measurements of CH4 were conducted using eight animals consisting of four Holstein cows with a live weight of 593.8 ± 51 kg and an average milk yield of 23.3 ± 1.8 kg d−1 and four heifers with a live weight of 339 ± 28 kg. The CH4 production values were 687 ± 123 and 248 ± 40 L CH4 d−1 for cows and heifers, respectively. The CH4 yield was 19.7 ± 3.4 g and 17.1 ± 3.4 g CH4 kg−1 of dry matter consumed for cows and heifers, respectively. These results are consistent with those reported in the literature.

1. Introduction

Recently, there has been growing global concern regarding the interlinkage of climate change and air quality, thus inspiring many investigations into evaluating the effects of greenhouse gases (GHGs) on the environment. Cattle are responsible for approximately 53% of GHG emissions from agricultural sources, with approximately 87.4 million tons of CO2 eq. being emitted worldwide in 2012 [1,2]. A significant portion of environmental GHG emissions derives from the process of rumen fermentation that constitutes a highly specialized type of energy metabolism by strictly anaerobic Archean methanogenic prokaryotes [3] found in the digestive tract of ruminants. It has been estimated that approximately 37% of the world’s CH4 emissions are produced by the livestock sector [4]. In recent years, interest in accurately measuring these emissions and developing emission inventories to support GHG-mitigation strategies has increased. On the other hand, the complexity and variation among livestock production systems and the high cost of the analytical equipment make quantifying GHG emissions difficult in developing and underdeveloped countries.
In Mexico, GHG inventories have been carried out since 1997 with contrasting results. The estimated CH4 emissions from livestock enteric fermentation were determined using the methodology proposed by the Intergovernmental Panel on Climate Change [5] Tier 1, which is based on the use of default emission factors for different categories of animals. In 2015, the Tier 1 inventory reported by the National Institute of Ecology and Climate Change-Ministry Environment and Natural Resources of Mexico (INECC-SEMARNAT) [6] for methane emissions from the enteric fermentation of cattle in Mexico was of 1710 Gigagrams year−1. In contrast, Castelán-Ortega et al. [7] reported an inventory of 2028 Gg year−1 by using a mechanistic model to simulate CH4 emissions from the enteric fermentation of cattle. Few scientific studies have addressed the CH4 emissions from cattle in Mexico, and their results are inconsistent. For example, Ruiz-Suárez and González-Avalos [8] estimated the CH4 emissions produced by cattle using a mathematical model, modifying the The Intergovernmental Panel on Climate Change (IPCC) Tier I methodology and calculating the energy consumption based on cattle live weight. They found that, nationwide, dairy cattle produced 288 Gg of CH4 in 1995, while INECC-SEMARNAT [6] reported an emission of about 241 Gg year−1 also for dairy cattle, despite increased cattle population. In contrast, Rendón-Huerta et al. [9] estimated CH4 emissions using the methodologies proposed by IPCC Tier II, the model of Moe and Tyrrell [10], and a mechanistic model (COWPOLL), and found that the CH4 emissions were 17.5%, 32.7%, and 69.4%, respectively, lower than those reported by Ruiz-Suárez and González-Avalos [8] for that particular year. Rendón-Huerta et al. [9] predicted that in 2020, CH4 production from lactating dairy cows alone in Mexico could increase to 2780 Gg year−1.
As described above, substantial disparities persist in the existing inventories, resulting in high uncertainty. This uncertainty can be attributed to the fact that in Mexico, the production of CH4 by cattle had not been measured in vivo, and therefore, the in vivo emission factors had not been determined. The high cost of acquiring and constructing the equipment associated with laboratories has impeded the conduction of experiments to determine the emission factors, which are needed to yield better inventories and reduce the degree of uncertainty. Respiration chambers of the head-box type offer the opportunity for measuring CH4 emissions but at a fraction of the cost of a full chamber and with similar precision.
The objective of this study is to describe the design, construction and implementation of a respiration chamber of the head-box type to measure emissions of CH4 produced by cattle.

2. Materials and Methods

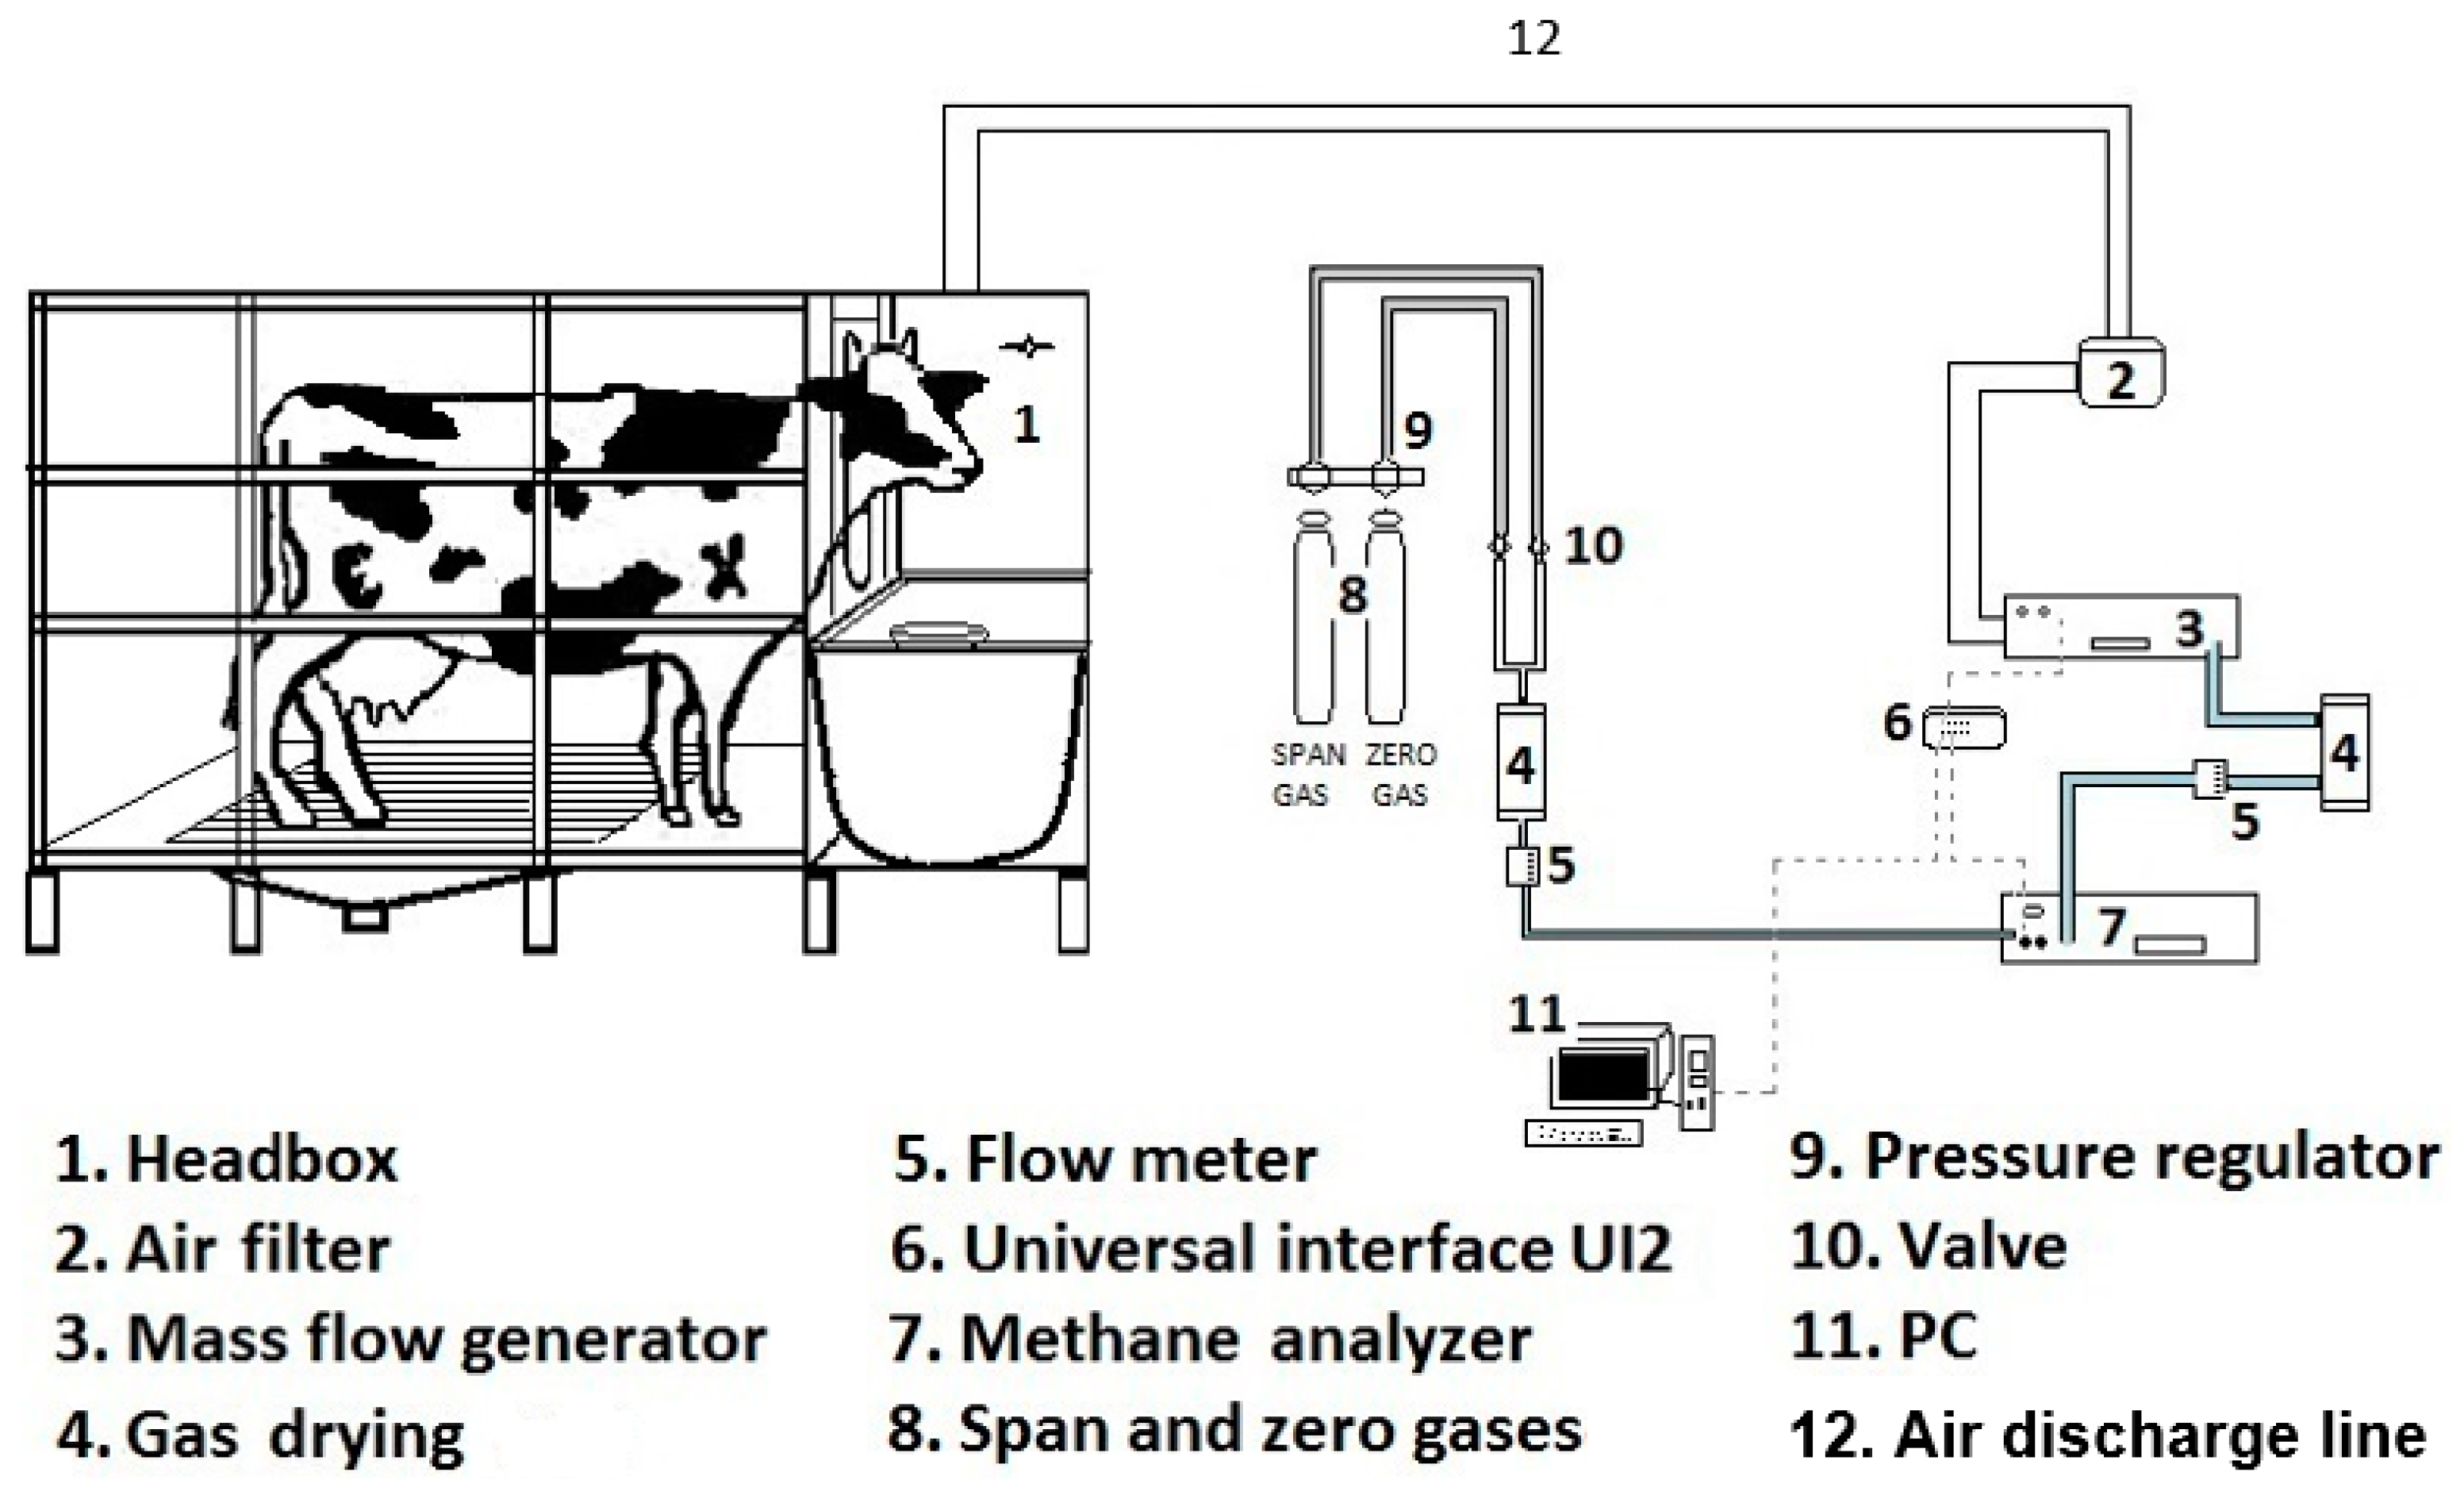
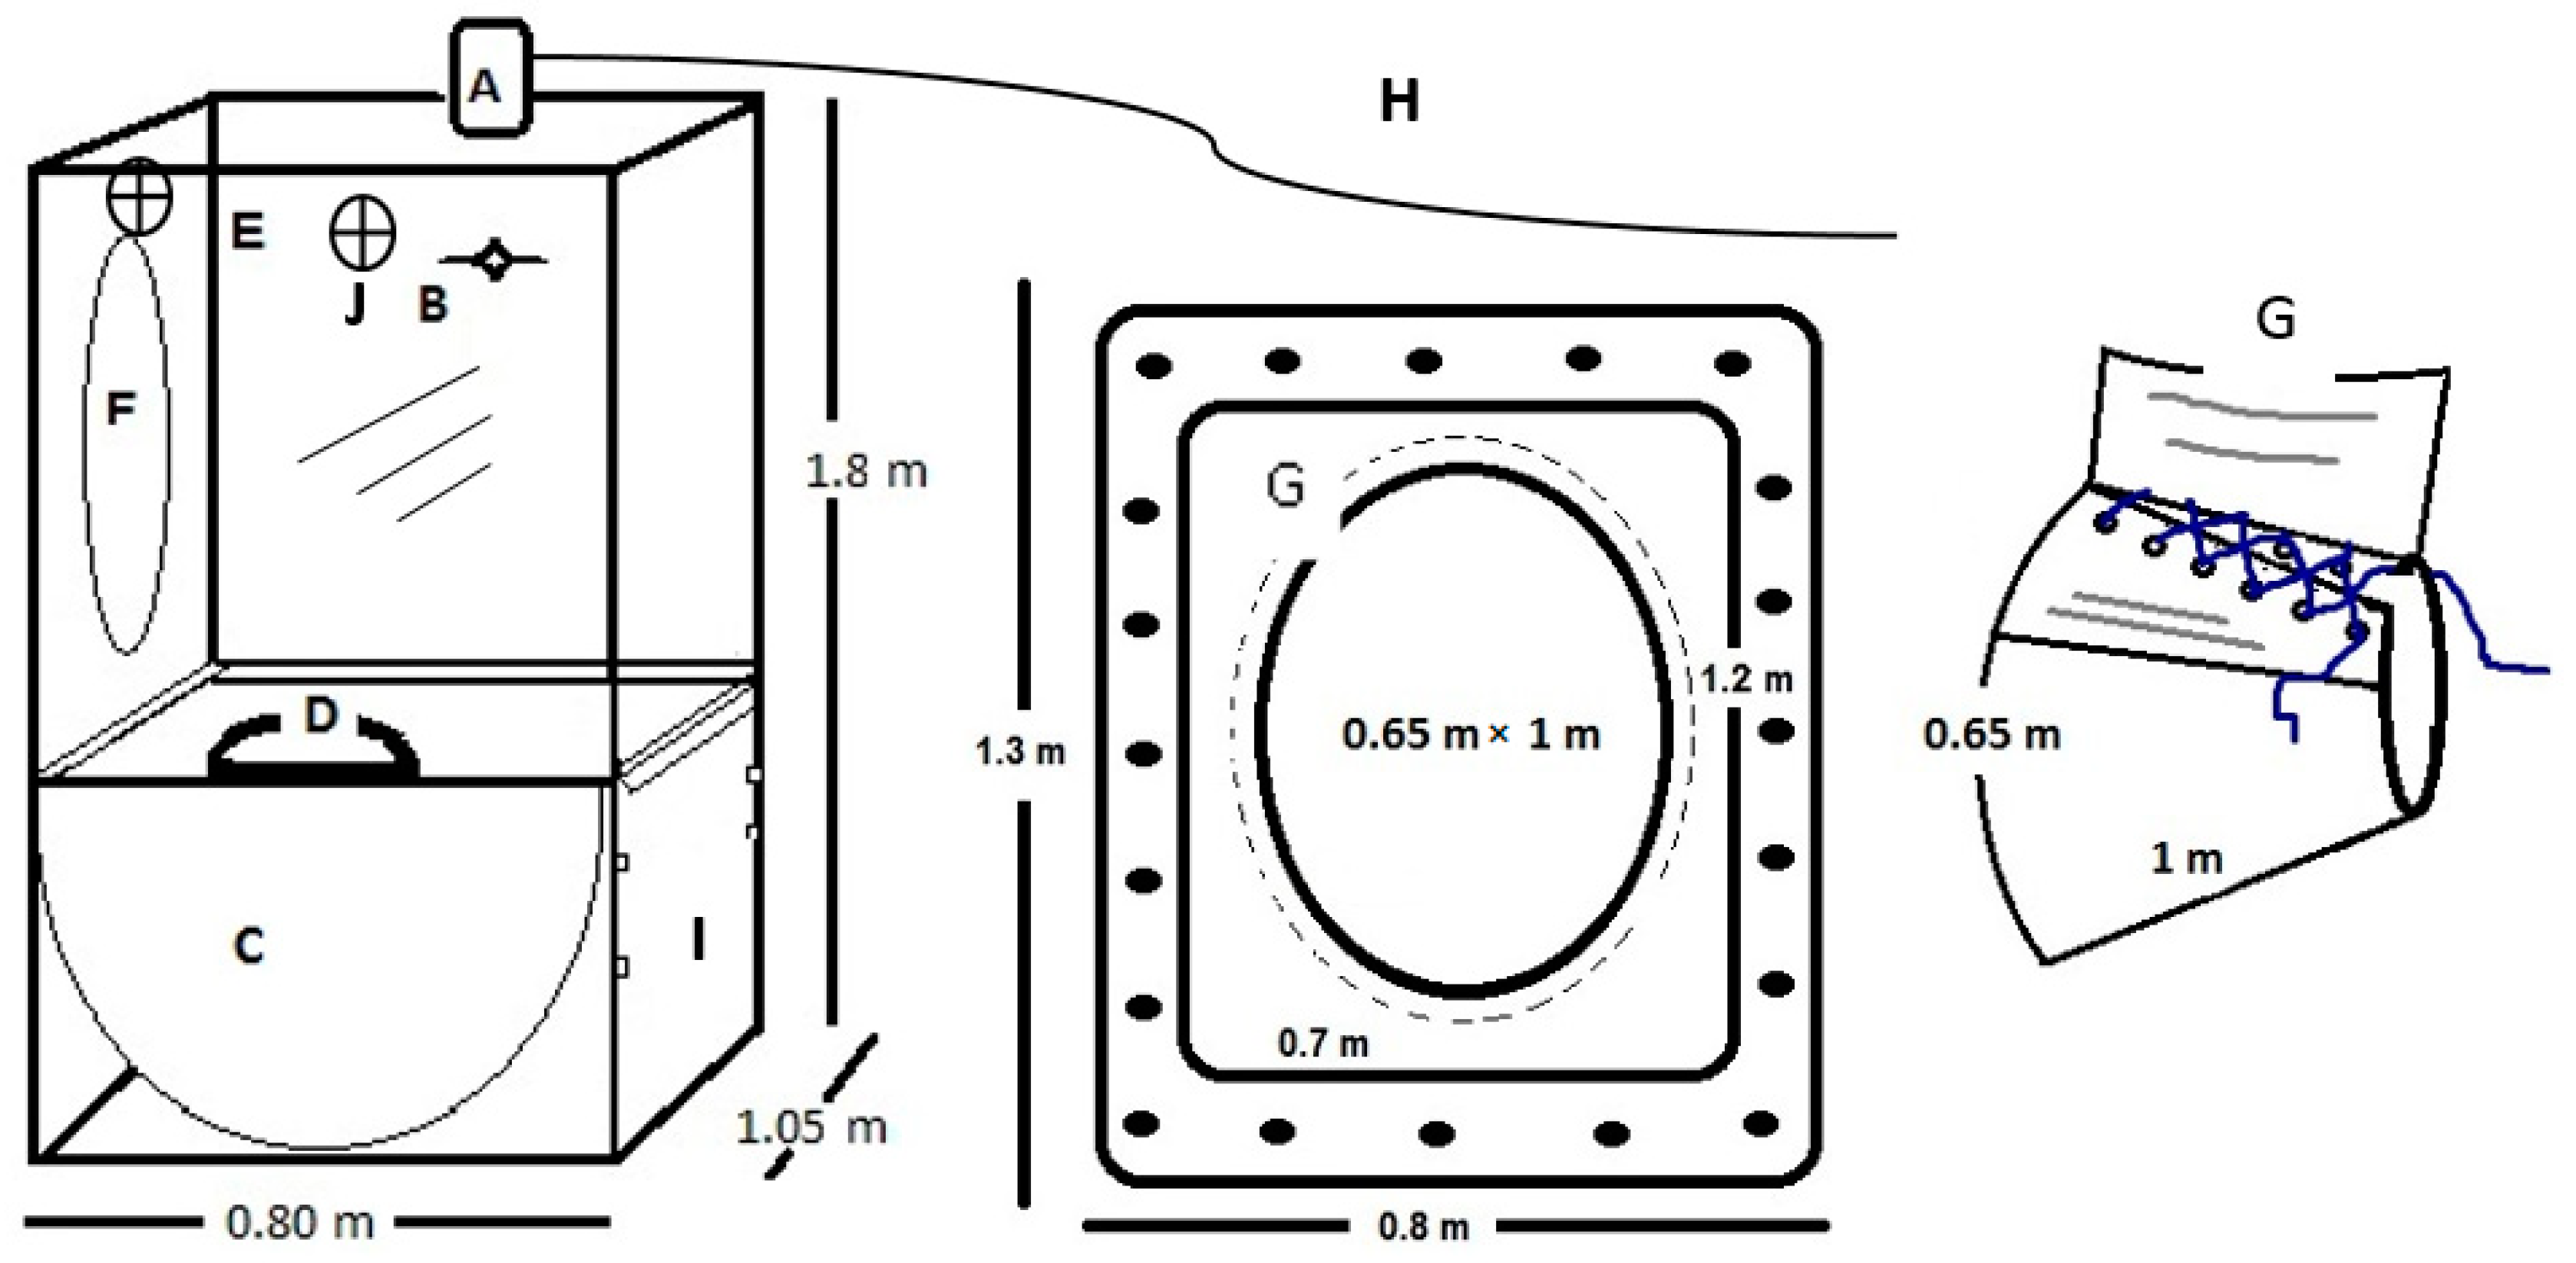
2.1. Design and System Components.

The chamber was built at the FMVZ-UAEMex, which is located in Central Mexico (19°5” N and 98.2° W) at an altitude of 2600 m. The design of the chamber was based on Suzuki et al. [11] and Place et al. [12] with modifications to improve the animal’s comfort, the security of the operator and the accuracy of the measurements. For example, of the design included a metabolic cage for cattle that facilitates feces and urine collection for calorimetry and digestibility studies and at the same time guaranteeing the security of the operator, a cage floor covered with non-sliding nonskid and cushioned material to ensure the animal’s welfare, a stainless steel feeder with a semi-cylindrical shape bottom that facilitates the food intake by the animal, a feeder mounted on rails so that it can be slid toward the animal to provide extra food if needed, two fans that keep the animal fresh and ensure full gas mixing within the box, and a smaller head-box than that in Suzuki et al. [11], which helps to prevent leaking of CH4. A schematic diagram of the system configuration and the relevant instrumentation is shown in Figure 1. The system consists of the following components:
1. The head-box was designed based on the average head and neck sizes of large breeds of dairy cattle, e.g., Holstein and Brown Swiss cows (Figure 2). The dimensions (width × length × height) of the head-box were 1.05 m × 0.8 m × 1.80 m. The frame of the head-box was made of stainless steel (3.5 cm × 3.5 cm), and the walls, ceiling, and floor were constructed of sheets of transparent acrylic (0.6 cm thick). Acrylic was used to ensure the complete visibility of the animal. The front of the head-box included a removable acrylic door with dimensions of 1.0 m × 0.75 m × 0.50 m, which was sealed by sliding latches on the side of the box and allowing access to the feeder. On the back of the head-box, an oval opening (0.65 m × 1 m) allows the cow’s head to enter the box. A hood was added to the box’s opening (Figure 2G).
2. The stainless-steel feeder had dimensions of 1.0 m × 0.75 m × 0.50 m and a capacity of approximately 20 kg of forage on a dry matter (DM) basis. The bottom was semi-cylindrical in shape, and the feeder was mounted on rails so that it could be slid toward the animal to provide food. The feeder could be taken out of the head-box without removing the animal from the chamber and the cage (Figure 2C).
3. The automatic drinking water bowl with dimensions of 0.30 mm × 0.25 m × 0.10 m was located on the side wall of the head-box (Figure 2D). The bowl was connected by a 0.5-inch hose to a 450-L water storage tank located 3 m above ground. The tank was installed on a tank stand made of steel providing permanent water supply to the animal.
4. The hood was manufactured from reinforced cotton fabric and canvas. The part of the hood attached to the head-box was made of reinforced canvas; it was rectangular with dimensions of 0.85 m × 1.30 m (width × height). The part of the hood that went around the animal’s neck was made of cotton fabric; it was oval with dimensions of 0.65 m × 1 m (Figure 2F,G). This hood allowed the animal to move freely while eating, ruminating, or lying down without removing its head from the box. It was designed to fit bovines with live weights ranging from 100 to 700 kg.
5. Two 30 cm fans (model EE90522G, Bizline, Beijing, China) were mounted on the right and left panels, to keep animals fresh and ensure full gas mixing within the box (Figure 2J).
6. The CH4 emission sampling system consisted of the elements shown in Figure 1:
1.7) A dual-wavelength infrared optical bench CH4 analyzer (model: MA-10, range 0%–10% and high resolution 0.0001% to 0.01%), barometric pressure (Sable Systems International, Las Vegas, NV, USA) compensated and not sensitive to flow rate changes, which eliminated errors caused by ambient pressure variation.
1.3) A mass flowmeter/generator (MFG) with a range from 50 to 500 L/min and an internal down-sampler with rotameter and a real-time outflow reader (Model: FK-500 Sable Systems International, Las Vegas, NV, USA). This equipment combined a precise mass flow sensor with a rotary pump controlled by an onboard microprocessor. The drive to the pump was modulated under a proportional–integral–derivative controller (PID) to maintain the desired flow rate, already corrected for standard conditions for temperature and pressure. The accuracy was 2% of full scale and the resolution was 1L min-1.
1.6) A data-acquisition system (UI2). Model: Universal Interface UI2 also made by Sable Systems International, Las Vegas, NV, USA.
7. The metabolic cage was constructed of steel tubing with dimensions of 2.44 m × 0.8 m × 1.8 m and a separation of 0.40 m between the tubes constituting the sides and the rear door (Figure 3). The metabolic cage had a front head holder (0.05 m wide) that prevented the animal from removing its head from the head-box. The stainless-steel floor included a tray with dimensions of 1.20 m × 1.05 m; the bottom of the tray was 0.10 m lower than the sides to allow for the collection of urine in a 1-in polyvinyl chloride (PVC) tube.
The floor around the pen was covered with non-sliding nonskid material and cushioned to ensure the animal’s welfare. The access to the cage consisted of a concrete ramp covered with nonskid material (Figure 3).

2.2. Operation of the CH4-Measurement System to Determine the Production of CH4 by Cattle.

The head-box was connected by the air outlet (Figure 2A) to the MFG by a 1.5-in diameter and 4-m long insulated hose (Figure 2H), which was located at the top center of the head-box. A 1-mm mesh filter located on the air outlet prevented the passage of large particles and flies and a second filter (Figure 1, 2) prevented the passage of dust from the head-box to the mass flow generator. This set-up pulled air through the head-box at a constant flow rate of 500 L min−1 and collected a subsample of 0.5 L seg−1; which was sent to the CH4 analyzer; the rest of the air was automatically discarded through a hose (Figure 1, 12) out of the laboratory building.
The subsample from the MFG passed through a laboratory gas drying unit (Figure 1, 4; model #26800, WA Hammond Drierite, Co. LTD. USA) using a 0.5-mm plastic hose. The airflow then passed through a flowmeter (Figure 1, 5), range 0.15-1 SLPM air (Model VFA-22-BV, Dwyer, Instruments, Inc.) and then to the CH4 analyzer at a rate of 0.300 L min−1, and the readings generated by the CH4 analyzer were sent to a computer by means of a universal interface (UI2) (Figure 1, 6).

2.3. Methane Recovery Test and Calibration of the Whole System

This was conducted to determine the CH4 recovery rate of the system in order to comply with adequate international standards of chamber operation as suggested by [13]. The gravimetrical method described by Arceo-Castillo et al. [14] was used to conduct the recovery test. Pure CH4 gas (calibration gas PRAXAIR, Mexico UN-1971, key ME2.0-D34), was released in different assays. All calculations of methane recovery rates were carried out in the ExpeData software (v.1.9.11; Sable Systems International, Las Vegas, NV, USA). The data from the methane analyzer were recorded and transferred to the computer in real time. In the first five assays, small amounts of methane were released because of the high cost of the CH4 standard. In these assays, the gas was blended into the chamber at an average rate of 0.133 g min−1 or 7.98 g h−1. For the last assay, 28.51 g of pure methane were released inside the respiration chamber at a rate of 0.27 g min−1 or 16.2 g h−1, which is closer to the CH4 emission rate of 20.5 g h−1 recorded on the experimental cows. The high cost of pure methane in Mexico prevented us from releasing larger amounts of gas for longer periods of time. The release rate was controlled by an analytical regulator (Praxair ProStar, Platinum, model PRX 417, flow: 0.5 SLPM). The recovery rates were calculated based on the gravimetric volume (L) of methane released into the respiration chamber, a precision balance was used to continuously weigh the CH4 cylinder considering a methane density of 0.716 g L−1 and the methane volume recovered in the analyzer during the duration of each experimental run. For the calculations, the procedure described by Arceo-Castillo et al. [14] was used as shown in Equations (1)–(3):
V C H 4 L = I w F w D
V C H 4 R = ( C C H 4 100 ) × f × t × 60
where VCH4L is the methane volume released in the chamber, Iw and Fw are the initial and final weights of the cylinder in g, and D is the density of methane. VCH4R is the methane volume recovered in the chamber, CCH4 is the average CH4 concentration (%) from the start of gas release until the background concentration is reached after closing the methane cylinder, t is the total measurement time in h, and 60 is the conversion constant in h, f is the air extraction rate in L min−1. So, the recovery rate was determined as shown in Equation (3).
% R e c = ( V C H 4 L V C H 4 R ) × 100
Table 1 shows a mean recovery rate of 1.04 ± 0.05 with a recovery range from 0.99 to 1.12. The recovery rates were similar to those reported by [14,15,16], indicating that the operation of the head-box respirometry system is within acceptable international standards. The system was capable of detecting accurately small volumes of methane released, a feature not available in some chambers because methane tends to dilute with the air within the chamber [14].

2.4. Analyzer Calibration

Before each assay, two calibrations of the chamber were performed: a zero calibration using high-purity nitrogen (N2) (Praxair Inc., Toluca City, Mexico), and a calibration against a reference gas, known as span gas. The N2 in the zero calibration was first passed through a drying unit to remove moisture and then through the methane analyzer at a flow rate of 0.3 L min−1 until a zero reading. The span calibration was performed using a known CH4 concentration gas mixture (1000 ppm of CH4 in high-purity N2). The span gas passed through the analyzer (0.3 L min−1) to obtain a stable reading corresponding to the concentration of CH4 in the span gas. (1000 ppm of CH4 in high-purity N2). The released methane volumes were kept constant by adjusting (10 psi) pressure regulators (Concoa 109–6504) to a controlled flow of 0.2 LPM by means of a flowmeter. The background CH4 concentration was verified by injecting ambient air into the analyzer; the air samples were taken with a vacuum pump (PADIIVI.021, APT Instruments, Rochester, NY, USA) at the point of entry of air into the respiration chambers.

2.5. Experimental Procedure for the in vivo Measurement of CH4 Emissions

All animal-handling procedures used in this study were performed following the guidelines for the care and use of experimental animals and were conducted with the permission of the Committee on Animal Health and Welfare of FMVZ-UAEMex.

2.6. Animals and Diet

In the present study, eight animals of the Holstein breed in two age ranges were used: four heifers (12‒13 months) and four cows older than 24 months. One month prior to the start of the experiment, the animals were dewormed and acclimated to the chamber. The cows were at the end of their early lactation and had an average live weight of 593.8 ± 51 kg and an average milk yield of 23.3 ± 1.8 L d−1. The average weight of the heifers was 339 ± 28 kg. The two groups were fed a diet consisting of concentrate and corn + alfalfa silage in a 50:50 ratio with ad libitum access to water. The concentrate was composed of 487 g kg−1 of corn grain, 200 g kg−1 of soybean, 148 g kg−1 of canola, 147 g kg−1 of wheat bran, and 18 g kg−1 of minerals. The cows received 7.5 kg DM d−1 of concentrate. The heifers received 1.9 kg DM d−1 of concentrate. The chemical compositions of the silage and concentrate are shown in Table 2.

2.7. Measurement of Methane Production and Feed Digestibility

Each animal remained in an individual pen for 5 days; the digestibility was measured on Days 4 and 5, whereas CH4 production was measured on Day 5 of this period. The animals were weighed at the start of the assay.
Methane production: The CH4 emissions were measured for 24 h in each assay. The cows were removed from the chamber for milking at 06:00 and 15:00, and each milking lasted 1.5 h, after which they returned to the chamber to complete 24 h of measurement. The heifers remained in the chamber for 24 h continuously. Every assay started at 10:00, the diet was supplied, the mass flow generator was set at 480 L/min, and the acquisition data system was set to record CH4 concentration every second and then the animal entered the chamber.
Digestibility measurement: The offered diet was weighed daily, and all animals were fed at the same time. The next morning, the orts were removed and weighed to calculate the DM intake (DMI). The samples were collected and kept in a freezer until laboratory analysis. Feces and urine were collected and weighed at the end of the day. A sample of approximately 1 kg of feces was obtained and kept frozen until laboratory analysis. The digestibility of the dry matter (DMD) intake was calculated as shown in Equation (4).
D M D ( % ) = ( D M I F A w D M I ) × 100
where DMD = dry mater digestibility, DMI = total daily dry matter intake (kg d−1), and FAw = feces weight (kg DM d−1)
The digestibility of the gross energy intake (GED) was calculated as shown in Equation (5).
G E D ( % ) = ( G E I G E f G E I ) × 100
where GEI = daily gross energy intake (MJ d−1) and GEf = gross energy content in feces (MJ d−1).

2.8. Chemical Analysis of the Feed and Stool

Feces, concentrate, and silage samples were dried in a forced air oven at 60 °C for 72 h, ground, and passed through a 1-mm sieve. The DM and organic matter (OM) contents were determined according to the procedures of the Official Methods of Analysis [17]. The nitrogen contents in the silage and concentrate were determined [17] and subsequently multiplied by a factor of 6.25 to obtain the crude protein content. The neutral detergent fiber (NDF), acid detergent fiber (ADF), and lignin contents were determined by the method of Van Soest et al. [18]; amylase was used for the NDF analyses of concentrate samples. The DM content in the silage was corrected using Equation (6), proposed by [19] to include the volatile solids in the DM.
TDM = 27.5 + 0.95 ODM (p < 0.001, r2 = 0.98)
where TDM is the DM concentration determined by toluene distillation and ODM is DM concentration determined by oven drying.
The gross energy content of feces and feed offered was determined with an adiabatic bomb calorimeter (Parr Instrument Company, Moline, IL, USA).

2.9. Comparative Costs of the Respiration Chamber

The cost associated with the construction of the head-box respiration chamber described in the present paper is approximately 70% lower than a commercial chamber. This makes it suitable for developing countries where local engineers can build it using locally available materials.

3. Results and Discussion

Table 3 shows the methane emission parameters measured in the head-box respiration chamber. The results show that the average volume of CH4 produced by high yielding Holstein Mexican dairy cows consuming 24.9 kg DM d−1 was 687 ± 123 L CH4 d−1, with a CH4 yield of 19.7 g kg−1 DMI, an emission intensity of 21.1 g kg1 milk, and a Ym value of 5.7%. The average methane production for heifers was 248 L d−1 with a CH4 yield of 17.1 g kg−1 DMI and a Ym factor of 5.7%. Our results are in good agreement and within the range of methane emissions reported in recent studies. For example, Aubry and Yan [20] performed a meta-analysis using 987 individual observations obtained with respirometry chambers on cows of different ages, productivity stages, and breeds of dairy cattle in the United Kingdom (Holstein Friesian, Jersey × Holstein, and Norwegian). They reported a mean CH4 production of 467 ± 141 Ld−1 with a minimum of 141 L d−1 and a maximum production of 793 Ld−1 with a mean DMI of 14.8 kg DM d−1 (minimum 4.9 and maximum 26.1 kg DM d−1). So, the emission of our cows was similar to those cows with maximum emissions in the United Kingdom. However, a better comparison of CH4 emissions across studies can be achieved if methane yield (g of CH4 kg−1 DMI) is used instead of total daily CH4 production, because methane yield is a measure that is less affected by factors like the size of the animal, dry matter intake and, to a lesser extent, the type of diet. The CH4 yield (Table 3) obtained in the present work compares well with the average yield of 21.0 ± 0.45 g kg−1 DMI presented by Charmley et al. [2] who summarized data from 220 Australian dairy cows. Our CH4 yield for cows is also very close to the 19.2 g kg−1 of DMI reported by Appuhamy et al. [21] for dairy cows in North America, or the 19.1 g of CH4 kg−1 of DMI reported by Hristov et al. [3]. A more recent study conducted by Niu et al. [22], using 2566 individual records of emissions in order to develop intercontinental and regional-specific prediction equations for CH4 production, reported an average methane yield of 20.1 ± 3.87 g of CH4 kg−1 DMI. Similarly, van Lingen et al. [23] conducted a meta-analysis in order to develop prediction equations of enteric methane production using a transcontinental database with 1021 individual records of beef cattle emissions and reported an average methane yield of 20 ± 5.05 g of CH4 kg−1 DMI. So, the average methane yield obtained in the present study for cows is similar to those reported by all previous studies. Based on this published evidence and the recovery tests conducted in the present study, it is possible to say that the results of our respirometry system are correct and in line with most recent studies. The Ym factor obtained in our respiration chamber for dairy cows compares well with the Ym= 5.7% reported by Appuhamy et al. [21] for dairy cows in North America; it also agrees well with the Ym= 6.5% ± 1.0% suggested by [5] for cattle enteric CH4 inventory calculations, and with the average Ym of 6.0 presented by Niu et al. [22] and van Lingen et al. [23] in their transcontinental database for dairy and beef cattle, respectively. The mean CH4 yield intensity of 21.1 g of CH4 kg1 milk observed in the present work is higher than the 13.5 g of CH4 kg1 reported by Niu et al. [22]. This difference can be attributed to the higher milk yields observed in cows from the United States and the European Union; however, the intensity is within the range reported by Niu et al. [22], which goes from 3 to 36 g of CH4 kg1 milk.
Scarce information on CH4 production in young cattle is available. However, the results obtained here for heifers and calves are comparable with those of published studies. For example, Hammond et al. [24] conducted a study with Holstein and Friesian heifers of 14 months old with an average live weight of 339 ± 16 kg; they were fed twice daily (10:00 and 16:00 in equal amounts) with one of four conserved forage (haylage) treatments of ryegrass, clover trefoil and flowers in an experimental Latin square design (4 × 4). These authors found a CH4 production of 292 L d−1 for a DMI of 7.54 kg DM d−1, similar to the result obtained in the present study of 248 L CH4 d−1 for heifers with an average live weight of 339 ± 28 kg. Other studies by Jiao et al. [25,26] with Holstein heifers also revealed similar results: 225 L d−1 for 315-kg animals fed 2 kg d−1 of concentrate and grass silage ad libitum. Finally, it was reported by Pace et al. [12] that a limitation of using respiration chambers of the head-box type to measure CH4 emissions is that animals change their consumption behavior, thereby decreasing the production of CH4. However, in the present work, the observed consumption was similar to that reported in the literature for animals of equal weight. Furthermore, since the animals were accustomed to being in the head-box, they may have exhibited relatively normal behaviors.

4. Conclusions

The observed CH4 emissions and methane yield in the present study using a head-box type system are comparable to those reported by previous studies using similar measurement systems with open-circuit respiratory calorimeters. The head-box is a low-cost system that facilitates the accurate measurement of in vivo CH4 production from bovines and provides an option for countries with limited budget.

Author Contributions

All authors have read and agree to the published version of the manuscript. Conceptualization, O.A.C.O. J.C.K.V. and P.E.P.B.; methodology, O.A.C.O.; validation, G.E.H.P., M.B. H.D.M.P. and M.F.V.C.; formal analysis, O.A.C.O.; resources, L.T.M.; data curation, H.D.M.P.; writing—original draft preparation, O.A.C.O.; writing—review and editing, M.G.R. and L.T.M.

Funding

The authors acknowledge the financial support from the Molina Center for Energy and the Environment (under UNEP Contract GFL-4C58), the Universidad Autónoma del Estado de México (Grant UAEM 3474/2013CHT), the National Council for Science and Technology of Mexico (Grant CONACYT-223418), which made the present work possible.

Conflicts of Interest

The authors declare that the research was conducted in the absence of any commercial or financial relationships that could be construed as a potential conflict of interest.

References

  1. Beach, R.H.; Creason, J.; Bushey, O.S.; Ragnauth, S.; Ogle, S.; Li, C.; Ingraham, P.; Salas, W. Global mitigation potential and costs of reducing agricultural non-CO2 greenhouse gas emissions through 2030. J. Integr. Env. Sci. 2016, 12, 87–105. [Google Scholar] [CrossRef] [Green Version]
  2. Charmley, E.; Williams, S.R.O.; Moate, P.J.; Hegarty, R.S.; Herd, R.M.; Oddy, V.H.; Reyenga, P.; Staunton, K.M.; Anderson, A.; Hanna, M.C. A universal equation to predict methane production of forage-fed cattle in Australia. Anim. Prod. Sci. 2016, 56, 169–180. [Google Scholar] [CrossRef] [Green Version]
  3. Hristov, A.N.; Ott, T.; Tricarico, J.; Rotz, A.; Waghorn, G.; Adesogan, A.; Dijkstra, J.; Montes, F.; Oh, J.; Kebreab, E.; et al. Mitigation of methane and nitrous oxide emissions from animal operations: III. A review of animal management-related mitigation options. J. Anim. Sci. 2013, 91, 5095–5113. [Google Scholar] [CrossRef] [PubMed] [Green Version]
  4. Chaokaur, A.; Nishida, T.; Phaowphaisal, I.; Sommart, K. Effects of feeding level on methane emissions and energy utilization of Brahman cattle in the tropics. Agric. Ecosyst. Environ. 2015, 99, 225–230. [Google Scholar] [CrossRef]
  5. IPCC Guidelines for National Greenhouse Gas Inventories; Volume 4: Agriculture, Forestry and Other Land Uses. Chapter 10: Emissions from Livestock and Manure Management. Prepared by the National Greenhouse Gas Inventories Programme; Eggleston, H.S.; Buendia, L.; Miwa, K.; Ngara, T.; Tanabe, K. (Eds.) IGES: Hayama, Japan, 2006; pp. 10.1–10.34. [Google Scholar]
  6. INECC, SEMARNAT. Base de Datos del Inventario Nacional de Emisiones de Gases de Efecto Invernadero 2013 del sector Agropecuario. Instituto Nacional de Ecología y Cambio Climático and Secretaría de Medio Ambiente y Recursos Naturales. In: Primer Informe Bienal de Actualización ante la Convención Marco de las Naciones Unidas Sobre el Cambio Climático. México. 277 p 2015. Available online: http://unfccc.int/national_reports/nonannex_i_natcom/reporting_on_climate_change/items/8722.php (accessed on 7 October 2019).
  7. Castelán-Ortega, O.A.; Ku-Vera, J.C.; Estrada-Flores, J.G. Modelling methane emissions and methane inventories for cattle production systems in Mexico. Atmósfera 2014, 27, 185–191. [Google Scholar]
  8. Ruíz-Suárez, L.G.; González-Avalos, E. Modeling emissions from cattle in México. Sci. Total Environ. 1997, 206, 177–186. [Google Scholar] [CrossRef]
  9. Rendón-Huerta, J.A.; Pinos-Rodríguez, J.M.; García-López, J.C.; Yañez-Estrada, L.G.; Kebreab, E. Trends in greenhouse gas emissions from dairy cattle in México between 1970 and 2010. Anim. Prod. Sci. 2014, 54, 292–298. [Google Scholar] [CrossRef] [Green Version]
  10. Moe, P.W.; Tyrrel, H.F. Methane production in dairy cows. J. Dairy. Sci. 1979, 62, 1583–1586. [Google Scholar] [CrossRef]
  11. Suzuki, T.; Phaowphaisal, I.; Pholsen, P.; Narmsilee, R.; Indramannee, S.; Nitipot, P.; Chaokaur, A.; Sommart, K.; Khotprom, N.; Panichpol, V.; et al. In vivo nutritive value of Pangola grass (Digitaria eriantha) Hay by novel indirect calorimeter with a Ventilated Hood in Thailand. JARQ 2008, 42, 123–129. [Google Scholar] [CrossRef] [Green Version]
  12. Place, S.E.; Pan, Y.; Zhao, Y.; Mitloehner, F.M. Construction and operation of a Ventilated Hood System for measuring greenhouse and volatile Organic Compound emission from cattle. Animals 2011, 1, 443–446. [Google Scholar] [CrossRef] [Green Version]
  13. Gerrits, W.; Labussière, E.; Reynolds, C.; Metges, C.; Kuhla, B.; Lund, P.; Weisbjerg, M.R.; Dijkstra, J. Letter to the Editor: Recovery test results as a prerequisite for publication of gaseous exchange measurements. J. Dairy Sci. 2018, 101, 4703–4704. [Google Scholar] [CrossRef] [PubMed] [Green Version]
  14. Arceo-Castillo, J.I.; Montoya-Flores, M.D.; Molina-Botero, I.C.; Piñeiro-Vázquez, A.T.; Aguilar-Pérez, C.F.; Ayala-Burgos, A.J.; Solorio-Sánchez, F.J.; Castelán-Ortega, O.A.; Quintana-Owen, P.; Ku-Vera, J.; et al. Effect of the volume of methane released into respiration chambers on full system methane recovery. Anim. Feed Sci. Tech. 2019, 249, 54–61. [Google Scholar] [CrossRef]
  15. Klein, L.; Wright, A.D. Construction and operation of open-circuit methane chambers for small ruminants. Aust. J. Exp. Agr. 2006, 46, 1257–1262. [Google Scholar] [CrossRef]
  16. Gardiner, T.D.; Coleman, M.D.; Innocenti, F.; Tompkins, J.; Connor, A.; Garnsworthy, P.C.; Moorby, J.M.; Reynols, C.K.; Waterhouse, A.; Wills, D.; et al. Determination of the absolute accuracy of UK chamber facilities used in measuring methane emissions from livestock. Measurement 2015, 66, 272–279. [Google Scholar] [CrossRef]
  17. AOAC International Official Methods of Analysis, 16th ed.; AOAC Int.: Gaithersburg, MD, USA, 1996.
  18. Van Soest, P.J.; Robertson, J.B.; Lewis, B.A. Methods for dietary fibre, neutral detergent fibre and non-starch polysaccharides in relation to animal nutrition. J. Dairy Sci. 1991, 74, 3583–3597. [Google Scholar] [CrossRef]
  19. Haigh, P.M. A note on the relationship between oven and toluene determined dry matter concentrations in Maize silages. Ir. J. Agric. Food Res. 1995, 34, 193–195. [Google Scholar]
  20. Aubry, A.; Yan, T. Metha-analysis of calorimeter data to establish relationships between methane and carbon dioxide emissions or oxygen consumption for dairy cattle. Anim. Nutr. 2015, 1, 128–134. [Google Scholar] [CrossRef]
  21. Appuhamy, A.D.R.N.J.; France, J.; Kebreab, E. Models for predicting enteric methane emissions from dairy cows in North America, Europe, and Australia and New Zealand. Glob. Chang. Biol. 2016, 22, 3039–3056. [Google Scholar] [CrossRef]
  22. Niu, M.; Kebreab, E.; Hristov, A.; Oh, J.; Arndt, C.; Bannink, A.; Bayat, A.R.; Brito, A.F.; Boland, T.; Casper, D.; et al. Prediction of enteric methane production, yield and intensity in dairy cattle using an intercontinental database. Glob. Chang. Biol. 2018, 24, 3368–3389. [Google Scholar] [CrossRef] [Green Version]
  23. Van Lingen, H.J.; Niu, M.; Kebreab, E.; Valadares-Filho, S.C.; Rooke, J.A.; Duthie, C.A.; Schwarm, A.; Kreuzer, M.; Hynd, P.I.; Caetano, M.; et al. Prediction of enteric methane production, yield and intensity of beef cattle using an intercontinental database. Agric. Ecosyst. Environ. 2019, 283, 106575. [Google Scholar] [CrossRef]
  24. Hammond, K.J.; Humphiries, D.J.; Crompton, L.A.; Green, C.; Reynolds, C.K. Methane emissions from cattle: Estimates from short-term measurements using a GreenFeed system compared with measurements obtained using respiration chambers or Sulphur hexafluoride tracer. Anim. Feed Sci. Tech. 2015, 203, 41–52. [Google Scholar] [CrossRef]
  25. Jiao, H.; Yan, T.; Wills, D.A.; Carson, A.F.; McDowell, D.A. Development of prediction models for quantification of total methane emission from enteric fermentation of young Holstein cattle at various ages. Agric. Ecosyst. Environ. 2014, 183, 160–166. [Google Scholar] [CrossRef]
  26. Jiao, H.; Yan, T.; Wills, D.A.; Carson, A.F.; McDowell, D.A. Maintenance energy requirements of young Holstein cattle from calorimetric measurements at 6, 12, 18 and 22 months of age. Livest. Sci. 2015, 178, 150–157. [Google Scholar] [CrossRef]
Figure 1. Schematic diagram of the ventilated hood-type open circuit respiration chamber.
Animals 10 00227 g001
Figure 2. Schematic of the head-box: (A) Air outlet connecting to the mass flow generator (FK-500); (B) Air inlet valve; (C) Feeder; (D) Automated drinking water bowl; (E) Transparent acrylic walls (0.6 cm thick); (F) Hood hole; (G) Hood; (H) Insulated hose that connects the head-box with the mass flow generator, (I) feeder door, (J) fans.
Animals 10 00227 g002
Figure 3. Schematic of the metabolic cage and feces-urine collector.
Animals 10 00227 g003
Table 1. Results of the full system recovery test.
VariableAssay 1Assay 2Assay 3Assay 4Assay 5Assay 6MeanStand Dev.
Volume of air flow through the chamber, L/min494.7500.9501.4501.5501.5499.6499.92.6
Duration of assay, min30.959.022.921.019.210342.9
Volume of air through the chamber, m315.429.511.410.59.252.021.416.7
CH4 released, g5.37.72.83.1228.58.210.1
CH4 measured, g5.28.23.03.22.028.58.4
Ambient CH4 entering the chamber, %0.00310.00180.00170.00170.00160.00100.00200.0006
Methane recovery rate0.991.071.121.051.010.991.040.05
Table 2. Compositions of the silage and concentrate used in the experiment in g kg−1 DM determined by chemical analysis.
VariableHeifersCows
Concentrate
DM885.3888.5
OM829.4826.4
CP219.4221.1
NDF326.4340.7
ADF94.5123.5
Hemicellulose 231.9217.2
Cellulose51.383.3
Lignin43.240.2
Silage
DM366.6408.4
CP121.8114.7
NDF487.2511.5
ADF368.5377.6
Hemicellulose 118.7135.4
Cellulose261.5314.2
Lignin106.988.6
GE of the whole diet17.016.7
DM = dry matter OM = Organic matter, CP = Crude protein, NDF = Neutral detergent fiber, ADF = Acid detergent fiber, GE = gross energy, MJ kg−1 DM.
Table 3. Mean in vivo CH4 production, dry matter and gross energy intakes, digestibility of dry matter and gross energy, methane conversion factor and methane yield for cows and heifers.
VariableCowsStand. Dev.95% Conf. IntervalsHeifersStand. Dev.95% Conf. Intervals
MeanMean
Live weight, kg593.450.9512–674338.527.8294–382
DMI, kg d−124.90.524–2510.40.59.6–11
DDM intake, kg d−118.61.116–206.50.75.3–7.5
Digestibility of diet, %74.93.169–7962.23.955–68
Gross energy intake, MJ d−14248.516.9–17.1173.07.8160–185
Digestibility of gross energy, %76.12.771–8063.84.157–70
CH4 emission, L d−1687123490–882248.040.0184–311
CH4 emission, g d−149288.3351–632177.628.6132–223
CH4, L kg−1 of DMI27.64.819–3524.04.816–31
CH4, L kg−1 DDM intake36.75.328–4539.09.823–54
CH4, g kg−1 of DMI19.73.414–2517.13.411.7–22.6
CH4, g kg−1 DDM intake26.33.820–3227.97.016–39
CH4, g kg−1 milk21.13.315–26---
Ym, %6.41.14.6–8.15.71.13.8–7.5
Milk yield, kg d−123.31.820–26---
DMI = Dry matter intake, DDM = digestible dry matter, Ym = methane conversion factor, energy of CH4 as a percentage of GEI; the specific energy of CHR4R is 55.65 MJ kg−1. DMI = Dry matter intake, MP = milk production, DDM = digestibility of dry matter, DOM = digestibility of organic matter, LMP = liters of milk produced, ± = standard deviation.

