Organic Farming as a Strategy to Reduce Carbon Footprint in Dehesa Agroecosystems: A Case Study Comparing Different Livestock Products


Simple Summary
Abstract
1. Introduction
2. Materials and Methods
2.1. Case Studies Selection and Data Collection
2.2. Features of the Seven Production Systems
2.3. System Boundaries and Functional Unit
2.4. Estimation of GHG Emissions and CF Level in Farms
2.4.1. On-Farm Emissions
2.4.2. Off-Farm Emissions
2.5. Carbon Sequestration in LCA
3. Results
3.1. Technical Features of the Farms under Analysis
3.2. Greenhouse Gas Emissions
3.3. Carbon Sequestration
4. Discussion
5. Conclusions
Author Contributions
Funding
Acknowledgments
Conflicts of Interest
References
- Horrillo, A.; Gaspar, P.; Mesías, F.J.; Elghannam, A.; Escribano, M. Understanding the barriers and exploring the possibilities of the organic livestock sector in dehesa agroforestry systems: A multi-actor approach for effective diagnosis. Renew. Agric. Food Syst. 2019, 1–15. [Google Scholar] [CrossRef]
- Gerber, P.J.; Steinfeld, H.; Henderson, B.; Mottet, A.; Opio, C.; Dijkman, J.; Falcucci, A.; Tempio, G. Enfrentando el Cambio Climático a Través de la Ganadería—Una Evaluación Global de las Emisiones y Oportunidades de Mitigación; Organización de las naciones unidas para la alimentación y la agricultura (FAO): Roma, Italy, 2013; p. 153. [Google Scholar]
- Eldesouky, A.; Mesias, F.J.; Elghannam, A.; Escribano, M. Can extensification compensate livestock greenhouse gas emissions? A study of the carbon footprint in Spanish agroforestry systems. J. Clean. Prod. 2018, 200, 28–38. [Google Scholar] [CrossRef]
- Smith, L.G.; Kirk, G.J.D.; Jones, P.J.; Williams, A.G. The greenhouse gas impacts of converting food production in England and Wales to organic methods. Nat. Commun. 2019, 10, 4641. [Google Scholar] [CrossRef]
- Balmford, A.; Amano, T.; Bartlett, H.; Chadwick, D.; Collins, A.; Edwards, D.; Field, R.; Garnsworthy, P.; Green, R.; Smith, P.; et al. The environmental costs and benefits of high-yield farming. Nat. Sustain. 2018, 1, 477–485. [Google Scholar] [CrossRef] [PubMed]
- Muller, A.; Schader, C.; El-Hage Scialabba, N.; Brüggemann, J.; Isensee, A.; Erb, K.; Smith, P.; Klocke, P.; Leiber, F.; Stolze, M.; et al. Strategies for feeding the world more sustainably with organic agriculture. Nat. Commun. 2017, 8, 1–13. [Google Scholar] [CrossRef] [PubMed]
- FIBL; IFOAM EU. Organic Farming, Climate Change Mitigation and Beyond: Reducing the Environmental Impacts of EU Agriculture. Brussels: IFOAM EU. Available online: https://www.ifoam-eu.org/sites/default/files/ifoameu_advocacy_climate_change_report_2016.pdf (accessed on 8 November 2019).
- Sobrino, O. Gases de Efecto Invernadero en Ganadería. III Jornada Ganadería y Medio Ambiente. Subdirección General de Medios de Producción Ganaderos; Ministerio de Agricultura, Alimentación y Medio Ambiente: Madrid, Spain, 2016; p. 25.
- Buratti, C.; Fantozzi, F.; Barbanera, M.; Lascaro, E.; Chiorri, M.; Cecchini, L. Carbon footprint of conventional and organic beef production systems: An Italian case study. Sci. Total Environ. 2017, 576, 129–137. [Google Scholar] [CrossRef] [PubMed]
- Gutiérrez-Peña, R.; Mena, Y.; Batalla, I.; Mancilla-Leytón, J.M. Carbon footprint of dairy goat production systems: A comparison of three contrasting grazing levels in the Sierra de Grazalema Natural Park (Southern Spain). J. Environ. Manag. 2019, 232, 993–998. [Google Scholar] [CrossRef]
- Noya, I.; González-García, S.; Berzosa, J.; Baucells, F.; Feijoo, G.; Moreira, M.T. Environmental and water sustainability of milk production in Northeast Spain. Sci. Total Environ. 2018, 616–617, 1317–1329. [Google Scholar] [CrossRef] [PubMed]
- Sánchez Martín, J.M.; Blas Morato, R.; Rengifo Gallego, J.I. The Dehesas of Extremadura, Spain: A Potential for Socio-economic Development Based on Agritourism Activities. Forests 2019, 10, 620. [Google Scholar] [CrossRef]
- Jones, A.K.; Jones, D.L.; Cross, P. The carbon footprint of lamb: Sources of variation and opportunities for mitigation. Agric. Syst. 2014, 123, 97–107. [Google Scholar] [CrossRef]
- Dougherty, H.C.; Oltjen, J.W.; Mitloehner, F.M.; Depeters, E.J.; Pettey, L.A.; Macon, D.; Finzel, J.; Rodrigues, K.; Kebreab, E. Carbon and blue water footprints of California sheep production. J. Anim. Sci. 2019, 97, 945–961. [Google Scholar] [CrossRef] [PubMed]
- Stanley, P.L.; Rowntree, J.E.; Beede, D.K.; DeLonge, M.S.; Hamm, M.W. Impacts of soil carbon sequestration on life cycle greenhouse gas emissions in Midwestern USA beef finishing systems. Agric. Syst. 2018, 162, 249–258. [Google Scholar] [CrossRef]
- Vagnoni, E.; Franca, A. Transition among different production systems in a Sardinian dairy sheep farm: Environmental implications. Small Rumin. Res. 2018, 159, 62–68. [Google Scholar] [CrossRef]
- ISO International Standard 14040:2006. In Environmental Management—Life Cycle Assessement—Requirements and Guidelines, ISO 14040, International Organization for Standardization; Wiley-VCH Verlag GmbH & Co. KGaA, Boschstr.: Geneva, Switzerland, 2006.
- ISO International Standard 14044:2006. In Environmental Management—Life Cycle Assessement—Requirements and Guidelines, ISO 14044, International Organization for Standardization; Wiley-VCH Verlag GmbH & Co. KGaA, Boschstr.: Geneva, Switzerland, 2006.
- IPCC. IPCC Guidelines for National Greenhouse Gas Inventories. Prepared by the National Greenhouse Gas Inventories Programme; Eggleston, H.S., Buendia, L., Miwa, K., Ngara, T., Tanabe, K., Eds.; IGES: Hayama, Japan, 2006; ISBN 92-9169-320-0. [Google Scholar]
- IPCC. Mitigación del Cambio Climático: Contribución del Grupo de Trabajo III al Cuarto Informe de Evaluación del IPCC (Vol. 4); Cambridge University Press: Geneva, Switzerland, 2007. [Google Scholar]
- IPCC. Cambio Climático 2014. Mitigación del Cambio Climático. Resumen para Responsables de Políticas. Contribución del Grupo de trabajo III al Quinto Informe de Evaluación del Grupo Intergubernamental de Expertos sobre el Cambio Climático; IPCC: Geneva, Switzerland, 2014. [Google Scholar]
- MAPA. Inventarios Nacionales de Emisiones a la Atmósfera 1990-2012. Volumen 2: Análisis por Actividades SNAP. In Análisis por Actividades SNAP; Centro de Publicaciones: Madrid, Spain, 2012; Volume 2, pp. 1–148. [Google Scholar]
- MITECO. Informe de Inventario Nacional Gases de Efecto Invernadero; Ministerio para la Transición Ecológica-Gobierno de España; Centro de Publicaciones: Madrid, Spain, 2019. [Google Scholar]
- Yin, R.K. Case Study Research and Applications: Design and Methods; Sage: Thousand Oaks, CA, USA, 1984; Volume 5, pp. 1–53. [Google Scholar]
- Bernués, A.; Rodríguez-Ortega, T.; Olaizola, A.M.; Ripoll Bosch, R. Evaluating ecosystem services and disservices of livestock agroecosystems for targeted policy design and management. Grassl. Sci. Eur. 2017, 22, 259–267. [Google Scholar]
- Vellenga, L.; Qualitz, G.; Drastig, K. Farm Water Productivity in Conventional and Organic Farming: Case Studies of Cow-Calf Farming Systems in North Germany. Water 2018, 10, 1294. [Google Scholar] [CrossRef]
- Neira, D.P.; Montiel, M.S.; Fernández, X.S. Energy indicators for organic livestock production: A case study from Andalusia, Southern Spain. Agroecol. Sustain. Food Syst. 2014, 38, 317–335. [Google Scholar] [CrossRef]
- Asai, M.; Moraine, M.; Ryschawy, J.; de Wit, J.; Hoshide, A.K.; Martin, G. Critical factors for crop-livestock integration beyond the farm level: A cross-analysis of worldwide case studies. Land Use Policy 2018, 73, 184–194. [Google Scholar] [CrossRef]
- Regan, J.T.; Marton, S.; Barrantes, O.; Ruane, E.; Hanegraaf, M.; Berland, J.; Korevaar, H.; Pellerin, S.; Nesme, T. Does the recoupling of dairy and crop production via cooperation between farms generate environmental benefits? A case-study approach in Europe. Eur. J. Agron. 2017, 82, 342–356. [Google Scholar] [CrossRef]
- Rodríguez-Estévez, V.; García, A.; Peña, F.; Gómez, A.G. Foraging of Iberian fattening pigs grazing natural pasture in the dehesa. Livest. Sci. 2009, 120, 135–143. [Google Scholar] [CrossRef]
- IDF A Common Carbon Footprint Approach for the Dairy Sector. The IDF guide to standard life cycle assessment methodology. Int. Dairy J. 2015, 7, 283. [Google Scholar]
- Bochu, J.-L.; Metayer, N.; Bordet, C.; Gimaret, M. Development of Carbon Calculator to promote low carbon farming practices—Methodological guidelines (methods and formula). In Deliverable to EC-JRC-IES by Solagro; Joint Research Centre-IES: Ispra, Italy, 2013. [Google Scholar]
- CNMC. La Comisión Nacional de los Mercados y la Competencia. Mezcla de Comercialización Año 2018; CNMC: Madrid, Spain, 2018; p. 29. [Google Scholar]
- Huijbregts, M.; Steinmann, Z.J.N.; Elshout, P.M.F.M.; Stam, G.; Verones, F.; Vieira, M.D.M.; Zijp, M.; van Zelm, R. ReCiPe 2016: A Harmonized Life Cycle Impact Assessment Method at Midpoint and Endpoint Level Report I: Characterization; National Institute for Public Healthand the Environment: Bilthoven, The Netherlands, 2016. [Google Scholar]
- Durlinger, B.; Koukouna, E.; Broekema, R.; van Paassen, M.; Scholten, J. Agri-Footprint 4.0–Part 2—Description of Data; Blonk Consultants: Gouda, The Netherlands, 2014. [Google Scholar]
- Frischknecht, R.; Jungbluth, N.; Althaus, H.J.; Bauer, C.; Doka, G.; Dones, R.; Hischier, R.; Hellweg, S.; Humbert, S.; Köllner, T.; et al. Implementation of Life Cycle Impact Assessment Methods; Data v2.0 (2007). Ecoinvent report No. 3; Swiss Centre for Life Cycle Inventoriess: Dübendorf, Switzerland, 2007. [Google Scholar]
- IPCC. Capítulo 6: Pastizales. In Directrices del IPCC de 2006 Para los Inventarios Nacionales de Gases de Efecto Invernadero; IGES: Hayama, Japan, 2006. [Google Scholar]
- Petersen, B.M.; Knudsen, M.T.; Hermansen, J.E.; Halberg, N. An approach to include soil carbon changes in life cycle assessments. J. Clean. Prod. 2013, 52, 217–224. [Google Scholar] [CrossRef]
- Batalla, I.; Knudsen, M.T.; Mogensen, L.; Del Hierro, Ó.; Pinto, M.; Hermansen, J.E. Carbon footprint of milk from sheep farming systems in Northern Spain including soil carbon sequestration in grasslands. J. Clean. Prod. 2015, 104, 121–129. [Google Scholar] [CrossRef]
- Soussana, J.F.; Tallec, T.; Blanfort, V. Mitigating the greenhouse gas balance of ruminant production systems through carbon sequestration in grasslands. Animal 2010, 4, 334–350. [Google Scholar] [CrossRef] [PubMed]
- Teague, W.R.; Apfelbaum, S.; Lal, R.; Kreuter, U.P.; Rowntree, J.; Davies, C.A.; Conser, R.; Rasmussen, M.; Hatfeld, J.; Wang, T.; et al. The role of ruminants in reducing agriculture’s carbon footprint in North America. J. Soil Water Conserv. 2016, 71, 156–164. [Google Scholar] [CrossRef]
- Reglamento (UE) 834/2007. Reglamento (CE) no 834/2007 del Consejo de 28 de Junio de 2007 Sobre Producción y Etiquetado de los Productos Ecológicos y por el que se Deroga el REGLAMENTO (CEE) no 2092/91; Diario Oficial de la Unión Europea: Luxemburgo, 2007; pp. 1–23. [Google Scholar]
- Reglamento (UE) 889/2008. Reglamento (CE) no 889/2008 de la Comisión de 5 de Septiembre de 2008 por el que se Establecen Disposiciones de Aplicación del Reglamento (CE) no 834/2007 del Consejo Sobre Producción y Etiquetado de los Productos Ecológicos, con Respecto a la Producción; Diario Oficial de la Unión Europea: Luxemburgo, 2008; pp. 1–84. [Google Scholar]
- Reglamento (UE) 2018/848. Reglamento (UE) 2018/848 del Parlamento Europeo y del Consejo, de 30 de Mayo de 2018, Sobre Producción Ecológica y Etiquetado de los Productos Ecológicos y por el que se Deroga el Reglamento (CE) no 834/2007 del Consejo; Diario Oficial de la Unión Europea: Luxemburgo, 2018; pp. 1–92. [Google Scholar]
- Pérez, M.C.; Del Pozo, J. La superficie forestal de Extremadura. In La Agricultura y Ganadería Extremeñas 2000; Caja de Ahorros de Badajoz: Badajoz, Spain, 2001; pp. 205–230. [Google Scholar]
- Horrillo, A.; Mesias, F.J.; Gaspar, P.; Escribano, M. La explotación del vacuno ecológico en sistemas de dehesas del SO de España: Análisis de parámetros técnicos. Arch. Zootec. 2015, 64, 307–310. [Google Scholar] [CrossRef]
- Maroto-Molina, F.; Gómez-Cabrera, A.; Guerrero-Ginel, J.E.; Garrido-Varo, A.; Adame-Siles, J.A.; Pérez-Marín, D.C. Caracterización y tipificación de explotaciones de dehesa asociadas a cooperativas: Un caso de estudio en España. Rev. Mex. Ciencias Pecu. 2018, 9, 812–832. [Google Scholar] [CrossRef]
- Gaspar, P.; Escribano, M.; Mesías, F.J.; Rodriguez De Ledesma, A.; Pulido, F. Sheep farms in the Spanish rangelands (dehesas): Typologies according to livestock management and economic indicators. Small Rumin. Res. 2008, 74, 52–63. [Google Scholar] [CrossRef]
- Escribano, A.J. Estudio de la producción bovina ecológica y convencional en sistemas extensivos de dehesas en Extremadura. In Análisis Técnico-Económico, de Sostenibilidad y Eficiencia de su Sistema Productivo; Posibilidades de conversión al modelo de producción ecológica, Universidad de Extremadura: Badajoz, Spain, 2014. [Google Scholar]
- Escribano, A.J. Beef cattle farms’ conversion to the organic system. Recommendations for success in the face of future changes in a global context. Sustainability 2016, 8, 572. [Google Scholar] [CrossRef]
- Crosson, P.; Shalloo, L.; O’Brien, D.; Lanigan, G.J.; Foley, P.A.; Boland, T.M.; Kenny, D.A. A review of whole farm systems models of greenhouse gas emissions from beef and dairy cattle production systems. Anim. Feed Sci. Technol. 2011, 166–167, 29–45. [Google Scholar] [CrossRef]
- Conant, R.T.; Paustian, K.; Elliott, E.T. Grassland management and conversion into grassland: Effects on soil carbon. Ecol. Appl. 2001, 11, 343–355. [Google Scholar] [CrossRef]
- Soussana, J.-F.; Loiseau, P.; Vuichard, N.; Ceschia, E.; Balesdent, J.; Chevallier, T.; Arrouays, D. Carbon cycling and sequestration opportunities in temperate grasslands. Soil Use Manag. 2004, 20, 219–230. [Google Scholar] [CrossRef]
- Byrne, K.A.; Kiely, G.; Leahy, P. CO2 fluxes in adjacent new and permanent temperate grasslands. Agric. For. Meteorol. 2005, 135, 82–92. [Google Scholar] [CrossRef]
- Jaksic, V.; Kiely, G.; Albertson, J.; Oren, R.; Katul, G.; Leahy, P.; Byrne, K.A. Net ecosystem exchange of grassland in contrasting wet and dry years. Agric. For. Meteorol. 2006, 139, 323–334. [Google Scholar] [CrossRef]
- Veysset, P.; Lherm, M.; Bébin, D. Energy consumption, greenhouse gas emissions and economic performance assessments in French Charolais suckler cattle farms: Model-based analysis and forecasts. Agric. Syst. 2010, 103, 41–50. [Google Scholar] [CrossRef]
- Soussana, J.F.; Allard, V.; Pilegaard, K.; Ambus, P.; Amman, C.; Campbell, C.; Ceschia, E.; Clifton-Brown, J.; Czobel, S.; Domingues, R.; et al. Full accounting of the greenhouse gas (CO2, N2O, CH4) budget of nine European grassland sites. Agric. Ecosyst. Environ. 2007, 121, 121–134. [Google Scholar] [CrossRef]
- Beauchemin, K.A.; Henry Janzen, H.; Little, S.M.; McAllister, T.A.; McGinn, S.M. Life cycle assessment of greenhouse gas emissions from beef production in western Canada: A case study. Agric. Syst. 2010, 103, 371–379. [Google Scholar] [CrossRef]
- Olea, L.; Miguel-ayanz, A.S. The Spanish dehesa, a traditional Mediterranean silvopastoral system. In Proceedings of the 21st General Meeting of the European Grassland Federation, Badajoz, Spain, 3–6 April 2006; pp. 1–15. [Google Scholar]
- Maya, V.; López, F.; Gragera Facundo, J. Producción y Calidad de Mezclas Forrajeras Cereal-Leguminosa de Secano en Extremadura. In Proceedings of the Reunión Científica de la Sociedad Española para el Estudio de los Pastos, Barcelona, Spain, 25–28 April 2017; pp. 1–8. [Google Scholar]
- Sykes, A.J.; Topp, C.F.E.; Rees, R.M. Understanding uncertainty in the carbon footprint of beef production. J. Clean. Prod. 2019, 234, 423–435. [Google Scholar] [CrossRef]
- Hietala, S.; Smith, L.; Knudsen, M.T.; Kurppa, S.; Padel, S.; Hermansen, J.E. Carbon footprints of organic dairying in six European countries—Real farm data analysis. Org. Agric. 2015, 5, 91–100. [Google Scholar] [CrossRef]
- Jayasundara, S.; Worden, D.; Weersink, A.; Wright, T.; VanderZaag, A.; Gordon, R.; Wagner-Riddle, C. Improving farm profitability also reduces the carbon footprint of milk production in intensive dairy production systems. J. Clean. Prod. 2019, 229, 1018–1028. [Google Scholar] [CrossRef]
- Arrieta, E.M.; González, A.D. Energy and carbon footprints of chicken and pork from intensive production systems in Argentina. Sci. Total Environ. 2019, 673, 20–28. [Google Scholar] [CrossRef]
- Cardoso, A.S.; Berndt, A.; Leytem, A.; Alves, B.J.R.; de Carvalho, I.D.N.O.; de Barros Soares, L.H.; Urquiaga, S.; Boddey, R.M. Impact of the intensification of beef production in Brazil on greenhouse gas emissions and land use. Agric. Syst. 2016, 143, 86–96. [Google Scholar] [CrossRef]
- Alemu, A.W.; Janzen, H.; Little, S.; Hao, X.; Thompson, D.J.; Baron, V.; Iwaasa, A.; Beauchemin, K.A.; Kröbel, R. Assessment of grazing management on farm greenhouse gas intensity of beef production systems in the Canadian Prairies using life cycle assessment. Agric. Syst. 2017, 158, 1–13. [Google Scholar] [CrossRef]
- Florindo, T.J.; de Medeiros Florindo, G.I.B.; Talamini, E.; da Costa, J.S.; Ruviaro, C.F. Carbon footprint and Life Cycle Costing of beef cattle in the Brazilian midwest. J. Clean. Prod. 2017, 147, 119–129. [Google Scholar] [CrossRef]
- Kanyarushoki, C.; Fuchs, F.; van der Werf, H. Environmental evaluation of cow and goat milk chains in France. Int. J. Life Cycle Assess. 2009, 13, 75–86. [Google Scholar]
- Robertson, K.; Symes, W.; Garnham, M. Carbon footprint of dairy goat milk production in New Zealand. J. Dairy Sci. 2015, 98, 4279–4293. [Google Scholar] [CrossRef]
- Pardo, G.; Martin-Garcia, I.; Arco, A.; Yañez-Ruiz, D.R.; Moral, R.; Del Prado, A. Greenhouse-gas mitigation potential of agro-industrial by-products in the diet of dairy goats in Spain: A life-cycle perspective. Anim. Prod. Sci. 2016, 56, 646–654. [Google Scholar] [CrossRef]
- Casey, J.W.; Holden, N.M. Greenhouse Gas Emissions from Conventional, Agri-Environmental Scheme, and Organic Irish Suckler-Beef Units. J. Environ. Qual. 2006, 35, 231. [Google Scholar] [CrossRef]
- Tsutsumi, M.; Ono, Y.; Ogasawara, H.; Hojito, M. Life-cycle impact assessment of organic and non-organic grass-fed beef production in Japan. J. Clean. Prod. 2018, 172, 2513–2520. [Google Scholar] [CrossRef]
- Ripoll-Bosch, R.; de Boer, I.J.M.; Bernués, A.; Vellinga, T. V Accounting for multi-functionality of sheep farming in the carbon footprint of lamb: A comparison of three contrasting Mediterranean systems. Agric. Syst. 2013, 116, 60–68. [Google Scholar] [CrossRef]
- Wiedemann, S.G.; Ledgard, S.F.; Henry, B.K.; Yan, M.-J.; Mao, N.; Russell, S.J. Application of life cycle assessment to sheep production systems: Investigating co-production of wool and meat using case studies from major global producers. Int. J. Life Cycle Assess. 2015, 20, 463–476. [Google Scholar] [CrossRef]
- Patra, A.K. Accounting methane and nitrous oxide emissions, and carbon footprints of livestock food products in different states of India. J. Clean. Prod. 2017, 162, 678–686. [Google Scholar] [CrossRef]
- Bava, L.; Zucali, M.; Sandrucci, A.; Tamburini, A. Environmental impact of the typical heavy pig production in Italy. J. Clean. Prod. 2017, 140, 685–691. [Google Scholar] [CrossRef]
- Wiedemann, S.G.; McGahan, E.J.; Murphy, C.M. Environmental impacts and resource use from Australian pork production assessed using life-cycle assessment. 1. Greenhouse gas emissions. Anim. Prod. Sci. 2016, 56, 1418. [Google Scholar] [CrossRef]
- Wiedemann, S.G.; McGahan, E.J.; Murphy, C.M. Environmental impacts and resource use from Australian pork production determined using life cycle assessment. 2. Energy, water and land occupation. Anim. Prod. Sci. 2018, 58, 1153. [Google Scholar] [CrossRef]
- Gaspar, P.; Mesías, F.J.; Escribano, M.; Pulido, F. Sustainability in Spanish extensive farms (Dehesas): An economic and management indicator-based evaluation. Rangel. Ecol. Manag. 2009, 62, 153–162. [Google Scholar] [CrossRef]
- Peco, B.; Sánchez, A.M.; Azcárate, F.M. Abandonment in grazing systems: Consequences for vegetation and soil. Agric. Ecosyst. Environ. 2006, 113, 284–294. [Google Scholar] [CrossRef]
- Schnabel, S.C. Soil Erosion and Runoff Production in a Small Watershed Under Silvo-Pastoral Landuse (Dehesa) in Extremadura, Spain; Geoforma: Logroño, Spain, 1997; ISBN 84-87779-29-8. [Google Scholar]
- Langa Gonzalo, J. El impacto de la aplicación de la PAC en las producciones ganaderas de la dehesa (1986-2010). In La agricultura y la Ganadería Extremeñas en 2010; Caja de Ahorros de Badajoz: Badajoz, Spain, 2010; pp. 181–196. [Google Scholar]
- Franco, J.A.; Gaspar, P.; Mesias, F.J. Economic analysis of scenarios for the sustainability of extensive livestock farming in Spain under the CAP. Ecol. Econ. 2012, 74, 120–129. [Google Scholar] [CrossRef]
- MAPA. Agricultura Ecológica Estadisticas 2018; Ministerio de Agricultura, Pesca y Alimentación. Subdirección General de Calidad Diferenciada y Producción Ecológica; Centro de Publicaciones: Madrid, Spain, 2019. [Google Scholar]
- Gaspar, P.; Mesías, F.J.; Escribano, M.; Rodriguez De Ledesma, A.; Pulido, F. Economic and management characterization of dehesa farms: Implications for their sustainability. Agrofor. Syst. 2007, 71, 151–162. [Google Scholar] [CrossRef]


| System Types Description | Photograph |
|---|---|
| Beef cattle farm (calves): Average-size extensive beef cattle farm of 140 ha, with 7.1% of the area dedicated to crops. The expense in feed is approximately 266.7 kg of fodder */reproductive animal and 357.3 kg of concentrates/reproductive animal. The end product of this farm is the sale of weaned claves of approximately 200–250 kg of live weight. |  |
| Beef cattle farm (yearlings): Small-size extensive beef cattle farm (105 ha) where 2.9% of the area is dedicated to crops. The expense in feed is approximately 136 kg of fodder */reproductive animal and 325.6 kg of concentrates/reproductive animal. The end product of this farm is the sale of finished yearlings with an approximate weight of 500 kg of live weight for males and 400 kg of live weight for females. |  |
| Meat sheep farm (lambs 23 kg live weight): Extensive sheep farm of 370 hectares of land and 13.5% of the area dedicated to crops. The expense in feed per sheep is 44.4 kg of fodder */reproductive animal and 103.7 kg of concentrates/reproductive animal and the end product is the sale of sheep of 23 kg of live weight 3 months old. |  |
| Meat sheep farm (lambs 18.5 kg live weight): Extensive sheep farm with a total area of 500 hectares. The area dedicated to crops is 18% a year. The expense in feed is 58.8 kg of fodder */reproductive animal and 85.9 kg of concentrates/reproductive animal. The end product is the sale of sheep of 18.5 kg of live weight approximately from 2 to 2.5 months old. |  |
| Dairy goat semi-extensive farm: Small-size farm (80 ha), with an area of 10% dedicated to crops. The expense in feed per reproductive animal is 72.7 kg of fodder */reproductive animal and 353.8 kg of concentrates/reproductive animal. The end product is the sale of organic milk. |  |
| Iberian pig montanera 1 fattening farm: Iberian pig farm with 50% pure breed pigs, of an area of 300 hectares and 13.3% of the area dedicated to crops. The farm buys its piglets. The end product is the sale of pigs of approximately 160 kg of live weight (age from 14–16 months) which have been fattened on the montanera system. |  |
| Iberian pig closed herd farm: 100% pure Iberian pig farm, with a total area of 230 ha, and 2.2% of the area dedicated to crops. The expense in feed per animal in this farm is 484.4 kg. The end product is the sale of fattening pigs of 40 kg (age from 3–4 months) and montanera pigs of 170 kg in live weight (age from 16–18 months) |  |
| Emission and Source | Type of GHG | Emission Factors | Unit |
|---|---|---|---|
| On-farm | |||
| Enteric fermentation | CH4 | 51.06 kg CH4/cow a year a | kg CH4/year |
| CH4 | 7.64 kg CH4/sheep a year a | kg CH4/year | |
| CH4 | 5 kg CH4/goat a year a | kg CH4/year | |
| CH4 | 2.75 kg CH4/breeding pig a year a | kg CH4/year | |
| CH4 | 0.62 kg CH4/growing-finishing pig a year a | kg CH4/year | |
| Manure management | |||
| Manure management CH4 | CH4 | 6.91 kg CH4/cow a year b | kg CH4/year |
| CH4 | 0.28 kg CH4/sheep a year b | kg CH4/year | |
| CH4 | 0.21 kg CH4/goat a year b | kg CH4/year | |
| CH4 | 18.76 kg CH4/breeding pig a year b | kg CH4/year | |
| CH4 | 7.59 kg CH4/growing-finishing pig a year b | kg CH4/year | |
| Manure management direct N2O | N2O | 0.005 kg N2O eN/kg N solid storage system c | kg N2O/year d |
| Manure management indirect N2O | N2O | 0.01 kg N2O eN/volatilized c | kg N2O/year d |
| Soil management | |||
| N from urine and dung inputs to grazed soils in Cow (Iberian swine) | N2O | 0.02 kg N2O eN (kg N input)−1 c | kg N2O/year d |
| N from urine and dung inputs to grazed soils in Sheep | N2O | 0.01 kg N2O eN (kg N input)−1 c | kg N2O/year d |
| N from urine and dung inputs to grazed soils in Goat | N2O | 0.01 kg N2O eN (kg N input)−1 c | kg N2O/year d |
| Indirect emissions soil management | N2O | 0.01 kg N2O eN (kg % N volatilized/leaching)−1 c | kg N2O/year d |
| Off-farm | |||
| Concentrates Meat Cow | CO2 | 0.410 kg CO2eq/kg e | kg CO2eq/year |
| Concentrates Meat Calf | CO2 | 0.445 kg CO2eq/kg e | kg CO2eq/year |
| Concentrates Meat sheep | CO2 | 0.410 kg CO2eq/kg e | kg CO2eq/year |
| Concentrates Meat Lamb | CO2 | 0.410 kg CO2eq/kg e | kg CO2eq/year |
| Concentrates Dairy Goat | CO2 | 0.410 kg CO2eq/kg e | kg CO2eq/year |
| Concentrates Piglet, 2nd stage feed | CO2 | 0.227 kg CO2eq/kg e | kg CO2eq/year |
| Straw | CO2 | 0.100 kg CO2eq/kg e | kg CO2eq/year |
| Hay | CO2 | 0.170 kg CO2eq/kg e | kg CO2eq/year |
| Wheat | CO2 | 0.335 kg CO2eq/kg e | kg CO2eq/year |
| Barley | CO2 | 0.305 kg CO2eq/kg e | kg CO2eq/year |
| Pea | CO2 | 0.116 kg CO2eq/kg e | kg CO2eq/year |
| Electricity | CO2 | 0.410 kg CO2eq/kWh f | kg CO2eq/year |
| Fuel | CO2 | 2.664 kg CO2eq/L-Combustion e | kg CO2eq/year |
| CO2 | 0.320 kg CO2eq/L-upstream e | kg CO2eq/year |
| System Types Indicators | Beef Cattle (Calves) | Beef Cattle (Yearlings) | Meat Sheep (Lambs 23) | Meat Sheep (Lambs 18.5) | Dairy Goat | Iberian Pig Montanera Fattening | Iberian Pig Closed Herd |
|---|---|---|---|---|---|---|---|
| Total Area (ha) | 140 | 105 | 370 | 500 | 80 | 300 | 230 |
| Average annual temperature (°C) | 16.1 | 15.7 | 15.6 | 15.6 | 15 | 16 | 15.5 |
| Pasture area (%) c | 92.9 | 97.1 | 86.5 | 82 | 81.2 | 86.7 | 97.8 |
| Wooded area (%) | 100 | 97.1 | - | - | 31.2 | 100 | 100 |
| Cultivated area (%) | 7.1 | 2.9 | 13.5 | 18 | 18.8 | 13.3 | 2.2 |
| No. of reproductive females (average population) | 75 | 25 | 900 | 1700 | 110 | - | 22 |
| Total stocking rate (LU b/ha) | 0.59 | 0.3 | 0.44 | 0.60 | 0.24 | 0.18 | 0.19 |
| No. of weaned animals/reproductive females | 0.73 | 0.68 | 1.1 | 1.15 | 1.7 | - | 9.2 |
| Inputs purchased by the farm | |||||||
| Total kg of fodder/reproductive animal | 266.7 | 136 | 44.4 | 58.8 | 72.7 | - | - |
| Total kg of concentrates/reproductive animal | 357.3 | 325.6 | 103.7 | 85.9 | 353.8 | - | 484.4 |
| Outputs produced by the farm | |||||||
| No. of animals sold/reproductive animals | 0.73 | 0.68 | 1 | 1.1 | 1.44 | - | 9 |
| Liters of milk sold/year | - | - | - | - | 30,000 | - | - |
| Weight (kg) average of animals sold | 220 | * 400/500 | 23 | 18.5 | 9 | 160 | ** 40/170 |
| kg of weaned animals | 12,100 | - | 22,770 | 36,075 | 2061 | - | 4000 |
| kg of fattening animals | - | 8500 | - | - | - | 22,400 | 17,000 |
| Total live weight (kg) produced (FU c) | 12,100 | 8500 | 22,770 | 36,075 | 2061 | 22,400 | 21,000 |
| Beef Cattle (Calves) | Beef Cattle (Yearlings) | Meat Sheep (Lambs 23) | Meat Sheep (Lambs 18.5) | Dairy Goat | Iberian Pig Montanera Fattening | Iberian Pig Closed Herd | ||||||||
|---|---|---|---|---|---|---|---|---|---|---|---|---|---|---|
| GHG Emissions | kg CO2eq/kg Product | % | kg CO2eq/kg Product | % | kg CO2eq/kg Product | % | kg CO2eq/kg Product | % | kg CO2eq/kg FPMC | % | kg CO2eq/kg Product | % | kg CO2eq/kg Product | % |
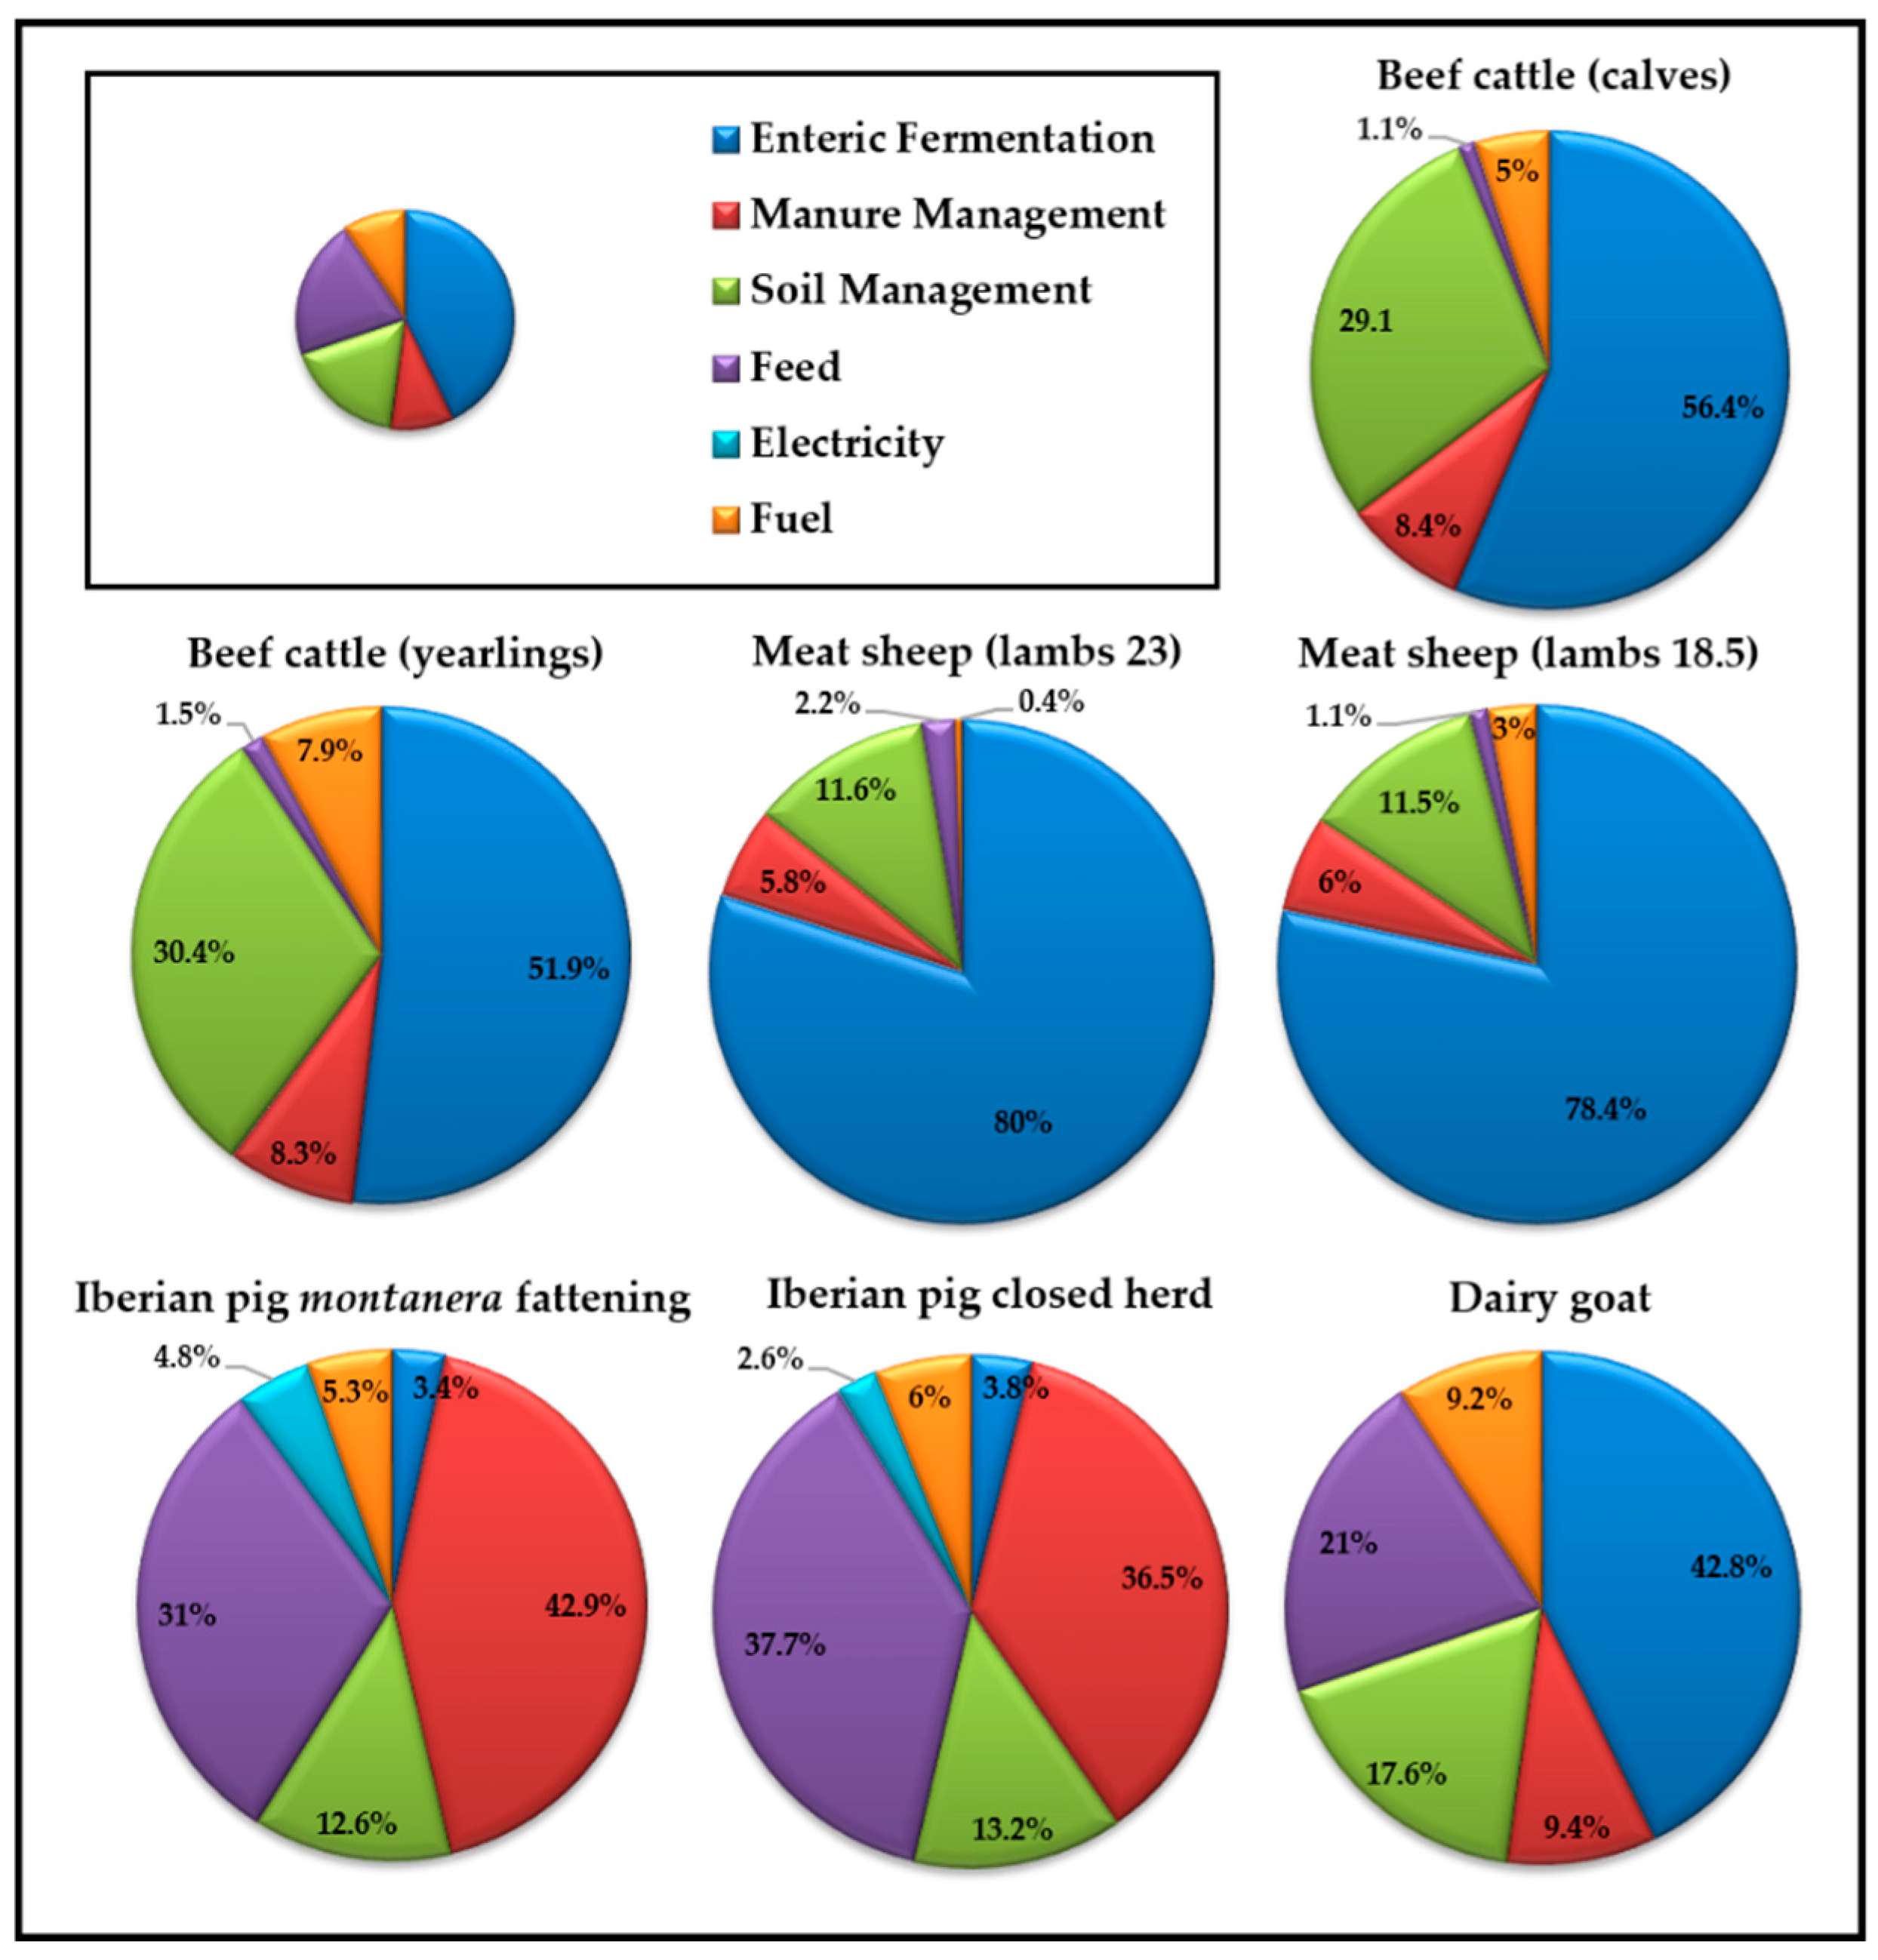
| Enteric fermentation CH4 | 9.18 | 56.42 | 5.41 | 51.87 | 9.13 | 79.95 | 10.38 | 78.40 | 0.51 | 42.86 | 0.1 | 3.41 | 0.16 | 3.85 |
| Manure management | ||||||||||||||
| CH4 | 1.24 | 7.62 | 0.73 | 7 | 0.33 | 2.89 | 0.38 | 2.87 | 0.02 | 1.68 | 1.19 | 40.61 | 1.46 | 35.10 |
| Direct N2O | 0.12 | 0.74 | 0.14 | 1.34 | 0.33 | 2.89 | 0.41 | 3.10 | 0.0919 | 7.72 | 0.07 | 3.39 | 0.06 | 1.44 |
| Indirect N2O | 0.00046 | 0.00 | 0.00056 | 0.01 | 0.0013 | 0.01 | 0.0016 | 0.01 | 0.0004 | 0.03 | 0.0003 | 0.01 | 0.0002 | 0.00 |
| Total manure management | 1.36 | 8.36 | 0.87 | 8.35 | 0.66 | 5.79 | 0.79 | 5.98 | 0.112 | 9.44 | 1.26 | 43.01 | 1.52 | 36.54 |
| Soil management | ||||||||||||||
| Direct N2O soil | 4.15 | 25.51 | 2.41 | 23.11 | 1.11 | 9.72 | 1.27 | 9.59 | 0.21 | 17.65 | 0.34 | 11.60 | 0.50 | 12.02 |
| Indirect N2O soil | 0.58 | 3.56 | 0.76 | 7.29 | 0.22 | 1.93 | 0.25 | 1.89 | 0 | 0.00 | 0.03 | 1.02 | 0.05 | 1.20 |
| Total soil management | 4.73 | 29.07 | 3.17 | 30.39 | 1.33 | 11.65 | 1.52 | 11.48 | 0.21 | 17.65 | 0.37 | 12.63 | 0.55 | 13.22 |
| Total On-farm Emissions | 15.27 | 93.86 | 9.45 | 90.61 | 11.12 | 97.38 | 12.69 | 95.86 | 0.83 | 69.94 | 1.73 | 59.05 | 2.07 | 53.61 |
| Feeding | ||||||||||||||
| Concentrate feed cows | 0.1 | 0.61 | - | - | - | - | - | - | ||||||
| Concentrate fattening calves | - | 0.16 | 1.53 | - | - | - | - | - | ||||||
| Concentrate sheep | - | - | 0.20 | 1.75 | 0.06 | 0.45 | - | - | - | |||||
| Concentrate lambs | - | - | 0.05 | 0.44 | 0.09 | 0.68 | - | - | - | |||||
| Concentrate goats | - | - | - | - | 0.25 | 21.01 | - | - | ||||||
| Concentrate growth pigs | - | - | - | - | - | 0.91 | 31.06 | - | ||||||
| Seeds (wheat, barley, vetch) | - | - | - | - | 1.57 | 37.74 | ||||||||
| Straw | 0.08 | 0.49 | - | - | - | - | - | - | ||||||
| Hay | - | - | - | - | - | - | - | |||||||
| Total Feeding | 0.18 | 1.11 | 0.16 | 1.53 | 0.25 | 2.19 | 0.18 | 1.13 | 0.25 | 21.01 | 0.91 | 31.06 | 1.57 | 37.74 |
| Electricity | - | - | - | - | - | 0.14 | 4.78 | 0.11 | 2.64 | |||||
| Fuel | ||||||||||||||
| Production | 0.09 | 0.55 | 0.09 | 0.86 | 0.005 | 0.04 | 0.041 | 0.31 | 0.012 | 1.01 | 0.017 | 0.58 | 0.027 | 0.65 |
| Combustion | 0.73 | 4.49 | 0.73 | 7 | 0.043 | 0.38 | 0.36 | 2.72 | 0.098 | 8.24 | 0.14 | 4.78 | 0.23 | 5.53 |
| Total fuel | 0.82 | 5.04 | 0.82 | 7.86 | 0.048 | 0.42 | 0.403 | 3.03 | 0.11 | 9.24 | 0.16 | 5.36 | 0.25 | 6.01 |
| Total Off-farm Emissions | 1 | 6.15 | 0.98 | 9.40 | 0.30 | 2.61 | 0.58 | 4.16 | 0.36 | 30.25 | 1.20 | 41.19 | 1.93 | 46.39 |
| TOTAL CF kg CO2eq/FU | 16.27 | 100 | 10.43 | 100 | 11.42 | 100 | 13.24 | 100 | 1.19 | 100 | 2.94 | 100 | 4.16 | 100 |
| Total kg de CO2eq | 200,857 | 90,454 | 260,314 | 477,724 | 40,635 | 67,267 | 97,153 | |||||||
| Total kg de CO2eq/ha | 1434.7 | 861.5 | 717.9 | 974.9 | 518.3 | 224.2 | 422.4 | |||||||
| Sequestered CO2 | Beef Cattle (Calves) | Beef Cattle (Yearlings) | Meat Sheep (Lambs 23) | Meat Sheep (Lambs 18.5) | Dairy Goat | Iberian Pig Montanera Fattening | Iberian Pig Closed Herd |
|---|---|---|---|---|---|---|---|
| C from pasture and crops waste | |||||||
| Pasture waste (kg DM) a | 276,640 | 217,056 | 486,400 | 623,200 | 153,216 | 553,280 | 478,800 |
| Above ground kg C | 32,760 | 25,704 | 57,600 | 73,800 | 18,144 | 65,520 | 56,700 |
| Below ground kg C b | 91,728 | 71,971 | 161,280 | 206,640 | 50,803 | 183,456 | 158,760 |
| Crop waste (kg DM) | 101,840 | 30,552 | 408,880 | 735,984 | 71,829 | 327,104 | 319,200 |
| Above ground kg C | 12,060 | 3618 | 48,420 | 87,156 | 8506 | 38,736 | 37,800 |
| Below ground kg C | 33,768 | 10,130 | 135,576 | 244,037 | 23,817 | 241,024 | 235,200 |
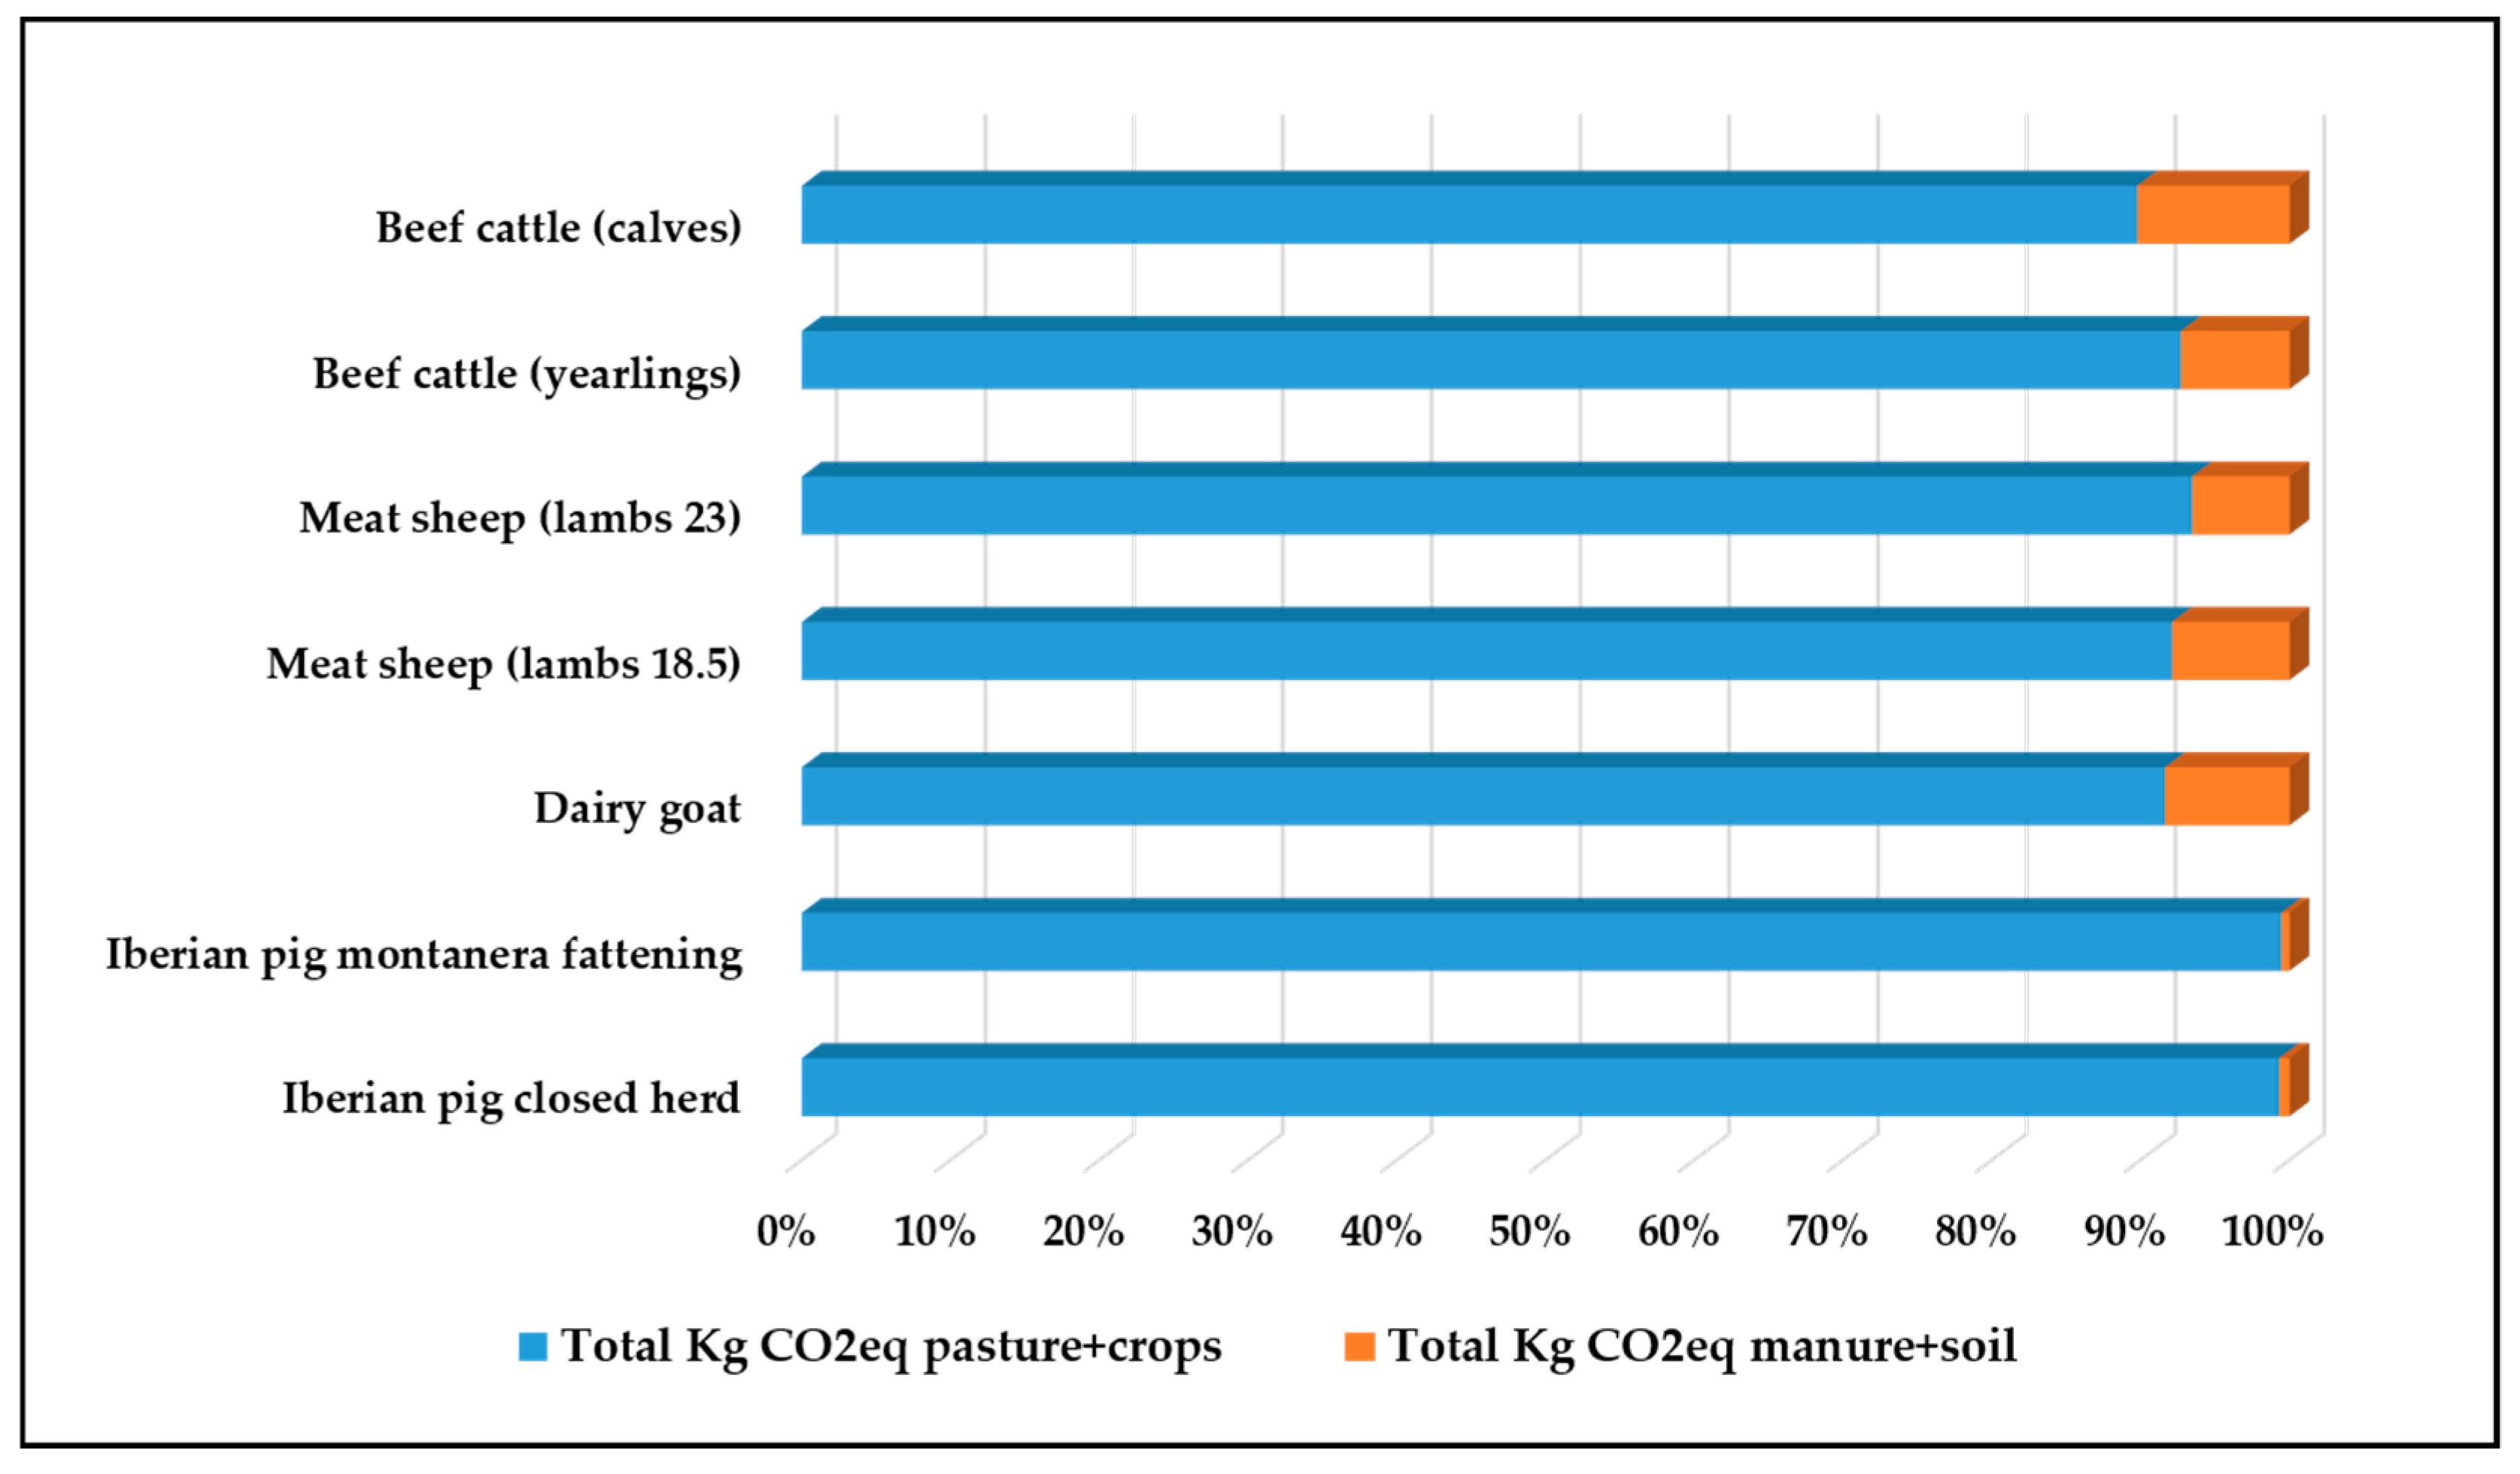
| Total kg CO2eq pasture + crops | 624,492 | 408,553 | 1,477,212 | 2,242,653 | 371,325 | 1,452,634 | 1,316,700 |
| C from organic N (manure and grazing) | |||||||
| kg N excreted | 5955 | 2694 | 8648 | 16,095 | 2838 | 3323 | 3798 |
| kg C from applied manure | 3638 | 2177 | 10,571 | 20,517 | 5801 | 216 | 185 |
| kg C during grazing | 15,715 | 6578 | 17,534 | 31,791 | 4879 | 1944 | 2284 |
| Total kg CO2eq manure + soil c | 70,962 | 32,102 | 103,050 | 191,796 | 33,820 | 7919 | 9052 |
| Total kg CO2eq/farm | 695,454 | 440,655 | 1,580,262 | 2,434,450 | 405,144 | 1,460,553 | 1,325,753 |
| Total kg CO2eq manure-soil/ha | 507 | 306 | 279 | 384 | 517 | 135 | 201 |
| Total kg CO2eq farm/ha | 4968 | 4197 | 4271 | 4869 | 5064 | 3646 | 3712 |
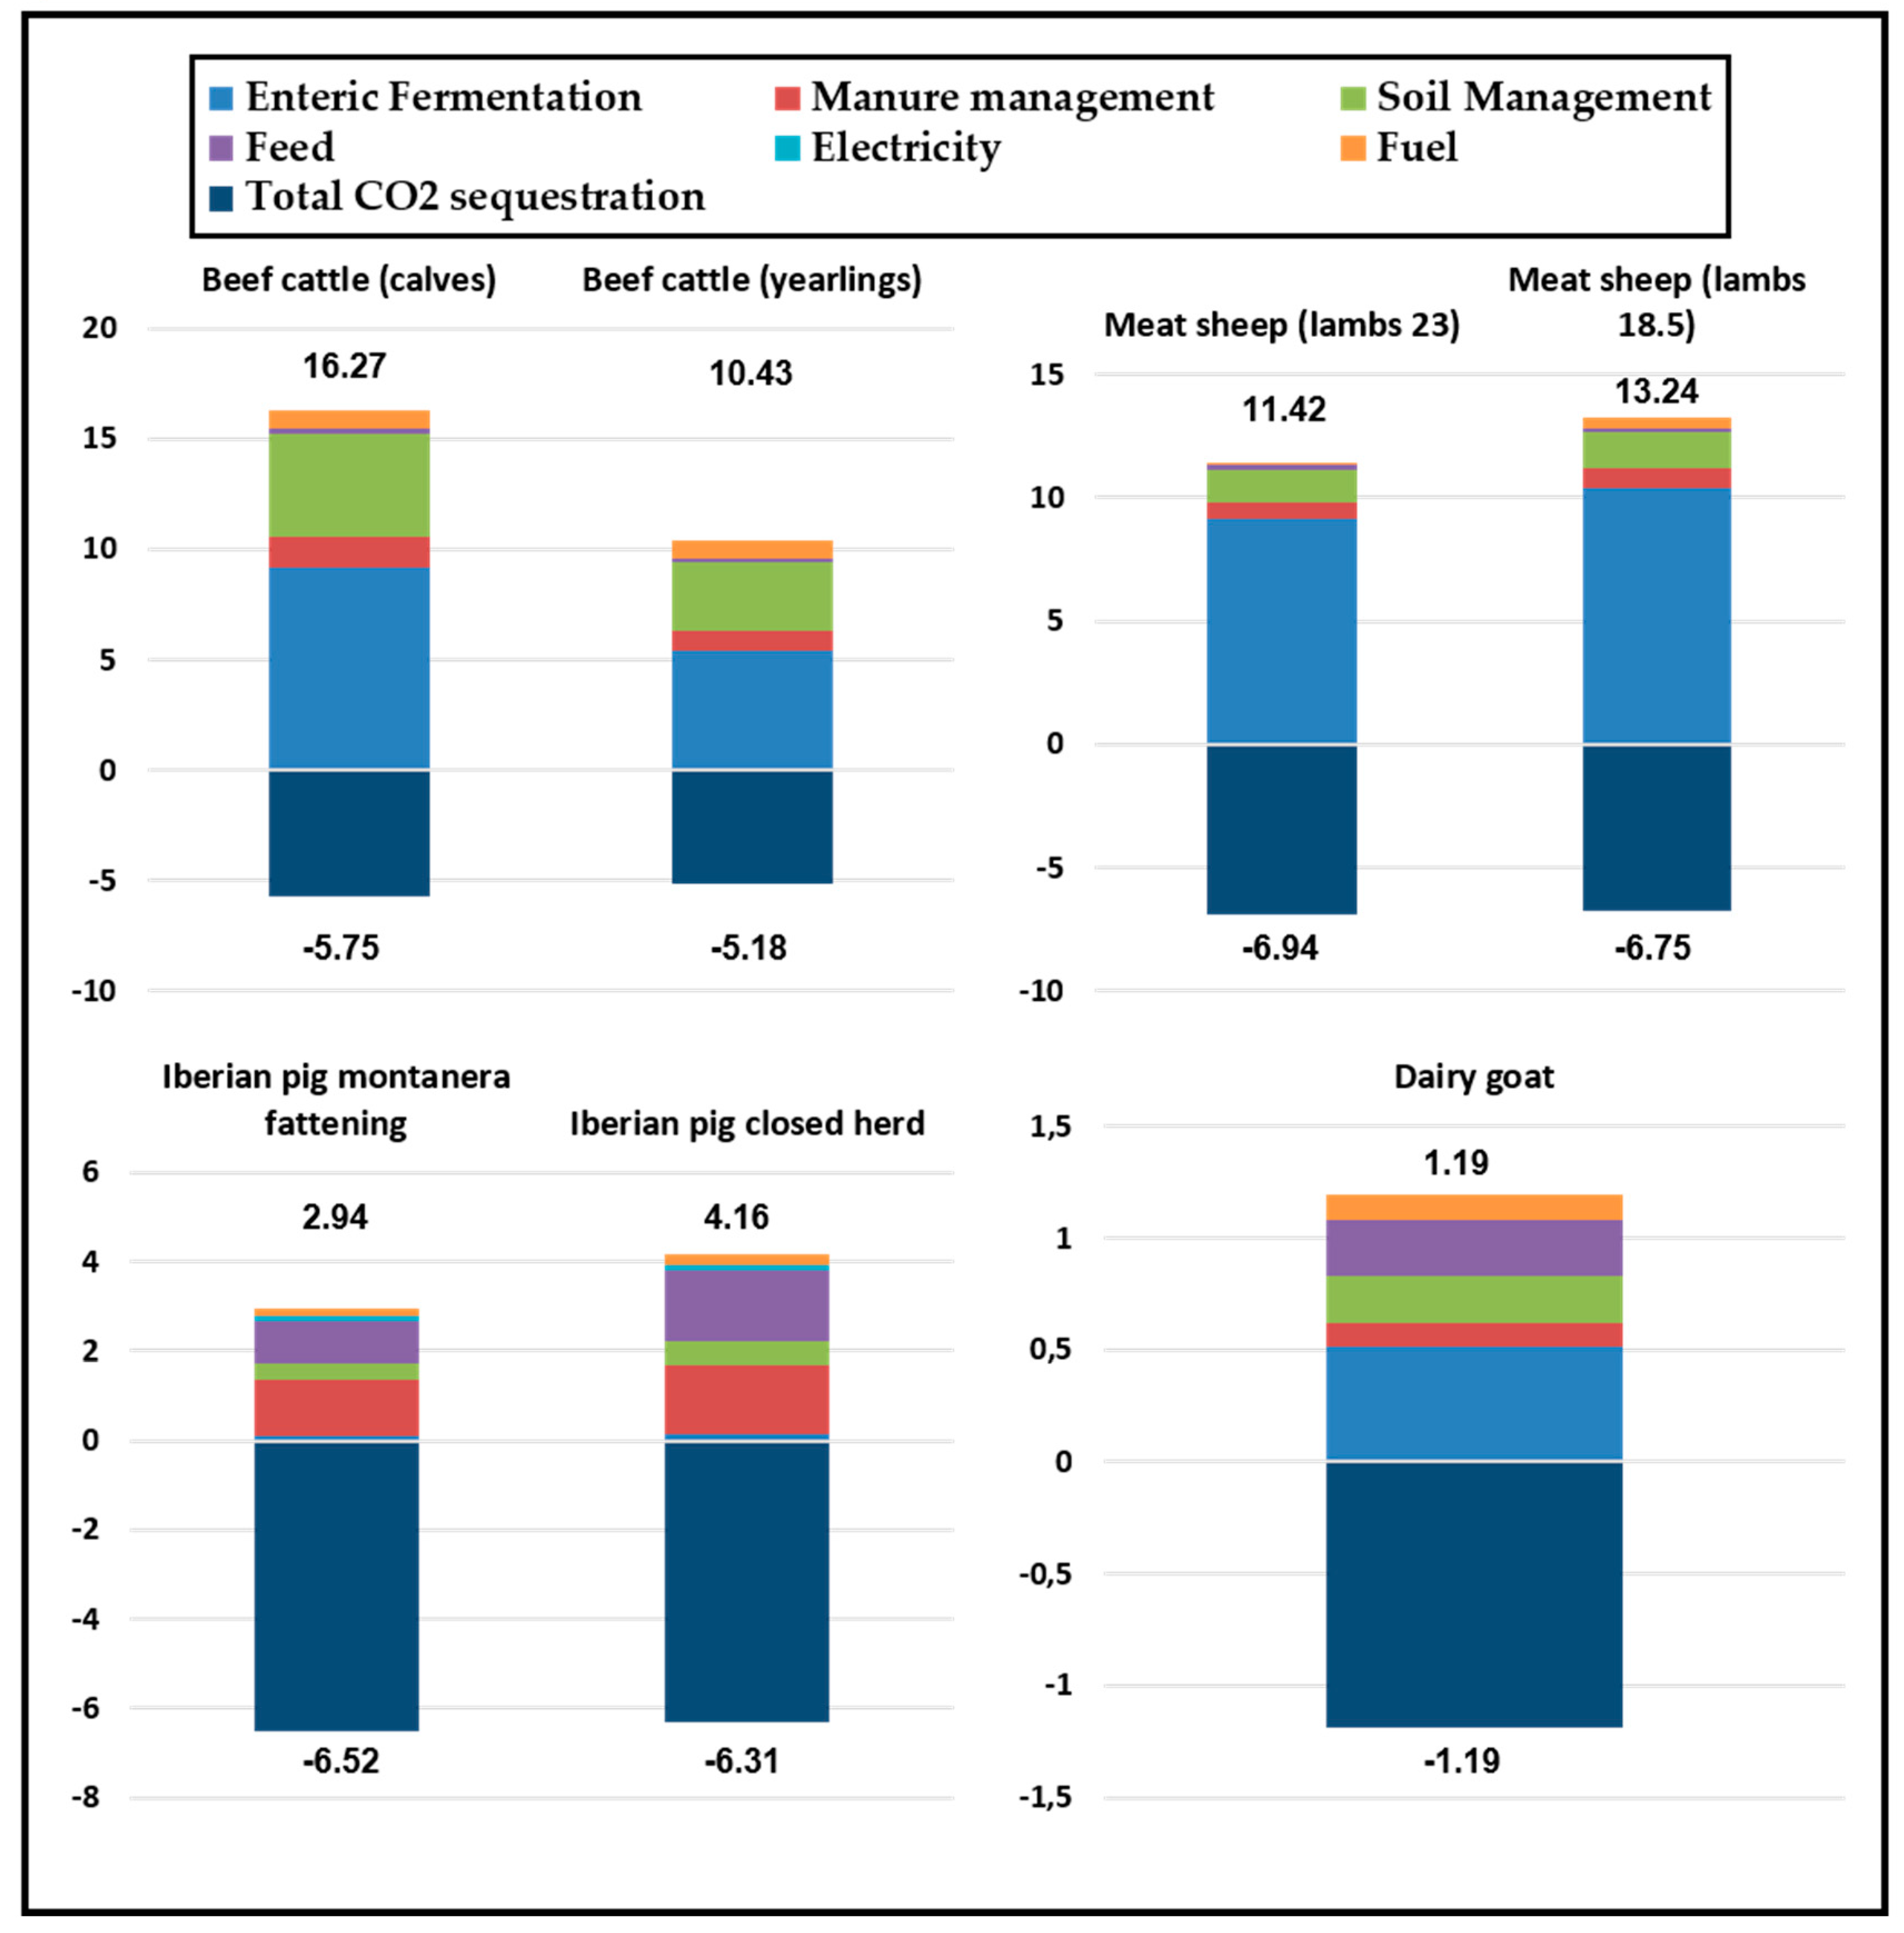
| kg CO2 pasture + crops sequestration | 62,449 | 40,855 | 147,721 | 224,265 | 37,132 | 145,263 | 131,670 |
| kg CO2 manure + soil sequestration | 7096 | 3210 | 10,305 | 19,180 | 3382 | 792 | 905 |
| Total kg CO2 sequestration | 69,545 | 44,066 | 158,026 | 243,445 | 40,514 | 146,055 | 132,575 |
| Total CO2 sequestration (kg CO2eq/FU/year) d | 5.75 | 5.18 | 6.94 | 6.75 | 1.19 | 6.52 | 6.31 |
| Total CO2 sequestration (kg CO2eq/ha/year-) | 497 | 420 | 427 | 487 | 506 | 487 | 576 |
| Compensated CF | |||||||
| Compensated CF/functional unit (kg of CO2eq/FU) | 10.52 | 5.25 | 4.48 | 6.49 | 0 | −3.58 | −2.15 |
| Compensated CF/ha (kg of CO2eq/ha) | 938 | 442 | 291 | 488 | 12 | −263 | −154 |
© 2020 by the authors. Licensee MDPI, Basel, Switzerland. This article is an open access article distributed under the terms and conditions of the Creative Commons Attribution (CC BY) license (http://creativecommons.org/licenses/by/4.0/).
Share and Cite
Horrillo, A.; Gaspar, P.; Escribano, M. Organic Farming as a Strategy to Reduce Carbon Footprint in Dehesa Agroecosystems: A Case Study Comparing Different Livestock Products. Animals 2020, 10, 162. https://doi.org/10.3390/ani10010162
Horrillo A, Gaspar P, Escribano M. Organic Farming as a Strategy to Reduce Carbon Footprint in Dehesa Agroecosystems: A Case Study Comparing Different Livestock Products. Animals. 2020; 10(1):162. https://doi.org/10.3390/ani10010162
Chicago/Turabian StyleHorrillo, Andrés, Paula Gaspar, and Miguel Escribano. 2020. "Organic Farming as a Strategy to Reduce Carbon Footprint in Dehesa Agroecosystems: A Case Study Comparing Different Livestock Products" Animals 10, no. 1: 162. https://doi.org/10.3390/ani10010162
APA StyleHorrillo, A., Gaspar, P., & Escribano, M. (2020). Organic Farming as a Strategy to Reduce Carbon Footprint in Dehesa Agroecosystems: A Case Study Comparing Different Livestock Products. Animals, 10(1), 162. https://doi.org/10.3390/ani10010162