Effects of Dietary Non-Fibrous Carbohydrate (NFC) to Neutral Detergent Fiber (NDF) Ratio Change on Rumen Bacteria in Sheep Based on Three Generations of Full-Length Amplifiers Sequencing

 , ,
, , 
Simple Summary
Abstract
1. Introduction
2. Materials and Methods
2.1. Animals and Dietary Composition
2.2. The Experimental Design and Sample Collection
2.3. Sample Measurements
DNA Extraction, PCR, and Pacio Sequencing
2.4. The Sequence Analysis
2.5. Statistical Analyses
3. Results
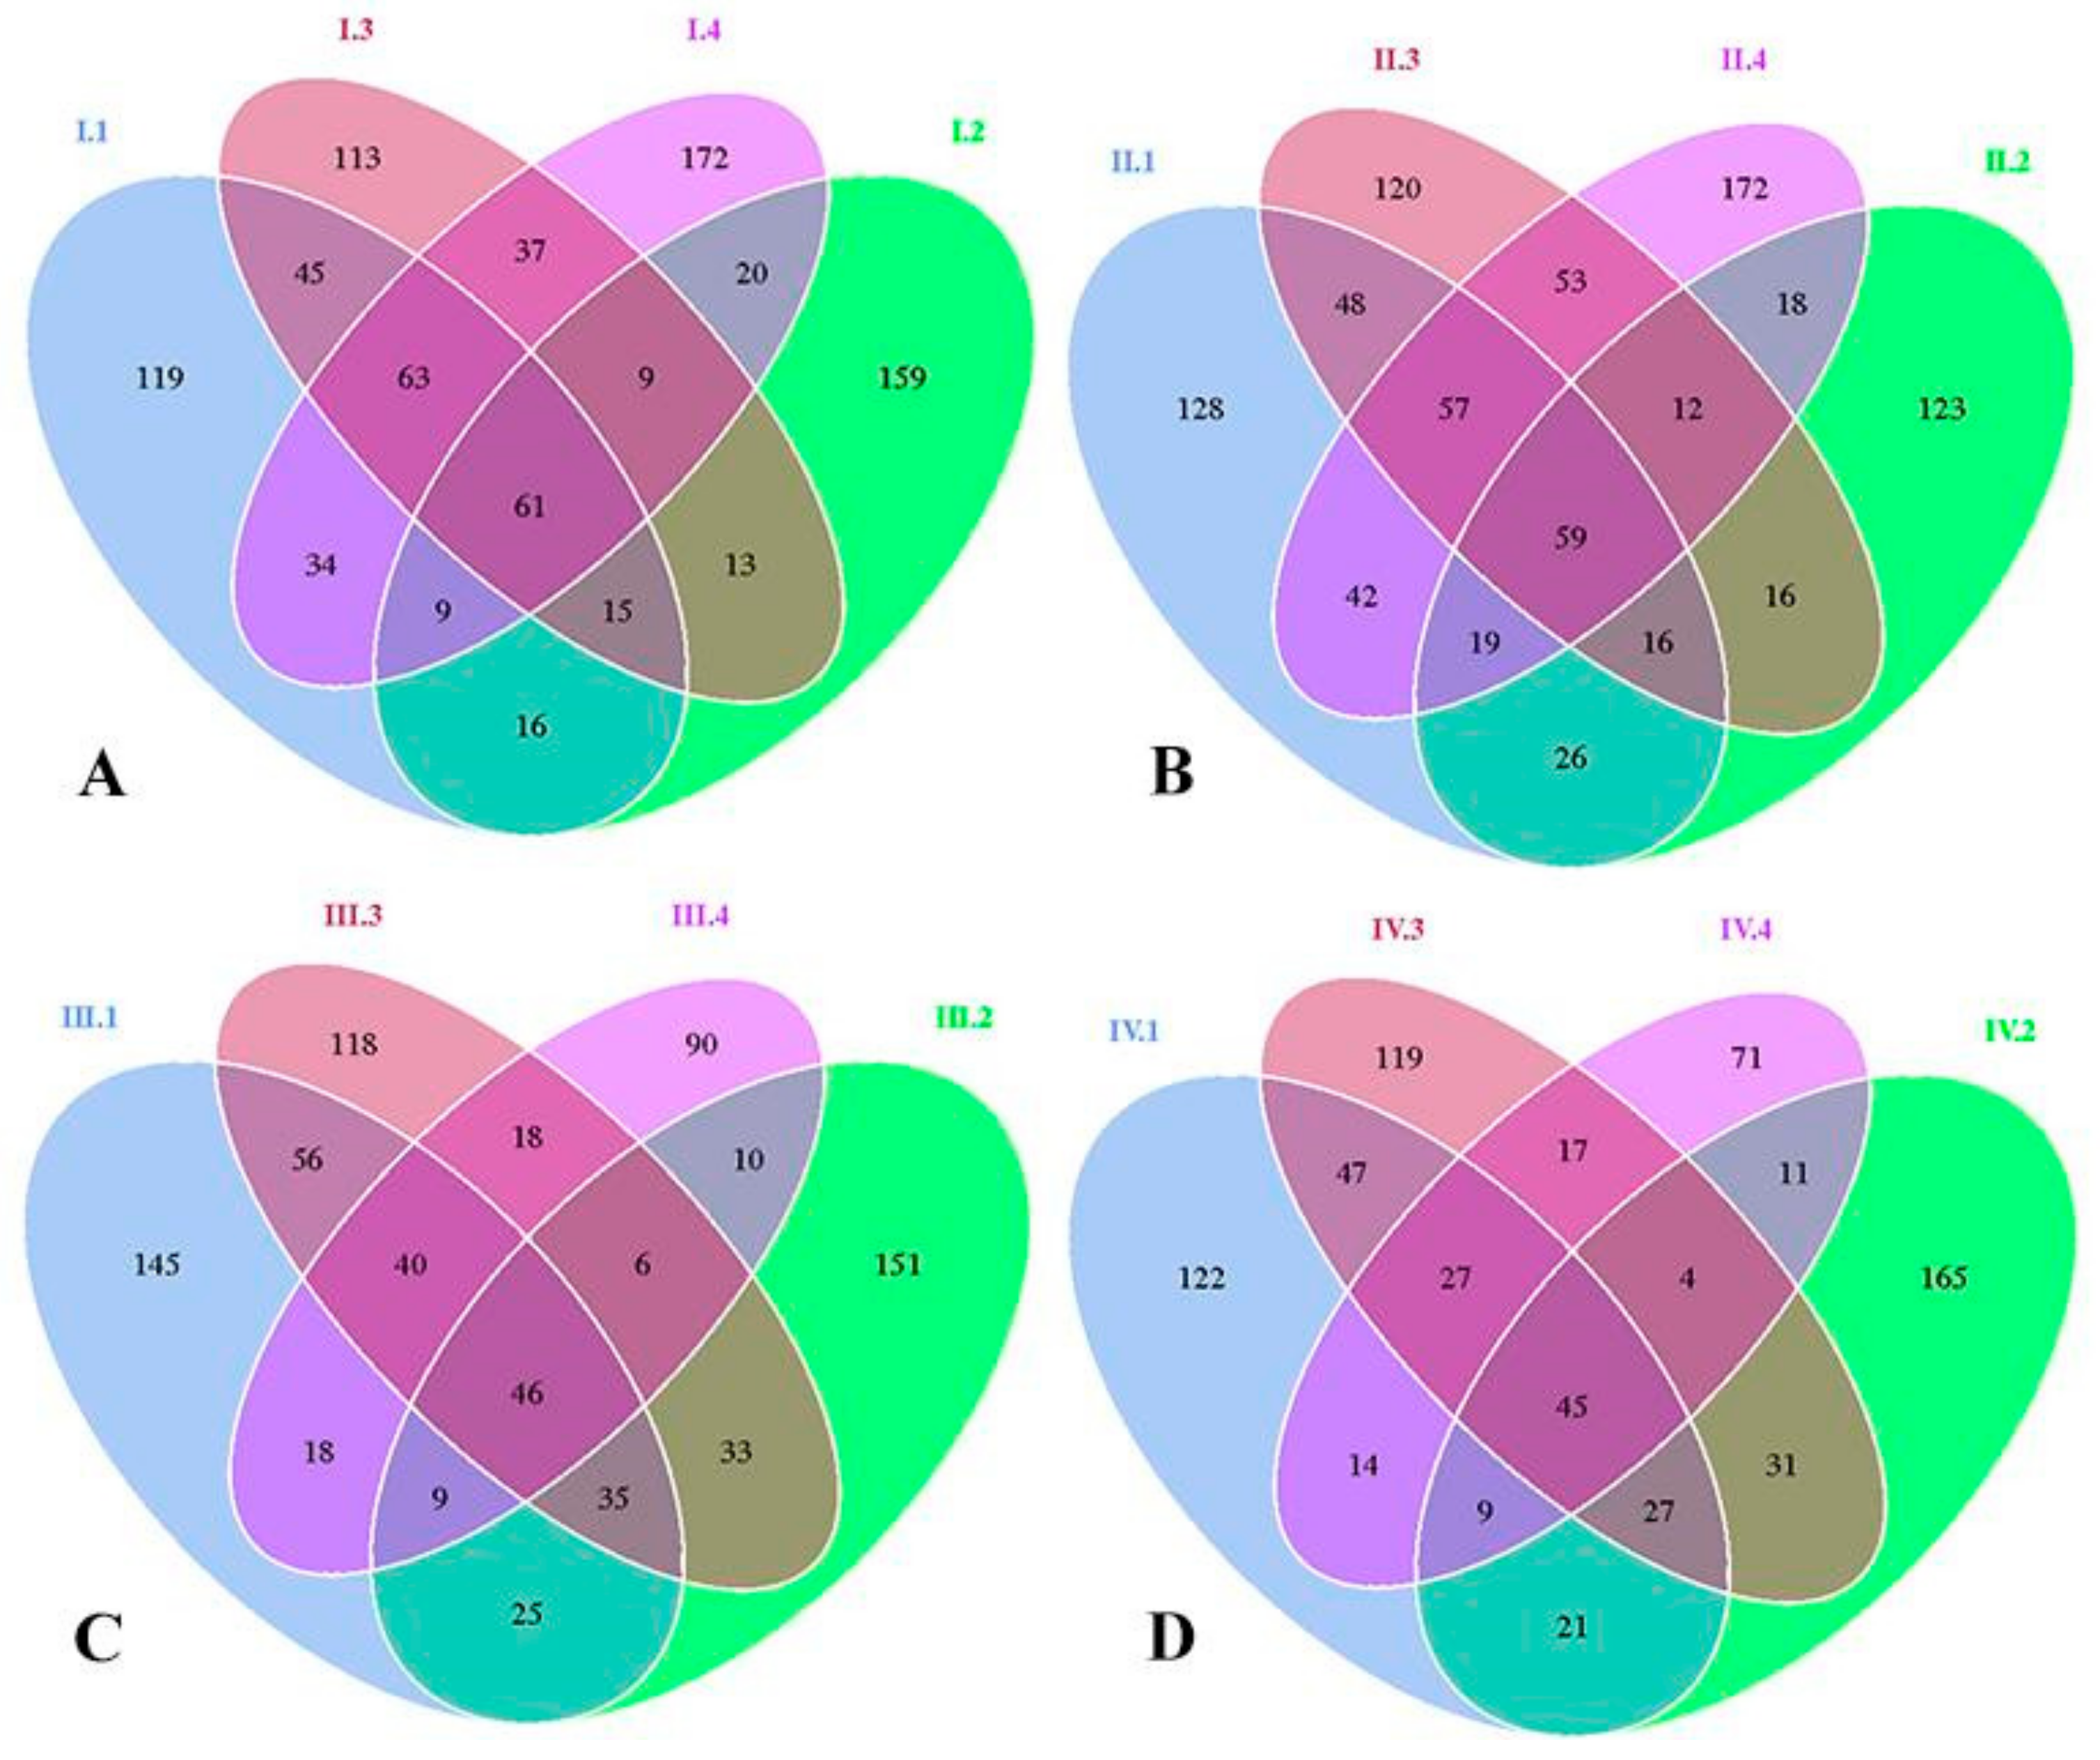
3.1. OTUs Analysis
3.2. Alpha Diversity of OTUs
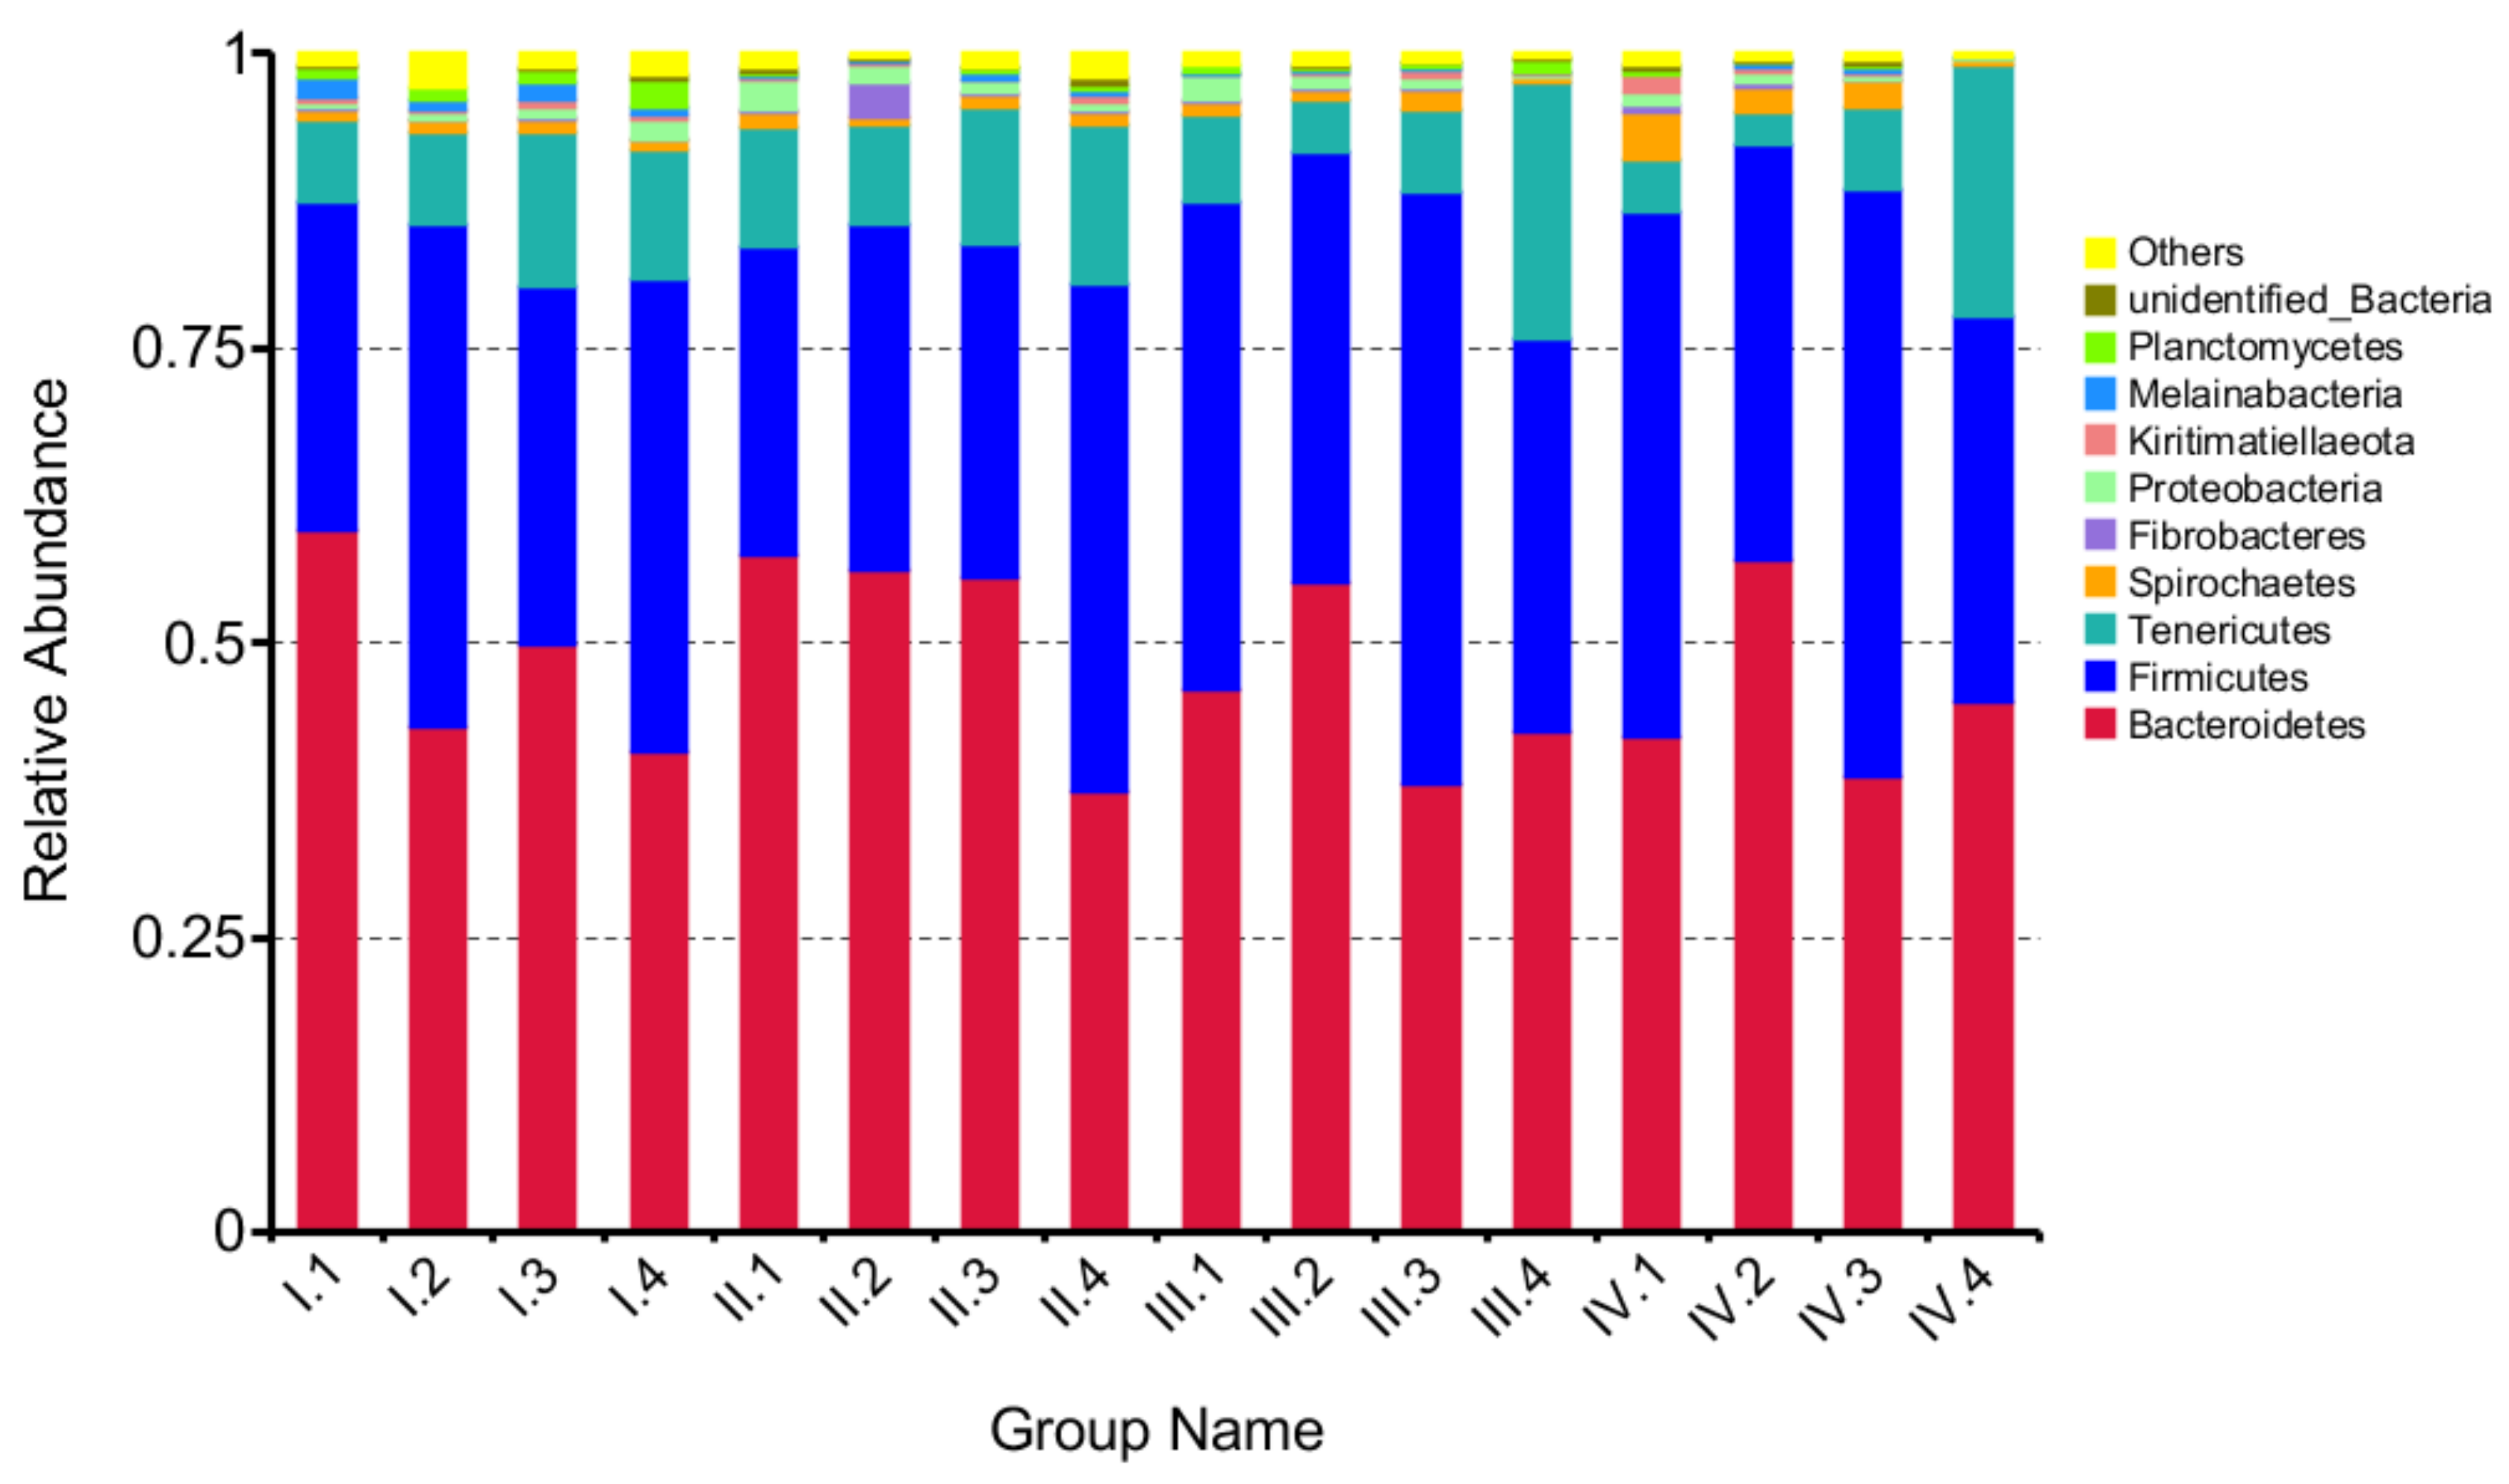
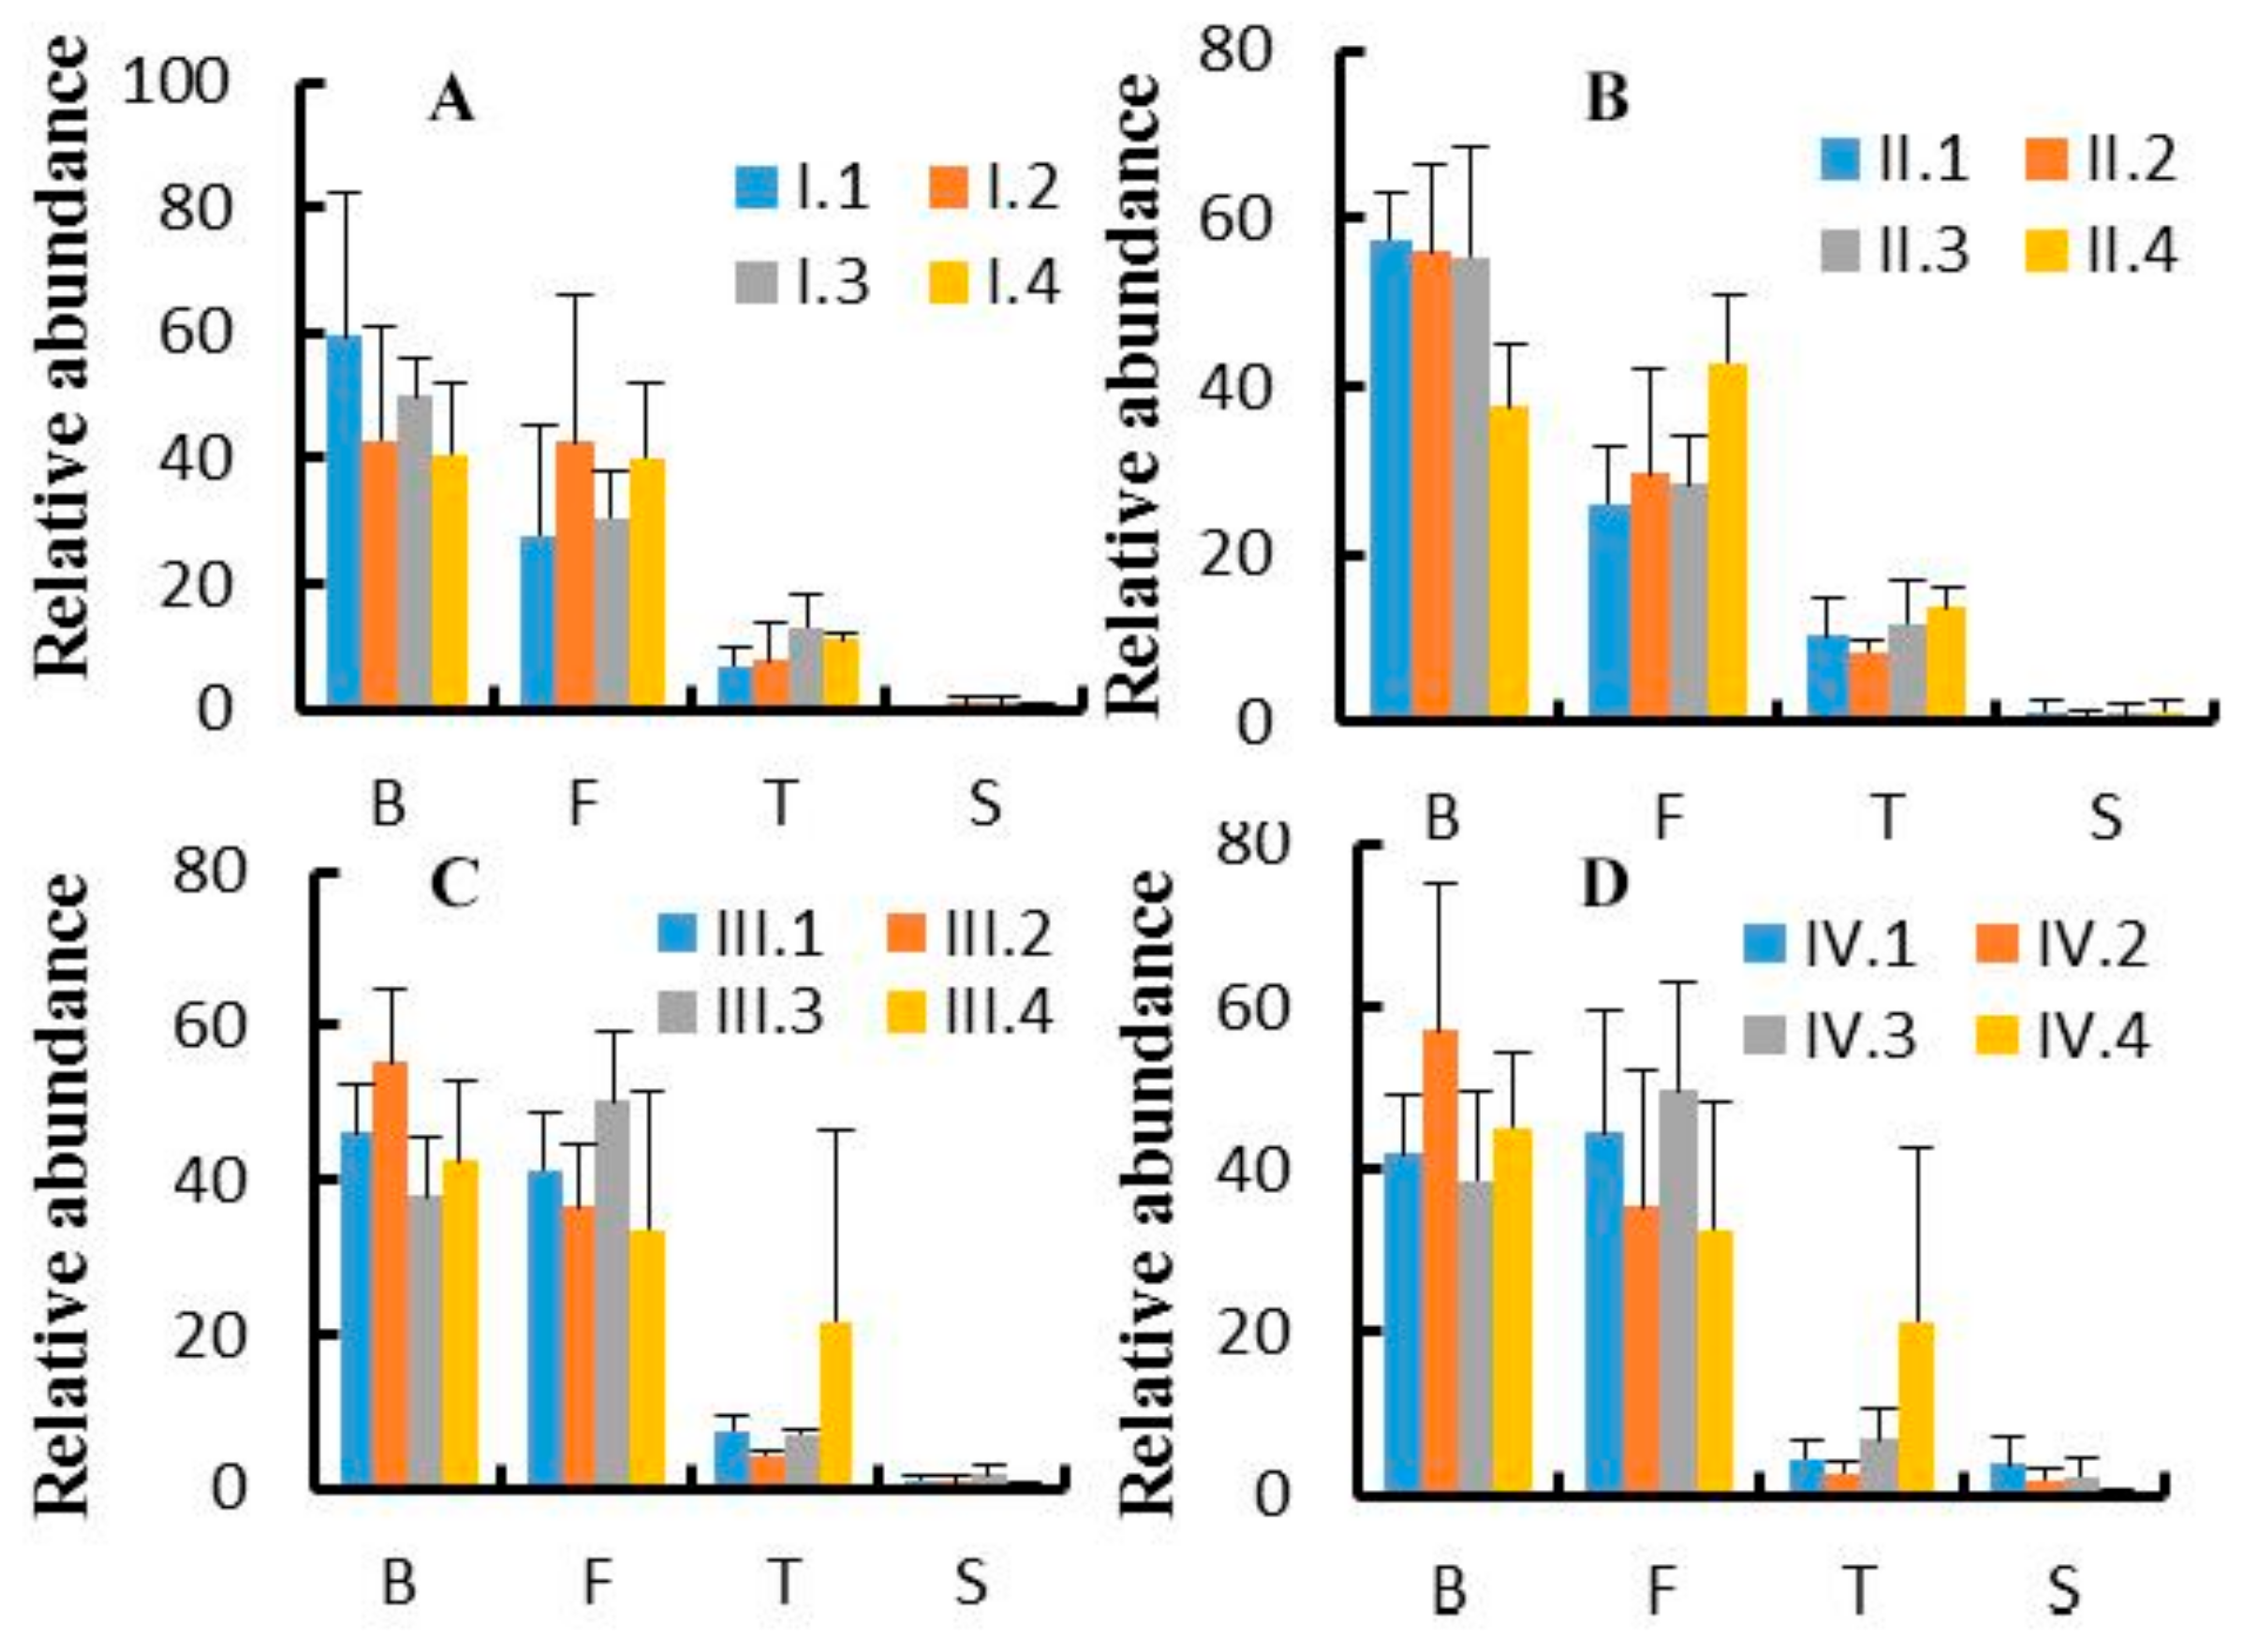
3.3. Effects of Dietary NFC/NDF Ratio Change on Ruminal Bacteria (Phyla)
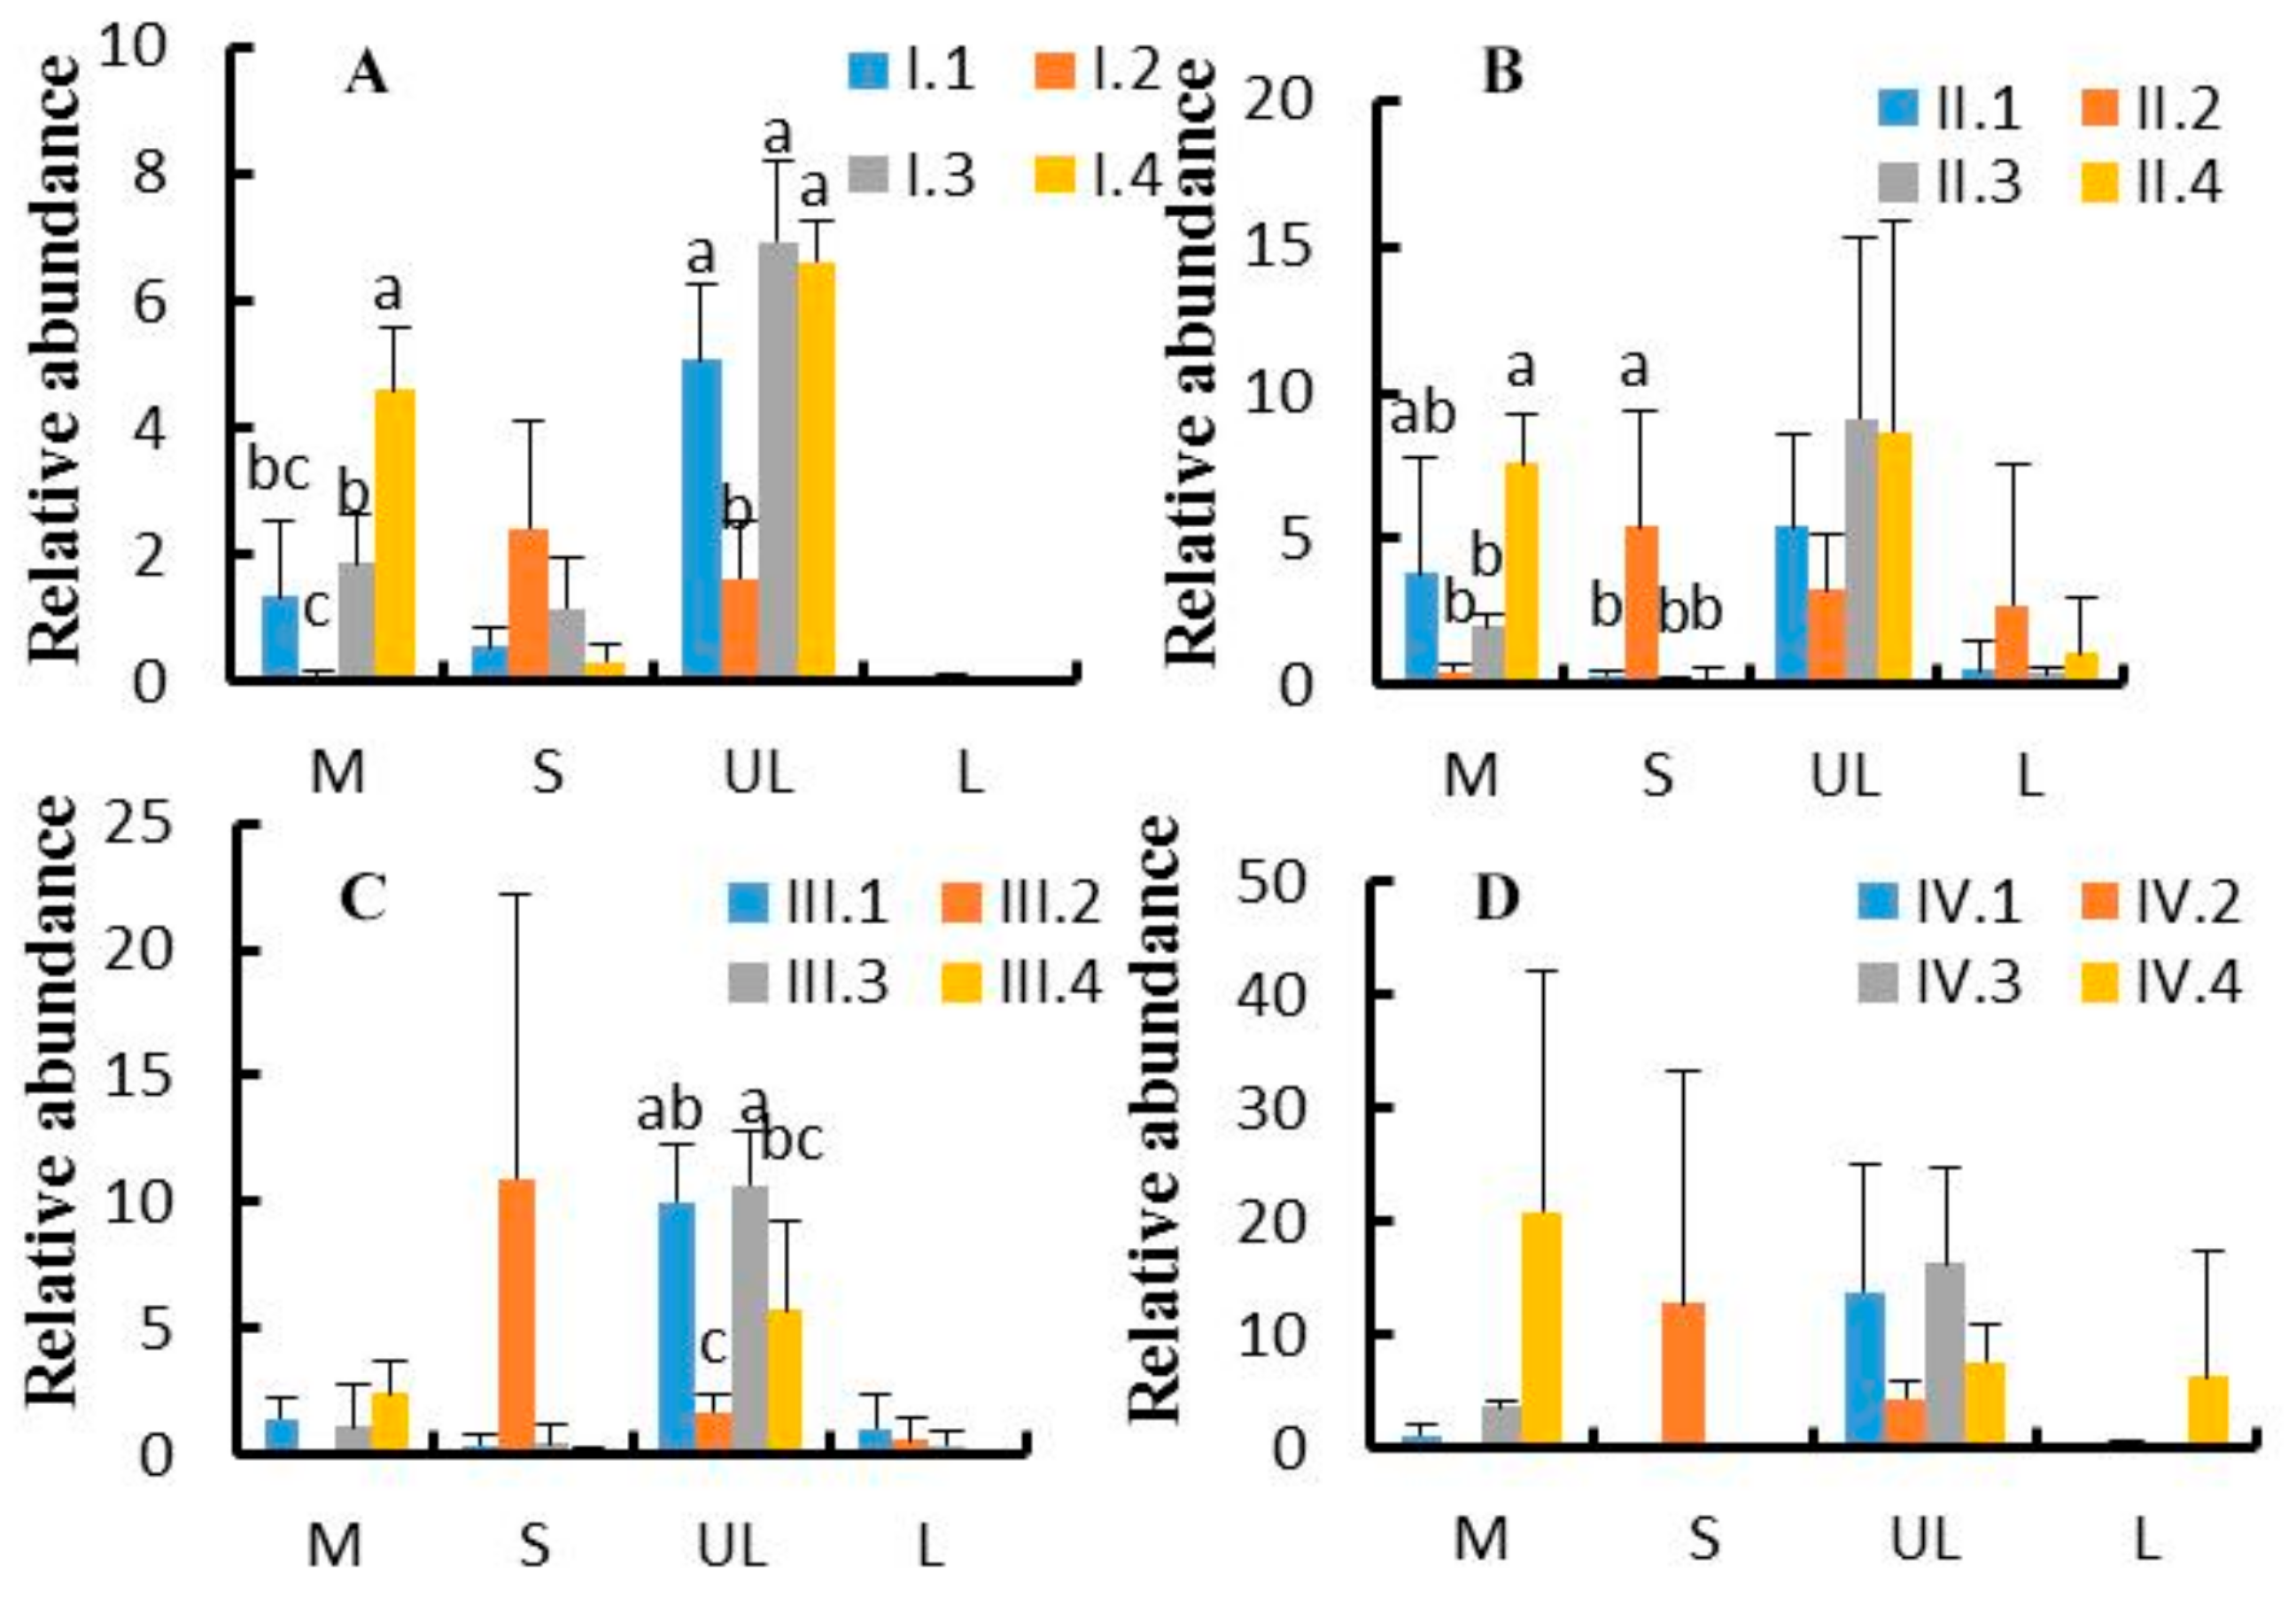
3.4. Effects of Dietary NFC/NDF Ratio Change on Ruminal Bacteria (Genus)
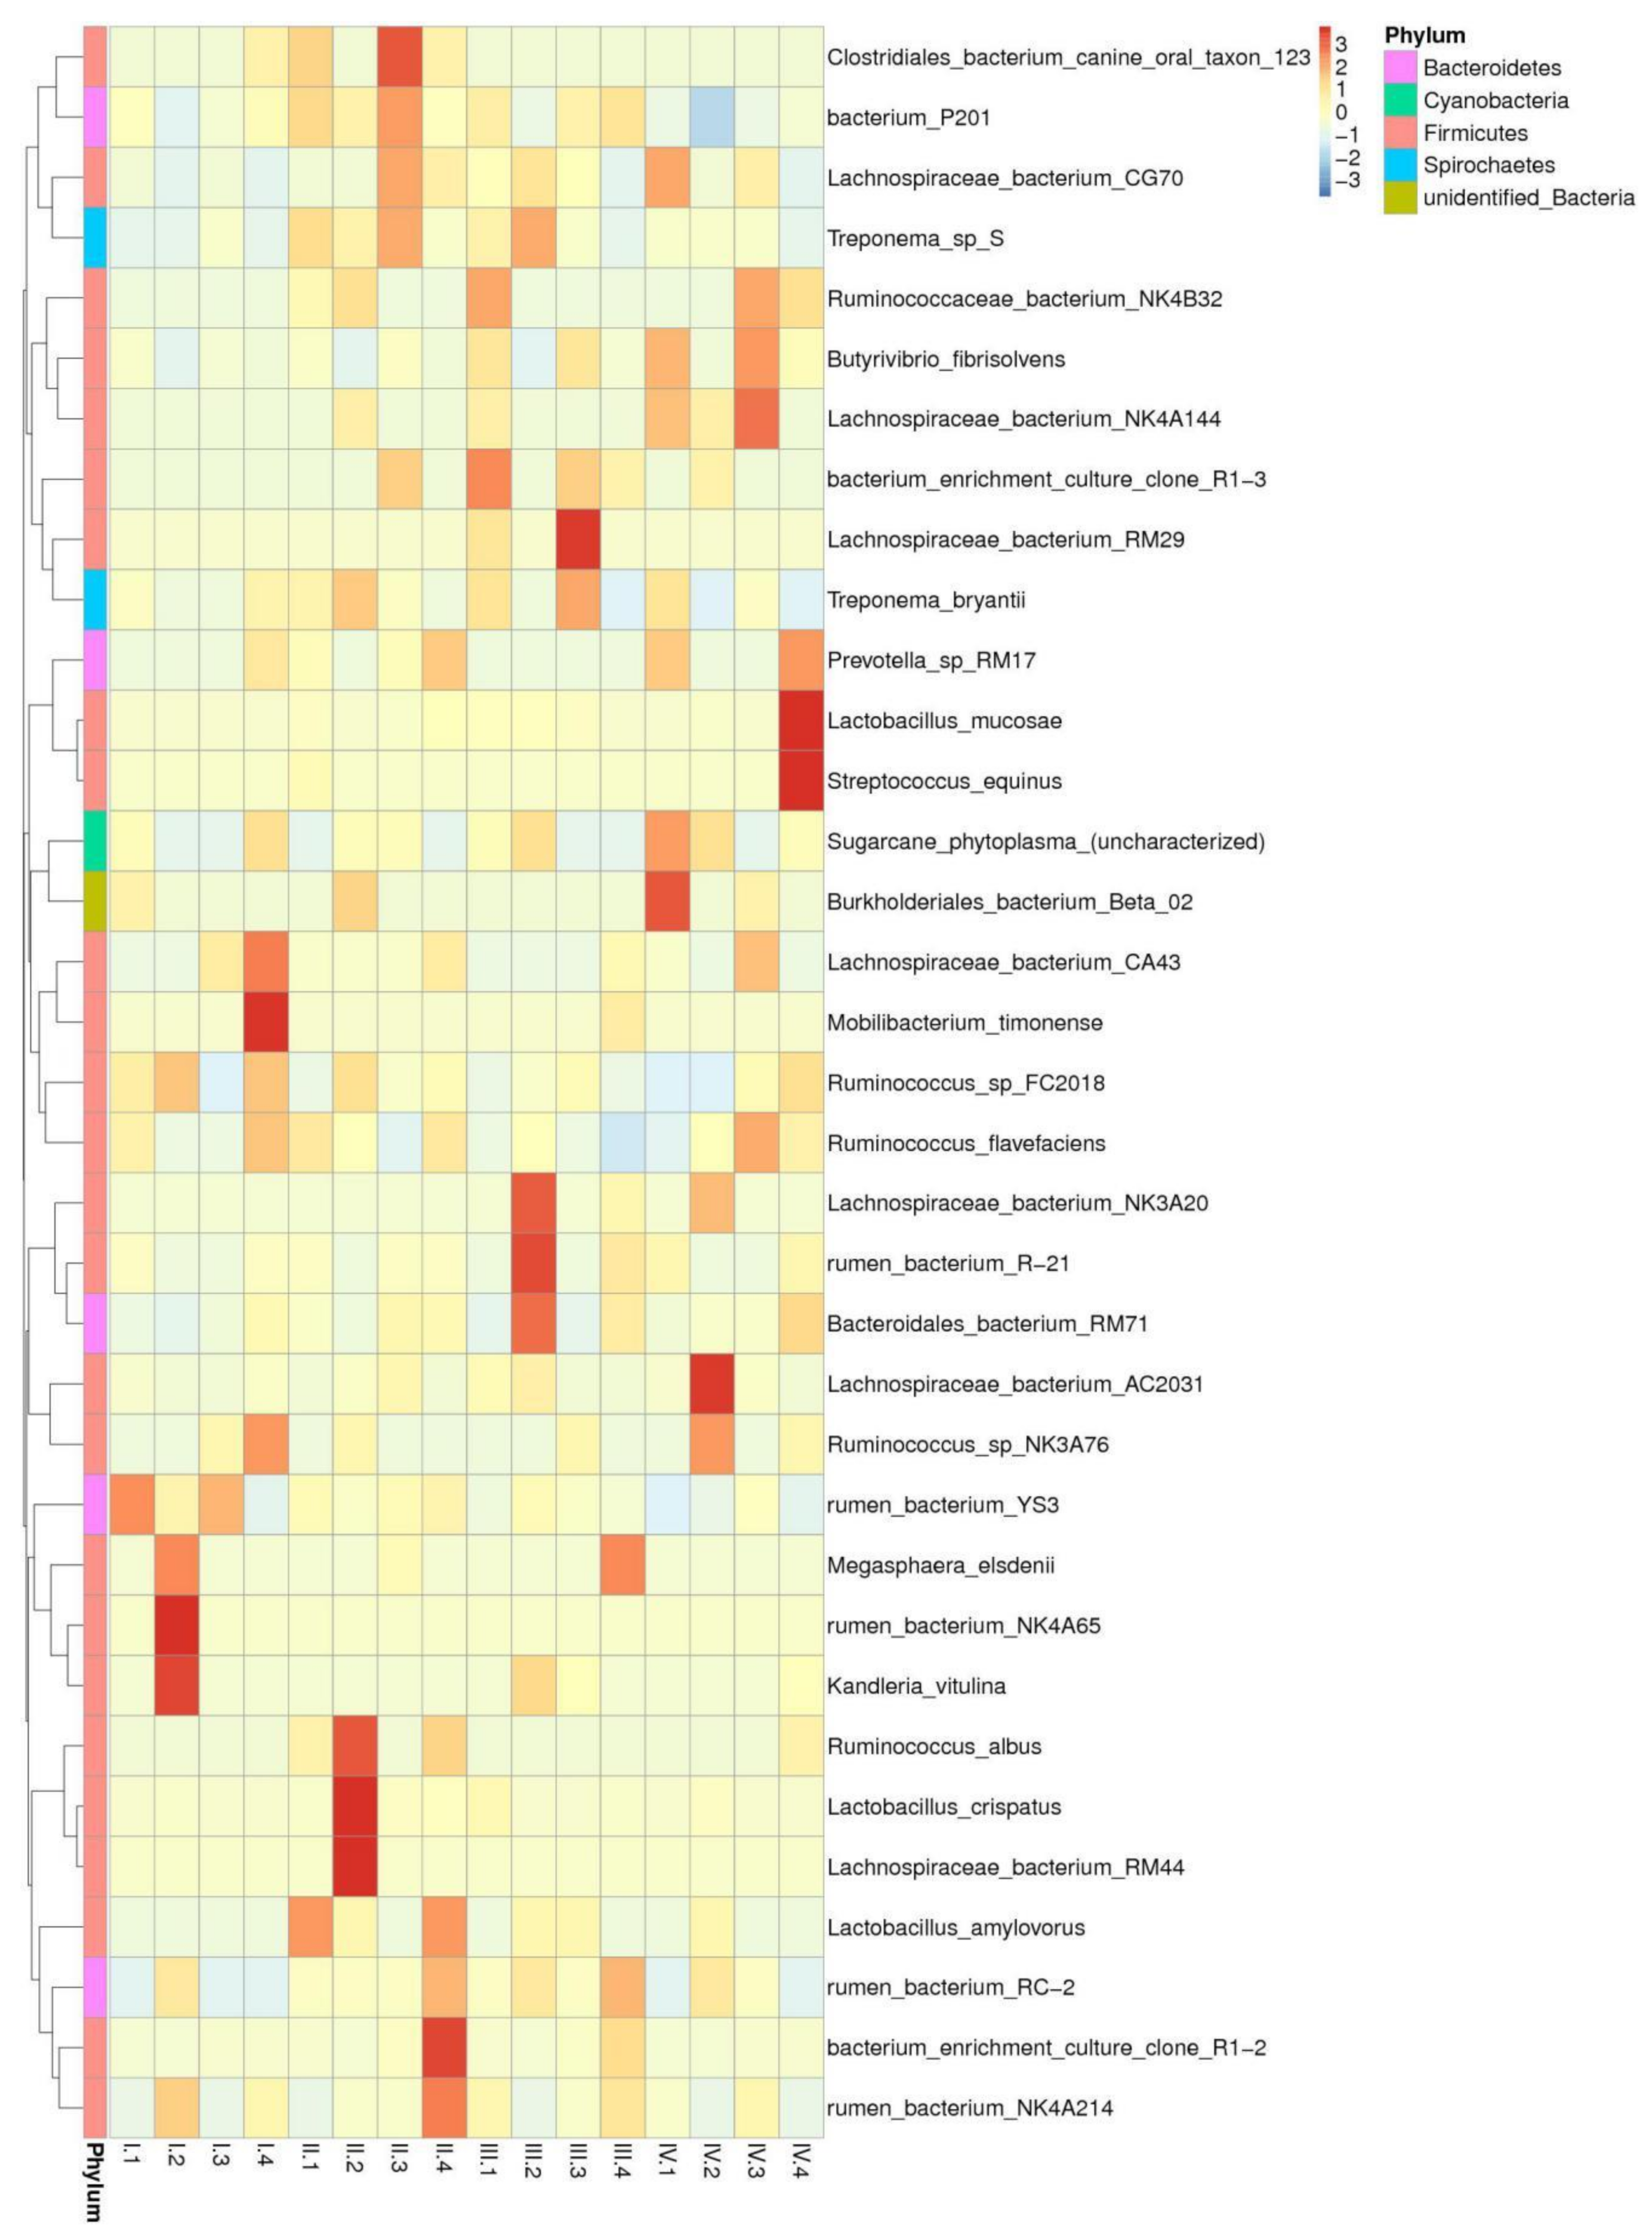
3.5. Effects of Dietary NFC/NDF Ratio Change on the Relative Abundance of Cellulose, Semi-cellulose Degrading Bacteria, and Starch Degrading Bacteria (Species)
4. Discussion
4.1. Effects of Dietary NFC/NDF Ratio Change on Rumen Bacteria in Karakul Sheep
4.2. Effects of Dietary NFC/NDF Ratio Change on Cellulose-Degrading Bacteria, Semi-Cellulose-Degrading Bacteria, and Starch-Degrading Bacteria
4.3. The Limitation of This Study
5. Conclusions
Author Contributions
Funding
Conflicts of Interest
References
- Yang, S. Effects of Feeding Types and Breeds on Rumen Methanogens and Related Microflora in Inner Mongolia Cashmere Goats. Master’s Thesis, Inner Mongolia Agriculture University, Hohhot, China, 2018. [Google Scholar]
- Hespell, R.B.; Akin, D.E.; Dehority, B.A. Gastrointestinal Microbiology; Mackie, R.I., White, B.A., Isaacson, R., Eds.; Chapman and Hall: New York, NY, USA, 1997; Volume 2, pp. 59–186. [Google Scholar]
- Ross, E.M.; Moate, P.J.; Bath, C.R.; Davidson, S.E.; Sawbridge, T.I.; Guthridge, K.M.; Cocks, B.G.; Hayes, B.J. High throughput whole rumen metagenome profiling using untargeted massively parallel sequencing. BMC Genet. 2012, 13, 53. [Google Scholar] [CrossRef] [PubMed]
- Kumar, S.; Indugu, N.; Vecchiarelli, B.; Pitta, D.W. Associative patterns through anaerobic fungi, methanogenic archaea, and bacterial communities in response to changes in diet and age in the rumen of dairy cows. Front. Microbiol. 2015, 7. [Google Scholar] [CrossRef]
- Deng, W.; Xi, D.; Mao, H.; Wanapat, M. The use of molecular techniques based on ribosomal RNA and DNA for rumen microbial ecosystem studies: A review. Mol. Biol. Rep. 2008, 35, 265–274. [Google Scholar] [CrossRef] [PubMed]
- Rawls, J.F.; Samuel, B.S.; Gordon, J.I. Gnotobiotic zebrafish reveal evolutionarily conserved responses to the gut microbiota. Proc. Natl. Acad. Sci. USA 2004, 101, 4596–4601. [Google Scholar] [CrossRef]
- Zhang, J.; Liu, J.; Xue, B. Forage to Concentrate Ratio: Effects on Rumen Fermentation in Nanjiang Brown Goats in Vitro. J. Anim. Nutr. 2013, 25, 870–877. [Google Scholar]
- Corley, R.N.; Murphy, M.R. An in vitro technique for measuring the production rate of volatile fatty acids in the rumen under dynamic conditions. Small Rumin. Res. 2004, 54, 219–225. [Google Scholar] [CrossRef]
- Song, S.D.; Chen, G.J.; Guo, C.H.; Rao, K.Q.; Gao, Y.H.; Peng, Z.L.; Zhang, Z.F.; Bai, X.; Wang, Y.; Wang, B.X.; et al. Effects of exogenous fibrolytic enzyme supplementation to diets with different NFC/NDF ratio ratios on the growth performance, nutrient digestibility and ruminal fermentation in Chinese domesticated black goats. Anim. Feed Sci. Technol. 2018, 236, 170–177. [Google Scholar] [CrossRef]
- Kendall, C.; Leonardi, C.; Hoffman, P.C.; Combs, D.K. Intake and milk production of cows feed diets that differed in dietary neutral detergent fiber and neutral detergent fiber digestibility. J. Dairy Sci. 2009, 92, 313–323. [Google Scholar] [CrossRef]
- Han, X.; Yang, Y.; Yan, H.; Wang, X.; Qu, L.; Chen, Y. Rumen Bacterial Diversity of 80 to 110-Day-Old Goats Using 16S rRNA Sequencing. PLoS ONE 2015, 10, e0117811. [Google Scholar] [CrossRef]
- Clark, J.H.; Klusmeyer, T.H.; Cameron, M.R. Microbial protein synthesis and flows to nitrogen fractions to the duodenum of daury cows. J. Dairy Sci. 1992, 75, 2304–2323. [Google Scholar] [CrossRef]
- Cheng, L.; Nicol, A.M.; Dewhurst, R.J. The effects of dietary nitrogen to water-soluble carbohydrate ratio on isotopic fractionation and partitioning of nitrogen in non-lactating sheep. Animal 2013, 7, 1274–1279. [Google Scholar] [CrossRef] [PubMed]
- Wei, D.; Zhu, W.; Mao, S. Effects of dietary NFC/NDF ratio ratios on rumen fermentation and rumen microbial flora in goats. China Agric. Sci. 2012, 45, 1392–1398. [Google Scholar]
- Wang, L.L. The Study of Different NDF Level Diet on the Apparent Nutrients Digestibility and the Structure and Composition of Rumen Microorganisms in Goats. Master’s Thesis, Sichuan Agricultural University, Ya’an, China, 2017. [Google Scholar]
- Han, X.F. Effects of Age and Dietary Forage-To-Concentrate Ratios on Rumen Microbial Flora of the Shaanbei White-Cashmere Goat. Ph.D. Thesis, Northwest Agriculture & Forestry University, Xianyang, China, 2015. [Google Scholar]
- DeSantis, T.Z., Jr.; Hugenholtz, P.; Keller, K.; Brodie, E.L.; Larsen, N.; Piceno, Y.M.; Phan, R.; Andersen, G.L. NAST: A multiple sequence alignment server for comparative analysis of 16S rRNA genes. Nucleic Acids Res. 2006, 34 (Suppl. 2), W394–W399. [Google Scholar] [CrossRef]
- Ondov, B.D.; Bergman, N.H.; Phillippy, A.M. Interactive metagenomic visualization in a Web browser. BMC Bioinform. 2011, 12, 385. [Google Scholar] [CrossRef] [PubMed]
- Agricultural Industry Standard of the people’s Republic of China-Meat Sheep feeding Standard (NY/T816-2004). Hunan Feed 2006, 6, 9–15.
- Edgar, R.C. UPARSE: Highly accurate OTU sequences from microbial amplicon reads. Nat. Methods 2013, 10, 996–998. [Google Scholar] [CrossRef]
- Simpson, J.M.; McCracken, V.J.; White, B.A.; Gaskins, H.R.; Mackie, R.I. Application of denaturant gradient gel electrophoresis for the analysis of the porcine gastrointestinal microbiota. J. Microbiol. Methods 1999, 36, 167–179. [Google Scholar] [CrossRef]
- Wang, Q.; Garrity, G.M.; Tiedje, J.M.; Cole, J.R.; Mackie, R.I. Naive Bayesian classifier for rapid assignment of rRNA sequences into the new bacterial taxonomy. Appl. Environ. Microbiol. 2007, 73, 5261–5267. [Google Scholar] [CrossRef]
- Quast, C.; Pruesse, E.; Yilmaz, P.; Gerken, J.; Schweer, T.; Yarza, P.; Peplies, J.; Glöckner, F.O. The SILVA ribosomal RNA gene database project: Improved data processing and web-based tools. Nucleic Acids Res. 2013, 41, D590–D596. [Google Scholar] [CrossRef]
- Caporaso, J.G.; Kuczynski, J.; Stombaugh, J.; Bittinger, K.; Bushman, F.D.; Costello, E.K.; Fierer, N.; Peña, A.G.; Goodrich, J.K.; Gordon, J.I.; et al. QIIME allows analysis of high-throughput community sequencing data. Nat. Methods 2010, 7, 335–336. [Google Scholar] [CrossRef]
- Jin, W.; Li, Y.; Cheng, Y.; Mao, S.; Zhu, W. The bacterial and archaeal community structures and methanogenic potential of the cecal microbiota of goats fed with hay and high-grain diets. Antoine Leeuwenhoek 2018. [Google Scholar] [CrossRef] [PubMed]
- Mu, C.T.; Ding, N.; Hao, X.Y.; Zhao, Y.B.; Wang, P.J.; Zhao, J.X.; Ren, Y.S.; Zhang, C.X.; Zhang, W.J.; Xiang, B.W.; et al. Effects of different proportion of buckwheat and corn straw om performance, rumen fermentation and rumen microbiota composition of fattening lambs. Small Rumin. Res. 2019, 181, 21–28. [Google Scholar] [CrossRef]
- Ji, S.K.; Jiang, C.G.; Li, R.; Diao, Q.Y.; Tu, Y.; Zhang, N.F.; Si, B.W. Growth performance and rumen microorganism differ between segregated weaning lambs and grazing lamb. J. Integr. Agric. 2016, 15, 872–878. [Google Scholar] [CrossRef]
- Mosoni, P.; Chaucheyras-Durand, F.; Béra-Maillet, C.; Forano, E. Quantification by real-time PCR of cellulolytic bacteria in the rumen of sheep after supplementation of a forage diet with readily fermentable carbohydrates: Effect of a yeast additive. J. Appl. Microbiol. 2007, 103, 2676–2685. [Google Scholar] [CrossRef]
- Jami, E.; Mizrahi, I. Composition and Similarity of Bovine Rumen Microbiota across Individual Animals. PLoS ONE 2012, 7, e33306. [Google Scholar] [CrossRef]
- Singh, K.M.; Ahir, V.B.; Tripathi, A.K.; Ramani, U.V.; Sajnani, M.; Koringa, P.G.; Jakhesara, S.; Pandya, P.R.; Rank, D.N.; Murty, D.S.; et al. Metagenomics analysis of Surti buffalo (Bubalus bubalis) rumen: A preliminary study. Mol. Biol. Rep. 2012, 39, 4841–4848. [Google Scholar] [CrossRef]
- Ley, R.E.; Lozupone, C.A.; Hamady, M.; Knight, R.; Gordon, J.I. Worlds within worlds: Evolution of the vertebrate gut microbiota. Nat. Rev. Microbiol. 2008, 6, 776–788. [Google Scholar] [CrossRef]
- Qin, J.; Li, R.; Raes, J.; Arumugam, M.; Burgdorf, K.S.; Manichanh, C.; Nielsen, T.; Pons, N.; Levenez, F.; Yamada, T.; et al. A human gut microbial gene catalogue established by metagenomic sequencing. Nature 2010, 464, 59–65. [Google Scholar] [CrossRef]
- Oliveira, M.L.; Arêas, A.P.; Campos, I.B.; Monedero, V.; Perez-Martínez, G.; Miyaji, E.N.; Leite, L.C.C.; Aires, K.A.; Ho, P.L. Induction of systemic and mucosal immune response and decrease in Streptococcus pneumoniae colonization by nasal inoculation of m ice with recombinant lactic acid bacteria expressing pneumococcal surface antigen A. Microbes Infect. 2006, 8, 1016–1024. [Google Scholar] [CrossRef]
- Li, L.; Cheng, S.; Diao, Q.; Fu, T.; Bi, Y. Effects of diets with different levels of NFC/NDF ratio on rumen fermentation parameters and bacterial community in male calves. J. Livest. Vet. Med. 2017, 48, 2347–2357. [Google Scholar]
- Spence, C.; Wells, W.G.; Smith, C.J. Characterization of the Primary Starch Utilization Operon in the Obligate Anaerobe Bacteroides fragilis: Regulation by Carbon Source and Oxygen. J. Bacteriol. 2006, 188, 4663–4672. [Google Scholar] [CrossRef] [PubMed]
- Pitta, D.; Kumar, S.; Veiccharelli, B.; Parmar, N.; Reddy, B.; Joshi, C.G. Bacterial diversity associated with feeding dry forage at different dietary concentrations in the rumen contents of Mehshana buffalo (Bubalus bubalis) using 16S pyrotags. Anaerobe 2014, 25, 31–41. [Google Scholar] [CrossRef] [PubMed]
- Kim, M.; Kim, J.; Kuehn, L.A.; Bono, J.L.; Berry, E.D.; Kalchayanand, N.; Freetly, H.C.; Benson, A.K.; Wells, J.E. Investigation of bacterial diversity in the feces of cattle fed different diets. J. Anim. Sci. 2014, 92, 683–694. [Google Scholar] [CrossRef] [PubMed]
- Asma, Z.; Sylvie, C.; Laurent, C.; Jérôme, M.; Christophe, K.; Olivier, B.; Annabelle, T.-M.; Francis, E. Microbial ecology of the rumen evaluated by 454 GS FLX pyrosequencing is affected by starch and oil supplementation of diets. FEMS Microbiol. Ecol. 2013, 83, 504–514. [Google Scholar] [CrossRef]
- Oba, M.; Allen, M.S. Evaluation of the importance of the digestibility of neutral detergent fiber from forage: Effects on dry matter intake and milk yield of dairy Cows. J. Dairy Sci. 1999, 82, 589–596. [Google Scholar] [CrossRef]
- Huo, W.; Zhu, W.; Mao, S. Impact of subacute ruminal acidosis on the diversity of liquid and solid associated bacteria in the rumen of goats. World J. Microbiol. Biotechnol. 2014, 30, 669–680. [Google Scholar] [CrossRef]


| Ingredients/Nutrient Levels 1 | 1 | 2 | 3 | 4 |
|---|---|---|---|---|
| Cotton seed hulls | 30 | 20 | 15 | 13 |
| Alfalfa grain | 33 | 30 | 25 | 24 |
| Corn | 20 | 35.40 | 45 | 54 |
| Bean pulp | 2 | 2 | 2 | 2 |
| Wheat bran | 12.70 | 10.30 | 10.70 | 4.70 |
| NaCl | 0.80 | 0.80 | 0.80 | 0.80 |
| CaCO3 | 0.50 | 0.50 | 0.50 | 0.50 |
| Premix 2 | 1 | 1 | 1 | 1 |
| Total | 100 | 100 | 100 | 100 |
| Dry matter | 95.54 | 95.74 | 96.30 | 95.55 |
| Crude protein | 14.76 | 14.96 | 14.10 | 13.43 |
| Ether Extract | 2.08 | 2.11 | 2.33 | 2.58 |
| Ash | 8.85 | 7.62 | 6.86 | 6.35 |
| Ca | 0.74 | 0.73 | 0.72 | 0.75 |
| P | 0.26 | 0.25 | 0.24 | 0.22 |
| NFC 3 | 26.11 | 36.98 | 44.41 | 50.84 |
| NDF | 48.20 | 38.33 | 32.30 | 26.80 |
| ADF | 31.75 | 28.73 | 23.80 | 21.41 |
| NFC/NDF ratio | 0.54 | 0.96 | 1.37 | 1.90 |
| Periods | Groups | Observed Species | Shannon | Simpson | Chao1 | Ace |
|---|---|---|---|---|---|---|
| I | 1 | 165 | 4.76 | 0.79 | 322.48 | 362.77 |
| 2 | 138 | 4.86 | 0.86 | 269.37 | 308.97 | |
| 3 | 172 | 5.97 | 0.94 | 237.43 | 278.69 | |
| 4 | 201 | 6.27 | 0.96 | 371.14 | 423.93 | |
| SEM | 10.26 | 0.29 | 0.03 | 23.20 | 26.16 | |
| p-value | 0.186 | 0.153 | 0.141 | 0.179 | 0.221 | |
| II | 1 | 176 | 5.61 | 0.92 | 342.79 | 384.79 |
| 2 | 141 | 5.15 | 0.90 | 227.96 | 276.78 | |
| 3 | 184 | 5.94 | 0.93 | 357.81 | 382.58 | |
| 4 | 212 | 6.55 | 0.98 | 409.78 | 475.55 | |
| SEM | 11.50 | 0.25 | 0.01 | 29.46 | 32.07 | |
| p-value | 0.19 | 0.25 | 0.39 | 0.16 | 0.18 | |
| III | 1 | 170 | 5.71 | 0.95 | 352.03 | 407.15 |
| 2 | 144 | 5.32 | 0.92 | 224.82 | 259.23 | |
| 3 | 164 | 5.52 | 0.91 | 188.22 | 301.56 | |
| 4 | 111 | 4.50 | 0.86 | 238.08 | 227.61 | |
| SEM | 8.79 | 0.21 | 0.02 | 22.15 | 24.22 | |
| p-value | 0.06 | 0.16 | 0.35 | 0.02 | 0.02 | |
| IV | 1 | 145 | 5.23 | 0.91 | 238.08 | 256.55 |
| 2 | 137 | 5.22 | 0.92 | 306.31 | 309.69 | |
| 3 | 143 | 5.31 | 0.92 | 250.78 | 294.17 | |
| 4 | 98 | 4.54 | 0.88 | 170.44 | 183.50 | |
| SEM | 8.13 | 0.19 | 0.02 | 21.46 | 20.47 | |
| p-value | 0.11 | 0.52 | 0.79 | 0.16 | 0.11 |
| Periods | Groups | Butyrivibrio-fibrisolvens | Ruminococcus-flavefaciens | Lachnospiraceae-bacterium-AC2031 | Lachnospiraceae-bacterium-NK3A20 | Streptococcus-equinus | Prevotella-ruminicola |
|---|---|---|---|---|---|---|---|
| I | 1 | 3.64 | 0.30 | 0.05 | - | - | - |
| 2 | 0.66 | 0.15 | - | - | 0.05 | - | |
| 3 | 3.23 | 0.15 | - | - | - | - | |
| 4 | 2.63 | 0.45 | 0.10 | - | - | 0.10 | |
| SEM | 0.386 | 0.07 | 0.03 | - | 0.02 | 0.03 | |
| p-value | <0.01 | 0.36 | 0.56 | - | 0.44 | 0.44 | |
| II | 1 | 3.99 | 0.35 | - | - | 0.45 | 0.05 |
| 2 | 0.45 | 0.25 | 0.10 | - | - | - | |
| 3 | 4.24 | 0.10 | 0.25 | - | - | 0.05 | |
| 4 | 2.53 | 0.35 | - | - | - | 0.15 | |
| SEM | 2.26 | 0.06 | 0.04 | - | 0.11 | 0.04 | |
| p-value | 0.13 | 0.38 | 0.06 | - | 0.44 | 0.65 | |
| III | 1 | 8.84 | 0.15 | 0.20 | - | - | - |
| 2 | 0.35 | 0.25 | 0.30 | 0.25 | - | - | |
| 3 | 8.89 | 0.15 | - | - | - | - | |
| 4 | 3.23 | 0.05 | - | 0.05 | - | - | |
| SEM | 1.20 | 0.05 | 0.05 | 0.06 | - | - | |
| p-value | <0.01 | 0.67 | 0.11 | 0.53 | - | - | |
| IV | 1 | 12.42 | 0.10 | 0.05 | - | 0.05 | 0.15 |
| 2 | 2.53 | 0.25 | 1.16 | 0.15 | - | - | |
| 3 | 14.34 | 0.51 | 0.10 | - | - | - | |
| 4 | 5.25 | 0.30 | - | - | 3.89 | 0.2 | |
| SEM | 2.32 | 0.06 | 0.19 | 0.04 | 0.98 | 0.05 | |
| p-value | 0.22 | 1.14 | 0.055 | 0.44 | 0.45 | 0.42 |
© 2020 by the authors. Licensee MDPI, Basel, Switzerland. This article is an open access article distributed under the terms and conditions of the Creative Commons Attribution (CC BY) license (http://creativecommons.org/licenses/by/4.0/).
Share and Cite
Pu, X.; Guo, X.; Shahzad, K.; Wang, M.; Jiang, C.; Liu, J.; Zhang, X.; Zhang, S.; Cheng, L. Effects of Dietary Non-Fibrous Carbohydrate (NFC) to Neutral Detergent Fiber (NDF) Ratio Change on Rumen Bacteria in Sheep Based on Three Generations of Full-Length Amplifiers Sequencing. Animals 2020, 10, 192. https://doi.org/10.3390/ani10020192
Pu X, Guo X, Shahzad K, Wang M, Jiang C, Liu J, Zhang X, Zhang S, Cheng L. Effects of Dietary Non-Fibrous Carbohydrate (NFC) to Neutral Detergent Fiber (NDF) Ratio Change on Rumen Bacteria in Sheep Based on Three Generations of Full-Length Amplifiers Sequencing. Animals. 2020; 10(2):192. https://doi.org/10.3390/ani10020192
Chicago/Turabian StylePu, Xuanxuan, Xuefeng Guo, Khuram Shahzad, Mengzhi Wang, Chenyu Jiang, Junfeng Liu, Xiuping Zhang, Sujiang Zhang, and Long Cheng. 2020. "Effects of Dietary Non-Fibrous Carbohydrate (NFC) to Neutral Detergent Fiber (NDF) Ratio Change on Rumen Bacteria in Sheep Based on Three Generations of Full-Length Amplifiers Sequencing" Animals 10, no. 2: 192. https://doi.org/10.3390/ani10020192
APA StylePu, X., Guo, X., Shahzad, K., Wang, M., Jiang, C., Liu, J., Zhang, X., Zhang, S., & Cheng, L. (2020). Effects of Dietary Non-Fibrous Carbohydrate (NFC) to Neutral Detergent Fiber (NDF) Ratio Change on Rumen Bacteria in Sheep Based on Three Generations of Full-Length Amplifiers Sequencing. Animals, 10(2), 192. https://doi.org/10.3390/ani10020192