Simple Summary
The early death and illness of newborn calves result in enormous economic losses in the dairy industry. As the immune system has not been fully developed in neonates, the adequate intake of nutrients and immune substances in colostrum is essential for protecting neonates from infections in their early life. The term albumin refers to a group of multifunctional proteins that are important in anti-inflammatory and anti-oxidative reactions and can help calves against various infections. Albumin of bovine whey is derived from the serum; hence, the concentration of albumin in colostrum and serum could be important traits for the breeding of potential natural disease resistance in dairy cattle. Herein, genome-wide association studies (GWASs) were performed to identify the candidate genes associated with albumin concentrations in colostrum and serum to provide useful molecular information for the genetic improvement of disease resistance traits in dairy cattle.
Abstract
Albumin can be of particular benefit in fighting infections for newborn calves due to its anti-inflammatory and anti-oxidative stress properties. To identify the candidate genes related to the concentration of albumin in colostrum and serum, we collected the colostrum and blood samples from 572 Chinese Holstein cows within 24 h after calving and measured the concentration of albumin in the colostrum and serum using the ELISA methods. The cows were genotyped with GeneSeek 150 K chips (containing 140,668 single nucleotide polymorphisms; SNPs). After quality control, we performed GWASs via GCTA software with 91,620 SNPs and 563 cows. Consequently, 9 and 7 genome-wide significant SNPs (false discovery rate (FDR) at 1%) were identified. Correspondingly, 42 and 206 functional genes that contained or were approximate to (±1 Mbp) the significant SNPs were acquired. Integrating the biological process of these genes and the reported QTLs for immune and inflammation traits in cattle, 3 and 12 genes were identified as candidates for the concentration of colostrum and serum albumin, respectively; these are RUNX1, CBR1, OTULIN, CDK6, SHARPIN, CYC1, EXOSC4, PARP10, NRBP2, GFUS, PYCR3, EEF1D, GSDMD, PYCR2 and CXCL12. Our findings provide important information for revealing the genetic mechanism behind albumin concentration and for molecular breeding of disease-resistance traits in dairy cattle.
1. Introduction
Improved animal health and resistance to pathogens is an increasingly important breeding objective in the dairy industry [1,2]. As the immune system of newborn calves is too weak to fight various infections, most diseases (for e.g., flu, diarrhea and omphalitis) and death events affecting calves occur in the first few days after birth [3,4,5]. Colostrum provides numerous nutrients, regulatory factors (cytokines, growth factors, enzymes and hormones), immune factors (immunoglobulins) and crucial proteins (albumin) to guarantee the health of the newborn calves [6,7]. Albumin is synthesized by hepatocytes and penetrates into the milk through the epithelial tight junction from the blood plasma [8,9,10,11]. The physiological and pathophysiological functions of albumin are relatively well known, such as maintaining the osmotic pressure and having an anti-oxidizing effect during inflammatory reactions [12,13,14]. In dairy cattle, the albumin concentration has been found to be much higher in the first milked colostrum (1.21 ± 0.44 mg/mL) when compared to reported milk levels of <0.2 mg/mL [15]. Previous studies have shown that the concentration of albumin in the milk increased during functional transitions from lactation to involution and during inflammation in cows [11,14,16,17,18,19,20,21,22], sheep [23] and goats [24]. During mastitis, the mammary gland is exposed to a high level of free radicals, and albumin might enhance the anti-oxidant defenses of the glands [13,25]. Therefore, the albumin concentration of colostrum and serum offers a potential possibility as one of the indices for resistance breeding to decrease the mortality of newborns in dairy cattle.
The concentration of albumin is a typical quantitative trait [26]. Previous studies in humans have reported heritability estimates of 0.10–0.24 and 0.30–0.39 for glycated and excreted albumin, respectively [27,28]. In dairy cattle, heritability is relatively lower (0.13 ± 0.09) [29,30]. In early-lactation dairy cows, serum albumin has moderate heritability (0.27 ± 0.06) [31].
A genome-wide association study (GWAS) is a practical approach for the high-resolution mapping of loci controlling quantitative traits and has been widely applied in domestic animals [32]. In dairy cattle, a large number of previous GWASs have been performed to detect the genetic markers, candidate genes and QTLs for milk yield, milk protein and fat [33,34,35,36], milk fatty acids [37], mastitis [34,38,39,40], reproduction [35], body conformation [35] and immunoglobulin concentration [36,41]. However, so far there is only a limited number of studies that have investigated the candidate genes for albumin concentration in dairy cattle or even in other species. In this study, we conducted GWASs to identify the significant single nucleotide polymorphisms (SNPs) and candidate genes for the concentration of colostrum and serum albumin and provide information for molecular breeding to improve the resistance or tolerance to pathogens of newborns in dairy cattle.
2. Materials and Methods
2.1. Animals and Phenotypes
Blood, colostrum and hair follicle samples were collected in the first milking within 24 h after calving from 572 Chinese Holstein cows (0–6 h: 481 cows; 6–12 h: 38 cows; 12–18 h: 39 cows; and 12–24 h: 14 cows). All of the cows were from 10 dairy farms of the Beijing Dairy Cattle Center and the Beijing Sunlon Livestock Development Company Limited (herd 1: 90 cows; herd 2: 5 cows; herd 3: 88 cows; herd 4: 92 cows; herd 5: 58 cows; herd 6: 47 cows; herd 7: 75 cows; herd 8: 56 cows; herd 9: 19 cows; and herd 10: 42 cows). Cows were in parity of 1 to 4 and were the offspring of 44 sires. Cows were 23–72 months old at the time of calving. The whole procedure for collecting the blood, colostrum and hair follicle samples was carried out in strict accordance with the protocol approved by the Animal Welfare Committee of China Agricultural University (permit number: DK996).
The concentration of albumin of every colostrum and serum sample was measured by commercial ELISA kits (Bovine Albumin ELISA Quantitation Set, E10-113, Bethyl Laboratories, Montgomery, TX, USA). Concentrations were log10-transformed to follow a normal distribution.
2.2. Genotypes and Quality Control
The extraction of genomic DNA from the hair follicles of the 572 cows was carried out using a QIAamp® DNA Mini Kit (QIAGEN, Valencia, CA, USA). Then the extracted DNA was genotyped by a GeneSeek GGP_HDv3 chip (including 140,668 SNP markers: GeneSeek, Lincoln, Dearborn, MI, USA).
Quality control was conducted on PLINK 1.90 software and the filtering processes were as follows: Firstly, samples with genotyping <95% of the SNPs were deleted; then, SNPs with call rates <90%, minor allele frequencies (MAF) <0.1 and Hardy–Weinberg equilibrium (HWE) p-values < 10−6 were discarded [42,43]. Thus, 563 individuals with 91,620 SNPs were kept for further analysis (Supplementary Files 1 and 2).
2.3. Statistical Analysis
The association analysis for each SNP was implemented independently for the albumin concentration of colostrum and serum with the following mixed linear model:
where y is the vector of the phenotype of the log-transformed corrected concentration of albumin for 563 cows; μ is the vector of the overall mean; b refers to fixed effects, including herd, parity, time from calving and season of calving; X is the incidence matrix of b to y; f is the vector of the additive effect of the candidate SNP to be tested for association; M is the vector of the genotypes for the SNP, coded as 0 = BB, 1 = AB and 2 = AA; g is the vector of the polygenic effect with g ~N (0, Gσg2), where G is the genomic relationship matrix between pairs of individuals from all of the SNPs’ 30 chromosomes, including the X chromosome [44]; σg2 is the additive variance; and e is the vector of the residual effects with e~N (0, 0, Iσe2), where σe2 is the residual error variance.
The GWASs were implemented with GCTA v1.90.2 software, which estimates the variance explained by all of the SNPs on a chromosome or on the whole genome for a complex trait [44]. As Bonferroni correction is deuced strict and may cause false negative results [45], we used the false discovery rate (FDR) method to set the p-value threshold [46,47]. The genome-wide threshold value was calculated according to an FDR of 0.01 with the following formula:
where n is the number of the SNPs with p < 0.01 in the GWAS results for the concentration of colostrum or serum albumin, and l is total number of SNPs analyzed. Then, we calculated the genomic inflation factor λ value to evaluate the extent of the population stratification by GenABEL packages [48] in R 3.6.0 (http://www.R-project.org/) [49]. Quantile–quantile (QQ) and Manhattan plots were drawn using the qqman package [50].
2.4. Candidate Genes
To further identify the positional candidate genes for albumin, the genes that contained or were close to (±1 Mbp) the significant SNPs were selected based on the Ensembl Bos taurus UMD3.1 database (http://www.ensembl.org/index.html). The extracted genes were then submitted into DAVID Bioinformatics Resources (https://david.ncifcrf.gov) for the Gene Ontology (GO) terms and Kyoto Encyclopedia of Genes and Genomes (KEGG) pathway analysis to identify the biological processes that these genes are involved in. Simultaneously, we compared the physical position of these genes that contained or were adjacent to significant SNPs with the known QTLs for inflammation and immune-related traits in the Cattle QTL database (https://www.animalgenome.org/cgi-bin/QTLdb/BT/index).
3. Results
3.1. Phenotype and SNP Data Statistics
In this study, 572 animals with the phenotype of an albumin concentration in the colostrum and serum were included for analysis. The original phenotypic data were log10-transformed to accomplish normality (Figure 1). The mean and the corresponding standard deviations for the original and corrected phenotype of the albumin concentration are shown in Table 1. After the quality control, 91,620 SNPs and 563 cows were obtained for the subsequent association analysis. The distribution of the SNPs on the genome is presented in Figure 2.
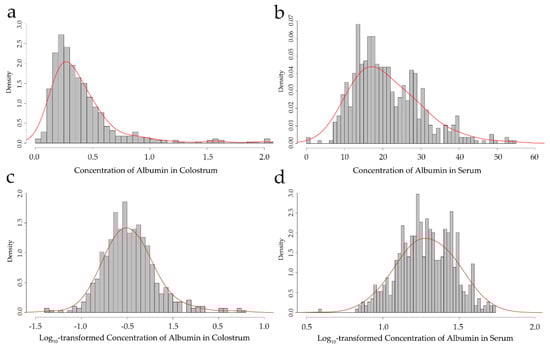
Figure 1.
Frequency distribution of the concentration of albumin in colostrum and serum: (a,b) show the original colostrum and serum albumin concentrations; (c,d) show the log10-transformed colostrum and serum albumin concentrations.

Table 1.
Descriptive statistics for the concentration of albumin in colostrum and serum; n = 572.
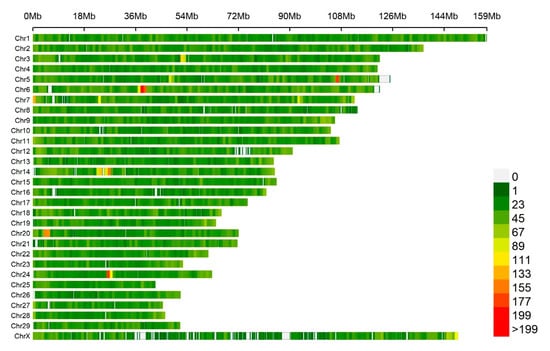
Figure 2.
The SNPs’ density distribution on 29 autosomes and the X-chromosome of the bovine genome. The horizontal axis (X-axis) shows the chromosome length (Mbp). SNP density was calculated per 1 Mbp window. Different colors represent different SNP density levels.
3.2. Genome-Wide Association Study
According to the p-value of every SNP, the calculated inflation factor (λ) was 0.983 and 1.004 for the concentration of colostrum and serum albumin, respectively, and the QQ plots (Figure 3) showed that the population stratification had been well corrected [51]. Consequently, nine significant SNPs were identified for concentration of albumin in colostrum at the genome-wide level (FDR at 1%), located on Bos taurus autosome (BTA) 1: 149,246,858 bp (BovineHD0100043239); BTA 3: 118,061,120 bp (ARS-BFGL-NGS-75,987); BTA 17: 68,421,115 bp (ARS-BFGL-NGS-66,134); and BTA 20: 59,137,600—69,916,426 bp (BovineHD2000016546, BovineHD2000016866, BovineHD2000019816, BTB-00798071, ARS-BFGL-NGS-75636, and ARS-BFGL-NGS-114933) (Table 2).
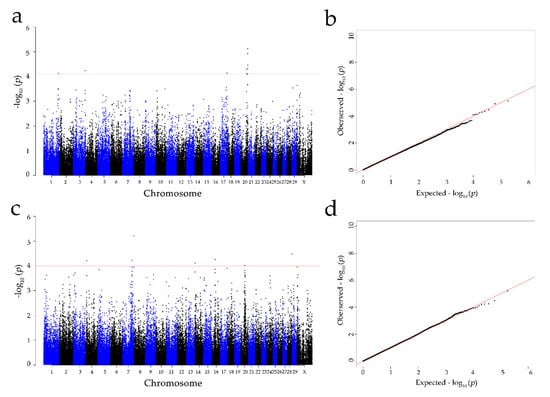
Figure 3.
Manhattan and Q-Q plots of the observed p-values for the concentration of albumin in the colostrum and serum: (a,b) indicate the albumin concentration in colostrum; (c,d) indicate the albumin concentration in serum. The Manhattan plots present the −log10 values (p-values) for the genome-wide SNPs (y-axis) plotted against their respective positions on each chromosome (x-axis); the horizontal red in the Manhattan plots present the thresholds with an FDR rate of 1% for albumin in colostrum (7.85 × 10⁵) and serum (1.01 × 10⁵). The Q-Q plots show the observed −log10-transformed p-values (y-axis) and the expected −log10-transformed p-values (x-axis).
Table 2.
The significant SNPs of the genome-wide association studies for the concentration of albumin in colostrum and serum.
For the albumin concentration in serum, seven genome-wide significant SNPs were detected (FDR at 1%) on BTA 4: 10,737,673 bp (Hapmap39425-BTA-70290); BTA 7: 93,597,405 bp (BovineHD0700027327); BTA 7: 111,481,071 bp (BovineHD0700032536); BTA 14: 1,463,676 bp (Hapmap30381-BTC-005750); BTA 16: 30,440,171 bp (BovineHD1600008636); BTA 20: 39,761,822 bp (ARS-BFGL-NGS-73590); and BTA 28: 45,702,356 bp (BovineHD2800013250) (Table 2). The Manhattan plots for the concentration of albumin in colostrum and serum are shown in Figure 3.
3.3. Candidate Genes and Functional Analysis
After mapping to the bovine genome assembly UMD3.1.1, we found 42 genes within the region that were 1 Mbp of up/downstream of the significant SNPs for the colostrum albumin concentration, including 36 protein-coding genes, 1 miRNA genes and 5 pseudogenes (Table S1). By performing GO terms and KEGG pathways analysis, RUNX family transcription factor 1 (RUNX1), carbonyl reductase 1 (CBR1) and OTU deubiquitinase with linear linkage specificity (OTULIN) were observed to be involved in the positive regulation of interleukin-2 production, oxidation-reduction process, negative regulation of nuclear factor (NF)-kappaB transcription factor activity and negative regulation of inflammatory response (Table S2). Hence, RUNX1 (BTA 1: ~148.73 Mbp), CBR1 (BTA 1: ~150.06 Mbp) and OTULIN (BTA 20: ~58.58 Mbp) were eventually selected as the candidate genes for the colostrum albumin concentration (Table 3).
Table 3.
Candidate genes 1 Mbp from the significant SNPs identified in the genome-wide association studies for the albumin concentration in colostrum and serum.
A total of 206 genes were obtained 1 Mbp from the significant SNPs for the serum albumin concentration, containing 155 protein-coding genes, 5 miRNA genes and 46 pseudogenes (Table S1). Of these, the GO and KEGG results showed that 24 genes participated in the albumin-related terms and pathways, such as the oxidation–reduction process, regulation of inflammatory and immune response, and NF-kappa B and MAPK signaling pathway (Table S2). After comparing the physical positions of these 206 genes with the positions of the released QTLs for inflammation and immune capacity in cattle (27 August 2020, Cattle QTLdb), 138 genes were found located in the interval of these QTLs. Combining the results of the GO and KEGG with the known QTL data, 12 functional genes were identified as promising candidates related to the serum albumin concentration (Table 3), including cyclin-dependent kinase 6 (CDK6, BTA 4: ~9.92 Mbp), SHANK-associated RH domain interactor (SHARPIN, BTA 14: ~1.93 Mbp), cytochrome c1 (CYC1, BTA 14: ~1.93 Mbp), exosome component 4 (EXOSC4, BTA 14: ~1.95 Mbp), poly (ADP-ribose) polymerase family member 10 (PARP10, BTA 14: ~2.03 Mbp), nuclear receptor binding protein 2 (NRBP2, BTA 14: ~2.16 Mbp), GDP-L-fucose synthase (GFUS, BTA 14: ~2.29 Mbp), pyrroline-5-carboxylate reductase 3 (PYCR3, BTA 14: ~2.31 Mbp), eukaryotic translation elongation factor 1 delta (EEF1D, BTA 14: ~2.32 Mbp), gasdermin D (GSDMD, BTA 14: ~2.34 Mbp), pyrroline-5-carboxylate reductase 2 (PYCR2, BTA 16: ~29.70 Mbp) and C-X-C motif chemokine ligand 12 (CXCL12, BTA 28: ~45.41 Mbp).
4. Discussion
In this study, we identified nine and seven genome-wide significant SNPs (FDR at 1%) associated with the albumin concentration in colostrum and serum in Chinese Holstein, respectively, using GWASs. For the significant SNPs captured in these two traits, no common genomic regions were shared. Hence, we calculated the correlations between these two traits using GCTA software and the phenotypic and genetic correlations were 0.011 and 0.0996, respectively, suggesting a weak correlation between the colostrum and serum albumin concentration. This is likely the reason that no common genomic regions were identified in the GWAS for these two traits. Besides, albumin is produced by hepatocytes and the majority of the protein is immediately released into the blood circulation [12] and only small amounts of albumin in the blood enters the milk by tight junction [8]. These two different sources and transport mechanisms of albumin in colostrum and serum might have been the cause of the weak phenotypic and genetic correlations between these two traits.
Population stratification and family structure can cause a number of false positive results in GWASs [52]. After a proper correction, the λ value should be close to 1 [53]. In the present study, the inflation factor (λ) was 0.983 and 1.004 for the concentration of colostrum and serum albumin, respectively, indicating that the population stratification was successfully corrected by the appropriate model [51].
In this study, the MAF of each significant SNP ranged from 0.107 to 0.463 for the colostrum and serum albumin concentrations. This implied these SNPs could be used for marker-assisted selection or a genomic selection program through selecting the advantageous alleles with positive effects to accelerate the albumin concentration in colostrum and serum in dairy cattle, thereby increasing the disease-resistance ability of calves. The contribution to genetic variance of the SNPs were relatively high with a range of 2.55–4.091% for the colostrum and serum albumin concentrations. Previous studies indicated that the SNPs identified by GWASs generally explain only a small fraction of the heritability, while the SNP effects might be magnified when applying the mixed-model association (MLMA) methods by GCTA [44,54,55]. Due to the advantages of the MLMA method in GCTA, like the prevention of false positive associations and an increase in power obtained through the application of a correction that is specific to a specific structure, MLMA is still a popular method for complex traits in GWASs [54].
After the functional analysis of genes in the regions within a 1 Mbp distance of the significant SNPs, 3 and 12 genes were identified as promising candidates for the concentration of colostrum and serum albumin in dairy cattle, respectively. Of these, CBR1 and CYC1 were reported to be associated with the oxidation–reduction process. CBR1 encodes the protein belonging to the short-chain dehydrogenases/reductases (SDR) family that acts as an NADP-dependent oxidoreductase in the oxidation–reduction process [56]. The CYC1 gene encodes a subunit of the cytochrome bc1 complex whose catalytic activity is required for the release of pro-apoptotic factors from mitochondria and the execution of the subsequent apoptotic steps [57,58,59]. It is well known that anti-oxidation is one of the most important properties of albumin. Remarkably, the oxidation-reduction process is the crucial part of an anti-inflammatory response, which demonstrates that the albumin in colostrum and serum is essential in anti-inflammation.
The other set of candidate genes, i.e., RUNX1, OTULIN, CDK6, SHARPIN, NRBP2, PYCR3, GSDMD, PYCR2 and CXCL12, were involved in immunity and inflammation. It has been proven that the mutations of RUNX1 initiate the hyperactivation of inflammatory and innate immunity, including the IL-6, TLR, NF-kappaB, IFN and TREM1 signaling pathways [60]. OTULIN is critical for restraining life-threatening spontaneous inflammation, maintaining immune homeostasis and activating NF-kappaB to promote the secretion of pro-inflammatory cytokines and restricts bacterial proliferation in infection [61,62]. CDK6 is required for the expression of inflammatory genes and is a critical regulator in the NF-kappaB signaling pathway, as well as contributing to cytokine production while inhibiting apoptosis [63,64]. SHARPIN regulates TLR3-mediated innate immunity, auto inflammation and the development of immunodeficiency [65,66]. The nuclear receptor binding protein, NRBP2, fights the infection of intracellular pathogens by regulating autophagy in the innate immune response [67]. PYCR2 and PYCR3 encode a protein that belongs to the pyrroline-5-carboxylate reductase family of enzymes that responds to genotoxic, inflammatory, nutrient and oxidative stress [68,69]. GSDMD encodes a member of the adermin family of pore-forming proteins implicated in the immune response [70], which controls the release of the proinflammatory cytokines IL-1ß, IL-18 and pyroptotic cell death, and drive the inflammation in septic shock as well as the autoimmune diseases [71,72]. CXCL12 encodes a stromal cell-derived alpha chemokine member of the intercrine family and is involved in many diverse cellular functions, such as immune surveillance, inflammation response and tissue homeostasis [73,74,75]. Generally, all of these genes played vital roles in the inflammation and immune-related process, which indicated the potentially important roles of albumin in colostrum and serum in resistance to infectious diseases.
Resistance to viral infection is also a crucial capacity for the health and survival of calves. Herein, the candidate genes PARP10, EXOSC4, GFUS and EEF1D, involved in various viral infections, were identified. PARP10, a member of the poly (ADP-ribose) polymerases (PARPs) family, is related to immunity, metabolism, apoptosis and DNA damage repair [76], and could alter the cell cycle to inhibit virus replication during the process of avian influenza virus infection [77]. EXOSC4 participated in the regulation of anti-viral responses to decrease human papillomavirus infectivity of keratinocytes [78]. GFUS activated the immune-network to enhance the regulation of apoptosis, T cell homeostasis, neutrophil-mediated immunity, neutrophil chemotaxis, interleukin-8 production, inflammatory response, immune response, B-cell activation and MAPK activity activation during hepatitis C virus infection [79]. During human immunodeficiency virus 1 (HIV-1) infection, EEF1D interacted with HIV-1 transcription protein, resulting in the inhibition of the translation of host cell proteins but in an increase in the translation of viral proteins [80]. These studies suggested the importance of albumin together with these candidate genes in fighting infections caused by viruses.
Moreover, from a breeding perspective, the concentration of albumin in serum or milk is influenced by pathological and genetic factors, which highlights the possibility of albumin as a new trait to improve dairy cattle disease resistance. Nowadays, with the comprehensive implication of genomic selection in dairy cattle breeding, where high-density SNP chips, such as Illumina 50 K and GeneSeek 150 K chips, are widely used, most of SNPs are collected from the current SNP database and almost evenly distributed across the whole genome. Therefore, the significant SNPs and genes associated with albumin concentration could be put into such chips to improve the health and resistance to pathogens of newborns in dairy cattle.
5. Conclusions
In summary, our GWAS detected nine and seven genome-wide significant SNPs associated with the concentration of albumin in colostrum and serum, respectively. By integrated analysis of the biological functions of the genes that contain or close to (±1 Mbp) such significant SNPs and the known QTLs for inflammation and immunity capacity, RUNX1, CBR1 and OTULIN were selected as the candidate genes for the albumin concentration in colostrum. Meanwhile, 12 promising candidate genes were suggested for the albumin concentration in colostrum and serum of dairy cattle, including CDK6, SHARPIN, CYC1, EXOSC4, PARP10, NRBP2, GFUS, PYCR3, EEF1D, GSDMD, PYCR2 and CXCL12. Our results provided a genetic view on the regulation of albumin and fundamental information for the genetic improvement program on health and resistance traits in dairy cattle.
Supplementary Materials
The following are available online at https://www.mdpi.com/2076-2615/10/12/2211/s1. Supplementary File 1: MAP file of SNP data, Supplementary File 2: PED file of SNP data, Table S1: The features of genes contained or were close to (±1 Mbp) the significant SNPs for concentration of albumin in colostrum and serum, Table S2: Functional enrichment of the GO and KEGG analysis of 248 genes.
Author Contributions
Conceptualization, D.S. and B.H.; methodology, S.L. and Z.W.; software, S.L. and J.Z.; formal analysis, S.L. and L.X.; investigation, Z.W. and J.Z.; resources, D.S. and S.L.; data curation, D.S.; writing—original draft preparation, S.L.; writing—review and editing, D.S.; visualization, S.L.; supervision, D.S. and B.H.; project administration, D.S.; funding acquisition, D.S. All authors have read and agreed to the published version of the manuscript.
Funding
This research was funded by the National Natural Science Foundation of China (31872330, 31802041), Hebei Key Research and Development Program for Dairy Industry Revitalization (19226371D), Beijing Science and Technology Program (20200105, D171100002417001), and the Program for Changjiang Scholar and Innovation Research Team in University (IRT_15R62).
Acknowledgments
Thanks are due to the Beijing Dairy Cattle Center and the Beijing Sunlon Livestock Development Company Limited for care of the experimental animals and for assisting with the colostrum, serum and hair samples collection.
Conflicts of Interest
The authors declare no conflict of interest.
References
- Boichard, D.; Brochard, M. New phenotypes for new breeding goals in dairy cattle. Animal 2012, 6, 544–550. [Google Scholar] [CrossRef]
- Miglior, F.; Fleming, A.; Malchiodi, F.; Brito, L.F.; Martin, P.; Baes, C.F. A 100-Year Review: Identification and genetic selection of economically important traits in dairy cattle. J. Dairy Sci. 2017, 100, 10251–10271. [Google Scholar] [CrossRef] [PubMed]
- LeBlanc, S.J.; Lissemore, K.D.; Kelton, D.F.; Duffield, T.F.; Leslie, K.E. Major advances in disease prevention in dairy cattle. J. Dairy Sci. 2006, 89, 1267–1279. [Google Scholar] [CrossRef] [PubMed]
- Trotz-Williams, L.A.; Leslie, K.E.; Peregrine, A.S. Passive immunity in Ontario dairy calves and investigation of its association with calf management practices. J. Dairy Sci. 2008, 91, 3840–3849. [Google Scholar] [CrossRef] [PubMed]
- Raboisson, D.; Delor, F.; Cahuzac, E.; Gendre, C.; Sans, P.; Allaire, G. Perinatal, neonatal, and rearing period mortality of dairy calves and replacement heifers in France. J. Dairy Sci. 2013, 96, 2913–2924. [Google Scholar] [CrossRef] [PubMed]
- Cabrera, R.A.; Lin, X.; Campbell, J.M.; Moeser, A.J.; Odle, J. Influence of birth order, birth weight, colostrum and serum immunoglobulin G on neonatal piglet survival. J. Anim. Sci. Biotechnol. 2012, 3, 42. [Google Scholar] [CrossRef] [PubMed]
- Blum, J.W.; Hammon, H. Colostrum effects on the gastrointestinal tract, and on nutritional, endocrine and metabolic parameters in neonatal calves. Livest. Prod. Sci. 2000, 66, 151–159. [Google Scholar] [CrossRef]
- Jordan, S.M.; Morgan, E.H. Albumin, transferrin and gamma-globulin metabolism during lactation in the rat. Q. J. Exp. Physiol. Cogn. Med. Sci. 1967, 52, 422–429. [Google Scholar] [CrossRef]
- Schanbacher, F.L.; Smith, K.L. Formation and role of unusual whey proteins and enzymes: Relation to mammary function. J. Dairy Sci. 1975, 58, 1048–1062. [Google Scholar] [CrossRef]
- Lascelles, A.K. The immune system on the ruminant mammary gland and its role in the control of mastitis. J. Dairy Sci. 1979, 62, 154–167. [Google Scholar] [CrossRef]
- de Wit, J.N. Marschall Rhone-Poulenc Award Lecture. Nutritional and functional characteristics of whey proteins in food products. J. Dairy Sci. 1998, 81, 597–608. [Google Scholar] [CrossRef] [PubMed]
- Rozga, J.; Piatek, T.; Malkowski, P. Human albumin: Old, new, and emerging applications. Ann. Transpl. 2013, 18, 205–217. [Google Scholar] [CrossRef]
- Shamay, A.; Homans, R.; Fuerman, Y.; Levin, I.; Barash, H.; Silanikove, N.; Mabjeesh, S.J. Expression of albumin in nonhepatic tissues and its synthesis by the bovine mammary gland. J. Dairy Sci. 2005, 88, 569–576. [Google Scholar] [CrossRef] [PubMed]
- Wilde, B.; Katsounas, A. Immune Dysfunction and Albumin-Related Immunity in Liver Cirrhosis. Mediat. Inflamm. 2019, 2019, 7537649. [Google Scholar] [CrossRef]
- Poutrel, B.; Caffin, J.P.; Rainard, P. Physiological and Pathological Factors Influencing Bovine Serum-Albumin Content of Milk. J. Dairy Sci. 1983, 66, 535–541. [Google Scholar] [CrossRef] [PubMed]
- Haenlein, G.F.; Schultz, L.H.; Zikakis, J.P. Composition of proteins in milk with varying leucocyte contents. J. Dairy Sci. 1973, 56, 1017–1024. [Google Scholar] [CrossRef]
- Harmon, R.J.; Schanbacher, F.L.; Ferguson, L.C.; Smith, K.L. Concentration of lactoferrin in milk of normal lactating cows and changes occurring during mastitis. Am. J. Vet. Res. 1975, 36, 1001–1007. [Google Scholar]
- Bannerman, D.D.; Paape, M.J.; Hare, W.R.; Sohn, E.J. Increased levels of LPS-binding protein in bovine blood and milk following bacterial lipopolysaccharide challenge. J. Dairy Sci. 2003, 86, 3128–3137. [Google Scholar] [CrossRef]
- Nguyen, D.A.; Neville, M.C. Tight junction regulation in the mammary gland. J. Mammary Gland Biol. Neoplasia 1998, 3, 233–246. [Google Scholar] [CrossRef]
- Sordillo, L.M.; Nickerson, S.C.; Akers, R.M.; Oliver, S.P. Secretion composition during bovine mammary involution and the relationship with mastitis. Int. J. Biochem. 1987, 19, 1165–1172. [Google Scholar] [CrossRef]
- Riollet, C.; Rainard, P.; Poutrel, B. Differential induction of complement fragment C5a and inflammatory cytokines during intramammary infections with Escherichia coli and Staphylococcus aureus. Clin. Diagn. Lab. Immunol. 2000, 7, 161–167. [Google Scholar] [CrossRef] [PubMed]
- Watanabe, A.; Yagi, Y.; Shiono, H.; Yokomizo, Y. Effect of intramammary infusion of tumour necrosis factor-alpha on milk protein composition and induction of acute-phase protein in the lactating cow. J. Vet. Med. B Infect. Dis. Vet. Public Health 2000, 47, 653–662. [Google Scholar] [CrossRef] [PubMed]
- Leitner, G.; Chaffer, M.; Shamay, A.; Shapiro, F.; Merin, U.; Ezra, E.; Saran, A.; Silanikove, N. Changes in milk composition as affected by subclinical mastitis in sheep. J. Dairy Sci. 2004, 87, 46–52. [Google Scholar] [CrossRef] [PubMed]
- Leitner, G.; Merin, U.; Silanikove, N. Changes in milk composition as affected by subclinical mastitis in goats. J. Dairy Sci. 2004, 87, 1719–1726. [Google Scholar] [CrossRef] [PubMed]
- Bounous, G. Whey protein concentrate (WPC) and glutathione modulation in cancer treatment. Anticancer Res. 2000, 20, 4785–4792. [Google Scholar]
- Hill, W.G.; Mackay, T.F. DS Falconer and Introduction to quantitative genetics. Genetics 2004, 167, 1529–1536. [Google Scholar]
- Loomis, S.J.; Tin, A.; Coresh, J.; Boerwinkle, E.; Pankow, J.S.; Kottgen, A.; Selvin, E.; Duggal, P. Heritability analysis of nontraditional glycemic biomarkers in the Atherosclerosis Risk in Communities Study. Genet. Epidemiol. 2019, 43, 776–785. [Google Scholar] [CrossRef]
- Forsblom, C.M.; Kanninen, T.; Lehtovirta, M.; Saloranta, C.; Groop, L.C. Heritability of albumin excretion rate in families of patients with Type II diabetes. Diabetologia 1999, 42, 1359–1366. [Google Scholar] [CrossRef][Green Version]
- Cecchinato, A.; Bobbo, T.; Ruegg, P.L.; Gallo, L.; Bittante, G.; Pegolo, S. Genetic variation in serum protein pattern and blood beta-hydroxybutyrate and their relationships with udder health traits, protein profile, and cheese-making properties in Holstein cows. J. Dairy Sci. 2018, 101, 11108–11119. [Google Scholar] [CrossRef]
- Bondarenko, G.A.; Guseva, N.I.; Ptashevskaia, I.V.; Varnavskaia, N.V.; Peryshkova, T.A. Inheritability of blood metabolite concentrations in cattle at different age periods and seasons of the year. Genetika 1977, 13, 439–450. [Google Scholar]
- Luke, T.D.W.; Nguyen, T.T.T.; Rochfort, S.; Wales, W.J.; Richardson, C.M.; Abdelsayed, M.; Pryce, J.E. Genomic prediction of serum biomarkers of health in early lactation. J. Dairy Sci. 2019, 102, 11142–11152. [Google Scholar] [CrossRef] [PubMed]
- Zhang, H.; Wang, Z.; Wang, S.; Li, H. Progress of genome wide association study in domestic animals. J. Anim. Sci. Biotechnol. 2012, 3, 26. [Google Scholar] [CrossRef] [PubMed]
- Oliveira, H.R.; Cant, J.P.; Brito, L.F.; Feitosa, F.L.B.; Chud, T.C.S.; Fonseca, P.A.S.; Jamrozik, J.; Silva, F.F.; Lourenco, D.A.L.; Schenkel, F.S. Genome-wide association for milk production traits and somatic cell score in different lactation stages of Ayrshire, Holstein, and Jersey dairy cattle. J. Dairy Sci. 2019, 102, 8159–8174. [Google Scholar] [CrossRef] [PubMed]
- Meredith, B.K.; Kearney, F.J.; Finlay, E.K.; Bradley, D.G.; Fahey, A.G.; Berry, D.P.; Lynn, D.J. Genome-wide associations for milk production and somatic cell score in Holstein-Friesian cattle in Ireland. BMC Genet. 2012, 13, 21. [Google Scholar] [CrossRef]
- Cole, J.B.; Wiggans, G.R.; Ma, L.; Sonstegard, T.S.; Lawlor, T.J., Jr.; Crooker, B.A.; Van Tassell, C.P.; Yang, J.; Wang, S.; Matukumalli, L.K.; et al. Genome-wide association analysis of thirty one production, health, reproduction and body conformation traits in contemporary U.S. Holstein cows. BMC Genom. 2011, 12, 408. [Google Scholar] [CrossRef]
- de Klerk, B.; Emam, M.; Thompson-Crispi, K.A.; Sargolzaei, M.; van der Poel, J.J.; Mallard, B.A. A genome-wide association study for natural antibodies measured in blood of Canadian Holstein cows. BMC Genom. 2018, 19, 694. [Google Scholar] [CrossRef]
- Li, C.; Sun, D.; Zhang, S.; Wang, S.; Wu, X.; Zhang, Q.; Liu, L.; Li, Y.; Qiao, L. Genome wide association study identifies 20 novel promising genes associated with milk fatty acid traits in Chinese Holstein. PLoS ONE 2014, 9, e96186. [Google Scholar] [CrossRef]
- Sodeland, M.; Kent, M.P.; Olsen, H.G.; Opsal, M.A.; Svendsen, M.; Sehested, E.; Hayes, B.J.; Lien, S. Quantitative trait loci for clinical mastitis on chromosomes 2, 6, 14 and 20 in Norwegian Red cattle. Anim. Genet. 2011, 42, 457–465. [Google Scholar] [CrossRef]
- Meredith, B.K.; Berry, D.P.; Kearney, F.; Finlay, E.K.; Fahey, A.G.; Bradley, D.G.; Lynn, D.J. A genome-wide association study for somatic cell score using the Illumina high-density bovine beadchip identifies several novel QTL potentially related to mastitis susceptibility. Front. Genet. 2013, 4, 229. [Google Scholar] [CrossRef]
- Wu, X.; Lund, M.S.; Sahana, G.; Guldbrandtsen, B.; Sun, D.; Zhang, Q.; Su, G. Association analysis for udder health based on SNP-panel and sequence data in Danish Holsteins. Genet. Sel. Evol. 2015, 47, 50. [Google Scholar] [CrossRef][Green Version]
- Cordero-Solorzano, J.; Parmentier, H.K.; Arts, J.A.J.; van der Poel, J.; de Koning, D.J.; Bovenhuis, H. Genome-wide association study identifies loci influencing natural antibody titers in milk of Dutch Holstein-Friesian cattle. J. Dairy Sci. 2019, 102, 11092–11103. [Google Scholar] [CrossRef] [PubMed]
- Purcell, S.; Neale, B.; Todd-Brown, K.; Thomas, L.; Ferreira, M.A.; Bender, D.; Maller, J.; Sklar, P.; de Bakker, P.I.; Daly, M.J.; et al. PLINK: A tool set for whole-genome association and population-based linkage analyses. Am. J. Hum. Genet. 2007, 81, 559–575. [Google Scholar] [CrossRef] [PubMed]
- Wiggans, G.R.; Sonstegard, T.S.; Vanraden, P.M.; Matukumalli, L.K.; Schnabel, R.D.; Taylor, J.F.; Schenkel, F.S.; Van Tassell, C.P. Selection of single-nucleotide polymorphisms and quality of genotypes used in genomic evaluation of dairy cattle in the United States and Canada. J. Dairy Sci. 2009, 92, 3431–3436. [Google Scholar] [CrossRef] [PubMed]
- Yang, J.; Lee, S.H.; Goddard, M.E.; Visscher, P.M. GCTA: A tool for genome-wide complex trait analysis. Am. J. Hum. Genet. 2011, 88, 76–82. [Google Scholar] [CrossRef]
- Johnson, R.C.; Nelson, G.W.; Troyer, J.L.; Lautenberger, J.A.; Kessing, B.D.; Winkler, C.A.; O’Brien, S.J. Accounting for multiple comparisons in a genome-wide association study (GWAS). BMC Genom. 2010, 11, 724. [Google Scholar] [CrossRef]
- Benjamini, Y.; Hochberg, Y. Controlling the False Discovery Rate—A Practical and Powerful Approach to Multiple Testing. J. R. Stat. Soc. B 1995, 57, 289–300. [Google Scholar] [CrossRef]
- Weller, J.I.; Song, J.Z.; Heyen, D.W.; Lewin, H.A.; Ron, M. A new approach to the problem of multiple comparisons in the genetic dissection of complex traits. Genetics 1998, 150, 1699–1706. [Google Scholar]
- Aulchenko, Y.S.; Ripke, S.; Isaacs, A.; Van Duijn, C.M. GenABEL: An R library for genome-wide association analysis. Bioinformatics 2007, 23, 1294–1296. [Google Scholar] [CrossRef]
- The R Development Core Team. R: A Language and Environment for Statistical Computing; The R Development Core Team: Vienna, Austria, 2015. [Google Scholar]
- Turner, S.D. qqman: An R package for visualizing GWAS results using Q-Q and manhattan plots. bioRxiv 2014. [Google Scholar] [CrossRef]
- Price, A.L.; Zaitlen, N.A.; Reich, D.; Patterson, N. New approaches to population stratification in genome-wide association studies. Nat. Rev. Genet. 2010, 11, 459–463. [Google Scholar] [CrossRef]
- Haldar, T.; Ghosh, S. Effect of Population Stratification on False Positive Rates of Population-Based Association Analyses of Quantitative Traits. Ann. Hum. Genet. 2012, 76, 237–245. [Google Scholar] [CrossRef] [PubMed]
- Devlin, B.; Roeder, K. Genomic control for association studies. Biometrics 1999, 55, 997–1004. [Google Scholar] [CrossRef] [PubMed]
- Yang, J.; Zaitlen, N.A.; Goddard, M.E.; Visscher, P.M.; Price, A.L. Advantages and pitfalls in the application of mixed-model association methods. Nat. Genet. 2014, 46, 100–106. [Google Scholar] [CrossRef] [PubMed]
- Kumar, S.K.; Feldman, M.W.; Rehkopf, D.H.; Tuljapurkar, S. Correction for Krishna Kumar et al., Limitations of GCTA as a solution to the missing heritability problem. Proc. Natl. Acad. Sci. USA 2016, 113, E813. [Google Scholar] [CrossRef]
- Barracco, V.; Moschini, R.; Renzone, G.; Cappiello, M.; Balestri, F.; Scaloni, A.; Mura, U.; Del-Corso, A. Dehydrogenase/reductase activity of human carbonyl reductase 1 with NADP(H) acting as a prosthetic group. Biochem. Biophys. Res. Commun. 2020, 522, 259–263. [Google Scholar] [CrossRef]
- Kagan, V.E.; Tyurin, V.A.; Jiang, J.F.; Tyurina, Y.Y.; Ritov, V.B.; Amoscato, A.A.; Osipov, A.N.; Belikova, N.A.; Kapralov, A.A.; Kini, V.; et al. Cytochrome c acts as a cardiolipin oxygenase required for release of proapoptotic factors. Nat. Chem. Biol. 2005, 1, 223–232. [Google Scholar] [CrossRef]
- Belikova, N.A.; Vladimirov, Y.A.; Osipov, A.N.; Kapralov, A.A.; Tyurin, V.A.; Potapovich, M.V.; Basova, L.V.; Peterson, J.; Kurnikov, I.V.; Kagan, V.E. Peroxidase activity and structural transitions of cytochrome c bound to cardiolipin-containing membranes. Biochemistry 2006, 45, 4998–5009. [Google Scholar] [CrossRef]
- Kagan, V.E.; Bayir, H.A.; Belikova, N.A.; Kapralov, O.; Tyurina, Y.Y.; Tyurin, V.A.; Jiang, J.F.; Stoyanovsky, D.A.; Wipf, P.; Kochanek, P.M.; et al. Cytochrome c/cardiolipin relations in mitochondria: A kiss of death. Free Radic. Biol. Med. 2009, 46, 1439–1453. [Google Scholar] [CrossRef]
- Ritter, M.; Klimiankou, M.; Klimenkova, O.; Schambach, A.; Hoffmann, D.; Schmidt, A.; Kanz, L.; Link, D.C.; Welte, K.; Skokowa, J. Cooperating, congenital neutropenia-associated Csf3r and Runx1 mutations activate pro-inflammatory signaling and inhibit myeloid differentiation of mouse HSPCs. Ann. Hematol. 2020, 99, 2329–2338. [Google Scholar] [CrossRef]
- Damgaard, R.B.; Walker, J.A.; Marco-Casanova, P.; Morgan, N.V.; Titheradge, H.L.; Elliott, P.R.; McHale, D.; Maher, E.R.; McKenzie, A.N.J.; Komander, D. The Deubiquitinase OTULIN Is an Essential Negative Regulator of Inflammation and Autoimmunity. Cell 2016, 166, 1215–1230. [Google Scholar] [CrossRef]
- van Wijk, S.J.L.; Fricke, F.; Herhaus, L.; Gupta, J.; Hotte, K.; Pampaloni, F.; Grumati, P.; Kaulich, M.; Sou, Y.S.; Komatsu, M.; et al. Linear ubiquitination of cytosolic Salmonella Typhimurium activates NF-kappaB and restricts bacterial proliferation. Nat. Microbiol. 2017, 2, 17066. [Google Scholar] [CrossRef] [PubMed]
- Uras, I.Z.; Maurer, B.; Nivarthi, H.; Jodl, P.; Kollmann, K.; Prchal-Murphy, M.; Milosevic Feenstra, J.D.; Zojer, M.; Lagger, S.; Grausenburger, R.; et al. CDK6 coordinates JAK2 (V617F) mutant MPN via NF-kappaB and apoptotic networks. Blood 2019, 133, 1677–1690. [Google Scholar] [CrossRef] [PubMed]
- Buss, H.; Handschick, K.; Jurrmann, N.; Pekkonen, P.; Beuerlein, K.; Muller, H.; Wait, R.; Saklatvala, J.; Ojala, P.M.; Schmitz, M.L.; et al. Cyclin-dependent kinase 6 phosphorylates NF-kappaB P65 at serine 536 and contributes to the regulation of inflammatory gene expression. PLoS ONE 2012, 7, e51847. [Google Scholar] [CrossRef]
- Zinngrebe, J.; Rieser, E.; Taraborrelli, L.; Peltzer, N.; Hartwig, T.; Ren, H.; Kovacs, I.; Endres, C.; Draber, P.; Darding, M.; et al. LUBAC deficiency perturbs TLR3 signaling to cause immunodeficiency and autoinflammation. J. Exp. Med. 2016, 213, 2671–2689. [Google Scholar] [CrossRef] [PubMed]
- Kasirer-Friede, A.; Tjahjono, W.; Eto, K.; Shattil, S.J. SHARPIN at the nexus of integrin, immune, and inflammatory signaling in human platelets. Proc. Natl. Acad. Sci. USA 2019, 116, 4983–4988. [Google Scholar] [CrossRef]
- Hanwei, J.; Nie, X.; Zhu, H.; Li, B.; Pang, F.; Yang, X.; Cao, R.; Yang, X.; Zhu, S.; Peng, D.; et al. miR-146b-5p Plays a Critical Role in the Regulation of Autophagy in per Brucella melitensis-Infected RAW264.7 Cells. Biomed. Res. Int. 2020, 2020, 1953242. [Google Scholar] [CrossRef]
- Phang, J.M.; Pandhare, J.; Liu, Y. The metabolism of proline as microenvironmental stress substrate. J. Nutr. 2008, 138, 2008S–2015S. [Google Scholar] [CrossRef]
- Kuo, M.L.; Lee, M.B.; Tang, M.; den Besten, W.; Hu, S.; Sweredoski, M.J.; Hess, S.; Chou, C.M.; Changou, C.A.; Su, M.; et al. PYCR1 and PYCR2 Interact and Collaborate with RRM2B to Protect Cells from Overt Oxidative Stress. Sci. Rep. 2016, 6, 18846. [Google Scholar] [CrossRef]
- Sollberger, G.; Choidas, A.; Burn, G.L.; Habenberger, P.; Di Lucrezia, R.; Kordes, S.; Menninger, S.; Eickhoff, J.; Nussbaumer, P.; Klebl, B.; et al. Gasdermin D plays a vital role in the generation of neutrophil extracellular traps. Sci. Immunol. 2018, 3, eaar6689. [Google Scholar] [CrossRef]
- Orning, P.; Lien, E.; Fitzgerald, K.A. Gasdermins and their role in immunity and inflammation. J. Exp. Med. 2019, 216, 2453–2465. [Google Scholar] [CrossRef]
- Li, S.; Wu, Y.; Yang, D.; Wu, C.; Ma, C.; Liu, X.; Moynagh, P.N.; Wang, B.; Hu, G.; Yang, S. Gasdermin D in peripheral myeloid cells drives neuroinflammation in experimental autoimmune encephalomyelitis. J. Exp. Med. 2019, 216, 2562–2581. [Google Scholar] [CrossRef] [PubMed]
- Janssens, R.; Struyf, S.; Proost, P. The unique structural and functional features of CXCL12. Cell Mol. Immunol. 2018, 15, 299–311. [Google Scholar] [CrossRef] [PubMed]
- Tachibana, K.; Hirota, S.; Iizasa, H.; Yoshida, H.; Kawabata, K.; Kataoka, Y.; Kitamura, Y.; Matsushima, K.; Yoshida, N.; Nishikawa, S.; et al. The chemokine receptor CXCR4 is essential for vascularization of the gastrointestinal tract. Nature 1998, 393, 591–594. [Google Scholar] [CrossRef] [PubMed]
- Ma, Q.; Jones, D.; Borghesani, P.R.; Segal, R.A.; Nagasawa, T.; Kishimoto, T.; Bronson, R.T.; Springer, T.A. Impaired B-lymphopoiesis, myelopoiesis, and derailed cerebellar neuron migration in CXCR4- and SDF-1-deficient mice. Proc. Natl. Acad. Sci. USA 1998, 95, 9448–9453. [Google Scholar] [CrossRef] [PubMed]
- Kaufmann, M.; Feijs, K.L.; Luscher, B. Function and regulation of the mono-ADP-ribosyltransferase ARTD10. Curr. Top Microbiol. Immunol. 2015, 384, 167–188. [Google Scholar] [CrossRef] [PubMed]
- Yu, M.; Zhang, C.; Yang, Y.; Yang, Z.; Zhao, L.; Xu, L.; Wang, R.; Zhou, X.; Huang, P. The interaction between the PARP10 protein and the NS1 protein of H5N1 AIV and its effect on virus replication. Virol. J. 2011, 8, 546. [Google Scholar] [CrossRef] [PubMed]
- Sun, Y.Z.; Li, J.F.; Wei, Z.D.; Jiang, H.H.; Hong, Y.X.; Zheng, S.; Qi, R.Q.; Gao, X.H. Proteomic and bioinformatic analysis of condyloma acuminata: Mild hyperthermia treatment reveals compromised HPV infectivity of keratinocytes via regulation of metabolism, differentiation and anti-viral responses. Int. J. Hyperth. 2019, 36, 383–393. [Google Scholar] [CrossRef]
- Wang, L.; Huang, J.; Jiang, M.; Lin, H. Tissue-specific transplantation antigen P35B (TSTA3) immune response-mediated metabolism coupling cell cycle to postreplication repair network in no-tumor hepatitis/cirrhotic tissues (HBV or HCV infection) by biocomputation. Immunol. Res. 2012, 52, 258–268. [Google Scholar] [CrossRef]
- Rotger, M.; Dalmau, J.; Rauch, A.; McLaren, P.; Bosinger, S.E.; Martinez, R.; Sandler, N.G.; Roque, A.; Liebner, J.; Battegay, M.; et al. Comparative transcriptomics of extreme phenotypes of human HIV-1 infection and SIV infection in sooty mangabey and rhesus macaque. J. Clin. Investig. 2011, 121, 2391–2400. [Google Scholar] [CrossRef]
Publisher’s Note: MDPI stays neutral with regard to jurisdictional claims in published maps and institutional affiliations. |
© 2020 by the authors. Licensee MDPI, Basel, Switzerland. This article is an open access article distributed under the terms and conditions of the Creative Commons Attribution (CC BY) license (http://creativecommons.org/licenses/by/4.0/).