Article

Exploring the Diversity of Active Ureolytic Bacteria in the Rumen by Comparison of cDNA and gDNA

State Key Laboratory of Animal Nutrition, Institute of Animal Sciences, Chinese Academy of Agricultural Sciences, No.2 Yuanmingyuan West Road, Haidian, Beijing 100193, China
*
Author to whom correspondence should be addressed.
Animals 2020, 10(11), 2162; https://doi.org/10.3390/ani10112162
Submission received: 20 October 2020 / Revised: 10 November 2020 / Accepted: 15 November 2020 / Published: 20 November 2020

Abstract

:

Simple Summary

Ureolytic bacteria produce urease that hydrolyzes dietary or recycled urea to ammonia, which can then be converted into microbial proteins. The diversity of ruminal ureolytic bacteria benefits N utilization efficiency in ruminants. However, there is no information at the complementary DNA (cDNA) level to reflect the active status of ureolytic bacteria. To reveal the diversity of active ureolytic bacteria in the rumen, we compared ureC amplicons between genomic DNA (gDNA) and cDNA. These results revealed distinct ureolytic bacterial community profiles based on gDNA and cDNA. The dominant ureolytic bacterial had high transcriptional activity, and the differential were mainly distributed in the genus of low abundance.

Abstract

In this study we revealed the diversity of active ureolytic bacteria in the rumen by compared ureC amplicons between gDNA and cDNA. Rumen fluid was collected from four Holstein dairy cows with rumen fistulas at 0, 2, and 6 h after morning feeding. Total microbial gDNA and RNA were isolated, and the RNA was reverse-transcribed into cDNA. The ureC gene amplicons of gDNA and cDNA were produced and sequenced by MiSeq. These results revealed that the sampling time had no significant difference on the alphssa and beta diversity indices of the ureolytic bacteria. The Shannon diversity of the ureC gene for cDNA was greater than that for gDNA (p < 0.05). There were significant difference in the beta diversity of ureolytic bacteria between gDNA and cDNA (p < 0.01), which indicates a shift in the community of active ureolytic bacteria. Approximately 67% of ureC sequences from cDNA could not be confidently classified at the genus level. The active ureolytic bacteria were mainly from Helicobacter, Herbaspirillum, Clostridium, Paenibacillus, Synechococcus, and Sphingobacterium sp. Changes in the operational taxonomic units revealed that the top abundant ureC genes were mostly consistent between gDNA and cDNA, and most differences occurred in the ureC genes with lower abundances. These results revealed distinct ureolytic bacteria community profiles based on gDNA and cDNA. The dominant ureolytic bacteria had high transcriptional activity, and the differential were mainly distributed in the genus of low abundance.

1. Introduction

Urea is an economical non-protein nitrogen used in the diets of ruminants [1]. Ureolytic bacteria produce ureases in the rumen, which is a key enzyme in the hydrolysis of dietary urea to ammonia and carbon dioxide [2]. Ammonia derived from urea can conversion into microbial proteins, which are ideal to promote animal growth and production [3]. Endogenous urea is converted in the liver from excess ammonia and then recycled via the ruminal wall and salivary secretion [4]. Urea recycling is an important biological process in the rumen in response to low dietary nitrogen [5]. However, hyperactivity of urease activity produces excess ammonia that is excreted in the urine, which reduces the quality of lactoprotein and pollutes the environment. Therefore, elucidation of diversity of rumen ureolytic bacteria is important to increase the efficiency of urea-N utilization for ruminants.
We assessed the diversity of ureolytic bacteria in the rumen, based on analysis of gDNA [6]. Although gDNA-based techniques have provided important insights, there are persistent shortcomings in the ability to identify active microbes in the rumen [7]. The detected gDNA may originate from dead or inactive bacteria [8]. A large number of ureC genes have been identified in the rumen, but the expression patterns of these genes remain unclear. In general, RNA is reportedly a more reliable indicator of bacteria viability than target genes of gDNA [9,10,11]. Qi et al. [12] examined fungal gene expression in the rumen of muskoxen (Ovibos moschatus) by analysis of a library of cDNA.
Sequencing of cDNA amplicons from reverse-transcription of RNA is better suited to assess the in situ activity of the microbial community because the concentration of RNA is generally related to the synthesis potential and activity of microbial proteins [13]. RNA levels are Under stress, endonuclease can initiate degradation of functional ribosomes, whereas homologs in physically damaged or dying bacteria can be degraded by homologs of ribonuclease I [14]. The bacteria ribosomes relatively labile characteristic has been used in numerous studies to better assess the active and viable components of microbial communities [14,15].
To investigate the diversity of active ureolytic bacteria, we compared ureC amplicons between gDNA and cDNA in the rumen. This survey is expected to expanded current knowledge of the active ureolytic microbial community in the rumen in order to provide a basis for the design of regulation rumen ureolytic bacteria composition to increase the efficiency of urea-N utilization for ruminants.

2. Materials and Methods

2.1. Animals and Sampling

Rumen fluid samples were collected from four non-lactating Holstein dairy cows (body weight, 550 ± 50 kg) fitted with ruminal fistulas. The experimental procedures involving the care and management of dairy cows were approved by the Animal Care and Use Committee for Livestock of the Institute of Animal Sciences, Chinese Academy of Agricultural Sciences (No. IAS201914). Diet was a total mixed ration, consisting of 36% corn silage, 16% corn, 14.6% syrup vinasse, 5.9% soybean meal, 5.7% dried distillers grains with solubles, 5.4% soybean hulls, 5.3% barley, 5.0% oat grass, 4.0% alfalfa, 0.8%, CaHPO4, 0.5% NaHCO3, 0.2% NaCl, 0.2% CaCO3, 0.1%, C5H14ClNO, 0.1% calcium fatty acid, 0.1% double beneficial element, and 0.1% rhodamine. Samples of the rumen contents of each cow were obtained at 0, 2, and 6 h after morning feeding. The rumen fluid samples were stored in liquid nitrogen prior to analysis.

2.2. gDNA Extraction and cDNA Reverse Transcription

Total gDNA was extracted using the cetyltrimethylammonium bromide method, as described previously [16]. Total RNA was extracted using TRIzol method. Rumen fluid samples were homogenized for 5 min with steel balls (one with a diameter of 20 mm and 10 with diameters of 5 mm) into fine powder in liquid nitrogen using a CryoMill (Retsch GmbH). Then, 3 g of the rumen fluid samples were incubated in 15 mL of TRIzol reagent (Invitrogen Corporation, Carlsbad, CA, USA) at room temperature for 5 min. Afterward, 4 mL of chloroform were added to the samples by vortexing for 15 s and then each was incubated at room temperature for 3 min. Following centrifugation at 13,000× g for 15 min at 4 °C, the aqueous phase was transferred to a fresh tube. Following the addition of 10 mL of isopropyl alcohol, the tubes were vortexed for 30 s and then incubated at room temperature for 10 min. Afterward, the samples were centrifuged at 13,000× g for 10 min at 4 °C and the supernatant was discarded. The RNA pellet was washed once with 75% ethanol and resuspended in 10 mL of 75% ethanol by hand mixing and then centrifuged at 7500× g for 10 min at 4 °C. Once the supernatant was removed, the RNA pellet was air-dried and dissolved in RNase-free water by passing the solution a few times through a pipette tip, and then incubated for 10 min at 55 °C. Trace gDNA in the RNA samples was removed by incubation with 4 μL of DNase I (Takara Bio, Inc., Kusatsu, Shiga Prefecture, Japan) per 100 μg of total RNA for 30 min at 37 °C. Then, the RNA was further purified using an RNAclean Kit (Tiangen Biotech Co., Ltd., Beijing, China). The 16S rRNA gene was amplified using the primers 27F (5′-GAG TTT GAT CCT GGC TCA G-3′) and 1492R (5′-GGT TAC CTT GTT ACG ACT T-3′). Purified RNA was used to check whether the purified RNA samples contained residual gDNA. The integrity and concentration of the total RNA were assessed using an Agilent 2100 Bioanalyzer (Agilent Technologies, Mississauga, ON, Canada). RNA samples with an RNA integrity number > 8.0 were deemed suitable for reverse transcription of cDNA, which was synthesized using FastQuant RT Super Mix (Tiangen Biotech Co., Ltd.) and random primers in accordance with established procedures.

2.3. PCR Amplification and Sequencing of UreC Genes

UreC genes were amplified with the primer set UreC-F (5′-TGG GCC TTA AAA THC AYG ARG AYT GGG-3′) and UreC-R (5′-GGT GGT GGC ACA CCA TNA NCA TRTC-3′) [17]. Reactions were performed in a MyCycler Thermal Cycler (Bio-Rad, Hercules, CA, USA) using a 50-µL mixture containing 5 µL of 10 × PCR buffer (Invitrogen Corporation), 1 µL of dNTP mixture (10 mM), 1.5 µL of each forward and reverse primer (10 µM), 0.25 µL of Platinum Taq DNA polymerase (Invitrogen Corporation, Carlsbad, CA, USA), 2 µL of gDNA or cDNA (100 ng/µL), and 38.75 µL of sterile double-distilled H2O. The PCR amplification consisted of denaturation at 94 °C for 5 min, followed by 30 cycles at 94 °C for 30 s, 50 °C for 30 s, and 72 °C for 30 s, and a final extension at 72 °C for 15 min [6]. PCR amplicons were extracted from agarose gels and purified using the AxyPrep DNA Gel Extraction Kit (Axygen Scientific Inc., Union City, CA, USA) in accordance with the manufacturer’s instructions and quantified using the QubitTM Assay kit (Thermo Fisher Scientific, Waltham, MA, USA). Purified amplicons were pooled in equimolar amounts and paired ends were sequenced (2 × 300 bp) on an Illumina MiSeq platform (Illumina, Inc., San Diego, CA, USA) by Shanghai Majorbio Bio-pharm Technology Co., Ltd. (Shanghai, China). All the sequences were submitted to the NCBI Sequence Read Archive (SRA; http://www.ncbi.nlm.nih.gov/Traces/sra/), under accession number SRA: SRP278349.

2.4. Statistic Analysis

Sequence analysis used methods described previously [6]. Briefly, low-quality raw reads were eliminated using the Trimmomatic read trimming tool [18]. Paired-end reads were merged using FLASH [19]. Merged reads of >200 bp were assigned to each sample based on the unique barcode [20,21]. Chimera sequences were detected and removed using the UCHIME de novo algorithm [22]. Operational taxonomic units (OTUs) were clustered at a similarity cut off value of 0.97 using the USEARCH sequence analysis tool included with the QIIME package [20,23]. A clustering value of 0.97 similarity was empirically confirmed by analyzing the clustering of taxonomically known ureC genes [6]. Taxonomic assignment of representative sequences of OTUs was performed using GraftM 1 with a likelihood cut off of 0. 80 when using pplacer for placement of the sequences against a previously compiled ureC gene package [6]. Alpha and beta diversity indices and significant fold-changes of OTUs were calculated with QIIME.
The differences between gDNA and cDNA for the relative abundance > 0.001% and 1% ureC gene OTUs and ureolytic bacteria genera, respectively, were analyzed using the paired Mann–Whitney test with GraphPad Prism software (GraphPad Software, Inc., San Diego, CA, USA). Differences in beta diversity between gDNA and cDNA were determined by analysis of similarity. A probability (p) value of < 0.05 was considered statistically significant.

3. Results

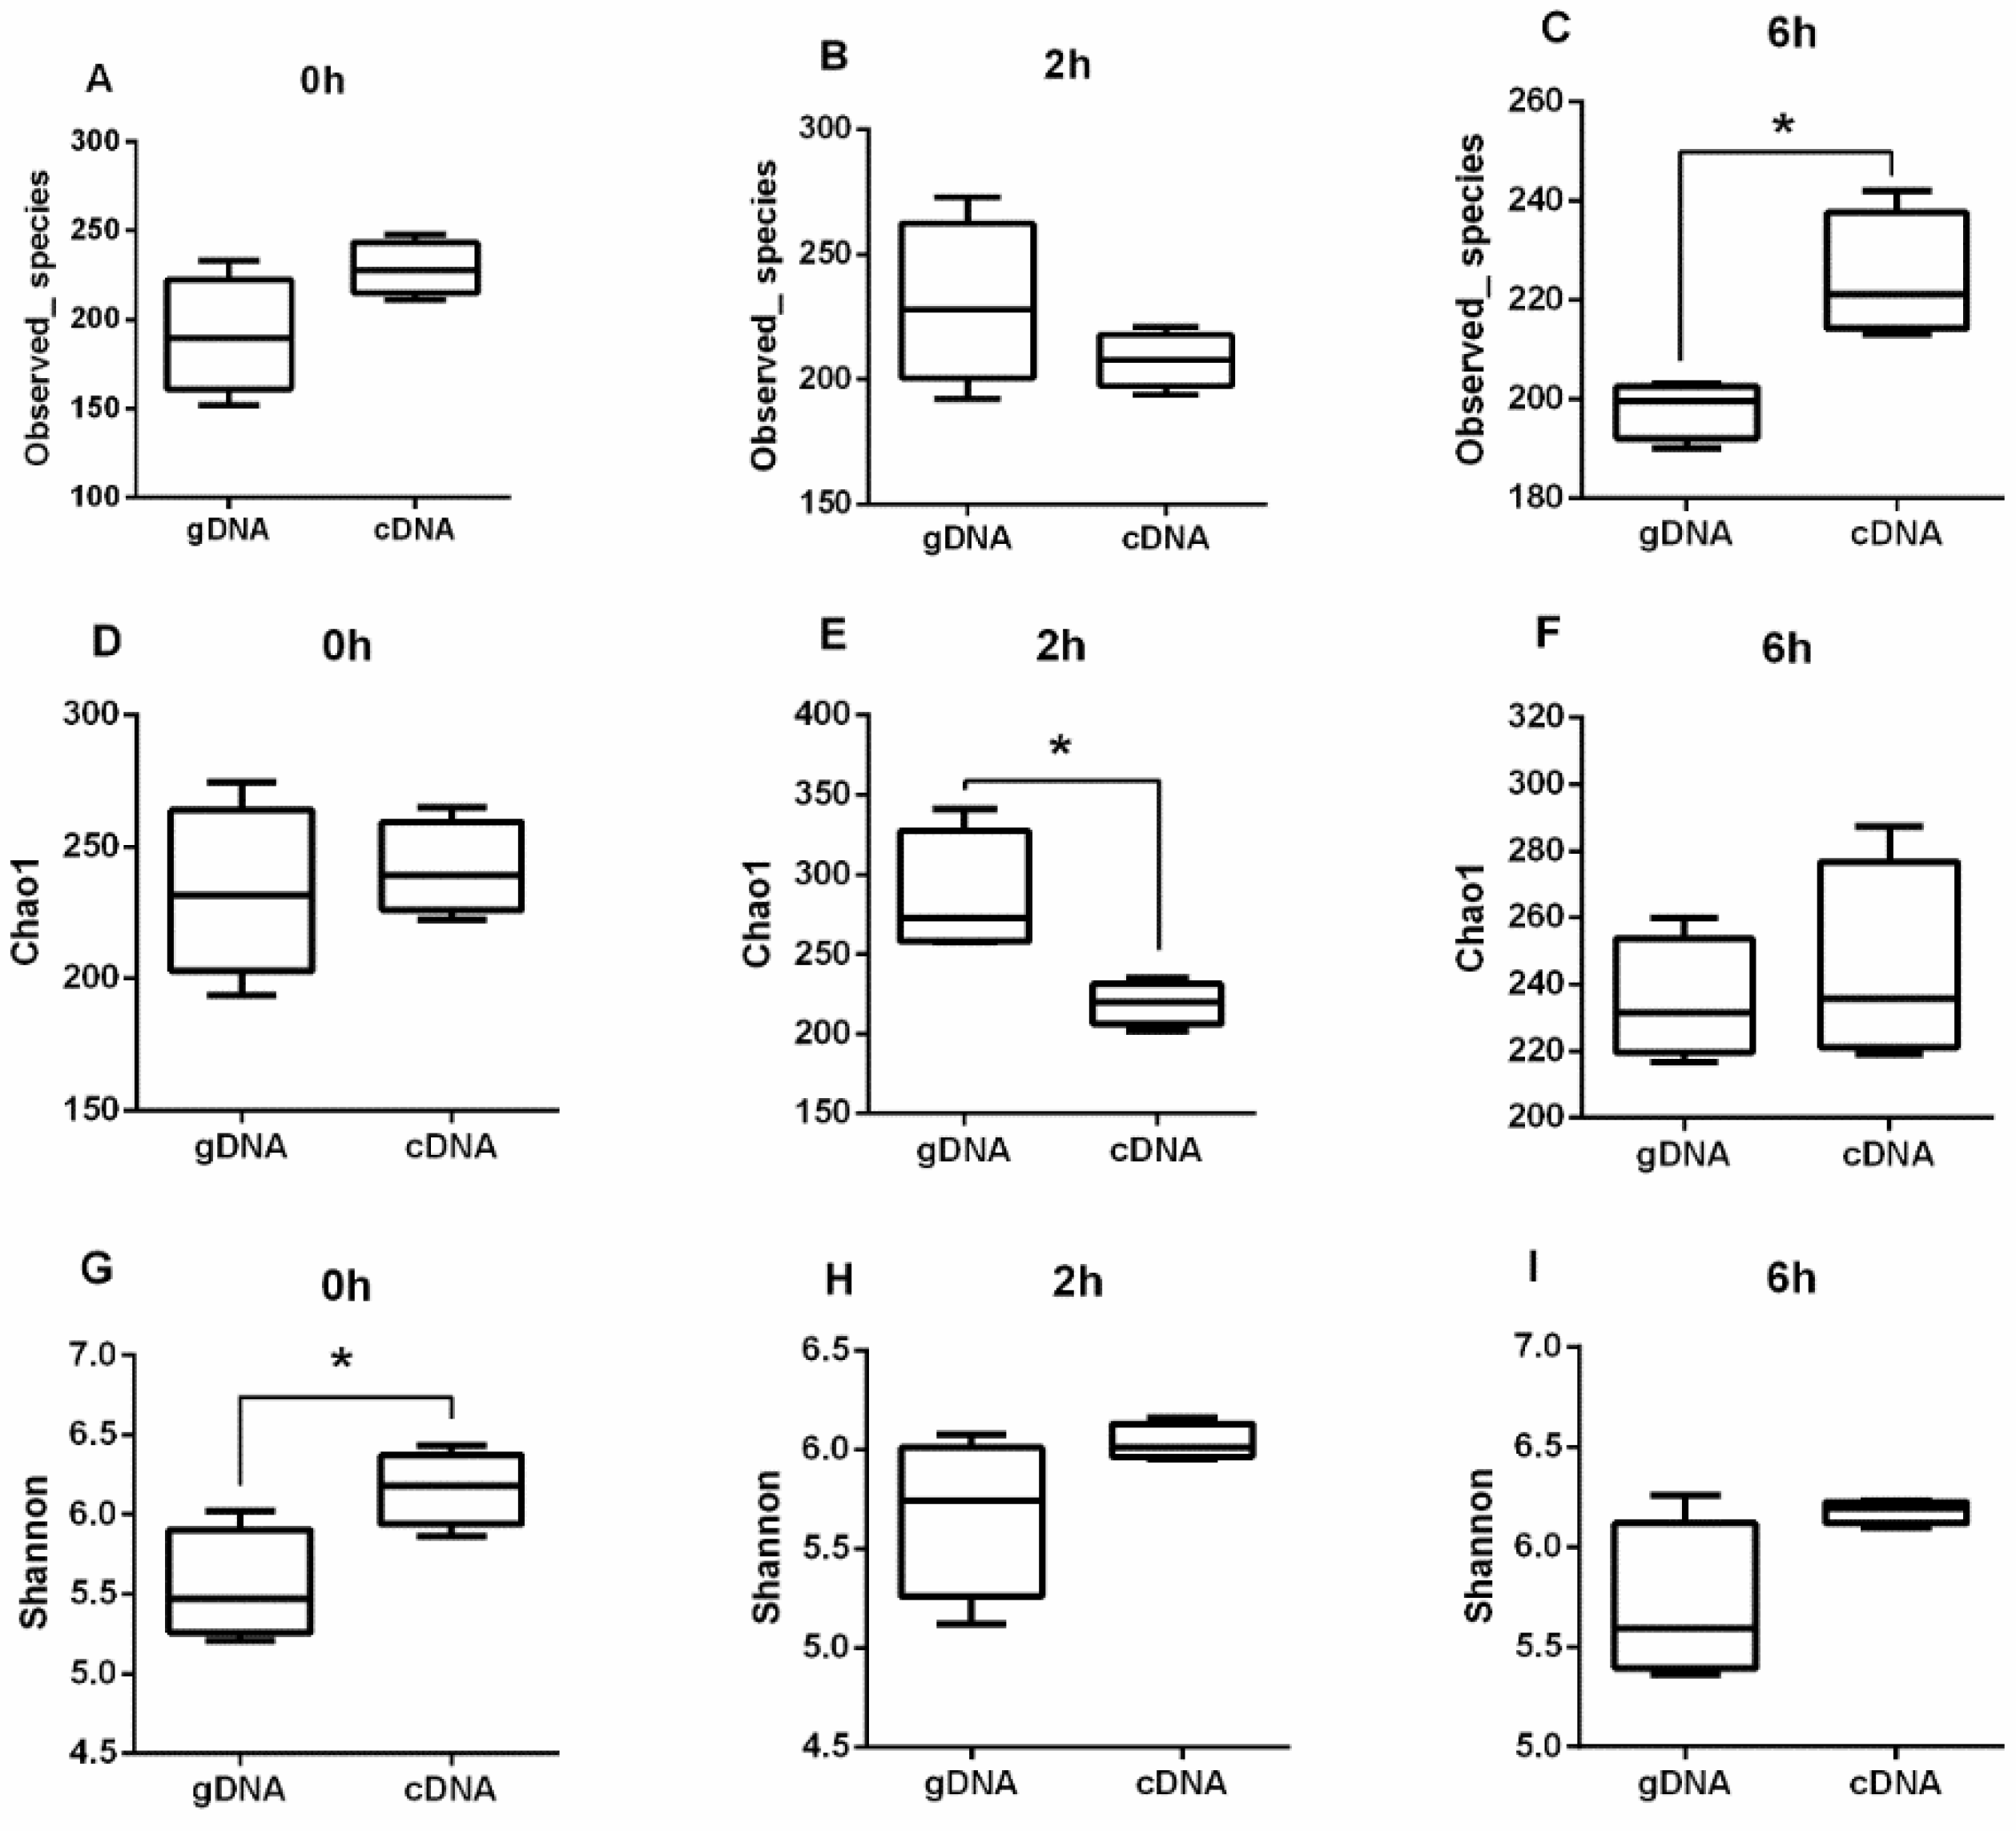
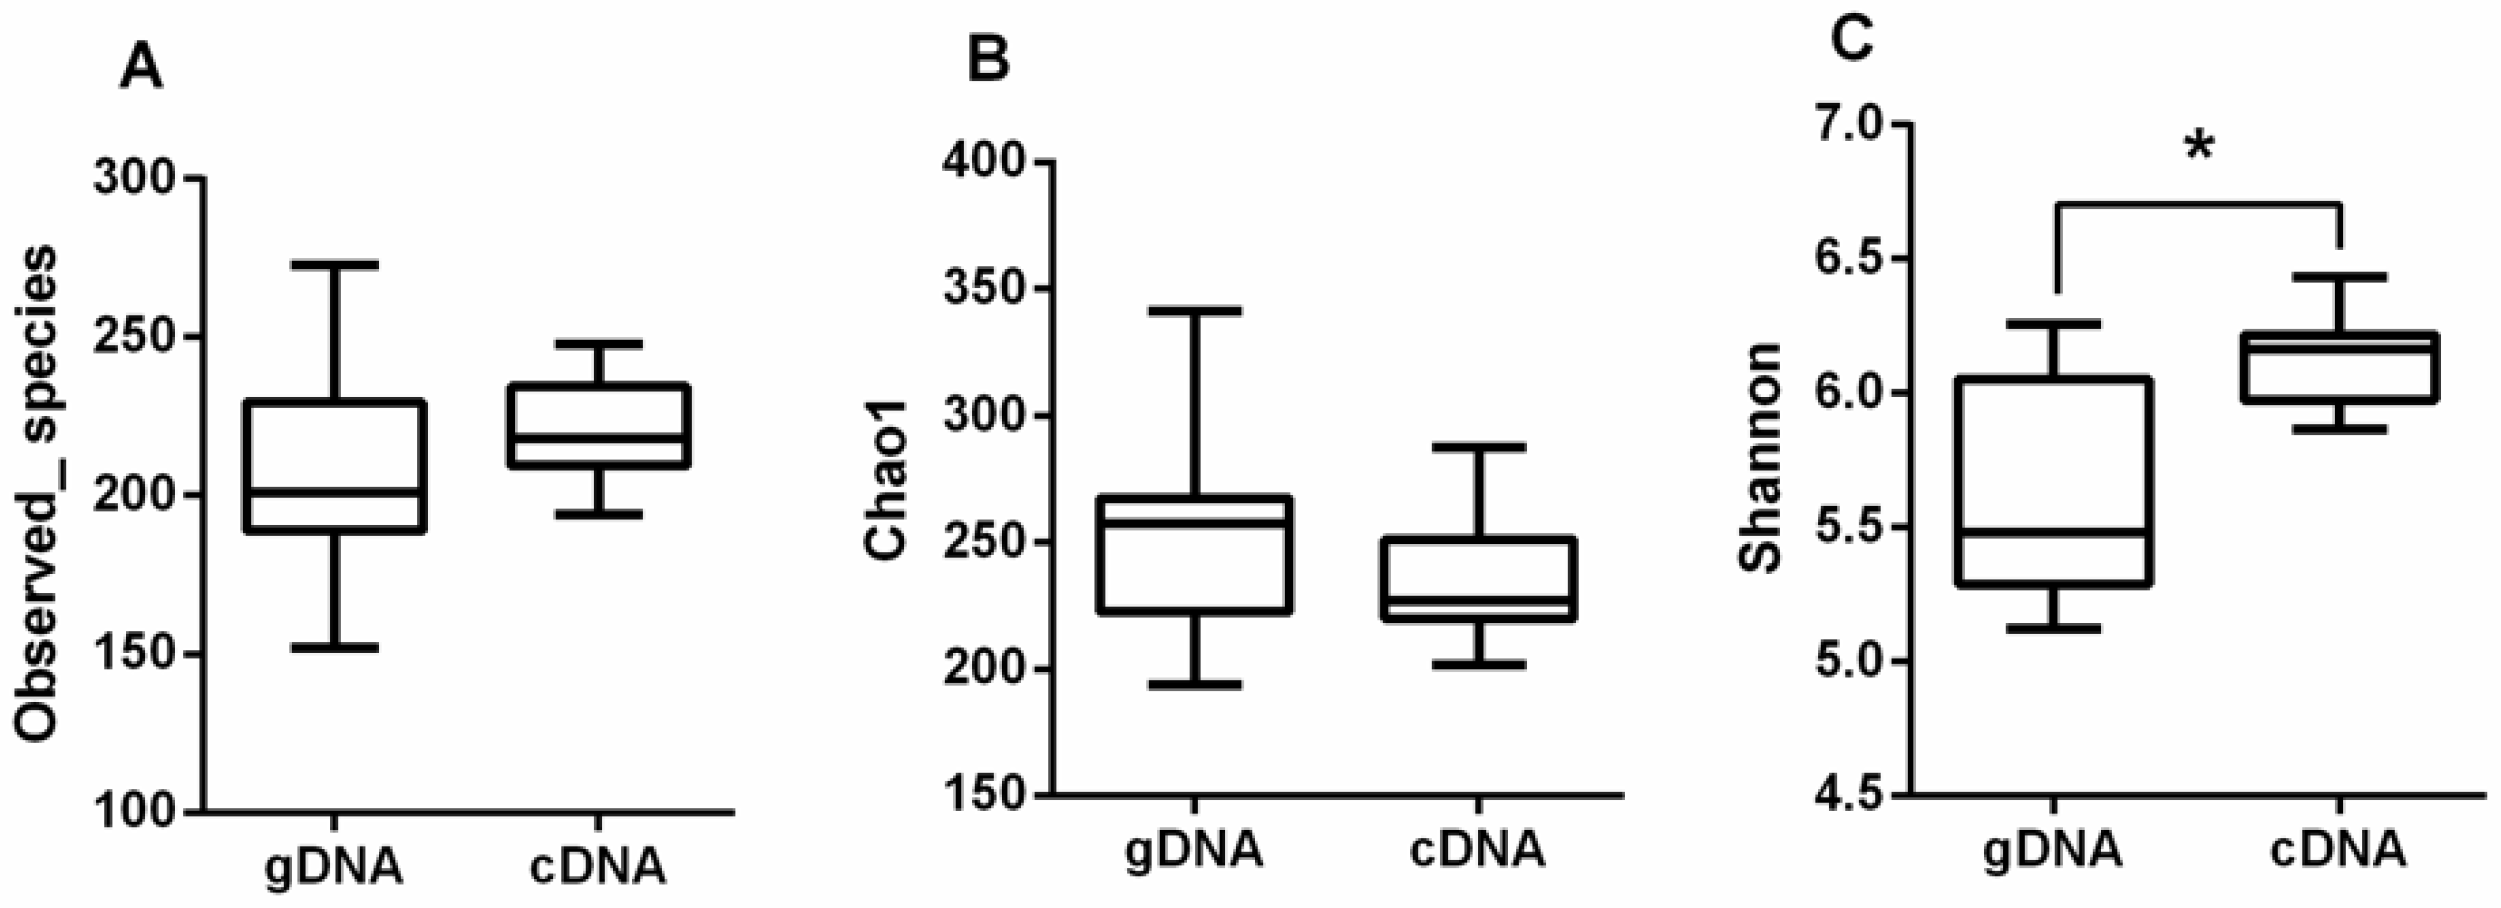
3.1. Alpha Diversity of UreC Genes

In total, 321,612 quality sequence reads were obtained. The average number of reads was 14,619. The total sequences were assigned to 676 OTUs at a sequence similarity cut-off of 97%.
Based on the ureC genes derived from gDNA and cDNA samples from different time points, there were no significant differences in the Observed_species, Chao1, and Shannon diversity indices (Figure S1) (p > 0.05). The results indicated that the sampling time had no significant difference on the alpha diversity of gDNA and cDNA. The cDNA had higher Shannon diversity indices at 0 h, while the Chao1 indices significantly decreased after 2 h and the observed species significantly increased after 6 h (Figure 1) (p < 0.05).
There were no significant differences (p > 0.05) in Observed_species (Figure 2A) and Chao1 (Figure 2B) for the gDNA and cDNA for all the samples from different sampling times. The Shannon index (Figure 2C) of the cDNA was greater than that of the gDNA (p < 0.05). The ureC alpha diversity of the cDNA was significantly higher than that of the gDNA.

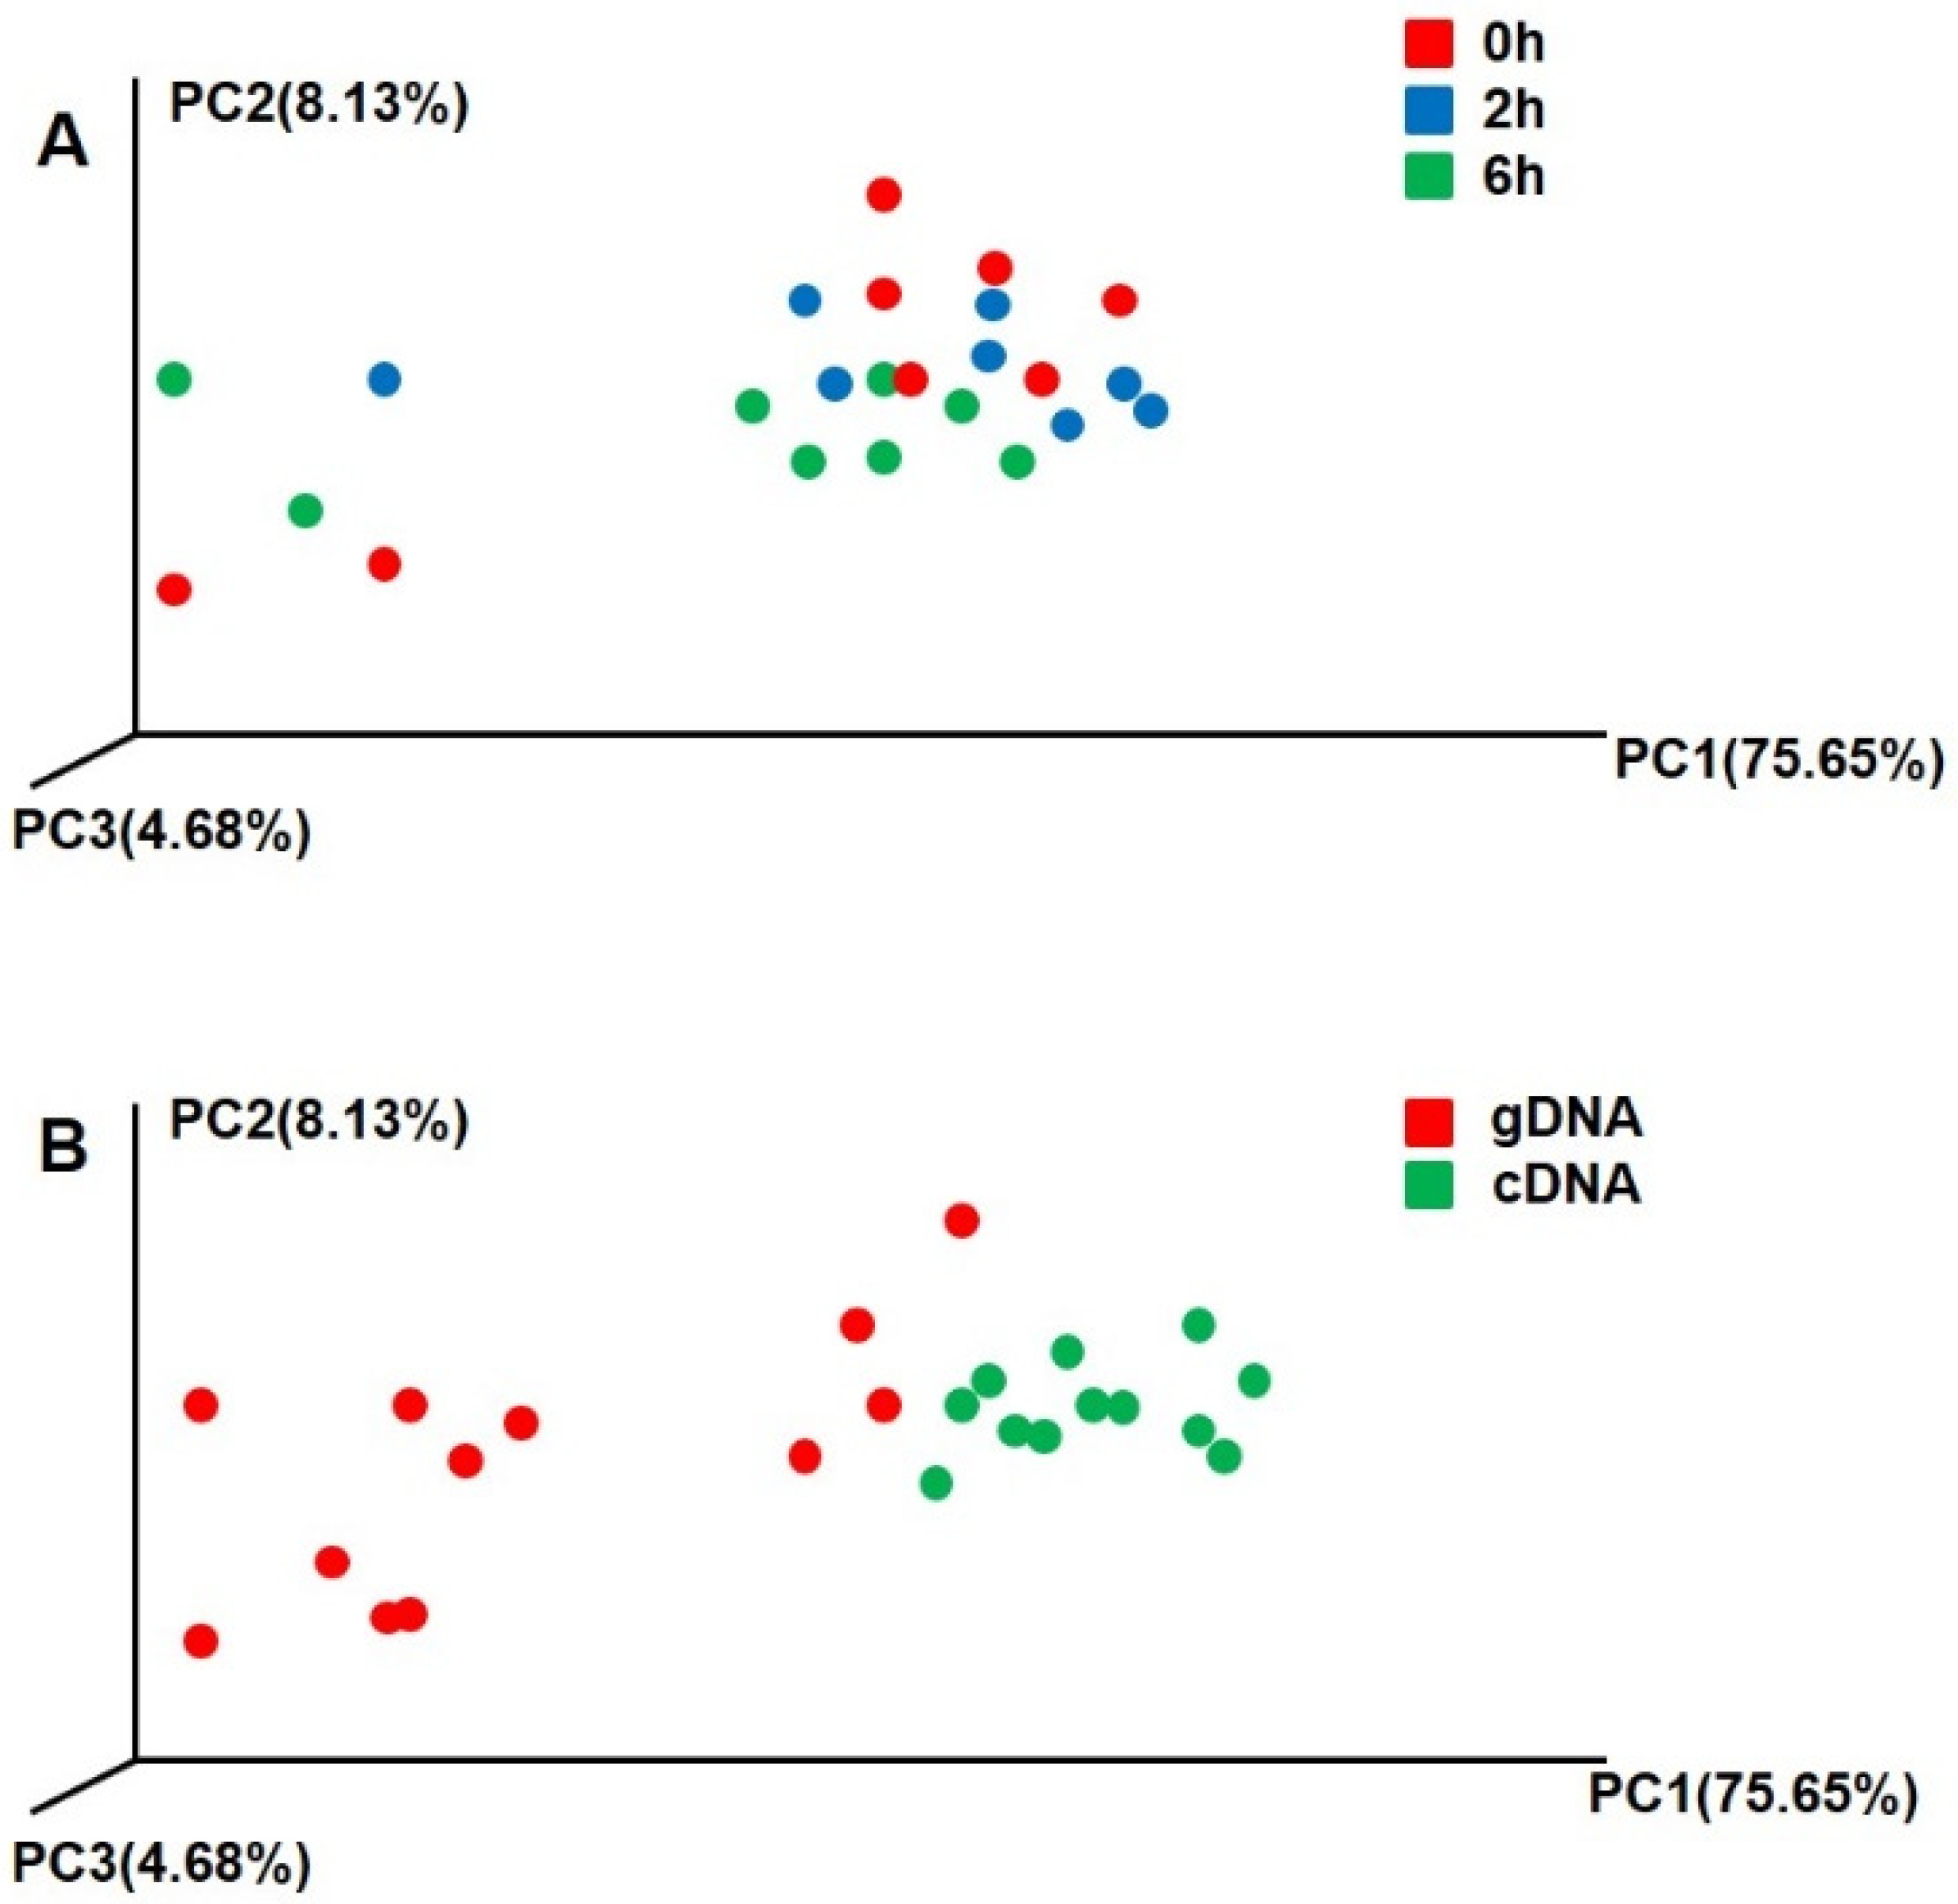
3.2. Beta Diversity of UreC Genes

The sampling time had no significant difference on the beta diversity of gDNA and cDNA (p > 0.05) (Figure 3A). However, there were significant differences in the beta diversities of gDNA and cDNA for all samples at different sampling times (p < 0.01) (Figure 3B). There were also significant differences in the compositions of active and total ureolytic bacteria.

3.3. Composition of Ureolytic Bacteria

Approximately 67% and 69% of the cDNA and gDNA sequences, respectively, could not be confidently classified at the genus level, while the remaining sequences were assigned to Helicobacter (16% and 17%), Herbaspirillum (7% and 9%), Clostridium (2% and 2%), Paenibacillus (1% and 1%), Synechococcus (1% and 1%), and Sphingobacterium (1% and 1%) (Figure 4). Also, there were no significant differences between gDNA and cDNA of the predominant ureolytic bacteria.

3.4. Changes in the Abundances of OTUs of the UreC Genes

Among the top 20 abundant OTUs of ureC genes, 18 (72%) were unclassified ureolytic bacteria at the genus level. The others were mainly distributed in Helicobacter (OTU0, 9, 27), Herbaspirillum (OTU16, 6, 11), and Acinetobacter (OTU29). Among the top 25 OTUs with high abundances of gDNA and cDNA (Figure 5.), there were significant differences in a cluster of OTUs (6, 27, 13, 15, 11, 1750, and 17). Those OTUs with high abundances of gDNA did not necessarily have high abundances of cDNA. Changes to the OTUs revealed that the most abundant ureC genes were similar between gDNA and cDNA, and most differences were observed in diverse ureC genes with low abundances.

4. Discussion

It has been reported that RNA levels are directly related to the synthesis potential and activity of microbial proteins [9,24]. Therefore, the data obtained from cDNA sequencing could potentially be used as an index to taxonomically assess potentially active microbes. Li et al. sequenced targeted RNA and gDNA amplicons to identify and quantify potentially active rumen microbiota, and found significant differences in the taxonomic classifications and community structures [25]. However, sequencing of ureolytic bacteria based on gDNA may be misleading in regard to expressed or active communities. In the present study, quantification of both gDNA and cDNA allowed assessment of the differences in the abundances of major expressed or active and total ureolytic bacteria and the community structure in the rumen.
In support of this view, the Shannon diversity of cDNA was greater than that of gDNA, sampled at 0 h, indicating a high community diversity of active bacteria. This may be due to the fact that some ureolytic bacteria with lower activity showed transcriptional activity under the stimulation of urea after morning feeding. The Chao1 index of gDNA was greater than that of cDNA after the 2 h feeding, indicating that the total community abundance was higher, which may be due to the basal diet providing adequate amounts of ammonia, amino acids, and/or peptides for the synthesis of microbial proteins [26,27]. However, bacteria can first utilize organic forms of nitrogen for the synthesis of microbial proteins [28]. For samples collected at 6 h after feeding, the Observed_species of cDNA was significantly greater than that based on gDNA, indicating that the community richness of active taxa was much greater, possibly because the amount of protein in the diet was insufficient, which resulted in the bacteria using urea nitrogen for protein synthesis.
The beta diversity index of the gDNA was significantly greater than that of the cDNA. In the process of urea decomposition, the abundance of active communities was relatively lower, indicating that the expressed or active ureolytic bacteria communities are more concentrated and specific, as not all ureC genes coded by gDNA are expressed and actually function. The difference between gDNA and cDNA showed that the active ureolytic bacteria communities were not associated with the total community data [29]. cDNA is probably more indicative of active communities than gDNA, and the dissimilarity in the diversity profiles of each emphasizes that the results from gDNA should be interpreted cautiously with respect to inferences about how communities actively respond to dynamic microenvironments.
Bacteria RNA has a short half-life and is very unstable, the cDNA are active at the time of sampling [30], so the effect was assessed at different time points. The results showed that the sampling time point had no significant impact on the alpha and beta diversity indices of gDNA and cDNA, probably because less ureolytic microbes are active then present.
The ureC gene was used for analysis the ureolytic bacteria. The results showed that the ureC gene OTUs were predominately from unclassified taxa. More than 69% and 67% of the ureC sequences of gDNA and cDNA, respectively, were not affiliated with any known ureC genes at the genus level, indicating that the rumen contained ureC genes from unknown sources. Furthermore, most research on urease has been conducted with the use of samples of soils [31,32,33] and ocean water [34,35,36]. Therefore, the reference dataset used for taxonomic assignment of ureolytic bacteria in the rumen need to be updated.
Changes to the top abundant ureolytic bacteria at the genus level were similar between gDNA and cDNA. The highest proportion of classified ureC sequences were from Helicobacter sp. Among the predominant OTUs, OTU0 was dominant in cDNA, which was affiliated with Helicobacter sp. Hence, a previous study by our group [6] investigated the predominant ureolytic bacteria in the rumen based on gDNA, which revealed a high abundance of Helicobacter sp. in the rumen contents. By cloning and sequencing the ureC gene, Zhao et al. [37] detected ureC diversity in the rumen and found that 22% of the sequences were affiliated with Helicobacter sp. Coldham et al. [38] isolated Helicobacter sp. from the gastrointestinal tract of sheep that tested positive for urease activity. These findings are consistent with those of the present study, which indicated that Helicobacter sp. are the major ureolytic bacteria in the rumen, as determined by the high expression and activity levels. The abundance of Herbaspirillum sp. was also relatively high in the rumen, although urease activity was not investigated. Herbaspirillum sp. are rhizobacteria that promote plant growth via the ability on fix nitrogen [39]. Diets of cows contain soybeans and silage, which may contain Herbaspirillum sp. that are transplanted into the rumen. However, further studies are needed to elucidate the mechanism underlying urea usage in the rumen by Herbaspirillum sp. UreC genes affiliated with Clostridium, Paenibacillus and Synechococcus sp. were also identified. Clostridium sp. reportedly have urease activity [40]. A study conducted by Crociani et al. [41] of urease activity in the stomach (fundus and antrum), content, and soft rabbit feces showed that Clostridium sp. also had urease activity. Shi et al. [42] reported that Paenibacillus polymyxa strain NSY50 had the ability to increase urease activity by up to 2.25-fold. Jackie et al. [43] cloned and sequenced Synechococcus sp. strain WH7805 and found that the WH7805 urease had a predicted subunit composition typical of other bacteria ureases, although the organization of the WH7805 urease genes was unique. The results of these studies are consistent with those of the present study, which detected ureC genes of Sphingobacterium sp. However, Pinnaka et al. [44] isolated Sphingobacterium bovisgrunnientis strain YK2T from yak milk that had no urease activity, likely because the produced urease is active only in the rumen.
This is the first study to compare the ureolytic bacteria composition in the rumen between cDNA and gDNA datasets. The results illustrate differences between active (cDNA) and total (gDNA) ureolytic bacteria communities to describe the composition and characteristics of ureolytic bacteria active in the rumen. A single method cannot fully reveal the composition and diversity of ureolytic bacteria in the rumen. So, the accuracy of the data should be carefully considered in future studies. Difference in total (gDNA) and active (cDNA) ureolytic bacteria communities should be taken into account to better understand the structure and dynamics of ureolytic bacteria in the complex rumen ecosystem. Since the rumen harbors a large diversity of unclassified ureolytic bacteria, future studies are warranted to elucidate the mechanisms controlling urease synthesis.

5. Conclusions

In the present study, approximately 69% and 67% of the gDNA and cDNA sequences, respectively, of the ureolytic bacteria community in the rumen of dairy cows could not be confidently classified at the genus level. The sampling time had no significant difference on the alpha and beta diversity indices of gDNA and cDNA. However, the composition of active and total ureolytic bacteria communities were different in the rumen. Moreover, there were no significant differences between gDNA and cDNA profiles of the most abundant ureolytic bacteria, as most differences were observed in ureC genes with the lowest abundance. The results contribute new data to ureolytic bacteria information in the cow rumen.

Supplementary Materials

The following are available online at https://www.mdpi.com/2076-2615/10/11/2162/s1, Figure S1: Alpha diversity of rumen ureolytic bacteria of gDNA and cDNA across different time.

Author Contributions

S.L. and S.Z. conceived the study and conducted the experimental investigation. S.L. and S.Z. interpreted data and wrote the original draft of the manuscript. J.W. and N.Z. provided some materials for this study, reviewed the manuscript and provided valuable suggestions. All authors have read and agreed to the published version of the manuscript.

Funding

This research was funded by the Scientific Research Project for Major Achievements of Agricultural Science and Technology Innovation Program (CAAS-ZDXT2019004), the Agricultural Science and Technology Innovation Program (ASTIP-IAS12), and the Modern Agro-Industry Technology Research System of the PR China (CARS-36). The funding body had no role in designing the study, sample collection, analysis, and interpretation of data or writing the manuscript.

Conflicts of Interest

The authors have no conflict of interest to declare.

References

  1. Kertz, A. Review: Urea Feeding to Dairy Cattle: A Historical Perspective and Review. Prof. Anim. Sci. 2010, 26, 257–272. [Google Scholar] [CrossRef]
  2. Owens, F.N.; Lusby, K.S.; Mizwicki, K.; Forero, O. Slow Ammonia Release from Urea: Rumen and Metabolism Studies. J. Anim. Sci. 1980, 50, 527–531. [Google Scholar] [CrossRef] [PubMed]
  3. Jin, D.; Zhao, S.; Zheng, N.; Bu, D.; Beckers, Y.; Wang, J. Urea nitrogen induces changes in rumen microbial and host metabolic profiles in dairy cows. Livest. Sci. 2018, 210, 104–110. [Google Scholar] [CrossRef]
  4. Di Jin, S.Z.; Nan, Z.; Wang, J. Urea metabolism and regulation by rumen bacterial urease in ruminants—A review. Ann. Anim. Sci. 2017, 18, 303–318. [Google Scholar] [CrossRef] [Green Version]
  5. Alemneh, T. Urea Metabolism and Recycling in Ruminants. Biomed. J. Sci. Tech. Res. 2019, 20, 257–272. [Google Scholar] [CrossRef] [Green Version]
  6. Jin, D.; Zhao, S.; Zheng, N.; Bu, D.; Beckers, Y.; Denman, S.E.; McSweeney, C.S.; Wang, J. Differences in Ureolytic Bacterial Composition between the Rumen Digesta and Rumen Wall Based on ureC Gene Classification. Front. Microbiol. 2017, 8, 385. [Google Scholar] [CrossRef] [Green Version]
  7. De Vrieze, J.; Pinto, A.J.; Sloan, W.T.; Ijaz, U.Z. The active microbial community more accurately reflects the anaerobic digestion process: 16S rRNA (gene) sequencing as a predictive tool. Microbiome 2018, 6, 63. [Google Scholar] [CrossRef]
  8. Villarreal, J.V.; Jungfer, C.; Obst, U.; Schwartz, T. DNase I and Proteinase K eliminate DNA from injured or dead bacteria but not from living bacteria in microbial reference systems and natural drinking water biofilms for subsequent molecular biology analyses. J. Microbiol. Methods 2013, 94, 161–169. [Google Scholar] [CrossRef]
  9. Blazewicz, S.J.; Barnard, R.L.; A Daly, R.; Firestone, M.K. Evaluating rRNA as an indicator of microbial activity in environmental communities: Limitations and uses. ISME J. 2013, 7, 2061–2068. [Google Scholar] [CrossRef] [Green Version]
  10. Miller, L.L.; Ordal, Z.J. Thermal injury and recovery of Bacillus subtilis. Appl. Microbiol. 1972, 24, 878–884. [Google Scholar] [CrossRef] [Green Version]
  11. Rosenthal, L.J.; Iandolo, J.J. Thermally Induced Intracellular Alteration of Ribosomal Ribonucleic Acid. J. Bacteriol. 1970, 103, 833–835. [Google Scholar] [CrossRef] [PubMed] [Green Version]
  12. Qi, M.; Wang, P.; O’Toole, N.; Barboza, P.S.; Ungerfeld, E.M.; Leigh, M.B.; Selinger, L.B.; Butler, G.; Tsang, A.; McAllister, T.A.; et al. Snapshot of the Eukaryotic Gene Expression in Muskoxen Rumen—A Metatranscriptomic Approach. PLoS ONE 2011, 6, e20521. [Google Scholar] [CrossRef] [PubMed] [Green Version]
  13. Lanzén, A.; Jørgensen, S.L.; Bengtsson, M.M.; Jonassen, I.; Øvreås, L.; Urich, T. Exploring the composition and diversity of microbial communities at the Jan Mayen hydrothermal vent field using RNA and DNA. FEMS Microbiol. Ecol. 2011, 77, 577–589. [Google Scholar] [CrossRef] [PubMed] [Green Version]
  14. MaiväLi, Ü.; Paier, A.; Tenson, T. When stable RNA becomes unstable: The degradation of ribosomes in bacteria and beyond. Biol. Chem. 2013, 394, 845–855. [Google Scholar] [CrossRef] [PubMed]
  15. Klein, A.M.; Bohannan, B.J.M.; Jaffe, D.A.; Levin, D.A.; Green, J.L. Molecular Evidence for Metabolically Active Bacteria in the Atmosphere. Front. Microbiol. 2016, 7, 772. [Google Scholar] [CrossRef]
  16. Hugoni, M.; Agogué, H.; Taib, N.; Domaizon, I.; Moné, A.; Galand, P.E.; Mary, I. Temporal Dynamics of Active Prokaryotic Nitrifiers and Archaeal Communities from River to Sea. Microb. Ecol. 2015, 70, 473–483. [Google Scholar] [CrossRef]
  17. Minas, K.; McEwan, N.R.; Newbold, C.J.; Scott, K.P. Optimization of a high-throughput CTAB-based protocol for the extraction of qPCR-grade DNA from rumen fluid, plant and bacterial pure cultures. FEMS Microbiol. Lett. 2011, 325, 162–169. [Google Scholar] [CrossRef] [Green Version]
  18. Bolger, A.M.; Lohse, M.; Usadel, B. Trimmomatic: A flexible trimmer for Illumina sequence data. Bioinformatics 2014, 30, 2114–2120. [Google Scholar] [CrossRef] [Green Version]
  19. Magoč, T.; Salzberg, S.L. FLASH: Fast length adjustment of short reads to improve genome assemblies. Bioinformatics 2011, 27, 2957–2963. [Google Scholar] [CrossRef]
  20. Caporaso, J.G.; Kuczynski, J.; Stombaugh, J.; Bittinger, K.; Bushman, F.D.; Costello, E.K.; Fierer, N.; Peña, A.G.; Goodrich, J.K.; Gordon, J.I.; et al. QIIME allows analysis of high-throughput community sequencing data. Nat. Methods 2010, 7, 335–336. [Google Scholar] [CrossRef] [Green Version]
  21. Bokulich, N.A.; Subramanian, S.; Faith, J.J.; Gevers, D.; Gordon, J.I.; Knight, R.T.; Mills, D.A.; Caporaso, J.G. Quality-filtering vastly improves diversity estimates from Illumina amplicon sequencing. Nat. Methods 2013, 10, 57–59. [Google Scholar] [CrossRef] [PubMed]
  22. Edgar, R.C.; Haas, B.J.; Clemente, J.C.; Quince, C.; Knight, R. UCHIME improves sensitivity and speed of chimera detection. Bioinformatics 2011, 27, 2194–2200. [Google Scholar] [CrossRef] [PubMed] [Green Version]
  23. Edgar, R.C. Search and clustering orders of magnitude faster than BLAST. Bioinformatics 2010, 26, 2460–2461. [Google Scholar] [CrossRef] [PubMed] [Green Version]
  24. Dennis, P.P.; Bremer, H. Modulation of Chemical Composition and Other Parameters of the Cell at Different Exponential Growth Rates. Ecosal. Plus. 2008, 3. [Google Scholar] [CrossRef]
  25. Li, F.; Henderson, G.; Sun, X.; Cox, F.; Janssen, P.H.; Guan le, L. Taxonomic Assessment of Rumen Microbiota Using Total RNA and Targeted Amplicon Sequencing Approaches. Front. Microbiol. 2016, 7, 987. [Google Scholar] [CrossRef]
  26. Agle, M.; Hristov, A.N.; Zaman, S.; Schneider, C.; Ndegwa, P.; Vaddella, V.K. The effects of ruminally degraded protein on rumen fermentation and ammonia losses from manure in dairy cows. J. Dairy Sci. 2010, 93, 1625–1637. [Google Scholar] [CrossRef]
  27. Recktenwald, E.B.; Ross, D.A.; Fessenden, S.W.; Wall, C.J.; Amburgh, M.E.V. Urea-N recycling in lactating dairy cows fed diets with 2 different levels of dietary crude protein and starch with or without monensin. J. Dairy Sci. 2014, 97, 1611–1622. [Google Scholar] [CrossRef] [Green Version]
  28. Hristov, A.N.; Pfeffer, E. Nitrogen and phosphorus nutrition of cattle. Anim. Feed Sci. Technol. 2005, 128, 342–343. [Google Scholar]
  29. Salazar, G.; Paoli, L.; Alberti, A.; Huerta-Cepas, J.; Ruscheweyh, H.-J.; Cuenca, M.; Field, C.M.; Coelho, L.P.; Cruaud, C.; Engelen, S.; et al. Gene Expression Changes and Community Turnover Differentially Shape the Global Ocean Metatranscriptome. Cell 2019, 179, 1068–1083. [Google Scholar] [CrossRef] [Green Version]
  30. Gill, A.S.; Lee, A.; McGuire, K.L. Phylogenetic and Functional Diversity of Total (DNA) and Expressed (RNA) Bacterial Communities in Urban Green Infrastructure Bioswale Soils. Appl. Environ. Microbiol. 2017, 83, e00287-17. [Google Scholar] [CrossRef] [Green Version]
  31. Cordero, I.; Snell, H.; Bardgett, R.D. High throughput method for measuring urease activity in soil. Soil Biol. Biochem. 2019, 134, 72–77. [Google Scholar] [CrossRef] [PubMed]
  32. Ashok, A.; Doriya, K.; Rao, J.V.; Qureshi, A.; Tiwari, A.K.; Kumar, D.S. Microbes Producing L-Asparaginase free of Glutaminase and Urease isolated from Extreme Locations of Antarctic Soil and Moss. Sci. Rep. 2019, 9, 1423. [Google Scholar] [CrossRef] [PubMed] [Green Version]
  33. Burbank, M.B.; Weaver, T.J.; Williams, B.C.; Crawford, R.L. Urease Activity of Ureolytic Bacteria Isolated from Six Soils in which Calcite was Precipitated by Indigenous Bacteria. Geomicrobiol. J. 2012, 29, 389–395. [Google Scholar] [CrossRef]
  34. Alonso-Sáez, L.; Waller, A.S.; Mende, D.R.; Bakker, K.; Farnelid, H.; Yager, P.L.; Lovejoy, C.; Tremblay, J.É.; Potvin, M.; Heinrich, F.; et al. Role for urea in nitrification by polar marine Archaea. Proc. Natl. Acad. Sci. USA 2012, 109, 17989–17994. [Google Scholar] [CrossRef] [PubMed] [Green Version]
  35. Collier, J.L.; Baker, K.M.; Bell, S.L. Diversity of urea-degrading microorganisms in open-ocean and estuarine planktonic communities. Environ. Microbiol. 2009, 11, 3118–3131. [Google Scholar] [CrossRef]
  36. Su, J.; Jin, L.; Jiang, Q.; Sun, W.; Zhang, F.; Li, Z. Phylogenetically Diverse ureC Genes and Their Expression Suggest the Urea Utilization by Bacterial Symbionts in Marine Sponge Xestospongia testudinaria. PLoS ONE 2013, 8, e64848. [Google Scholar] [CrossRef] [PubMed] [Green Version]
  37. Zhao, S.; Wang, J.; Zheng, N.; Bu, D.; Sun, P.; Yu, Z. Reducing microbial ureolytic activity in the rumen by immunization against urease therein. BMC Veter. Res. 2015, 11, 1–9. [Google Scholar] [CrossRef] [Green Version]
  38. Coldham, T.; Rose, K.; O’Rourke, J.; Neilan, B.A.; Dalton, H.; Lee, A. Detection, Isolation, and Characterization of Helicobacter Species from the Gastrointestinal Tract of the Brushtail Possum. Appl. Environ. Microbiol. 2011, 77, 1581–1587. [Google Scholar] [CrossRef] [Green Version]
  39. Marques, A.C.Q.; Paludo, K.S.; Dallagassa, C.B.; Surek, M.; Pedrosa, F.O.; Souza, E.M.; Cruz, L.M.; Lipuma, J.J.; Zanata, S.M.; Rego, F.G.M.; et al. Biochemical Characteristics, Adhesion, and Cytotoxicity of Environmental and Clinical Isolates of Herbaspirillum spp. J. Clin. Microbiol. 2014, 53, 302–308. [Google Scholar] [CrossRef] [Green Version]
  40. Novotný, P. Composition of Cell Walls of Clostridium Sordellii and Clostridium BiferMentans and Its Relation to Taxonomy. J. Med. Microbiol. 1969, 2, 81–100. [Google Scholar] [CrossRef]
  41. Crociani, F.; Matteuzzi, D.; Minardi, A.; Brigidi, P.; Gioffre, F. Urease activity in gastrointestinal tract of rabbit and electrophoretic behaviour of urease. Ann. Institut. Pasteur. Microbiol. 1986, 137, 287–294. [Google Scholar] [CrossRef]
  42. Shi, L.; Du, N.; Shu, S.; Sun, J.; Li, S.; Guo, S. Paenibacillus polymyxa NSY50 suppresses Fusarium wilt in cucumbers by regulating the rhizospheric microbial community. Sci. Rep. 2017, 7, srep41234. [Google Scholar] [CrossRef] [PubMed] [Green Version]
  43. Collier, J.L.; Brahamsha, B.; Palenik, B. The marine cyanobacterium Synechococcus sp. WH7805 requires urease (urea amiohydrolase, EC 3.5.1.5) to utilize urea as a nitrogen source: Molecular-genetic and biochemical analysis of the enzyme. Microbiology 1999, 145, 447–459. [Google Scholar] [CrossRef] [PubMed] [Green Version]
  44. Kaur, M.; Singh, H.; Sharma, S.; Mishra, S.; Tanuku, N.R.S.; Pinnaka, A.K. Sphingobacterium bovisgrunnientis sp. nov., isolated from yak milk. Int. J. Syst. Evol. Microbiol. 2018, 68, 636. [Google Scholar] [CrossRef] [PubMed]
Figure 1. Alpha diversity of rumen ureolytic bacteria across gDNA and cDNA at different time. (A) Total observed species, (B) Chao1, and (C) Shannon index on at 0 h. (D) Total observed species, (E) Chao1, and (F) Shannon index on at 2 h. (G) Total observed species (H) Chao1 and, (I) Shannon index at 6 h. Boxplots indicate the first and third quartiles with the median value indicated as a horizontal line the whickers extend to 1.5 times the inter quartile range. * p < 0.05.
Animals 10 02162 g001
Figure 2. Alpha diversity of rumen ureolytic bacteria of gDNA and cDNA. (A) Total observed species, (B) Chao1, and (C) Shannon index. Boxplots indicate the first and third quartiles with the median value indicated as a horizontal line the whickers extend to 1.5 times the inter quartile range. * p < 0.05.
Animals 10 02162 g002
Figure 3. Beta diversity of rumen ureolytic bacteria of gDNA and cDNA. (A) Different sampling time, red dot represent 0 h, blue dot represent 2 h, green dot represent 6 h. (B) Ureolytic bacteria of gDNA and cDNA, red represent gDNA; green represent cDNA. Principle coordinate analysis (PCA) comparing changes in ureolytic bacteria based on weighted Unifrac distances.
Animals 10 02162 g003
Figure 4. Taxonomy of the ureolytic bacteria components of gDNA and cDNA. The top 7 genera based on relative abundance are presented, the remaining genera grouped as “others”.
Animals 10 02162 g004
Figure 5. The relative abundance of top 20 ureC gene operational taxonomic units. In brackets represent bacteria genus. * p < 0.05.
Animals 10 02162 g005
Publisher’s Note: MDPI stays neutral with regard to jurisdictional claims in published maps and institutional affiliations.

