Infrared Thermography Correlates with Lactate Concentration in Blood during Race Training in Horses


Simple Summary
Abstract
1. Introduction
2. Materials and Methods
2.1. Animals
2.2. Blood Sampling
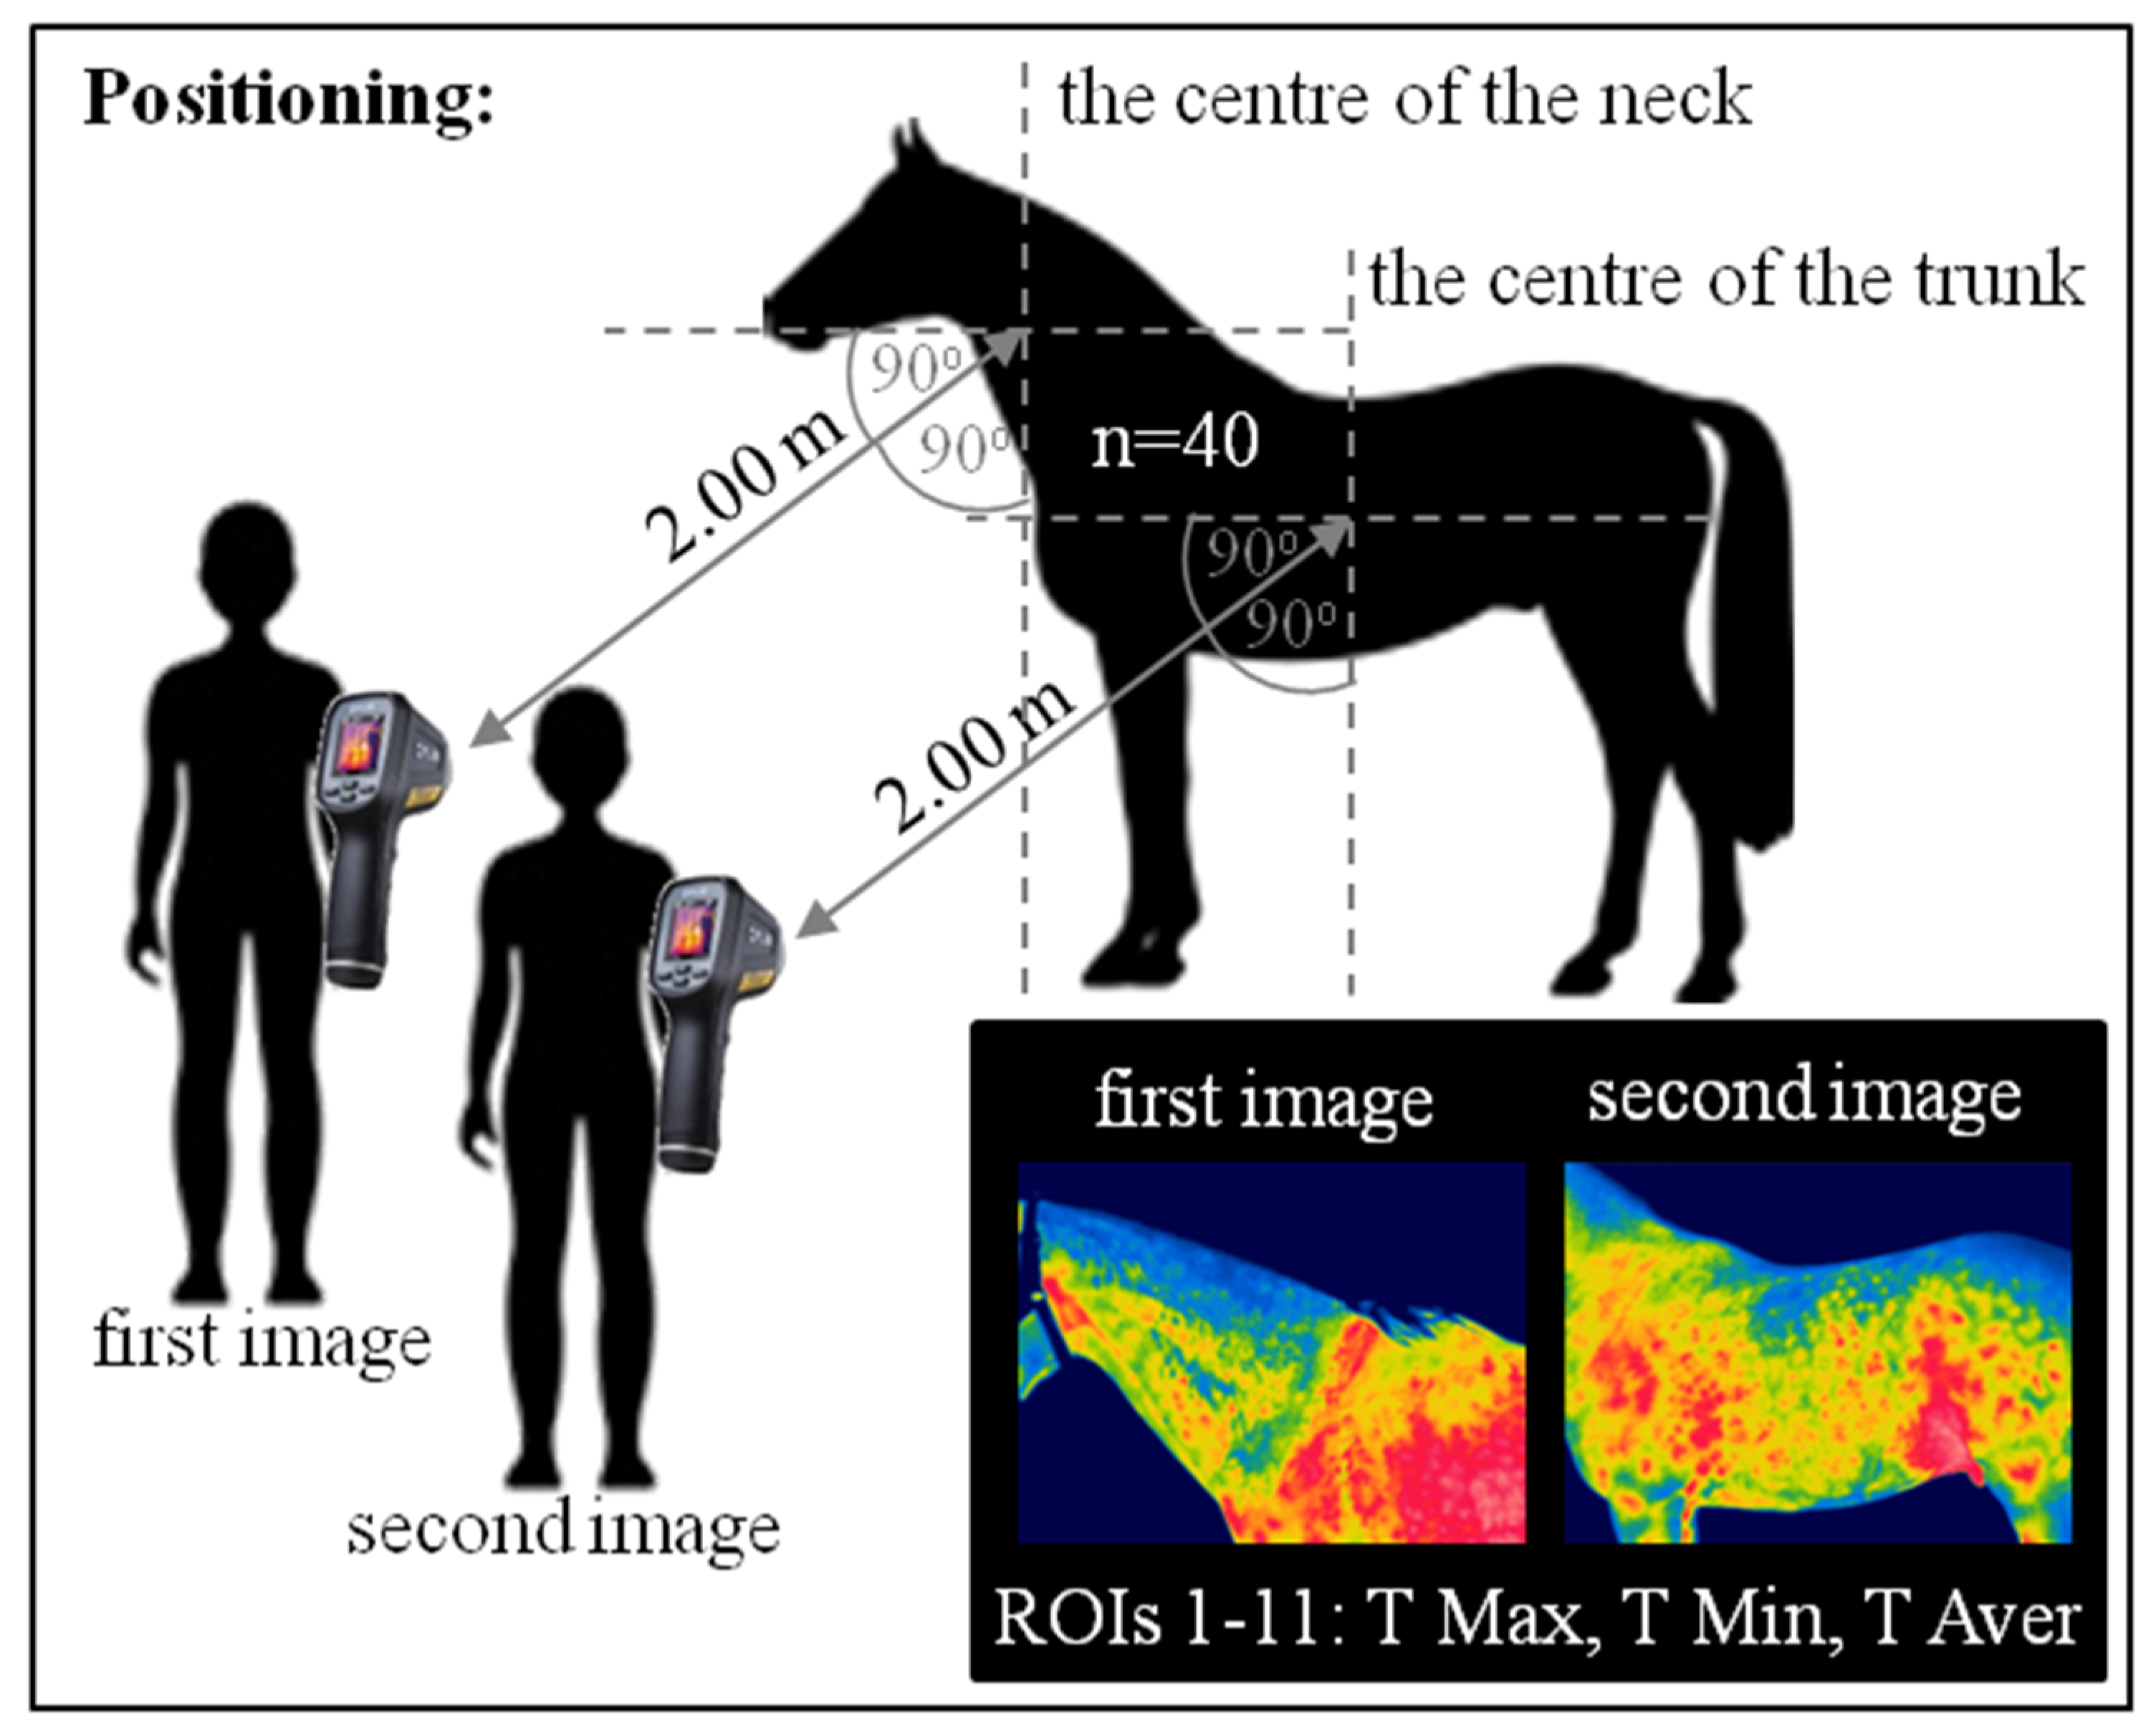
2.3. Thermography
2.4. Data Analysis
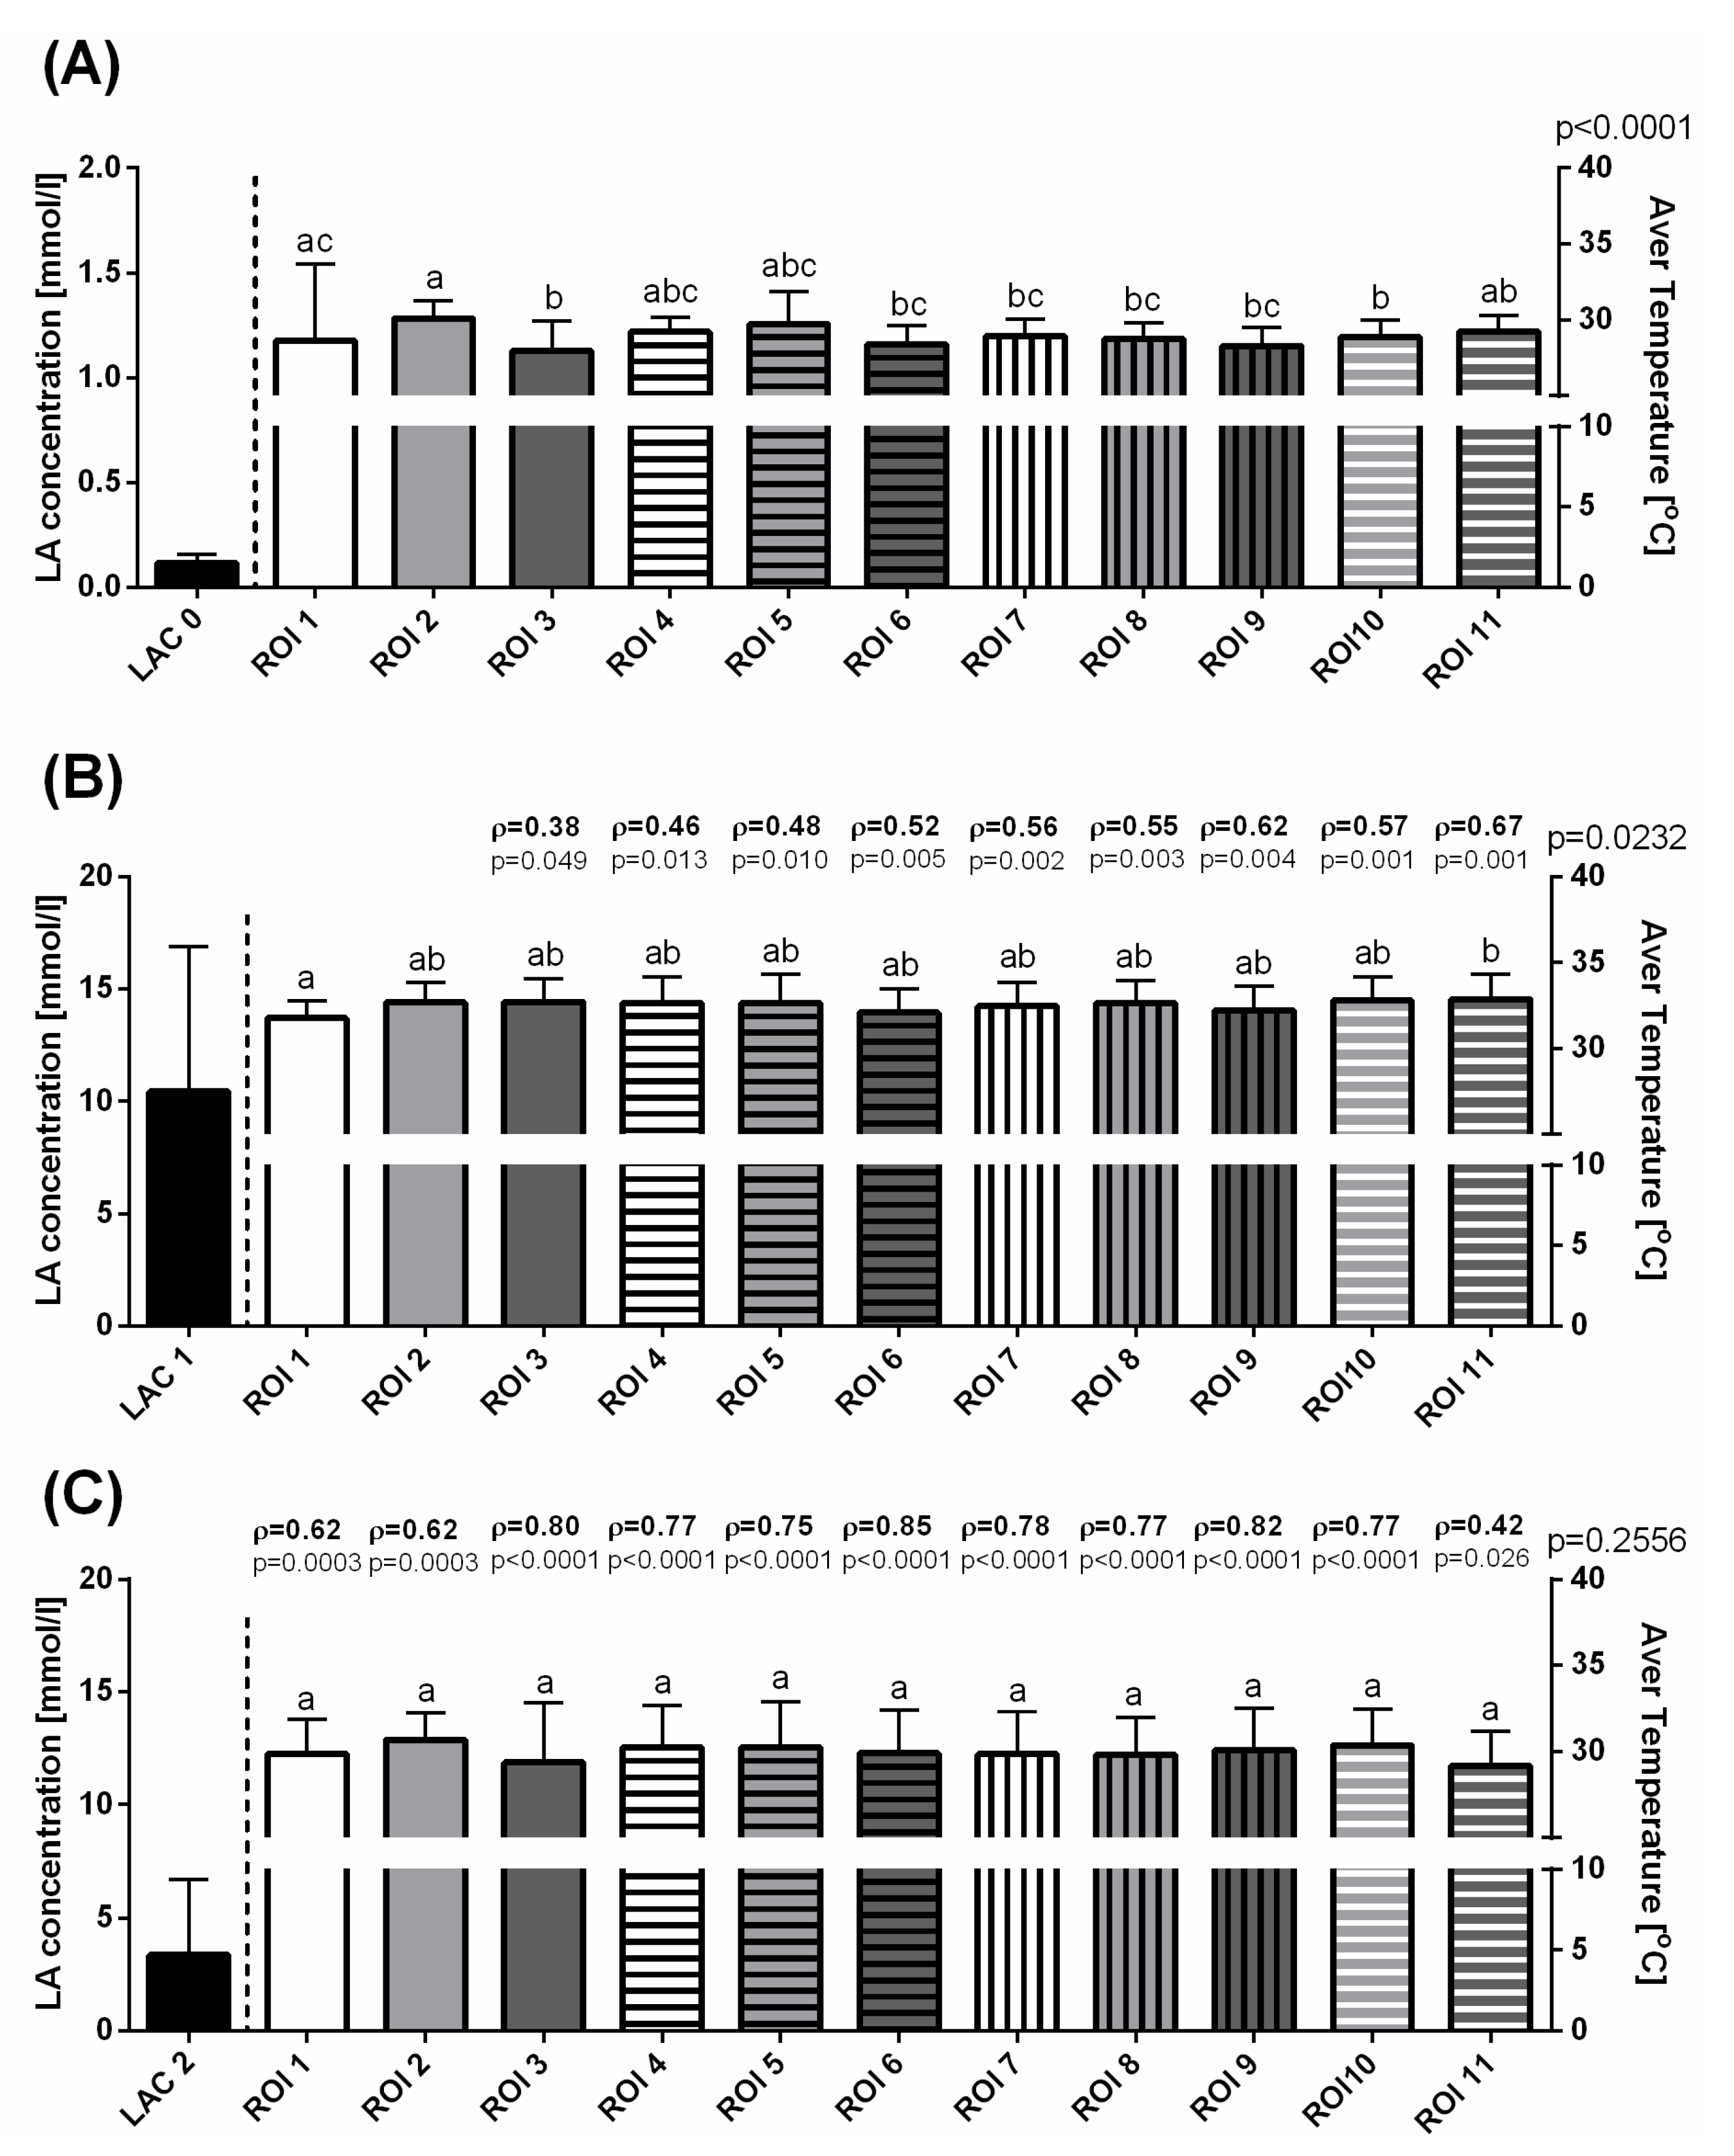
3. Results
4. Discussion
5. Conclusions
Author Contributions
Funding
Conflicts of Interest
References
- Bolwell, C.F.; Rogers, C.W.; French, N.P.; Firth, E.C. The effect of interruptions during training on the time to the first trial and race start in thoroughbred racehorses. Prev. Vet. Med. 2013, 108, 188–198. [Google Scholar] [CrossRef]
- Sloet van Oldruitenborgh-Oosterbaan, M.; Clayton, H. Advantages and disadvantages of track vs. Treadmill tests. Equine Vet. J. 1999, 30, 645–647. [Google Scholar] [CrossRef] [PubMed]
- McGowan, C. Clinical pathology in the racing horse: The role of clinical pathology in assessing fitness and performance in the racehorse. Vet. Clin. N. Am. Equine Pract. 2008, 24, 405-vii. [Google Scholar] [CrossRef] [PubMed]
- Allen, K.; van Erck-Westergren, E.; Franklin, S. Exercise testing in the equine athlete. Equine Vet. Educ. 2016, 28, 89–98. [Google Scholar] [CrossRef]
- Davie, A.L.; Evans, D.J. Blood lactate responses to submaximal field exercise tests in thoroughbred horses. Vet. J. 2000, 159, 252–258. [Google Scholar] [CrossRef] [PubMed]
- Couroucé, A.; Geffroy, O.; Barrey, E.; Auvinet, B.; Rose, R.J. Comparison of exercise tests in French trotters under training track, racetrack and treadmill conditions. Equine Vet. J. Suppl. 1999, 30, 528–532. [Google Scholar] [CrossRef]
- Beneke, R.; Leithäuser, R.M.; Ochentel, O. Blood lactate diagnostics in exercise testing and training. Int. J. Sports Physiol. Perform. 2011, 6, 8–24. [Google Scholar] [CrossRef]
- Lehnhard, R.A.; Bartlett, M.; Roche, B.M.; Hinchcliff, K.W.; McKeever, K.H. Variations in lactate during a graded exercise test due to sampling location and method. Comp. Exerc. Physiol. 2010, 7, 81–87. [Google Scholar] [CrossRef]
- Green, S.; Dawson, B. Measurement of anaerobic capacities in humans. Definitions, limitations and unsolved problems. Sports Med. 1993, 15, 312–327. [Google Scholar] [CrossRef]
- Marlin, D.; Nankervis, K. Equine Exercise Physiology, 1st ed.; Blackwell Scientific Publications: Oxford, UK, 2013; pp. 94–96, 233–234. [Google Scholar]
- Henderson, S.F. Diagnostic and prognostic use of L-lactate measurement in equine practice. Equine Vet. Educ. 2013, 25, 468–475. [Google Scholar] [CrossRef]
- Gladden, L.B. Lactate metabolism: A new paradigm for the third millennium. J. Physiol. 2004, 558, 5–30. [Google Scholar] [CrossRef] [PubMed]
- Nalbandian, M.; Takeda, M. Lactate as a Signaling Molecule That Regulates Exercise-Induced Adaptations. Biology 2016, 5, 38. [Google Scholar] [CrossRef] [PubMed]
- Harris, P.; Snow, D.H. Plasma potassium and lactate concentrations in thoroughbred horses during exercise of varying intensity. Equine Vet. J. 1992, 24, 220–225. [Google Scholar] [CrossRef]
- Menzies, P.; Menzies, C.; McIntyre, L.; Paterson, P.; Wilson, J.; Kemi, O.J. Blood lactate clearance during active recovery after an intense running bout depends on the intensity of the active recovery. J. Sports Sci. 2010, 28, 975–982. [Google Scholar] [CrossRef]
- Soroko, M.; Howell, K.; Dudek, K.; Wilk, I.; Zastrzeżyńska, M.; Janczarek, I. A pilot study into the utility of dynamic infrared thermography for measuring body surface temperature changes during treadmill exercise in horses. J. Equine Vet. Sci. 2018, 62, 44–46. [Google Scholar] [CrossRef]
- Eddy, A.L.; Van Hoogmoed, L.M.; Snyder, J.R. The role of thermography in the management of equine lameness. Vet. J. 2001, 162, 172–181. [Google Scholar] [CrossRef]
- Redaelli, V.; Luzi, F.; Mazzola, S.; Bariffi, G.D.; Zappaterra, M.; Nanni Costa, L.; Padalino, B. The Use of Infrared Thermography (IRT) as Stress Indicator in Horses Trained for Endurance: A Pilot Study. Animals 2019, 9, 84. [Google Scholar] [CrossRef]
- Jodkowska, E. Body surface temperature as a criterion of the horse predisposition to effort. Sci. Pap. Agric. Univ. Wroc. 2005, 511, 7–114. [Google Scholar]
- Van Hoogmoed, L.; Snyder, J.; Allen, A.; Waldsmith, J. Use of infrared thermography to detect performance enhancing techniques in horses. Equine Vet. Educ. 2000, 12, 102–107. [Google Scholar] [CrossRef]
- Soroko, M.; Śpitalniak-Bajerska, K.; Zaborski, D.; Poźniak, B.; Dudek, K.; Janczarek, I. Exercise-induced changes in skin temperature and blood parameters in horses. Arch. Anim. Breed 2019, 62, 205–213. [Google Scholar] [CrossRef]
- Refinetti, R.; Piccione, G. Intra- and inter-individual variability in the circadian rhythm of body temperature of rats, squirrels, dogs, and horses. J. Therm. Biol. 2005, 30, 139–146. [Google Scholar] [CrossRef]
- Piccione, G.; Caola, G.; Refinetti, R. The Circadian Rhythm of Body Temperature of the Horse. Biol. Rhythm. Res. 2002, 33, 113–119. [Google Scholar] [CrossRef]
- Purohit, R. Standards for thermal imaging in veterinary medicine. 11th European Congress of Thermology. Thermol. Int. 2009, 19, 99. [Google Scholar]
- Satchell, G.; McGrath, M.; Dixon, J.; Pfau, T.; Weller, R. Effects of Time of Day, Ambient Temperature and Relative Humidity on the Repeatability of Infrared Thermographic Imaging in Horses, Abstracts. Equine Vet. J. 2015, 47, 13–14. [Google Scholar] [CrossRef] [PubMed]
- Hodgson, D.R.; Davis, R.E.; McConaghy, F.F. Thermoregulation in the horse in response to exercise. Br. Vet. J. 1994, 150, 219–235. [Google Scholar] [CrossRef]
- Ding, H.; Wang, G.; Lei, W.; Wang, R.; Huang, L.; Xia, Q.; Wu, J. Non-invasive quantitative assessment of oxidative metabolism in quadriceps muscles by near infrared spectroscopy. Br. J. Sports Med. 2001, 35, 441–444. [Google Scholar] [CrossRef]
- Chudecka, M.; Lubkowska, A. The use of thermal imaging to evaluate body temperature changes of athletes during training and a study on the impact of physiological and morphological factors on skin temperature. Hum. Mov. 2012, 13, 33–39. [Google Scholar] [CrossRef]
- Soroko, M.; Henklewski, R.; Filipowski, H.; Jodkowska, E. The effectiveness of thermographic analysis in equine orthopaedics. J. Equine Vet. Sci. 2013, 33, 760–762. [Google Scholar] [CrossRef]
- Prochno, H.C.; Barussi, F.M.; Bastos, F.Z.; Weber, S.H.; Bechara, G.H.; Rehan, I.F.; Michelotto, P.V. Infrared Thermography Applied to Monitoring Musculoskeletal Adaptation to Training in Thoroughbred Race Horses. J. Equine Vet. Sci. 2020, 87, 102935. [Google Scholar] [CrossRef] [PubMed]
- Soroko, M.; Zaborski, D.; Dudek, K.; Yarnell, K.; Górniak, W.; Vardasca, R. Evaluation of thermal pattern distributions in racehorse saddles using infrared thermography. PLoS ONE 2019, 14, e0221622. [Google Scholar] [CrossRef]
- Masko, M.; Krajewska, A.; Zdrojkowski, L.; Domino, M.; Gajewski, Z. An application of temperature mapping of horse’s back for leisure horse-rider-matching. Anim. Sci. J. 2019, 90, 1396–1406. [Google Scholar] [CrossRef]
- Miglio, A.; Cappelli, K.; Capomaccio, S.; Mecocci, S.; Silvestrelli, M.; Antognoni, M.T. Metabolic and Biomolecular Changes Induced by Incremental Long-Term Training in Young Thoroughbred Racehorses during First Workout Season. Animals 2020, 10, 317. [Google Scholar] [CrossRef]
- Jones, J.H.; Ohmura, H.; Stanley, S.D.; Hiraga, A. Energetic cost of locomotion on different equine treadmills. Equine Vet. J. 2006, 36, 365–369. [Google Scholar] [CrossRef]
- Pilliner, S.; Elmhurst, S.; Davies, Z. The Horse in Motion, 1st ed.; Blackwell Scientific Publications: Oxford, UK, 2009; pp. 29–32. [Google Scholar]
- Payne, R.C.; Veenman, P.; Wilson, A.M. The role of the extrinsic thoracic limb muscles in equine locomotion. J. Anat. 2004, 205, 479–490. [Google Scholar] [CrossRef]
- Kawai, M.; Minami, Y.; Sayama, Y.; Kuwano, A.; Hiraga, A.; Miyata, H. Muscle fiber population and biochemical properties of whole body muscles in Thoroughbred horses. Anat. Rec. 2009, 292, 1663–1669. [Google Scholar] [CrossRef]
- Korzeniewski, B. Regulation of oxidative phosphorylation in different muscles and various experimental conditions. Biochem. J. 2003, 375, 799–804, PMCID: PMC1223721. [Google Scholar] [CrossRef] [PubMed]
- Boguszewski, D.; Adamczyk, J.G.; Urbańska, N.; Mrozek, N.; Piejko, K.; Janicka, M.; Białoszewski, D. Using thermal imaging to assess the effect of classical massage on selected physiological parameters of upper limbs. Biomed. Hum. Kinet. 2014, 6, 146–150. [Google Scholar] [CrossRef]
- Charkoudian, N. Mechanisms and modifiers of reflex induced cutaneous vasodilation and vasoconstriction in humans. J. Appl. Physiol. 1985, 109, 1221–1228. [Google Scholar] [CrossRef] [PubMed]
- Tunley, B.V.; Henson, F.M. Reliability and repeatability of thermographic examination and the normal thermographic image of the thoracolumbar region in the horse. Equine Vet. J. 2004, 36, 306–312. [Google Scholar] [CrossRef]
- Schulman, M.L.; Nurton, J.P.; Guthrie, A.J. Use of the Accusport semi-automated analyser to determine blood lactate as an aid in the clinical assessment of horses with colic. J. S. Afr. Vet. Assoc. 2001, 72, 12–17. [Google Scholar] [CrossRef]
- Evans, D.L.; Harris, R.C.; Snow, D.H. Correlation of racing performance with blood lactate and heart rate after exercise in thoroughbred horses. Equine Vet. J. 1993, 25, 441–445. [Google Scholar] [CrossRef]


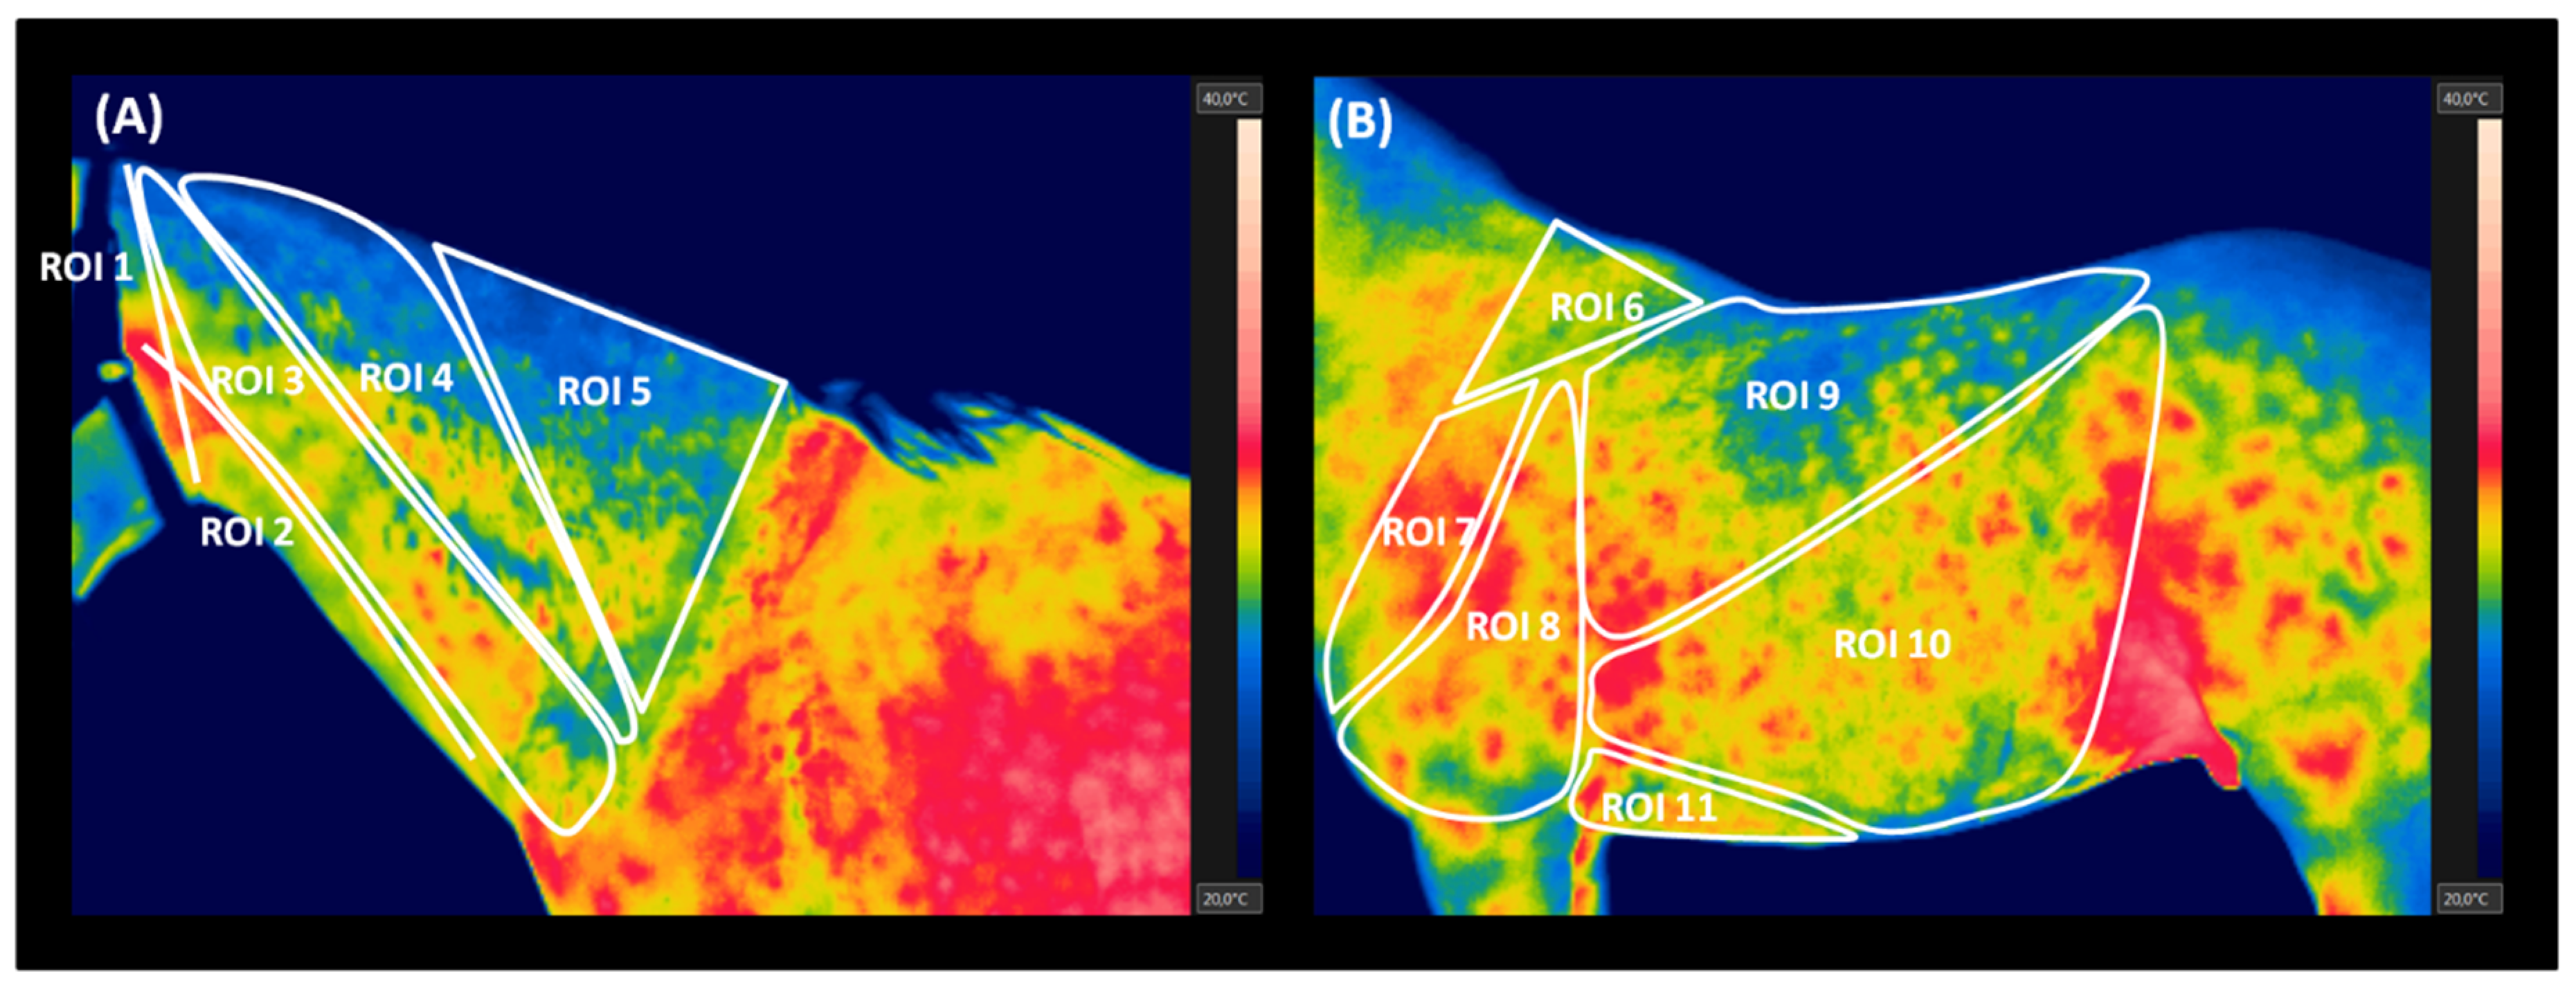
| No. | Areas with Impact of Superficial Tissues | Range of ROI |
|---|---|---|
| ROI 1 | Arteries in the Viborg’s triangle | A line from the lateral surface of the atlas to the ventral part of the angle of mandible |
| ROI 2 | vena jugular externa | A line along the sulcus jugularis |
| ROI 3 | M. brachiocephalicus | A parallelogram-shaped area from the lateral surface of the atlas, behind the angle of the mandible, to the regio supraspinata of the scapula |
| ROI 4 | Mm. splenius capitis and cervicis | A triangle-shaped area from the lateral surface of the axis to the regio supraspinata of the scapula above ROI 3 |
| ROI 5 | M. trapezius pars cervicalis | A triangle ranging from the middle of the neck to the regio cartilaginis of the scapula and along the regio supraspinata of the scapula, up to two-thirds of the length |
| ROI 6 | M. trapezius pars thoracica | A triangle ranging from the the regio cartilaginis of the scapula along the regio supraspinata of the scapula, up to one-third of the length |
| ROI 7 | M. deltoideus | An irregular area in the projection of the regio supraspinata of the scapula |
| ROI 8 | M. pectoralis descendens | An irregular area in the projection of the regio infraspinata of the scapula |
| ROI 9 | M. latissimus dorsi | A triangle-shaped area from the regio infraspinata of the scapula, up to two-thirds of the length, along the back to the tuber coxae |
| ROI 10 | M. obliquus externus abdominis | A trapezoid-shaped area from the lower two-thirds of the regio infraspinata of the scapula to the tuber coxae and the region of the processus xiphoideus sterni |
| ROI 11 | M. pectoralis transversus | A triangle-shaped area behind the region of the olecranon to the region of the processus xiphoideus sterni |
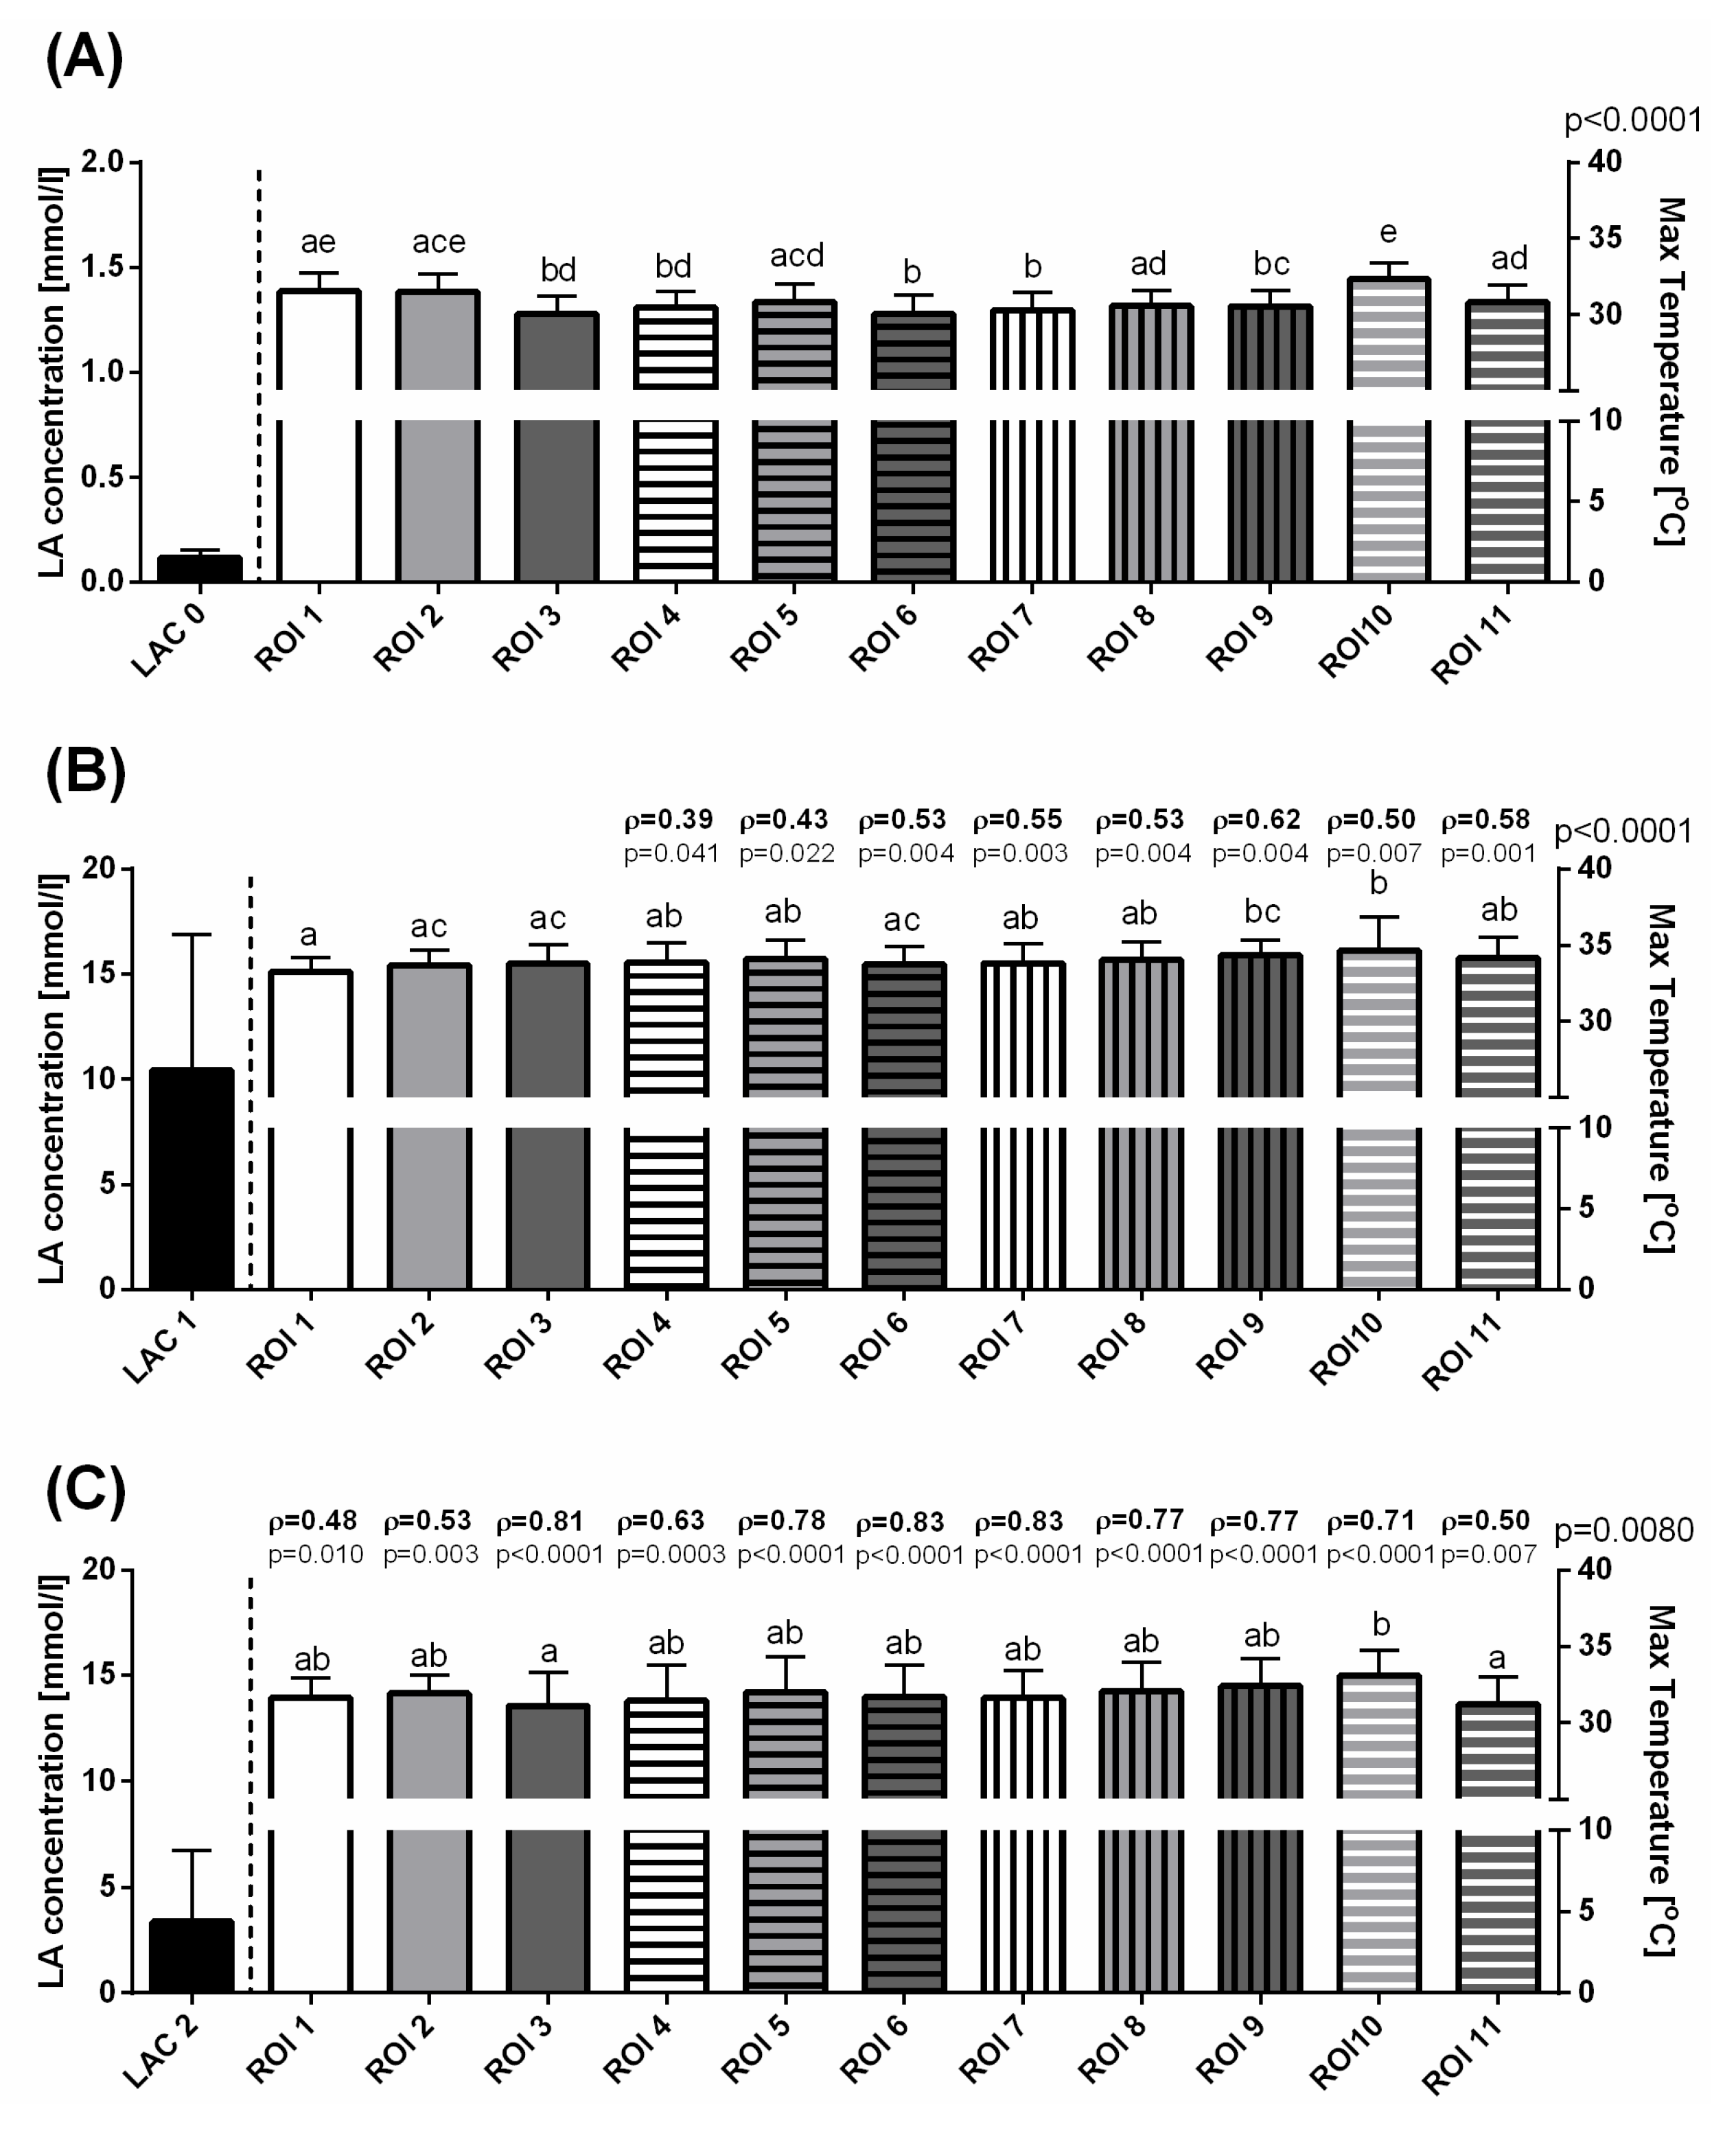
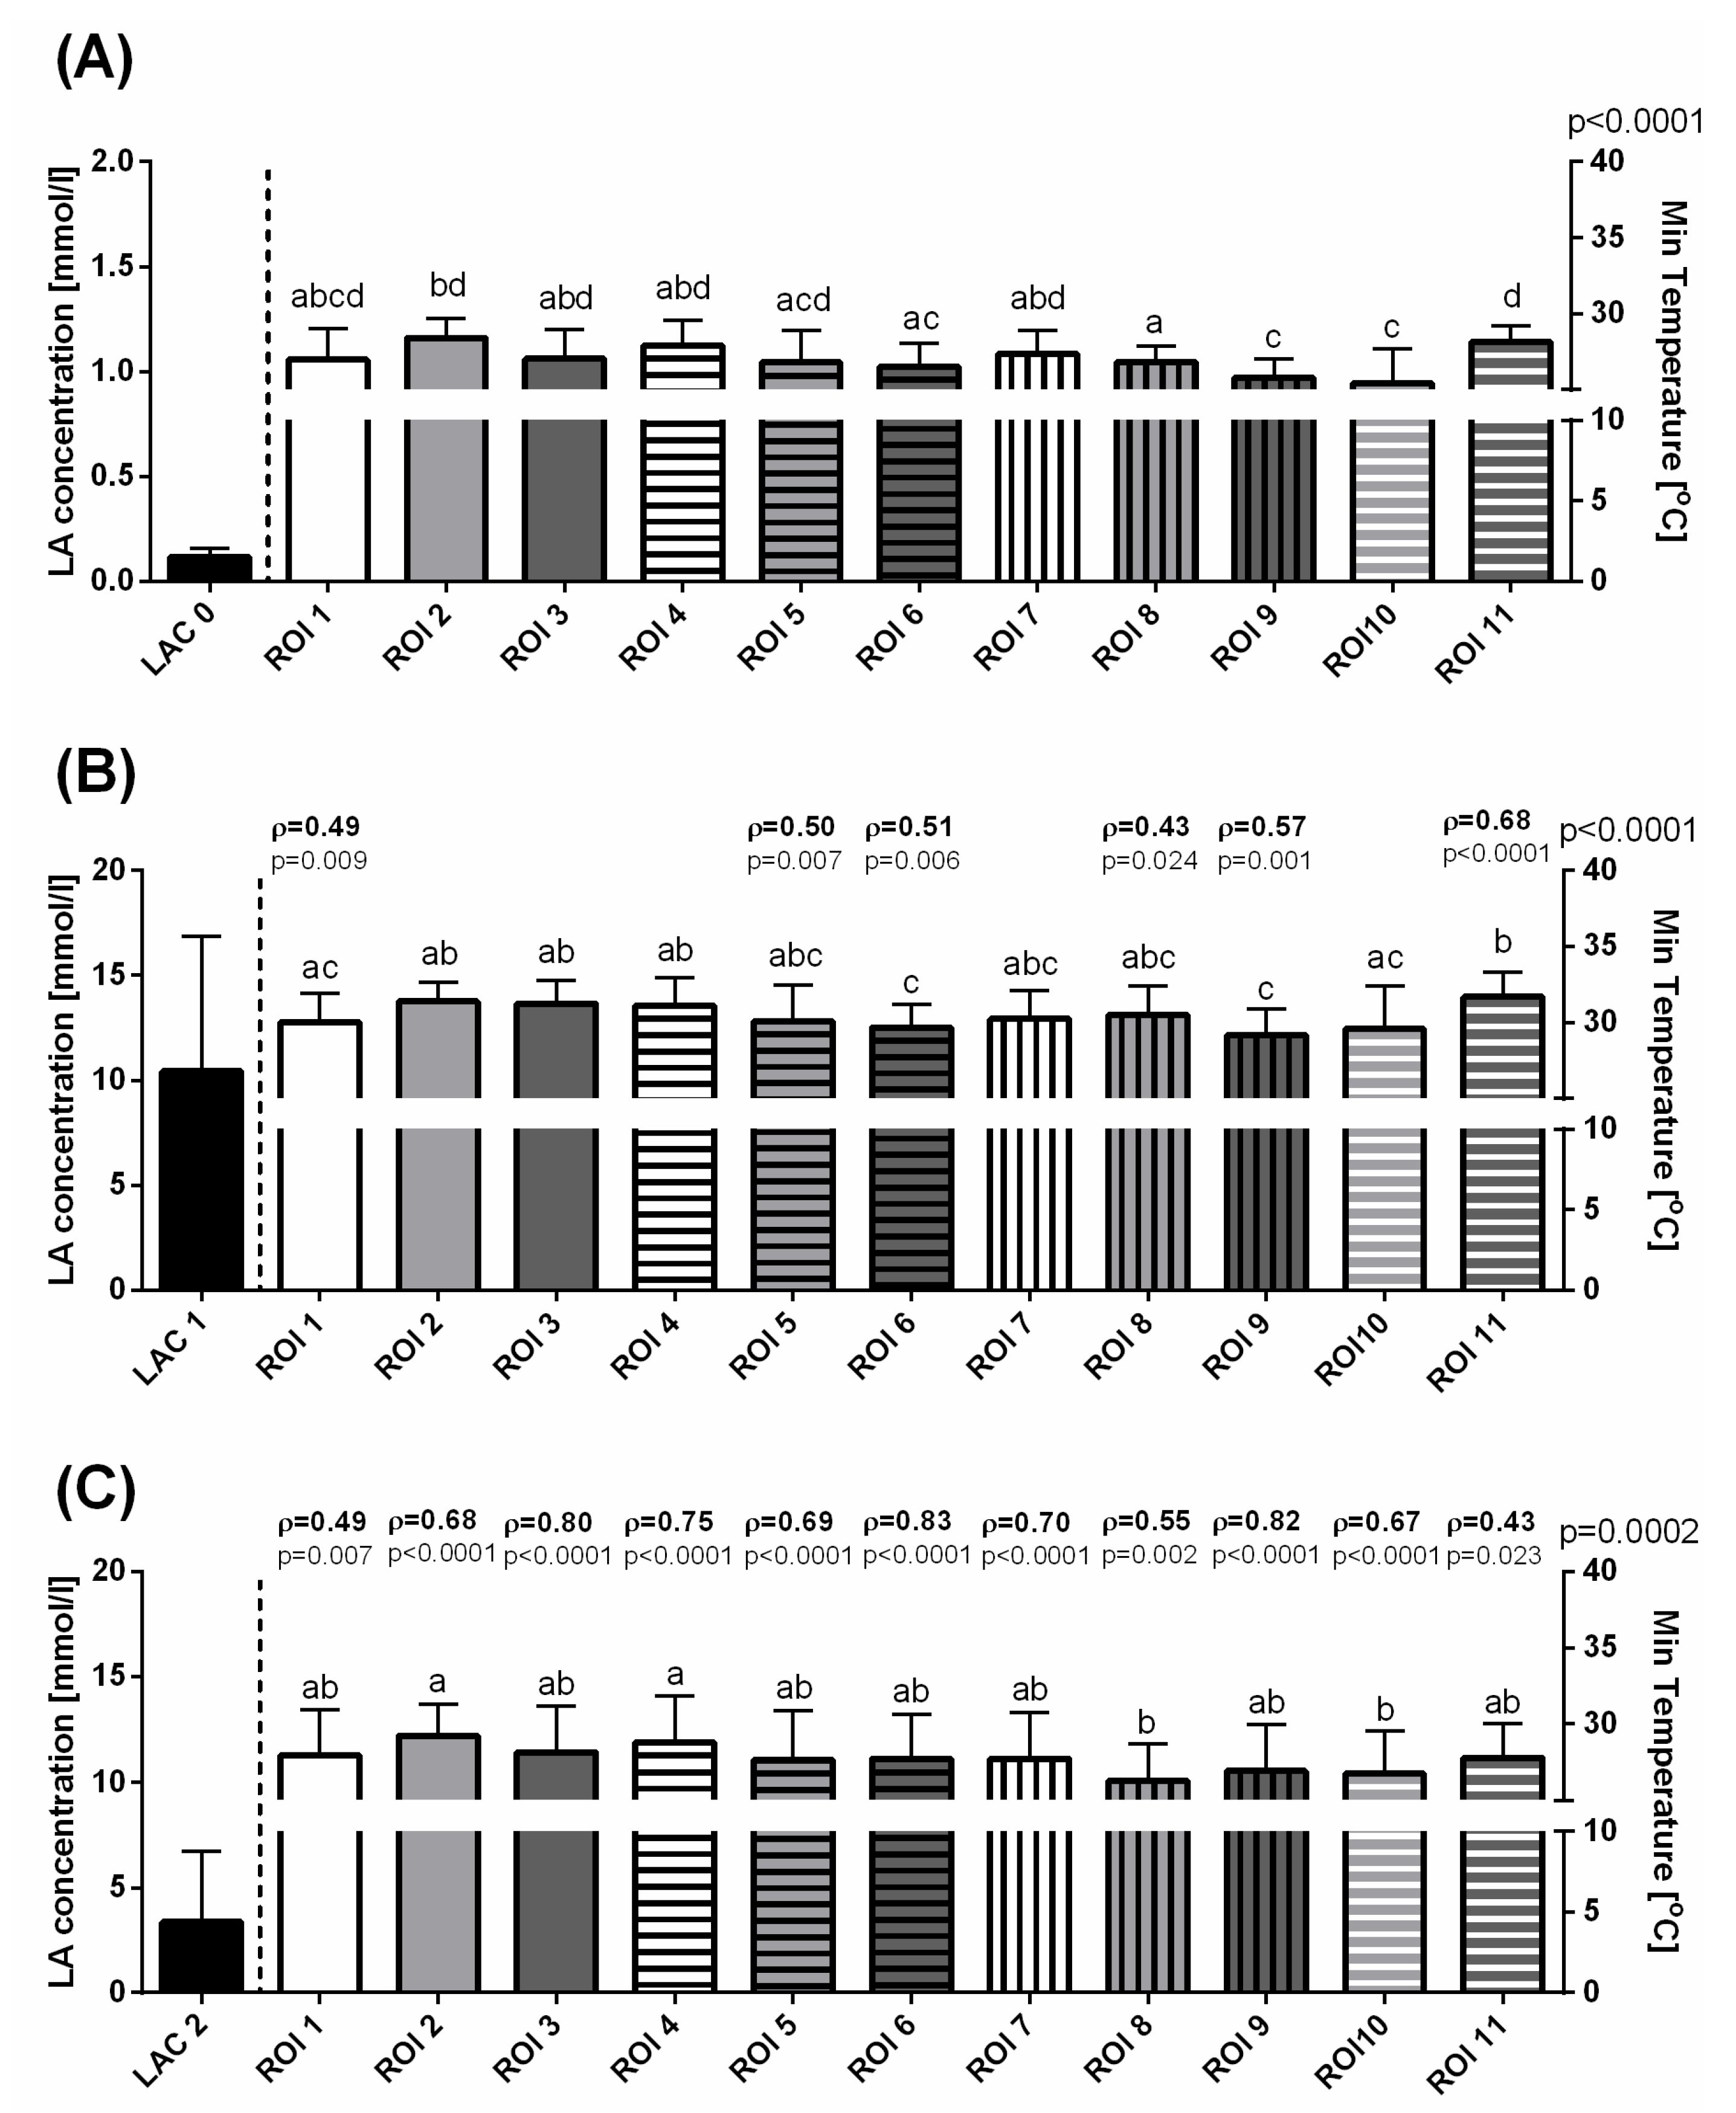
| Measurement | 0 | −1 | −2 | p-Value | |
|---|---|---|---|---|---|
| LAC (mmol/L) | 0.12 ± 0.04 a | 10.43 ± 6.44 b | 3.37 ± 3.35 c | p < 0.0001 | |
| ROI 1 | T Max | 31.53 ± 1.22 a | 33.23 ± 0.99 b | 31.62 ± 1.29 a | p < 0.0001 |
| T Min | 26.98 ± 2.08 a | 30.04 ± 1.87 b | 27.92 ± 3.01 a | p < 0.0001 | |
| T Aver | 28.64 ± 5.06 a | 31.76 ± 1.03 b | 29.84 ± 2.05 a | p < 0.0001 | |
| ROI 2 | T Max | 31.49 ± 1.20 a | 33.69 ± 0.99 b | 31.89 ± 1.25 a | p < 0.0001 |
| T Min | 28.40 ± 1.27 a | 31.39 ± 1.26 b | 29.23 ± 2.09 a | p < 0.0001 | |
| T Aver | 30.10 ± 1.16 a | 32.69 ± 1.13 b | 30.68 ± 1.58 a | p < 0.0001 | |
| ROI 3 | T Max | 30.06 ± 1.15 a | 33.79 ± 1.22 b | 31.10 ± 2.22 c | p < 0.0001 |
| T Min | 27.04 ± 1.93 a | 31.25 ± 1.53 b | 28.14 ± 3.04 a | p < 0.0001 | |
| T Aver | 27.99 ± 1.95 a | 32.71 ± 1.36 b | 29.37 ± 3.44 c | p < 0.0001 | |
| ROI 4 | T Max | 30.44 ± 1.06 a | 33.86 ± 1.28 b | 31.43 ± 2.35 a | p < 0.0001 |
| T Min | 27.92 ± 1.63 a | 31.10 ± 1.86 b | 28.82 ± 3.00 a | p < 0.0001 | |
| T Aver | 29.22 ± 0.96 a | 32.66 ± 1.53 b | 30.23 ± 2.45 c | p < 0.0001 | |
| ROI 5 | T Max | 30.85 ± 1.15 a | 34.09 ± 1.27 b | 32.01 ± 2.30 a | p < 0.0001 |
| T Min | 26.80 ± 2.11 a | 30.11 ± 2.36 b | 27.65 ± 3.24 a | p < 0.0001 | |
| T Aver | 29.73 ± 2.15 a | 32.63 ± 1.70 b | 30.23 ± 2.67 a | p < 0.0001 | |
| ROI 6 | T Max | 30.06 ± 1.20 a | 33.76 ± 1.17 b | 31.68 ± 2.11 c | p < 0.0001 |
| T Min | 26.53 ± 1.55 a | 29.68 ± 1.50 b | 27.73 ± 2.91 c | p < 0.0001 | |
| T Aver | 28.39 ± 1.22 a | 32.10 ± 1.39 b | 29.89 ± 2.54 c | p < 0.0001 | |
| ROI 7 | T Max | 30.29 ± 1.16 a | 33.83 ± 1.26 b | 31.60 ± 1.82 c | p < 0.0001 |
| T Min | 27.35 ± 1.54 a | 30.25 ± 1.84 b | 27.72 ± 3.02 a | p < 0.0001 | |
| T Aver | 28.95 ± 1.10 a | 32.48 ± 1.38 b | 29.85 ± 2.46 a | p < 0.0001 | |
| ROI 8 | T Max | 30.59 ± 1.02 a | 34.05 ± 1.20 b | 32.06 ± 1.87 c | p < 0.0001 |
| T Min | 26.83 ± 1.06 a | 30.51 ± 1.88 b | 26.31 ± 2.41 a | p < 0.0001 | |
| T Aver | 28.77 ± 1.03 a | 32.63 ± 1.33 b | 29.83 ± 2.16 c | p < 0.0001 | |
| ROI 9 | T Max | 30.54 ± 1.04 a | 34.33 ± 1.03 b | 32.39 ± 1.81 c | p < 0.0001 |
| T Min | 25.79 ± 1.26 a | 29.20 ± 1.67 b | 26.95 ± 3.03 a | p < 0.0001 | |
| T Aver | 28.30 ± 1.21 a | 32.22 ± 1.43 b | 30.08 ± 2.42 c | p < 0.0001 | |
| ROI 10 | T Max | 32.32 ± 1.08 a | 34.67 ± 2.20 b | 33.10 ± 1.61 a | p < 0.0001 |
| T Min | 25.43 ± 2.24 a | 29.58 ± 2.83 b | 26.79 ± 2.79 a | p < 0.0001 | |
| T Aver | 28.87 ± 1.14 a | 32.79 ± 1.40 b | 30.37 ± 2.09 c | p < 0.0001 | |
| ROI 11 | T Max | 30.80 ± 1.13 a | 34.18 ± 1.32 b | 31.20 ± 1.80 a | p < 0.0001 |
| T Min | 28.14 ± 1.10 a | 31.69 ± 1.63 b | 27.78 ± 2.23 a | p < 0.0001 | |
| T Aver | 29.27 ± 1.04 a | 32.87 ± 1.44 b | 29.19 ± 2.00 a | p < 0.0001 | |
Publisher’s Note: MDPI stays neutral with regard to jurisdictional claims in published maps and institutional affiliations. |
© 2020 by the authors. Licensee MDPI, Basel, Switzerland. This article is an open access article distributed under the terms and conditions of the Creative Commons Attribution (CC BY) license (http://creativecommons.org/licenses/by/4.0/).
Share and Cite
Witkowska-Piłaszewicz, O.; Maśko, M.; Domino, M.; Winnicka, A. Infrared Thermography Correlates with Lactate Concentration in Blood during Race Training in Horses. Animals 2020, 10, 2072. https://doi.org/10.3390/ani10112072
Witkowska-Piłaszewicz O, Maśko M, Domino M, Winnicka A. Infrared Thermography Correlates with Lactate Concentration in Blood during Race Training in Horses. Animals. 2020; 10(11):2072. https://doi.org/10.3390/ani10112072
Chicago/Turabian StyleWitkowska-Piłaszewicz, Olga, Małgorzata Maśko, Małgorzata Domino, and Anna Winnicka. 2020. "Infrared Thermography Correlates with Lactate Concentration in Blood during Race Training in Horses" Animals 10, no. 11: 2072. https://doi.org/10.3390/ani10112072
APA StyleWitkowska-Piłaszewicz, O., Maśko, M., Domino, M., & Winnicka, A. (2020). Infrared Thermography Correlates with Lactate Concentration in Blood during Race Training in Horses. Animals, 10(11), 2072. https://doi.org/10.3390/ani10112072