Enteric Methane Emissions of Dairy Cows Predicted from Fatty Acid Profiles of Milk, Cream, Cheese, Ricotta, Whey, and Scotta


Abstract
:Simple Summary
Abstract
1. Introduction
2. Material and Methods
2.1. Farms and Animals
2.2. Cheese and Ricotta Making
2.3. Sampling
2.4. Quality Traits and Fatty Acid Profiles
2.5. Lipid Extraction and Esterification
2.6. GC × GC Analysis
2.7. Identification and Quantification of FAs
2.8. Estimation of Enteric Methane Emissions
- Methane yield, CH4/DMI, i.e., emission, in g per kg of DM intake, estimated according to the equation:where C16:0iso is iso-palmitic acid, C18:1t10 + t11 is the sum of iso-oleic and vaccenic acids, and C18:2c9, c12 is the linoleic acid content of milk, all expressed as % of the sum of all milk FAs.CH4/DMI (g/kg) = 23.39 + 9.74 × C16:0iso − 1.06 × C18:1t10 + t11 − 1.75 × C18:2c9, c12
- Methane intensity, CH4/CM, i.e., emission per unit of fat- and protein-corrected milk (CM), estimated according to the equation:where C4:0 is butyric acid, and C18:1c9 is oleic acid, both expressed as % of the sum of all milk FAs.CH4/CM (g/kg) = 21.13 − 1.38 × C4:0 + 8.53 × C16:0iso − 0.22 × C18:1c9 − 0.59 × C18:1t10 + t11
2.9. Statistical Analysis
2.10. Definition of Accuracy, Trueness and Precision
- accuracy measures the closeness of agreement between a test result and the accepted reference value and involves a combination of random components and a common systematic error or bias component;
- trueness measures the closeness of agreement between the average value obtained from a large series of test results and an accepted reference value (bias);
- precision measures the closeness of agreement between independent test results obtained under stipulated conditions.
- high if the correlation with the reference values was >80%;
- moderate if the correlation was 50% to 80%;
- low if the correlation was 20% to 50%;
- very low if the correlation was <20%.
3. Results
4. Discussion
4.1. Informative Fatty Acids
4.2. Trueness and Precision of Estimated Enteric Methane Emissions
5. Conclusions
Author Contributions
Funding
Acknowledgments
Conflicts of Interest
References
- Kim, S.-H.; Mamuad, L.L.; Kim, E.-J.; Sung, H.-G.; Bae, G.-S.; Cho, K.-K.; Lee, C.; Lee, S.-S. Effect of different concentrate diet levels on rumen fluid inoculum used for determination of in vitro rumen fermentation, methane concentration, and methanogen abundance and diversity. Ital. J. Anim. Sci. 2017, 17, 359–367. [Google Scholar] [CrossRef]
- FAO. Livestock’s Long Shadow: Environmental Issues and Options; FAO: Rome, Italy, 2006. [Google Scholar]
- Knapp, J.R.; Laur, G.L.; Vadas, P.A.; Weiss, W.P.; Tricarico, J.M. Invited review: Enteric methane in dairy cattle production: Quantifying the opportunities and impact of reducing emissions. J. Dairy Sci. 2014, 97, 3231–3261. [Google Scholar] [CrossRef] [PubMed] [Green Version]
- Negussie, E.; de Haas, Y.; Dehareng, F.; Dewhurst, R.J.; Dijkstra, J.; Gengler, N.; Morgavi, D.P.; Soyeurt, H.; van Gastelen, S.; Yan, T.; et al. Invited review: Large-scale indirect measurements for enteric methane emissions in dairy cattle: A review of proxies and their potential for use in management and breeding decisions. J. Dairy Sci. 2017, 100, 2433–2453. [Google Scholar] [CrossRef] [PubMed] [Green Version]
- Chilliard, Y.; Martin, C.; Rouel, J.; Doreau, M. Milk fatty acids in dairy cows fed whole crude linseed, extruded linseed, or linseed oil, and their relationship with methane output. J. Dairy Sci. 2009, 92, 5199–5211. [Google Scholar] [CrossRef] [PubMed]
- Dijkstra, J.; van Zijderveld, S.M.; Apajalahti, J.A.; Bannink, A.; Gerrits, W.J.J.; Newbold, J.R.; Perdok, H.B.; Berends, H. Relationships between methane production and milk fatty acid profiles in dairy cattle. Anim. Feed Sci. Technol. 2011, 166, 590–595. [Google Scholar] [CrossRef] [Green Version]
- Montoya, J.C.; Bhagwat, A.M.; Peiren, N.; De Campeneere, S.; De Baets, B.; Fievez, V. Relationships between odd- and branched-chain fatty acid profiles in milk and calculated enteric methane proportion for lactating dairy cattle. Anim. Feed Sci. Technol. 2011, 166, 596–602. [Google Scholar] [CrossRef]
- de Haas, Y.; Pszczola, M.; Soyeurt, H.; Wall, E.; Lassen, J. Invited review: Phenotypes to genetically reduce greenhouse gas emissions in dairying. J. Dairy Sci. 2017, 100, 855–870. [Google Scholar] [CrossRef] [Green Version]
- Barber, M.C.; Clegg, R.A.; Travers, M.T.; Vernon, R.G. Lipid metabolism in the lactating mammary gland. Biochim. Biophys. Acta (BBA) Lipids Lipid Metab. 1997, 1347, 101–126. [Google Scholar] [CrossRef]
- Bauman, D.E.; Mather, I.H.; Wall, R.J.; Lock, A.L. Major Advances Associated with the Biosynthesis of Milk. J. Dairy Sci. 2006, 89, 1235–1243. [Google Scholar] [CrossRef]
- van Lingen, H.J.; Crompton, L.A.; Hendriks, W.H.; Reynolds, C.K.; Dijkstra, J. Meta-analysis of relationships between enteric methane yield and milk fatty acid profile in dairy cattle. J. Dairy Sci. 2014, 97, 7115–7132. [Google Scholar] [CrossRef]
- Bittante, G.; Cecchinato, A.; Schiavon, S. Dairy system, parity, and lactation stage affect enteric methane production, yield, and intensity per kilogram of milk and cheese predicted from gas chromatography fatty acids. J. Dairy Sci. 2018, 101, 1752–1766. [Google Scholar] [CrossRef] [PubMed] [Green Version]
- van Gastelen, S.; Mollenhorst, H.; Antunes-Fernandes, E.C.; Hettinga, K.A.; van Burgsteden, G.G.; Dijkstra, J.; Rademaker, J.L.W. Predicting enteric methane emission of dairy cows with milk Fourier-transform infrared spectra and gas chromatography–based milk fatty acid profiles. J. Dairy Sci. 2018, 101, 5582–5598. [Google Scholar] [CrossRef] [PubMed] [Green Version]
- Bittante, G.; Cecchinato, A. Heritability estimates of enteric methane emissions predicted from fatty acid profiles, and their relationships with milk composition, cheese-yield and body size and condition. Ital. J. Anim. Sci. 2020, 19, 114–126. [Google Scholar] [CrossRef] [Green Version]
- Bergamaschi, M.; Cipolat-Gotet, C.; Stocco, G.; Valorz, C.; Bazzoli, I.; Sturaro, E.; Ramanzin, M.; Bittante, G. Cheese-making in the temporary farms during summer transhumance to highland pastures: Milk technological properties, cream, cheese and ricotta yields, milk nutrients recovery, and products composition. J. Dairy Sci. 2016, 99, 9631–9646. [Google Scholar] [CrossRef] [PubMed] [Green Version]
- Bergamaschi, M.; Bittante, G. From milk to cheese: Evolution of flavor fingerprint of milk, cream, curd, whey, ricotta, scotta, and ripened cheese obtained during summer Alpine pasture. J. Dairy Sci. 2018, 101, 3918–3934. [Google Scholar] [CrossRef] [PubMed] [Green Version]
- Bergamaschi, M.; Bittante, G. Detailed fatty acid profile of milk, cheese, ricotta and by products, from cows grazing summer highland pastures. J. Dairy Res. 2017, 84, 329–338. [Google Scholar] [CrossRef]
- Hara, A.; Radin, N.S. Lipid extraction of tissues with a low-toxicity solvent. Anal. Biochem. 1978, 90, 420–426. [Google Scholar] [CrossRef] [Green Version]
- Chouinard, P.Y.; Corneau, L.; Barbano, D.M.; Metzger, L.E.; Bauman, D.E. Conjugated Linoleic Acids Alter Milk Fatty Acid Composition and Inhibit Milk Fat Secretion in Dairy Cows. J. Nutr. 1999, 129, 1579–1584. [Google Scholar] [CrossRef] [Green Version]
- Milk and Milk Products. Extraction Methods for Lipids and Liposoluble Compounds. Available online: https://shop.bsigroup.com/ProductDetail/?pid=000000000030134008 (accessed on 26 December 2019).
- Jenkins, T.C. Technical note: Common analytical errors yielding inaccurate results during analysis of fatty acids in feed and digesta samples. J. Dairy Sci. 2010, 93, 1170–1174. [Google Scholar] [CrossRef] [Green Version]
- Schiavon, S.; Cesaro, G.; Cecchinato, A.; Cipolat-Gotet, C.; Tagliapietra, F.; Bittante, G. The influence of dietary nitrogen reduction and conjugated linoleic acid supply to dairy cows on fatty acids in milk and their transfer to ripened cheese. J. Dairy Sci. 2016, 99, 8759–8778. [Google Scholar] [CrossRef] [Green Version]
- Schiavon, S.; Pellattiero, E.; Cecchinato, A.; Tagliapietra, F.; Dannenberger, D.; Nuernberg, K.; Nuernberg, G.; Bittante, G. The influence of different sample preparation procedures on the determination of fatty acid profiles of beef subcutaneous fat, liver and muscle by gas chromatography. J. Food Compos. Anal. 2016, 50, 10–18. [Google Scholar] [CrossRef]
- Bittante, G.; Cipolat-Gotet, C. Direct and indirect predictions of enteric methane daily production, yield, and intensity per unit of milk and cheese, from fatty acids and milk Fourier-transform infrared spectra. J. Dairy Sci. 2018, 101, 7219–7235. [Google Scholar] [CrossRef] [PubMed] [Green Version]
- Heck, J.M.L.; van Valenberg, H.J.F.; Dijkstra, J.; van Hooijdonk, A.C.M. Seasonal variation in the Dutch bovine raw milk composition. J. Dairy Sci. 2009, 92, 4745–4755. [Google Scholar] [CrossRef] [PubMed]
- Shingfield, K.J.; Bonnet, M.; Scollan, N.D. Recent developments in altering the fatty acid composition of ruminant-derived foods. Animal 2013, 7, 132–162. [Google Scholar] [CrossRef] [PubMed]
- Mohammed, R.; McGinn, S.M.; Beauchemin, K.A. Prediction of enteric methane output from milk fatty acid concentrations and rumen fermentation parameters in dairy cows fed sunflower, flax, or canola seeds. J. Dairy Sci. 2011, 94, 6057–6068. [Google Scholar] [CrossRef] [Green Version]
- Chilliard, Y.; Ferlay, A.; Mansbridge, R.M.; Doreau, M. Ruminant milk fat plasticity: Nutritional control of saturated, polyunsaturated, trans and conjugated fatty acids. Ann. Zootech. 2000, 49, 181–205. [Google Scholar] [CrossRef] [Green Version]
- Mele, M.; Macciotta, N.P.P.; Cecchinato, A.; Conte, G.; Schiavon, S.; Bittante, G. Multivariate factor analysis of detailed milk fatty acid profile: Effects of dairy system, feeding, herd, parity, and stage of lactation. J. Dairy Sci. 2016, 99, 9820–9833. [Google Scholar] [CrossRef] [Green Version]
- Rico, D.E.; Chouinard, P.Y.; Hassanat, F.; Benchaar, C.; Gervais, R. Prediction of enteric methane emissions from Holstein dairy cows fed various forage sources. Animal 2016, 10, 203–211. [Google Scholar] [CrossRef] [Green Version]
- Pegolo, S.; Cecchinato, A.; Casellas, J.; Conte, G.; Mele, M.; Schiavon, S.; Bittante, G. Genetic and environmental relationships of detailed milk fatty acids profile determined by gas chromatography in Brown Swiss cows. J. Dairy Sci. 2016, 99, 1315–1330. [Google Scholar] [CrossRef] [Green Version]
- Collins, Y.F.; McSweeney, P.L.H.; Wilkinson, M.G. Lipolysis and free fatty acid catabolism in cheese: A review of current knowledge. Int. Dairy J. 2003, 13, 841–866. [Google Scholar] [CrossRef]
- Cattani, M.; Mantovani, R.; Schiavon, S.; Bittante, G.; Bailoni, L. Recovery of n-3 polyunsaturated fatty acids and conjugated linoleic acids in ripened cheese obtained from milk of cows fed different levels of extruded flaxseed. J. Dairy Sci. 2014, 97, 123–135. [Google Scholar] [CrossRef] [PubMed] [Green Version]

| Trait | Mean | SD |
|---|---|---|
| Milk composition: | ||
| Fat, % | 3.57 | 0.84 |
| Protein, % | 3.70 | 0.09 |
| Casein, % | 2.74 | 0.11 |
| Lactose, % | 4.87 | 0.13 |
| SCS 1, U/mL | 3.59 | 0.54 |
| pH | 6.52 | 0.03 |
| Product yield traits (% on processed milk): | ||
| Cream | 6.32 | 1.56 |
| Fresh Cheese | 14.22 | 0.78 |
| Ricotta | 4.97 | 0.72 |
| Ripened cheese (6 months) | 9.60 | 0.53 |
| Ripened cheese (12 months) | 9.14 | 0.60 |
| Dairy Product and By-Product | Informative Fatty Acids 1 (g/100g FA): | Predicted Methane Emissions (g/kg): | |||||
|---|---|---|---|---|---|---|---|
| C4:0 | C16:0iso | C18:1t10-11 | C18:1c9 | C18:2c9,c12 | CH4/DMI | CH4/CM | |
| Reference bovine milk | 2.92 | 0.29 | 4.52 | 24.41 | 2.54 | 16.94 | 11.49 |
| Single milk samples 2 | |||||||
| Evening whole | 2.89 | 0.29 | 4.63 | 25.17 ** | 2.58 | 16.77 | 11.33 |
| Evening skimmed | 2.97 | 0.29 | 4.59 | 25.39 *** | 2.59 | 16.81 | 11.21 |
| Morning whole | 2.96 | 0.28 | 4.41 | 23.65 ** | 2.49 | 17.11 | 11.66 |
| Vat mix | 3.10 | 0.30 | 4.49 | 24.12 | 2.59 | 17.01 | 11.44 |
| Fresh products 2 | |||||||
| Cream | 3.22 * | 0.30 ** | 4.09 *** | 23.02 *** | 2.35 | 17.91 *** | 11.80 |
| Fresh cheese | 3.25 * | 0.29 | 4.39 | 23.80 * | 2.57 | 17.02 | 11.25 |
| Ricotta | 3.23 * | 0.29 | 4.48 | 23.87 * | 2.45 | 17.21 | 11.27 |
| By-products 2 | |||||||
| Whey | 3.13 | 0.29 | 4.44 | 24.14 | 2.45 | 17.25 | 11.39 |
| Scotta 3 | 3.61 *** | 0.30 * | 3.18 *** | 22.30 *** | 3.13 | 17.48 * | 11.95 * |
| Ripened cheese 2 | |||||||
| 6 months | 2.77 | 0.29 | 4.29 ** | 23.18 *** | 2.31 | 17.63 *** | 12.16 ** |
| 12 months | 2.79 | 0.29 | 4.13 *** | 23.53 *** | 2.35 | 17.70 *** | 12.11 ** |
| Cheese-making effect 4 | *** | *** | *** | *** | *** | *** | *** |
| RMSE | 0.27 | 0.02 | 0.19 | 0.53 | 0.13 | 0.18 | 0.33 |
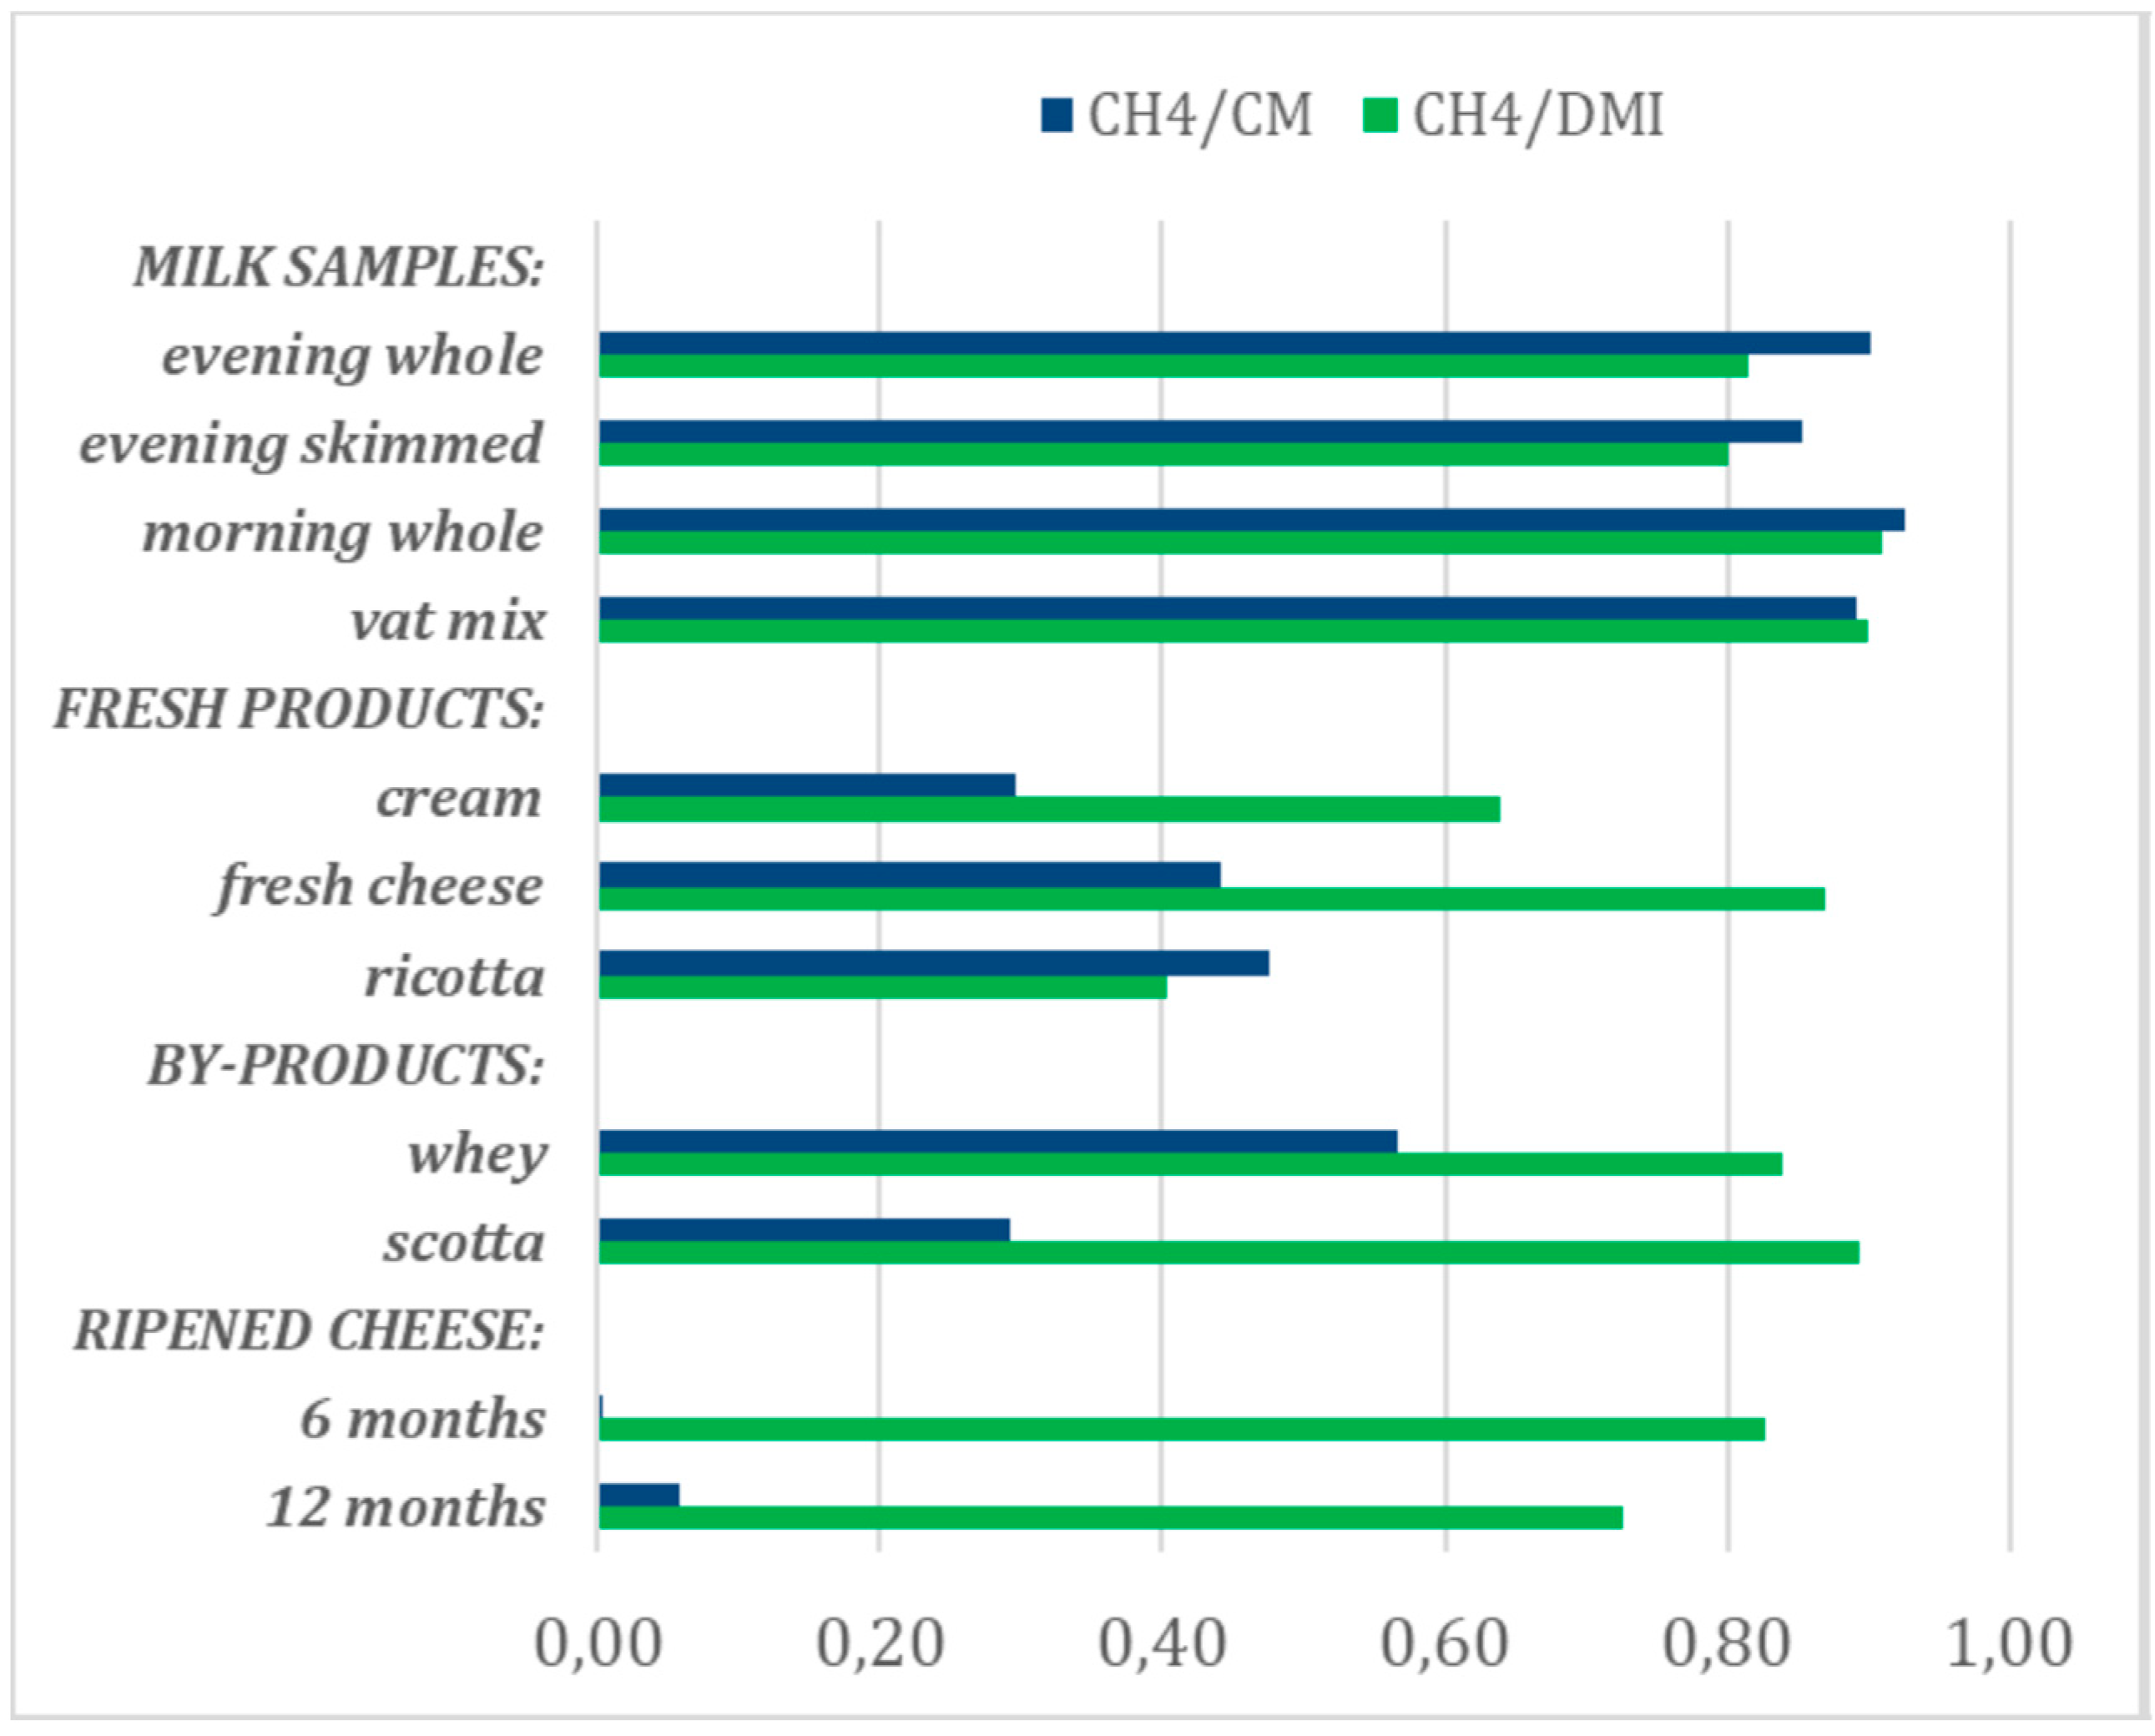
| Dairy Products and By-Products | CH4/DMI | CH4/CM | ||
|---|---|---|---|---|
| Trueness 1 | Precision 2 | Trueness 1 | Precision 2 | |
| Single milk samples: | ||||
| Evening whole | Good | High | Good | High |
| Evening skimmed | Good | High | Good | High |
| Morning whole | Good | High | Good | High |
| Vat mix | Good | High | Good | High |
| Fresh products: | ||||
| Cream | Overestimate 6% | Moderate | Good | Low |
| Fresh cheese | Good | High | Good | Low |
| Ricotta | Good | Low | Good | Low |
| By-products: | ||||
| Whey | Good | High | Good | Moderate |
| Scotta 3 | Overestimate 3% | High | Overestimate 4% | Low |
| Ripened cheese: | ||||
| 6 months | Overestimate 4% | High | Overestimate 6% | Very low |
| 12 months | Overestimate 4% | Moderate | Overestimate 5% | Very low |
© 2019 by the authors. Licensee MDPI, Basel, Switzerland. This article is an open access article distributed under the terms and conditions of the Creative Commons Attribution (CC BY) license (http://creativecommons.org/licenses/by/4.0/).
Share and Cite
Bittante, G.; Bergamaschi, M. Enteric Methane Emissions of Dairy Cows Predicted from Fatty Acid Profiles of Milk, Cream, Cheese, Ricotta, Whey, and Scotta. Animals 2020, 10, 61. https://doi.org/10.3390/ani10010061
Bittante G, Bergamaschi M. Enteric Methane Emissions of Dairy Cows Predicted from Fatty Acid Profiles of Milk, Cream, Cheese, Ricotta, Whey, and Scotta. Animals. 2020; 10(1):61. https://doi.org/10.3390/ani10010061
Chicago/Turabian StyleBittante, Giovanni, and Matteo Bergamaschi. 2020. "Enteric Methane Emissions of Dairy Cows Predicted from Fatty Acid Profiles of Milk, Cream, Cheese, Ricotta, Whey, and Scotta" Animals 10, no. 1: 61. https://doi.org/10.3390/ani10010061
APA StyleBittante, G., & Bergamaschi, M. (2020). Enteric Methane Emissions of Dairy Cows Predicted from Fatty Acid Profiles of Milk, Cream, Cheese, Ricotta, Whey, and Scotta. Animals, 10(1), 61. https://doi.org/10.3390/ani10010061