Ruminal Microbiota and Fermentation in Response to Dietary Protein and Energy Levels in Weaned Lambs


Abstract
Simple Summary
Abstract
1. Introduction
2. Materials and Methods
2.1. Animals, Diets and Experimental Design
2.2. Feed Samples Chemical Analyses
2.3. Rumen Sample Collection
2.4. Measurement of Rumen Morphology
2.5. Ruminal Fermentation Parameters
2.6. Rumen Microbial Diversity Data
2.7. Statistical and Bioinformatics Analysis
3. Results
3.1. Growth Performance
3.2. Rumen Fermentation and Morphology
3.3. Sequences and Alpha Diversity
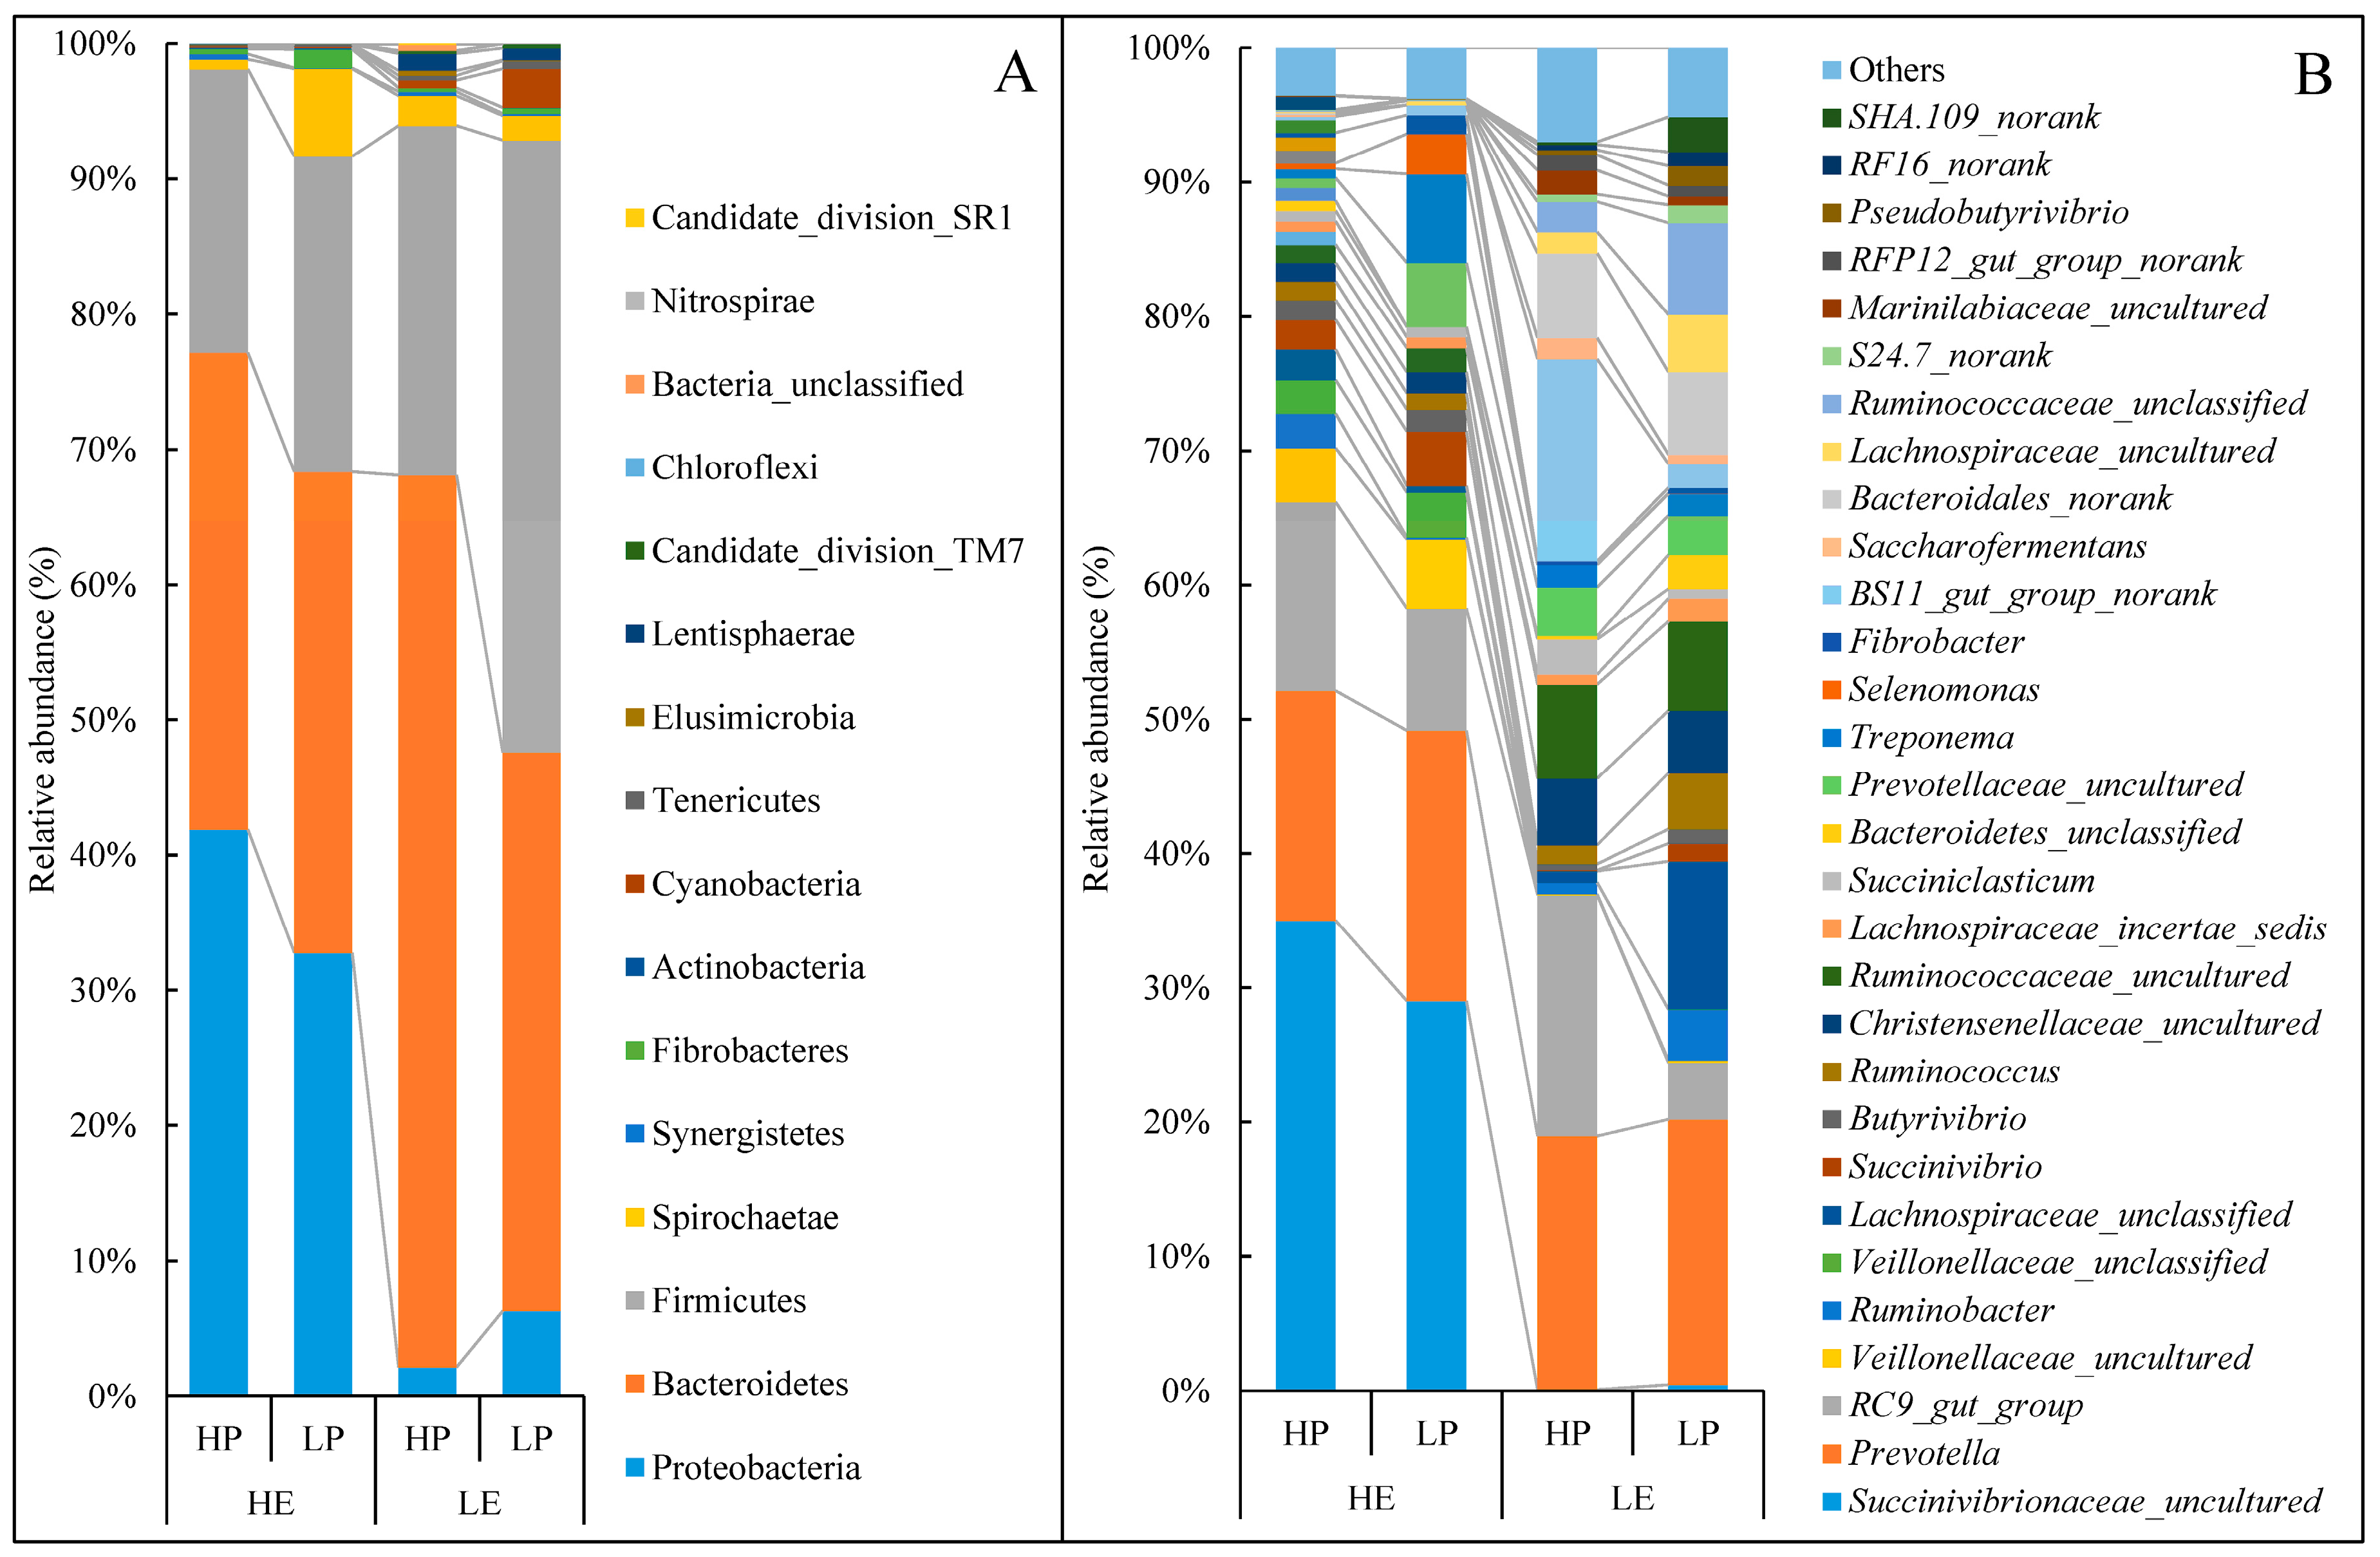
3.4. Taxonomy of Rumen Bacterial Composition
3.5. Indicator Genera Analysis
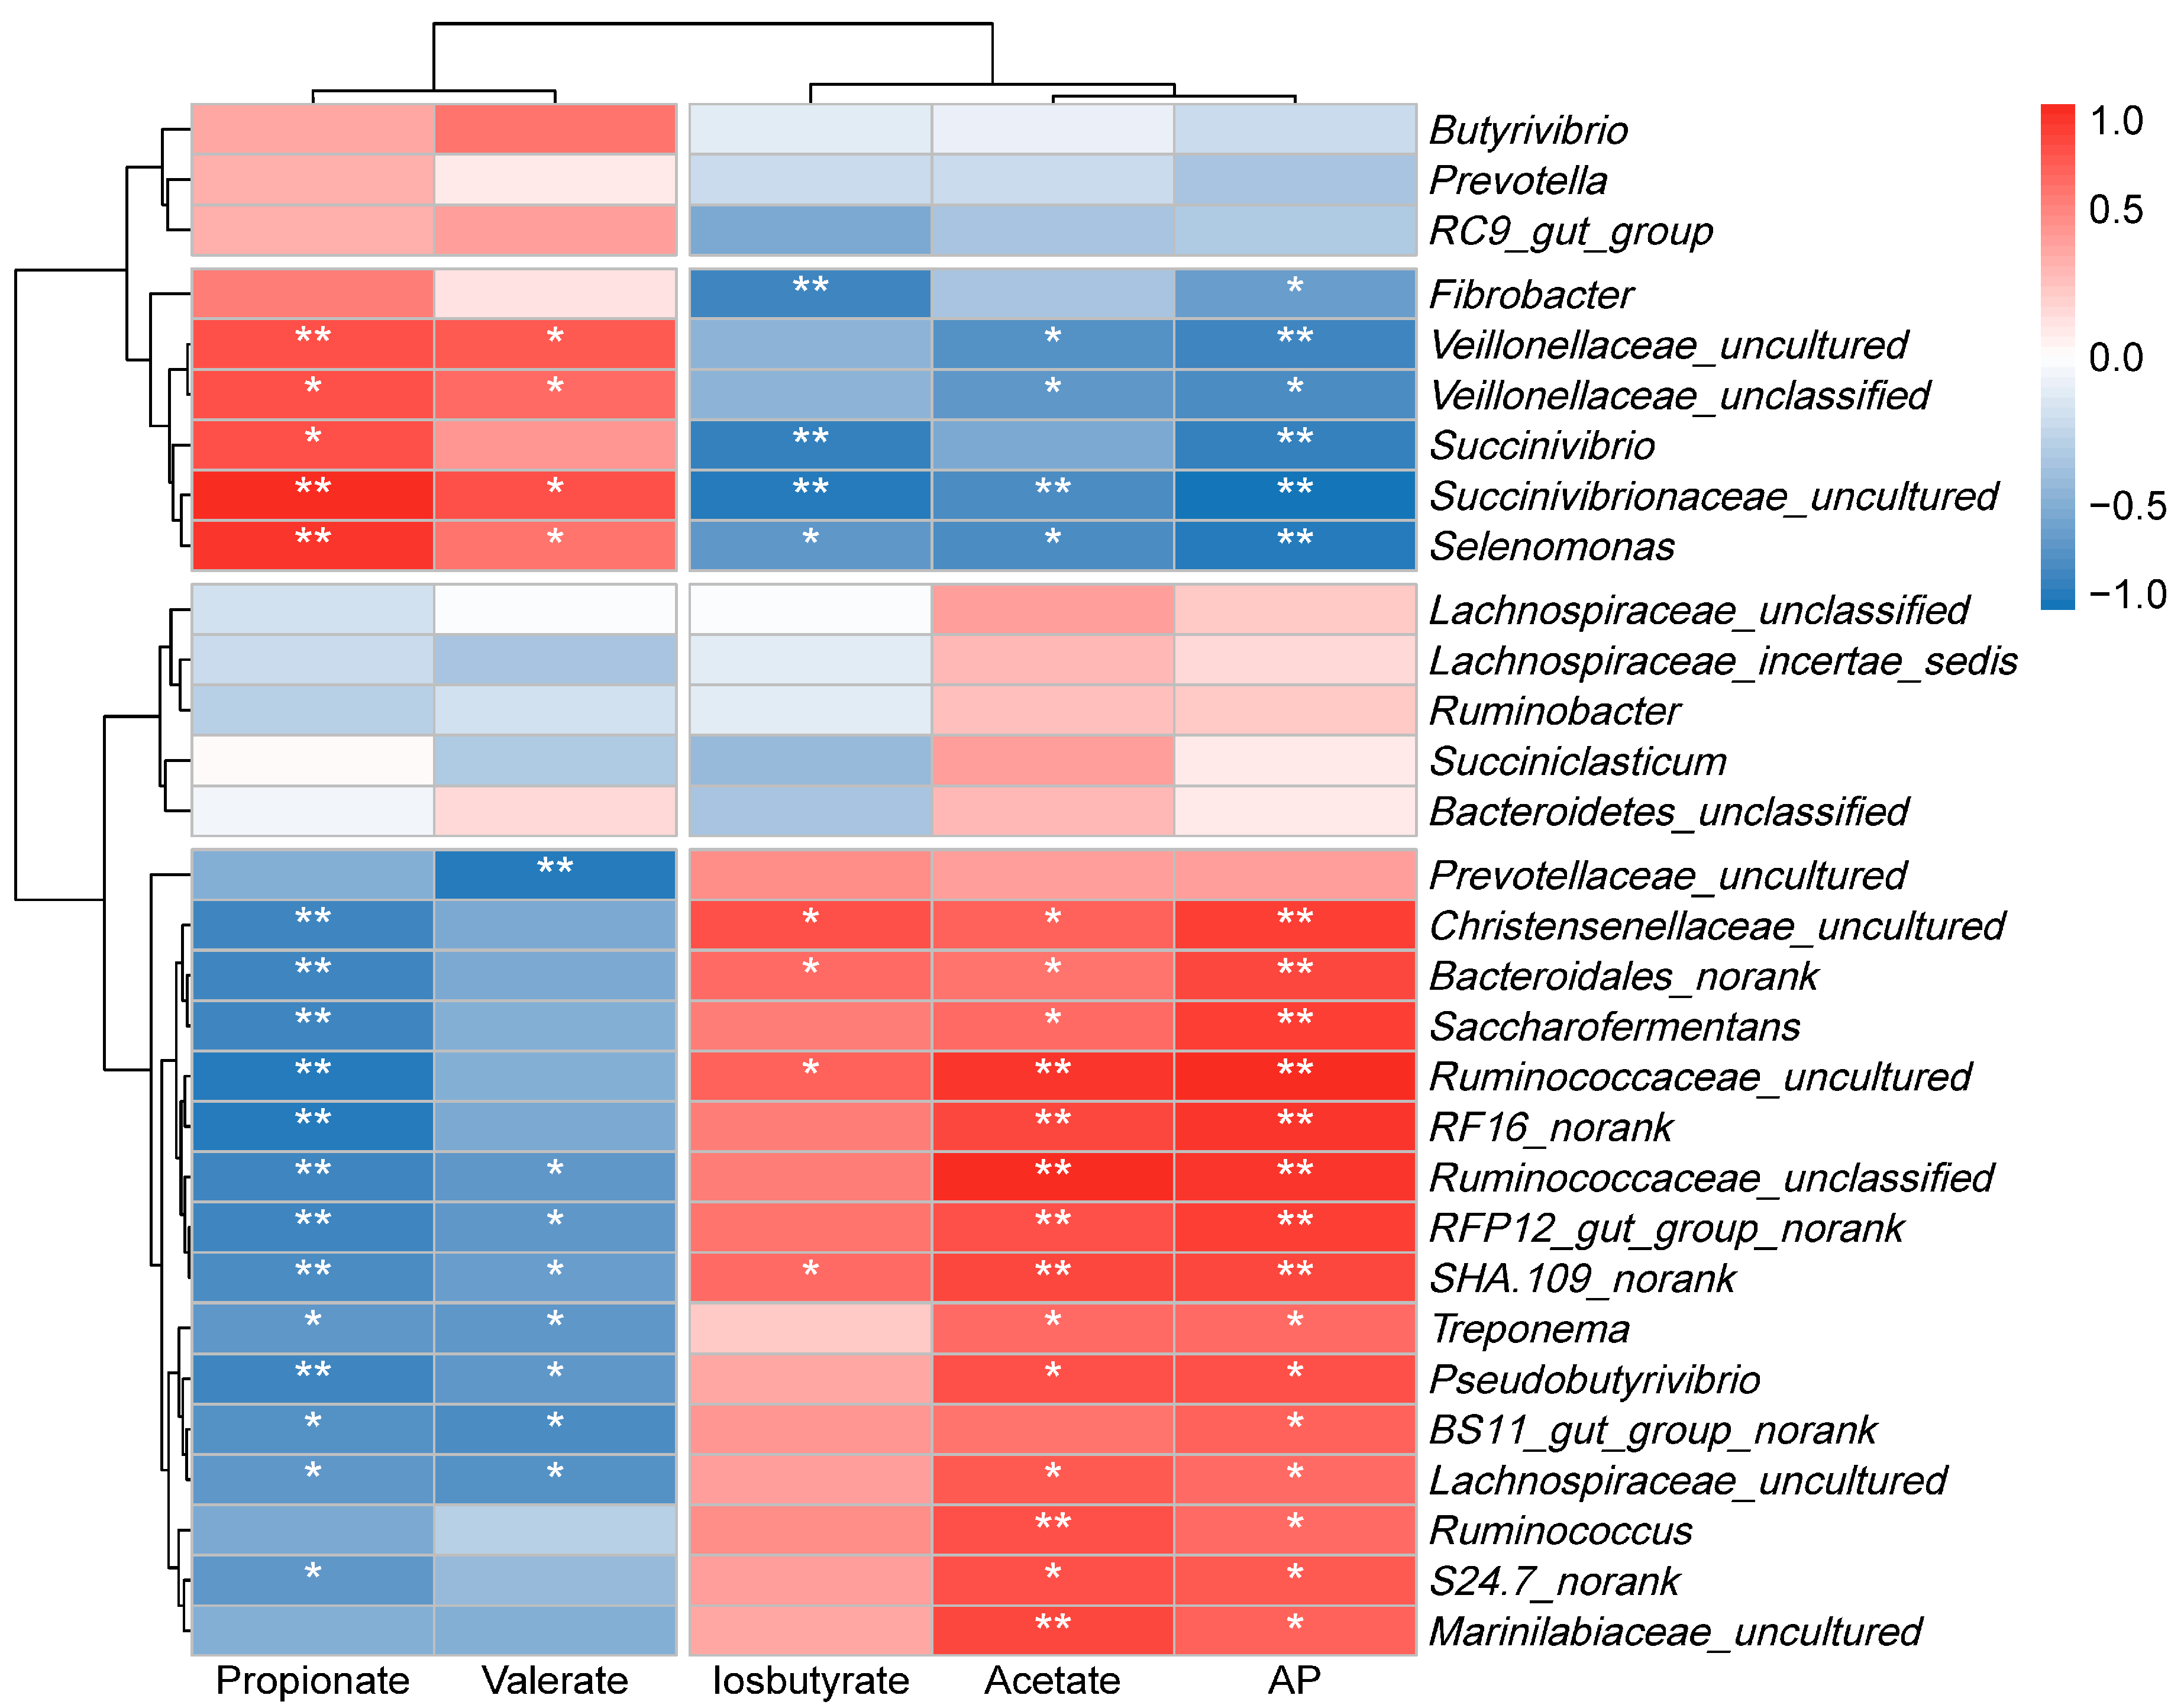
3.6. The Relationship Between Rumen Microbiota and Metabolic Phenotypes
4. Discussion
5. Conclusions
Author Contributions
Funding
Conflicts of Interest
References
- Cui, K.; Qi, M.; Wang, S.; Diao, Q.; Zhang, N. Dietary energy and protein levels influenced the growth performance, ruminal morphology and fermentation and microbial diversity of lambs. Sci. Rep. 2019, 9, 16612. [Google Scholar] [CrossRef]
- Tapio, I.; Fischer, D.; Blasco, L.; Tapio, M.; Wallace, R.J.; Bayat, A.R.; Ventto, L.; Kahala, M.; Negussie, E.; Shingfield, K.J.; et al. Taxon abundance, diversity, co-occurrence and network analysis of the ruminal microbiota in response to dietary changes in dairy cows. PLoS ONE 2017, 12, e180260. [Google Scholar] [CrossRef] [PubMed]
- Wang, Y.H.; Wang, F.N.; Xu, M.; Yu, Z.P.; Yao, J.H.; Zan, L.S.; Yang, F.X. Effect of dietary starch on rumen and small intestine morphology and digesta ph in goats. Livest. Sci. 2009, 122, 48–52. [Google Scholar] [CrossRef]
- Faubladier, C.; Julliand, V.; Danel, J.; Philippeau, C. Bacterial carbohydrate-degrading capacity in foal faeces: Changes from birth to pre-weaning and the impact of maternal supplementation with fermented feed products. Br. J. Nutr. 2013, 110, 1040–1052. [Google Scholar] [CrossRef] [PubMed][Green Version]
- Suárez, B.J.; Van Reenen, C.G.; Gerrits, W.J.J.; Stockhofe, N.; van Vuuren, A.M.; Dijkstra, J. Effects of supplementing concentrates differing in carbohydrate composition in veal calf diets: II. Rumen development. J. Dairy Sci. 2006, 89, 4376–4386. [Google Scholar] [CrossRef]
- Lu, Z.; Xu, Z.; Shen, Z.; Tian, Y.; Shen, H. Dietary energy level promotes rumen microbial protein synthesis by improving the energy productivity of the ruminal microbiome. Front. Microbiol. 2019, 10. [Google Scholar] [CrossRef] [PubMed]
- Cutrim, D.O.; Alves, K.S.; Da Conceição Dos Santos, R.; Da Mata, V.J.V.; Oliveira, L.R.S.; Gomes, D.Í.; Mezzomo, R. Body composition and energy and protein nutritional requirements for weight gain in santa ines crossbred sheep. Trop. Anim. Health Prod. 2016, 48, 683–688. [Google Scholar] [CrossRef] [PubMed]
- Fiems, L.O.; De Boever, J.L.; Ampe, B.; Vanacker, J.M.; De Campeneere, S.; Sonck, B. Effect of energy restriction and dietary protein level during the re-alimentation period on feed efficiency in double-muscled belgian blue cows. Livest. Sci. 2015, 174, 46–52. [Google Scholar] [CrossRef]
- Mullins, C.R.; Mamedova, L.K.; Carpenter, A.J.; Ying, Y.; Allen, M.S.; Yoon, I.; Bradford, B.J. Analysis of rumen microbial populations in lactating dairy cattle fed diets varying in carbohydrate profiles and saccharomyces cerevisiae fermentation product. J. Dairy Sci. 2013, 96, 5872–5881. [Google Scholar] [CrossRef]
- Sun, Z.H.; He, Z.X.; Zhang, Q.L.; Tan, Z.L.; Han, X.F.; Tang, S.X.; Zhou, C.S.; Wang, M.; Yan, Q.X. Effects of energy and protein restriction, followed by nutritional recovery on morphological development of the gastrointestinal tract of weaned kids. J. Anim. Sci. 2013, 91, 4336–4344. [Google Scholar] [CrossRef]
- Chen, S.; Paengkoum, P.; Xia, X.; Na-Lumpang, P. Effects of dietary protein on ruminal fermentation, nitrogen utilization and crude protein maintenance in growing thai-indigenous beef cattle fed rice straw as roughage. J. Anim. Vet. Adv. 2010, 9, 2396–2400. [Google Scholar] [CrossRef]
- Chai, J.; Diao, Q.; Zhao, J.; Wang, H.; Deng, K.; Qi, M.; Nie, M.; Zhang, N. Effects of rearing system on meat quality, fatty acid and amino acid profiles of hu lambs. Anim. Sci. J. 2018, 89, 1178–1186. [Google Scholar] [CrossRef] [PubMed]
- Hu, P.F.; Li, X.C.; Liu, H.K.; Guan, W.J.; Ma, Y.H. Construction and characterization of a cdna expression library from the endangered hu sheep. Genet. Mol. Res. 2014, 13, 9019–9023. [Google Scholar] [CrossRef] [PubMed]
- AOAC. Official Methods of Analysis, 18th ed.; AOAC International: Gaithersburg, MD, USA, 2005. [Google Scholar]
- Ma, T.; Tu, Y.; Zhang, N.F.; Deng, K.D.; Diao, Q.Y. Effect of the ratio of non-fibrous carbohydrates to neutral detergent fiber and protein structure on intake, digestibility, rumen fermentation, and nitrogen metabolism in lambs. Asian Austral. J. Anim. 2015, 28, 1419–1426. [Google Scholar] [CrossRef] [PubMed]
- Mao, S.; Zhang, R.; Wang, D.; Zhu, W. The diversity of the fecal bacterial community and its relationship with the concentration of volatile fatty acids in the feces during subacute rumen acidosis in dairy cows. BMC Vet. Res. 2012, 8, 237. [Google Scholar] [CrossRef]
- Caporaso, J.G.; Kuczynski, J.; Stombaugh, J.; Bittinger, K.; Bushman, F.D.; Costello, E.K.; Fierer, N.; Peña, A.G.; Goodrich, J.K.; Gordon, J.I.; et al. Qiime allows analysis of high-throughput community sequencing data. Nat. Methods 2010, 7, 335–336. [Google Scholar] [CrossRef]
- Edgar, R.C. Uparse: Highly accurate otu sequences from microbial amplicon reads. Nat. Methods 2013, 10, 996–998. [Google Scholar] [CrossRef]
- Quast, C.; Pruesse, E.; Yilmaz, P.; Gerken, J.; Schweer, T.; Yarza, P.; Peplies, J.; Glockner, F.O. The silva ribosomal rna gene database project: Improved data processing and web-based tools. Nucleic Acids Res. 2013, 41, D590–D596. [Google Scholar] [CrossRef]
- Cole, J.R.; Wang, Q.; Cardenas, E.; Fish, J.; Chai, B.; Farris, R.J.; Kulam-Syed-Mohideen, A.S.; McGarrell, D.M.; Marsh, T.; Garrity, G.M.; et al. The ribosomal database project: Improved alignments and new tools for rrna analysis. Nucleic Acids Res. 2009, 37, D141–D145. [Google Scholar] [CrossRef]
- Amato, K.R.; Yeoman, C.J.; Kent, A.; Righini, N.; Carbonero, F.; Estrada, A.; Gaskins, H.R.; Stumpf, R.M.; Yildirim, S.; Torralba, M. Habitat degradation impacts black howler monkey (alouatta pigra) gastrointestinal microbiomes. ISME J. 2013, 7, 1344–1353. [Google Scholar] [CrossRef]
- Caceres, M.D.; Legendre, P. Associations between species and groups of sites: Indices and statistical inference. Ecology 2009, 90, 3566–3574. [Google Scholar] [CrossRef] [PubMed]
- Ríos-Rincón, F.G.; Estrada-Angulo, A.; Plascencia, A.; López-Soto, M.A.; Castro-Pérez, B.I.; Portillo-Loera, J.J.; Robles-Estrada, J.C.; Calderón-Cortes, J.F.; Dávila-Ramos, H. Influence of protein and energy level in finishing diets for feedlot hair lambs: Growth performance, dietary energetics and carcass characteristics. Asian Austral. J. Anim. 2014, 27, 55–61. [Google Scholar] [CrossRef]
- Sayed, A. Effect of different dietary energy levels on the performance and nutrient digestibility of lambs. Vet. World 2009, 2, 418–420. [Google Scholar]
- Abbasi, S.A.; Vighio, M.A.; Soomro, S.A.; Kachiwal, A.B.; Gadahi, J.A.; Wang, G. Effect of different dietary energy levels on the growth performance of kamori goat kids. Int. J. Agro Vet. Med. Sci. 2012, 6, 473–479. [Google Scholar] [CrossRef][Green Version]
- Estrada-Angulo, A.; Castro-Pérez, B.I.; Urías-Estrada, J.D.; Ríos-Rincón, F.G.; Arteaga-Wences, Y.J.; Barreras, A.; López-Soto, M.A.; Plascencia, A.; Zinn, R.A. Influence of protein level on growth performance, dietary energetics and carcass characteristics of pelibuey×katahdin lambs finished with isocaloric diets. Small Rumin. Res. 2018, 160, 59–64. [Google Scholar] [CrossRef]
- Kaya, I.; Ünal, Y.; SahïN, T.; Elmalï, D. Effect of different protein levels on fattening performance, digestibility and rumen parameters in finishing lambs. J. Anim. Vet. Adv. 2012, 8, 309–312. [Google Scholar] [CrossRef]
- Topal, M.; Ozdemir, M.; Aksakal, V.; Yildiz, N.; Dogru, U. Determination of the best nonlinear function in order to estimate growth in morkaraman and awassi lambs. Small Rumin. Res. 2004, 55, 229–232. [Google Scholar] [CrossRef]
- Yang, W.Z.; Beauchemin, K.A.; Rode, L.M. Effects of grain processing, forage to concentrate ratio, and forage particle size on rumen ph and digestion by dairy cows. J. Dairy Sci. 2001, 84, 2203–2216. [Google Scholar] [CrossRef]
- Broderick, G.A.; Muck, R.E. Effect of alfalfa silage storage structure and rumen-protected methionine on production in lactating dairy cows. J. Dairy Sci. 2009, 92, 1281–1289. [Google Scholar] [CrossRef]
- Qian, W.; Ao, W.; Hui, X.; Wu, J. Lower dietary concentrate level increases bacterial diversity in the rumen ofcervus elaphusyarkandensis. Can. J. Microbiol. 2018, 64, 501–509. [Google Scholar] [CrossRef]
- Salonen, A.; Lahti, L.; Salojarvi, J.; Holtrop, G.; Korpela, K.; Duncan, S.H.; Date, P.; Farquharson, F.; Johnstone, A.M.; Lobley, G.E.; et al. Impact of diet and individual variation on intestinal microbiota composition and fermentation products in obese men. ISME J. 2014, 8, 2218–2230. [Google Scholar] [CrossRef] [PubMed]
- Rey, M.; Enjalbert, F.; Combes, S.; Cauquil, L.; Bouchez, O.; Monteils, V. Establishment of ruminal bacterial community in dairy calves from birth to weaning is sequential. J. Appl. Microbiol. 2014, 116, 245–257. [Google Scholar] [CrossRef] [PubMed]
- Evans, N.J.; Brown, J.M.; Murray, R.D.; Getty, B.; Birtles, R.J.; Hart, C.A.; Carter, S.D. Characterization of novel bovine gastrointestinal tract treponema isolates and comparison with bovine digital dermatitis treponemes. Appl. Environ. Microbiol. 2011, 77, 138–147. [Google Scholar] [CrossRef] [PubMed]
- Pitta, D.W.; Kumar, S.; Veiccharelli, B.; Parmar, N.; Reddy, B.; Joshi, C.G. Bacterial diversity associated with feeding dry forage at different dietary concentrations in the rumen contents of mehshana buffalo (bubalus bubalis) using 16s pyrotags. Anaerobe 2014, 25, 31–41. [Google Scholar] [CrossRef]
- Thomas, F.; Hehemann, J.; Rebuffet, E.; Czjzek, M.; Michel, G. Environmental and gut bacteroidetes: The food connection. Front. Microbiol. 2011, 2. [Google Scholar] [CrossRef]
- Solden, L.M.; Hoyt, D.W.; Collins, W.B.; Plank, J.E.; Daly, R.A.; Hildebrand, E.; Beavers, T.J.; Wolfe, R.; Nicora, C.D.; Purvine, S.O.; et al. New roles in hemicellulosic sugar fermentation for the uncultivated bacteroidetes family bs11. ISME J. 2017, 11, 691–703. [Google Scholar] [CrossRef]
- Liu, J.; Bian, G.; Sun, D.; Zhu, W.; Mao, S. Starter feeding altered ruminal epithelial bacterial communities and some key immune-related genes’ expression before weaning in lambs. J. Anim. Sci. 2017, 95, 910–921. [Google Scholar] [CrossRef]
- Jiao, J.; Huang, J.; Zhou, C.; Tan, Z. Taxonomic identification of ruminal epithelial bacterial diversity during rumen development in goats. Appl. Environ. Microbiol. 2015, 81, 3502–3509. [Google Scholar] [CrossRef]
- Mccabe, M.S.; Cormican, P.; Keogh, K.; O’Connor, A.; O’Hara, E.; Palladino, R.A.; Kenny, D.A.; Waters, S.M. Illumina miseq phylogenetic amplicon sequencing shows a large reduction of an uncharacterised succinivibrionaceae and an increase of the methanobrevibacter gottschalkii clade in feed restricted cattle. PLoS ONE 2015, 10, e133234. [Google Scholar] [CrossRef]
- Shang, Q.; Shan, X.; Cai, C.; Hao, J.; Li, G.; Yu, G. Dietary fucoidan modulates the gut microbiota in mice by increasing the abundance of lactobacillus and ruminococcaceae. Food Funct. 2016, 7, 3224–3232. [Google Scholar] [CrossRef]
- Haas, K.N.; Blanchard, J.L. Kineothrix alysoides, gen. nov.; sp. nov.; A saccharolytic butyrate-producer within the family lachnospiraceae. Int. J. Syst. Evol. Microbiol. 2017, 67, 402–410. [Google Scholar] [CrossRef] [PubMed]
- Stevenson, D.M.; Weimer, P.J. Dominance of prevotella and low abundance of classical ruminal bacterial species in the bovine rumen revealed by relative quantification real-time pcr. Appl. Microbiol. Biotechnol. 2009, 83, 987–988. [Google Scholar] [CrossRef]
- Petri, R.M.; Schwaiger, T.; Penner, G.B.; Beauchemin, K.A.; Forster, R.J.; McKinnon, J.J.; McAllister, T.A. Characterization of the core rumen microbiome in cattle during transition from forage to concentrate as well as during and after an acidotic challenge. PLoS ONE 2013, 8, e83424. [Google Scholar] [CrossRef] [PubMed]
- Jami, E.; Mizrahi, I. Composition and similarity of bovine rumen microbiota across individual animals. PLoS ONE 2012, 7, e33306. [Google Scholar] [CrossRef] [PubMed]
- Golder, H.M.; Denman, S.E.; McSweeney, C.; Wales, W.J.; Auldist, M.J.; Wright, M.M.; Marett, L.C.; Greenwood, J.S.; Hannah, M.C.; Celi, P.; et al. Effects of partial mixed rations and supplement amounts on milk production and composition, ruminal fermentation, bacterial communities, and ruminal acidosis. J. Dairy Sci. 2014, 97, 5763–5785. [Google Scholar] [CrossRef] [PubMed]
- Creevey, C.J.; Kelly, W.J.; Henderson, G.; Leahy, S.C. Determining the culturability of the rumen bacterial microbiome. Microb. Biotechnol. 2014, 7, 467–479. [Google Scholar] [CrossRef]
- Gorka, P.; Kowalski, Z.M.; Pietrzak, P.; Kotunia, A.; Kiljanczyk, R.; Flaga, J.; Holst, J.J.; Guilloteau, P.; Zabielski, R. Effect of sodium butyrate supplementation in milk replacer and starter diet on rumen development in calves. J. Physiol. Pharmacol. 2009, 60, 47. [Google Scholar] [CrossRef]
- Kopečný, J.; Zorec, M.; Mrázek, J.; Kobayashi, Y.; Marinšeklogar, R. Butyrivibrio hungatei sp. Nov. And pseudobutyrivibrio xylanivorans sp. Nov.; Butyrate-producing bacteria from the rumen. Int. J. Syst. Evol. Microbiol. 2003, 53, 201–209. [Google Scholar] [CrossRef]


| Items | HE5 | LE5 | ||
|---|---|---|---|---|
| HP5 | LP5 | HP | LP | |
| Ingredients, % | ||||
| Maize | 49.3 | 62 | 20 | 31.1 |
| Wheat bran | 4.4 | 0 | 16.5 | 14.5 |
| Soybean meal | 7.3 | 0 | 20.5 | 11.3 |
| Alfalfa meal | 35 | 31 | 0 | 0 |
| Straw meal | 0 | 3 | 38 | 38 |
| Limestone | 0 | 0 | 1 | 1.1 |
| Premix 1 | 4 | 4 | 4 | 4 |
| Total | 100 | 100 | 100 | 100 |
| Nutrients 2, % of DM | ||||
| DM 3 | 87.17 | 86.96 | 88.62 | 88.34 |
| ME, MJ/kg | 10.92 | 10.92 | 8.64 | 8.64 |
| CP | 15.74 | 11.78 | 15.72 | 11.82 |
| RDP | 8.75 | 5.96 | 7.47 | 5.27 |
| EE | 3.38 | 3.42 | 1.97 | 2.13 |
| NDF | 23.35 | 22.20 | 45.71 | 44.49 |
| ADF | 14.36 | 13.73 | 25.86 | 25.00 |
| NFC 4 | 47.04 | 52.85 | 26.91 | 32.48 |
| NFC/NDF | 2.01 | 2.38 | 0.59 | 0.73 |
| RDP/ME, g/MJ | 8.01 | 5.46 | 8.65 | 6.10 |
| Ca | 1.09 | 0.99 | 0.92 | 0.93 |
| TP | 0.60 | 0.53 | 0.63 | 0.59 |
| Items | HE1 | LE1 | SEM | p-Value 2 | ||||
|---|---|---|---|---|---|---|---|---|
| HP 1 | LP 1 | HP | LP | E | P | E × P | ||
| Initial body weight, kg | 14.95 | 14.84 | 14.99 | 15.02 | 0.26 | 0.636 | 0.870 | 0.773 |
| Final body weight, kg | 29.90 a | 29.46 a | 27.51 b | 27.81 b | 0.58 | 0.003 | 0.891 | 0.488 |
| Average daily gain, g/d | 249.24 a | 243.63 a | 208.53 b | 213.05 b | 6.73 | 0.000 | 0.930 | 0.421 |
| Dry matter intake, g/d | 1235.17 | 1259.16 | 1260.10 | 1275.03 | 15.98 | 0.184 | 0.204 | 0.759 |
| Ratio of feed to gain | 4.97 b | 5.18 b | 6.05 a | 6.00 a | 1.65 | 0.000 | 0.602 | 0.410 |
| Parameter | HE 2 | LE 2 | SEM | p-Value 3 | ||||
|---|---|---|---|---|---|---|---|---|
| HP2 | LP2 | HP | LP | E | P | E × P | ||
| Fermentation Parameters | ||||||||
| pH | 7.05 | 6.94 | 7.28 | 7.26 | 0.08 | 0.115 | 0.695 | 0.786 |
| NH3-N, mmol/L | 19.02 | 10.60 | 9.00 | 11.76 | 1.99 | 0.276 | 0.479 | 0.174 |
| TVFA, mmol/L | 21.63 | 29.21 | 18.80 | 16.10 | 2.71 | 0.163 | 0.657 | 0.356 |
| Acetate, % | 64.39 bc | 62.70 c | 69.22 ab | 70.10 a | 1.10 | 0.003 | 0.812 | 0.452 |
| Propionate, % | 21.78 ab | 26.50 a | 13.67 c | 15.34 bc | 1.74 | 0.002 | 0.227 | 0.554 |
| Butyrate, % | 4.69 | 4.69 | 5.49 | 4.89 | 0.24 | 0.343 | 0.567 | 0.558 |
| Valerate, % | 0.79 a | 0.83 a | 0.41 b | 0.39 b | 0.08 | 0.010 | 0.956 | 0.841 |
| Isobutyrate, % | 3.70 bc | 2.56 c | 5.84 a | 4.79 ab | 0.51 | 0.030 | 0.242 | 0.961 |
| Isovalerate, % | 4.66 | 2.73 | 5.36 | 4.49 | 0.48 | 0.208 | 0.154 | 0.582 |
| Acetate/ Propionate | 3.05 b | 2.58 b | 5.32 a | 4.69 a | 0.37 | 0.001 | 0.320 | 0.883 |
| Rumen morphology | ||||||||
| Rumen weight, g | 639 | 609 | 499 | 516 | 30.17 | 0.069 | 0.917 | 0.694 |
| Ratio to complex stomach 1, % | 69.26 | 68.03 | 64.03 | 66.70 | 0.86 | 0.059 | 0.655 | 0.239 |
| Papillae Length, μm | 1137 | 1155 | 947 | 1254 | 67.96 | 0.743 | 0.255 | 0.308 |
| Papillae Width, μm | 105.00 | 93.33 | 96.43 | 120.59 | 4.53 | 0.322 | 0.503 | 0.071 |
| Mucosal thickness, μm | 44.82 | 36.65 | 42.66 | 44.34 | 1.58 | 0.399 | 0.326 | 0.146 |
| Base thickness, μm | 20.47 | 17.53 | 22.20 | 20.43 | 0.86 | 0.206 | 0.198 | 0.743 |
| Items | HE 1 | LE 1 | SEM | p-Value 2 | ||||
|---|---|---|---|---|---|---|---|---|
| HP 1 | LP 1 | HP | LP | E | P | E × P | ||
| OTUs | 241.67 b | 205.33 b | 440.67 a | 410.33 a | 31.57 | <0.01 | 0.064 | 0.852 |
| Ace | 281.33 b | 228.00 b | 483.00 a | 460.00 a | 34.07 | <0.01 | 0.053 | 0.383 |
| Chao1 | 294.00 b | 230.33 b | 489.68 a | 472.33 a | 34.82 | <0.01 | 0.080 | 0.287 |
| Shannon | 2.67 b | 3.04 b | 4.00 a | 3.99 a | 0.19 | <0.01 | 0.341 | 0.316 |
| Simpson | 0.19 a | 0.12 ab | 0.07 b | 0.05 b | 0.02 | <0.01 | 0.088 | 0.232 |
| Coverage | 0.998 ab | 0.999 a | 0.997 c | 0.997 bc | 0.00 | <0.01 | 0.468 | 0.855 |
| Taxon | HE 1 | LE 1 | SEM | p-Value 2 | ||||
|---|---|---|---|---|---|---|---|---|
| HP 1 | LP 1 | HP | LP | E | P | E × P | ||
| Proteobacteria | 41.90 a | 32.75 a | 2.15 b | 6.32 b | 5.61 | <0.01 | 0.663 | 0.26 |
| p_Succinivibrionaceae_uncultured | 36.16 a | 28.30 a | 0.11 b | 0.47 b | 5.14 | <0.01 | 0.341 | 0.300 |
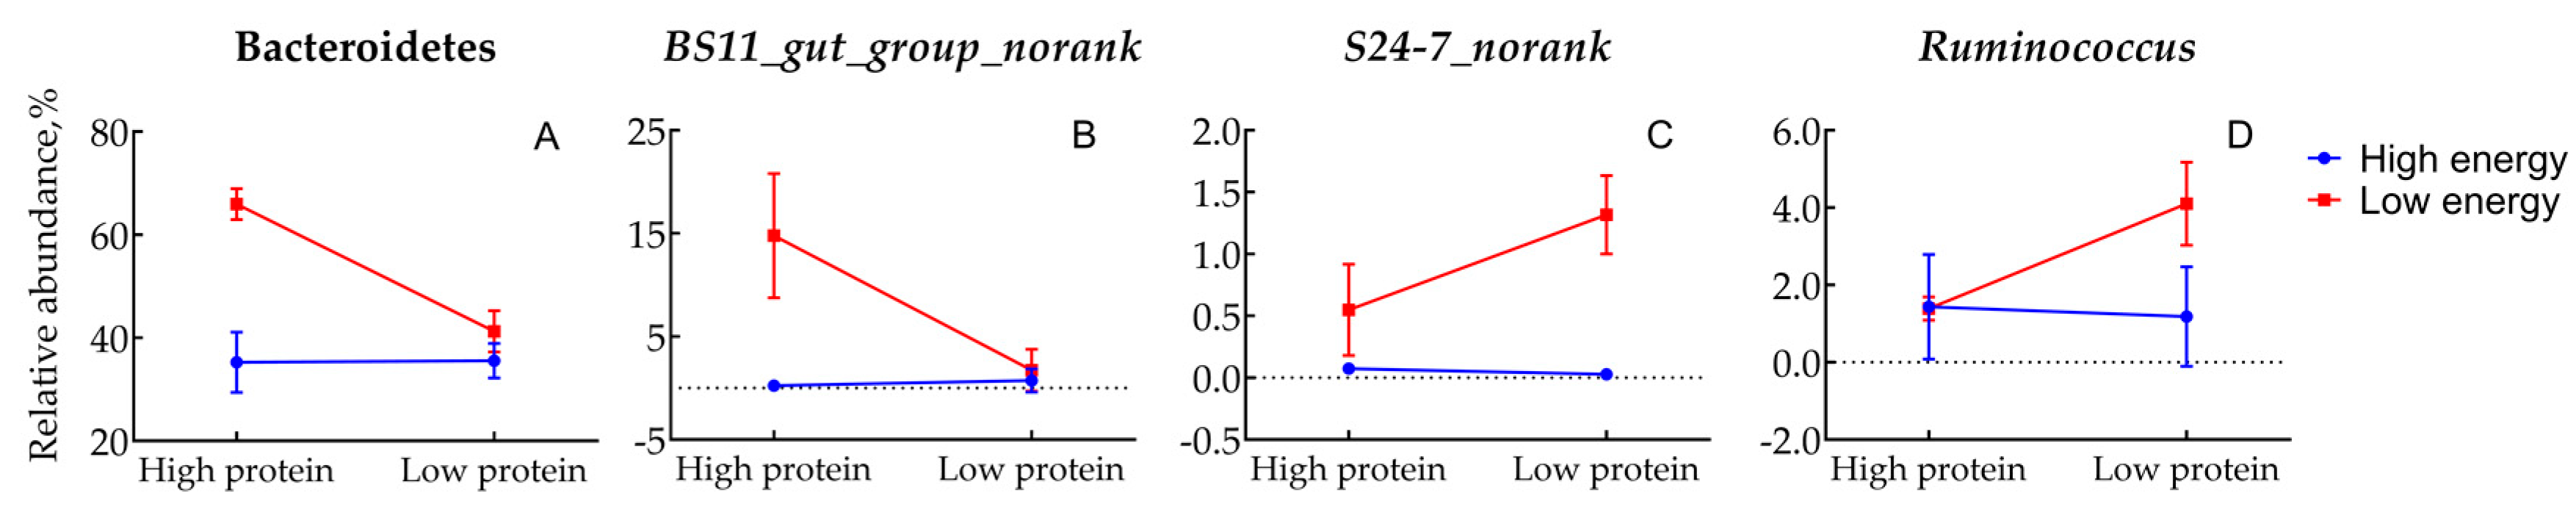
| Bacteroidetes | 35.25 b | 35.59 b | 65.94 a | 41.27 b | 3.94 | <0.01 | <0.01 | <0.01 |
| b_Bacteroidales_norank | 0.13 b | 0.00 b | 6.23 a | 6.03 a | 1.23 | 0.014 | 0.934 | 0.986 |
| b_BS11_gut_group_norank | 0.23 b | 0.73 b | 14.80 a | 1.73 b | 1.99 | <0.01 | <0.01 | <0.01 |
| b_S24.7_norank | 0.07 c | 0.03 c | 0.55 b | 1.32 a | 0.17 | <0.01 | 0.033 | 0.020 |
| Firmicutes | 20.98 b | 23.33 b | 25.87 b | 45.31 a | 3.62 | 0.029 | 0.063 | 0.129 |
| f_Lachnospiraceae_uncultured | 0.11 b | 0.30 b | 1.57 ab | 4.21 a | 0.61 | 0.012 | 0.127 | 0.178 |
| f_Pseudobutyrivibrio | 0.01 b | 0.05 b | 0.38 ab | 1.44 a | 0.23 | 0.038 | 0.156 | 0.184 |
| f_Ruminococcaceae_uncultured | 1.39 b | 1.76 b | 6.90 a | 6.51 a | 0.90 | <0.01 | 0.993 | 0.738 |
| f_Ruminococcus | 1.44 b | 1.18 b | 1.39 b | 4.10 a | 0.45 | 0.051 | 0.087 | 0.045 |
| f_Saccharofermentans | 0.18 b | 0.00 b | 1.57 a | 0.70 ab | 0.23 | 0.014 | 0.157 | 0.332 |
| Lentisphaerae | 0.03 b | 0.00 b | 1.27 a | 0.91 ab | 0.21 | <0.01 | 0.524 | 0.589 |
| l_RFP12_gut_group_norank | 0.03 b | 0.00 b | 1.13 a | 0.80 ab | 0.19 | 0.011 | 0.546 | 0.613 |
| OTU (Genus) | Associated with | Indicator Value | p-Value | Relative Abundance (%) |
|---|---|---|---|---|
| Succinivibrionaceae_uncultured | HE | 0.996 | 0.002 ** | 32.23 |
| Veillonellaceae_unclassified | HE | 0.996 | 0.002 ** | 2.90 |
| Veillonellaceae_uncultured | HE | 0.987 | 0.002 ** | 4.59 |
| Bacteroidales_norank | LE | 0.994 | 0.002 ** | 6.13 |
| Lachnospiraceae_uncultured | LE | 0.966 | 0.002 ** | 2.89 |
© 2020 by the authors. Licensee MDPI, Basel, Switzerland. This article is an open access article distributed under the terms and conditions of the Creative Commons Attribution (CC BY) license (http://creativecommons.org/licenses/by/4.0/).
Share and Cite
Lv, X.; Cui, K.; Qi, M.; Wang, S.; Diao, Q.; Zhang, N. Ruminal Microbiota and Fermentation in Response to Dietary Protein and Energy Levels in Weaned Lambs. Animals 2020, 10, 109. https://doi.org/10.3390/ani10010109
Lv X, Cui K, Qi M, Wang S, Diao Q, Zhang N. Ruminal Microbiota and Fermentation in Response to Dietary Protein and Energy Levels in Weaned Lambs. Animals. 2020; 10(1):109. https://doi.org/10.3390/ani10010109
Chicago/Turabian StyleLv, Xiaokang, Kai Cui, Minli Qi, Shiqin Wang, Qiyu Diao, and Naifeng Zhang. 2020. "Ruminal Microbiota and Fermentation in Response to Dietary Protein and Energy Levels in Weaned Lambs" Animals 10, no. 1: 109. https://doi.org/10.3390/ani10010109
APA StyleLv, X., Cui, K., Qi, M., Wang, S., Diao, Q., & Zhang, N. (2020). Ruminal Microbiota and Fermentation in Response to Dietary Protein and Energy Levels in Weaned Lambs. Animals, 10(1), 109. https://doi.org/10.3390/ani10010109