Abstract
In this study, the magnetic properties of magnetosomes isolated from lyophilized magnetotactic bacteria Magnetospirillum caucaseum SO-1 were assessed for the first time. The shape and size of magnetosomes and cell fragments were studied by electron microscopy and dynamic light scattering techniques. Phase and elemental composition were analyzed by X-ray and electron diffraction and Raman spectroscopy. Magnetic properties were studied using vibrating sample magnetometry and electron paramagnetic resonance spectroscopy. Theoretical analysis of the magnetic properties was carried out using the model of clusters of magnetostatically interacting two-phase particles and a modified method of moments for a system of dipole–dipole-interacting uniaxial particles. Magnetic properties were controlled mostly by random aggregates of magnetosomes, with a minor contribution from preserved magnetosome chains. Results confirmed the high chemical stability and homogeneity of bacterial magnetosomes in comparison to synthetic iron oxide magnetic nanoparticles.
1. Introduction
Because of its unique magnetic properties and due to a large number of organisms across biological domains capable of producing it, biogenic magnetite has attracted a constant interest since its discovery [1,2,3,4]. Due to its wide distribution in nature, one of the most studied magnetite producers is magnetotactic bacteria (MTB) biomineralizing nanosized to submicron single crystals of magnetite in special organelles, referred to as magnetosomes that are responsible for MTB magnetoreception [3]. During the subsequent fossilization of dead MTB, magnetofossils are formed carrying paleomagnetic signal in a variety of sedimentary environments, from brackish and freshwater [5,6,7,8] to marine [9,10,11]. Stable remanent magnetization of magnetofossils is carried by single-domain [12,13] and exceptionally [14] pseudo-single-domain magnetite, which, due to the chemical composition and shape of individual magnetite crystals and of their chains, can, under certain environmental conditions, persist for a geologically long time. The stability of the magnetization of magnetite crystals in chains is primarily controlled by magnetostatic interaction which ensures that even grains with a size of about 30 nm have their magnetic moments in the blocked state [15,16]. The advantages of the physicochemical and biological properties of bacterial magnetosomes relative to synthetic magnetic nanoparticles are giving rise to growing interest from medical science [17].
Magnetic properties of biogenic magnetite from magnetofossils are studied using standard paleo- and rock magnetism methods such as alternating fields or, in some cases, thermal demagnetization, and measurement of hysteresis loops, isothermal remanent magnetization acquisition curves, and saturation isothermal remanent magnetization (SIRM) demagnetization by dc magnetic field of the opposite sign (backfield curves). More advanced approaches include construction of first-order reversal curve diagrams [18,19], SIRM measurements at cryogenic temperatures [20], and ferromagnetic resonance (FMR) spectroscopy [21]. The influence of the external environment leads to a change in the chemical composition and structure of biogenic magnetite: Stable under slightly alkaline conditions of sea bottom sediments [22], it is partially or completely converted to maghemite during oxidation in freshwater conditions [6]. In the case of an increase in the oxygen content, coercive force of the particles tends to decrease [8]. The acidic environment determines the predominantly isotropic shape of magnetite crystals [23]. At an ambient temperature, coercivity of remanence Hcr is between 10–50 mT, and the ratio of remanent saturation magnetization to saturation magnetization Mrs/Ms is 0.4–0.5 for most of described types of MTB [24,25,26,27,28].
A comparative study of the magnetic properties of whole MTB cells and isolated magnetosomes revealed their significant difference. In particular, for Magnetospirillum magneticum AMB-1 [29], the ratios Hcr/Hc = 1.25 and Mrs/Ms = 0.46 for the whole cell sample and Hcr/Hc = 1.5 and Mrs/Ms = 0.33 for the isolated magnetosome sample. The difference may be due to the predominance of uniaxial single-domain behavior in the case of the whole cell sample and increasing contribution of superparamagnetic behavior in the case of the isolated magnetosome sample. Resonance curves obtained by FMR spectroscopy differ for intact MTB culture, surface sediments, and magnetofossils located at various depth, and also depend on the asymmetry ratio of magnetite crystals [30]. The temperature of the Verwey transition characteristic of magnetite [31] in the case of MTB ranged between 90–120 K [24,25,26,32,33,34], with lower values corresponding to more oxidized varieties [24].
In this study, we described for the first time the morphology, crystallography, and magnetic properties of bacterial magnetosomes produced by Magnetospirillum caucaseum SO-1, one of the high-productivity MTB strains that is promising for future biomedical applications.
2. Materials and Methods
2.1. Bacterial Strain and Culture Conditions
Lyophilized non-pathogenic magnetotactic bacteria Magnetospirillum caucaseum SO-1 was obtained from the collection of Institute of Bioengineering, Research Center of Biotechnology of the Russian Academy of Sciences, Moscow. The strain was firstly isolated from a sediment sample from the Ol’khovka River, Kislovodsk, Caucasus, Russia [35]. The medium included (per liter of medium): 0.7 g of KH2PO4, 0.5 g of sodium succinate, 0.1 g of yeast extract, 0.35 g of NaNO3, 10 mL of 0.01 M ferric citrate, and 0.05 g of sodium thioglycolate. pH constituted 6.75. The bacteria were cultivated at 28 °C under microaerobic conditions (~1% oxygen in nitrogen) in a 15-L fermenter for 3–4 days. As reported previously, Magnetospirillum caucaseum SO-1 could not grow aerobically in the absence of a reducing agent, in contrast with one of the most frequently cultivated strain Magnetospirillum magneticum AMB-1 [35]. The strain SO-1 is characterized with wide growth temperature range of 18–42 °C with the optimum at 28 °C. In addition, it demonstrates high tolerance to oxygen (up to 21%) and ability to grow at various substrates including tartrate, propionate, butyrate, and glycerol [35]. Besides the potential biotechnological application of strain SO-1, its magnetofossils can be considered as potential carriers of paleomagnetic and/or paleoenvironmental signals in the geographical area of their habitat, North Caucasus, Russia.
Lyophilization of MTB and isolation of bacterial magnetosomes were obtained according to the protocol described in [36]. After achieving growth stationary phase Magnetospirillum caucaseum SO-1 cells were centrifuged 10,000× g for 10 min at +4 °C, resuspended in 20 mM of HEPES buffer, pH 7.4, containing 4 mM of EDTA and 0.1 mM of phenylmethylsulfonyl fluoride (PMSF) and disrupted by sonication (Sonopuls, Bandelin, Germany). Magnetosomes were isolated from disrupted cell fractions using a neodymium–iron–boron (Nd-Fe-B) magnetic stand and washed 15 times with 20 mM of HEPES buffer, pH 7.4. Finally, magnetosomes were resuspended in the same buffer and stored at +4 °C. The portion of purified magnetosomes was dried at 105 °C and weighted, thus evaluating the concentration of the remaining portion.
For measurements, the powder of isolated magnetosomes with a mass of 5.1 mg was divided into 5 parts in order to carry out, in parallel, studies of shape and size, chemical composition, crystal structure, and magnetic properties, as well as to avoid the effect of magnetite oxidation (maghemitization) on the experimental results.
Additionally, lyophilizate of MTB cell fragments was used for electron microscopy analysis to visualize cells form and to prove the presence of magnetosomes chains in the cell fragments in order to explain the magnetic properties.
2.2. Physico-Chemical Characterization of Magnetosomes and Cell Fragments
2.2.1. X-ray Diffraction
Crystal structure analysis of isolated bacterial magnetosomes has been performed by X-ray diffraction (XRD) using a D2 Phaser diffractometer (Bruker, Billerica, MA, USA). One milligram of magnetosomes was mixed with petrolatum and then used for the analysis. The obtained XRD patterns were processed using the PDXL-2 software package (Rigaku, Tokyo, Japan) with the PDF-2 XRD database (International Center for Diffraction Data, 2011).
2.2.2. Raman Spectroscopy
Phase composition of the isolated magnetosomes was additionally studied by Raman spectroscopy using a LabRam HR800 instrument (Horiba Jobin-Yvon, Kyoto, Japan). The second harmonic of a Nd:YAG laser (excitation wavelength 532 nm) was used as an excitation source. Laser radiation was focused on the sample surface into a spot with a diameter of ~1–2 μm. The same amount of the sample was used further for the transmission electron microscopy studies, since possible thermal destruction was negligible and could not influence the shape and size of magnetosomes.
2.2.3. Electron Microscopy
The shape and size of the isolated magnetosomes and of the MTB cells fragments were studied by scanning electron (SEM) and transmission electron (TEM) microscopies using Quanta Inspect F50 (FEI Company, Eindhoven, The Netherlands) and JEM-2100F (JEOL, Tokyo, Japan) electron microscopes, respectively. In addition, X-ray energy dispersive analysis (EDX) of the elemental composition of the sample and visualization of the internal structure of lyophilized MTB by high-angle annular dark-field scanning transmission electron microscopy (HAADF STEM) were carried out using a JEM-2100F microscope. The sample for SEM studies was fixed using graphite-conductive double-sided tape and distributed evenly by non-magnetic tweezers. Samples for TEM studies were prepared by depositing the material on a standard copper TEM grid with an ultra-thin amorphous carbon backing film.
2.2.4. Dynamic Light Scattering
The particle size distribution of the isolated magnetosomes was assessed by dynamic light scattering (DLS) using original measuring equipment developed at Peter the Great St. Petersburg Polytechnic University [37]. For measurements, a sample of 1 mg of isolated magnetosomes was resuspended in distilled water. Large aggregates fraction was separated using sedimentation during 720 h. The magnetosomes suspension was additionally homogenized just before measurements using ultrasonic bath Codyson CD-6800 (Shenzhen Codyson Electrical Co., Ltd., Shenzhen, China) for 10 min at ultrasonic power 50 W and frequency 42 kHz.
2.2.5. Static Hysteresis and Thermal Magnetic Properties
The sample for magnetic measurements was the powder of isolated magnetosomes in amount of 1 mg pressed into a polymeric cylindrical sample holder with an outer diameter of 3 mm and a length of 6 mm. The paramagnetic signal was subtracted when constructing the hysteresis curve. Saturation isothermal remanent magnetizations (SIRM) acquired in a 5-T field at 5 K after zero field cooling (ZFC) and cooling in a strong (5 T) field (FC), respectively, were traced during the subsequent warming to 300 K in a zero field. SIRM acquired in a 5-T field at 300 K was measured during the zero-field cooling-warming cycle between 300 and 5 K. These experiments were carried out using a Quantum Design (US) MPMS 3 instrument in the vibration sample magnetometer (VSM) mode, with temperature sweeping at 2 K/min. A (near-) zero field to acquire the remanent magnetization was produced by setting the 2.7-mT nominal field in the MPMS “No overshot’ mode. Measurements of the Pd standard sample at 298 K showed that this procedure generally yields a residual field below 10 µT. The magnetic hysteresis loop in a 7-T maximum field and the backfield curve of SIRM acquired in a 5-T field were measured at 295 K using the same instrument.
2.2.6. Electron Paramagnetic Resonance Spectroscopy
The electron paramagnetic resonance (EPR) of the samples was analyzed on a spectrometer Bruker EPR ELEXSYS E580 (X-BAND). The measurements were carried out in the standard mode with a modulation frequency of 100.00 kHz and a modulation amplitude of 0.5 mT at a 15.00 mW microwave power: The measurement time was 600 s and the temperature was 295 ± 1 K. Magnetic field was swept at a 0.166 mT/s rate. If necessary, the spectrum was accumulated. Spectra were processed using the Xepr and Origin 9 software package. Regardless of the signal-to-noise ratio, at the first stage, an EPR spectrum was smoothed using Savitsky–Golay algorithm [38].
2.2.7. Theoretical Modeling
Theoretical analysis of the magnetic properties was carried out using the model of clusters of magnetostatically interacting two-phase particles [39]. Theoretical values of saturation magnetization and remanent saturation magnetization were calculated using a modified method of moments for a system of dipole–dipole-interacting uniaxial particles, as in [40,41].
3. Results and Discussion
3.1. Morphology and Chemical Composition
SEM and TEM images of the lyophilized Magnetospirillum caucaseum SO-1 are shown in Figure 1.
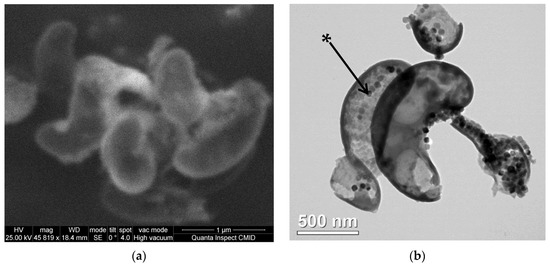
Figure 1.
Electron microscopy images of lyophilized cell fragments of magnetotactic bacteria Magnetospirillum caucaseum SO-1: (a) Scanning electron microscopy image; (b) transmission electron microscopy image. The magnetosome in a cell fragment is marked with an asterisk.
As it can be seen from the images, lyophilized MTB cell fragments have the length of about 0.7–1.4 µm and a width of about 0.2–0.5 µm. The results are in general correlation with the previously reported [35], 0.3-µm-wide and 1.2–3.0-µm-long spiral-shaped motile, bipolarly flagellated cells. Magnetosomes form chains, characteristic of spirilla of the genus Magnetospirillum [42], which can be seen in lyophilized MTB. MTB cell fragments contain single chains of magnetosomes in accordance with the literature data [35] and also aggregates of magnetosomes not organized in chains.
Results of the analysis of the elemental composition of the lyophilized MTB by EDX method, and X-ray maps of iron distribution obtained by STEM are presented in Figure 2.
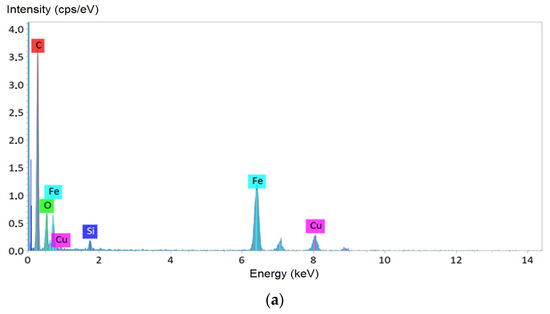
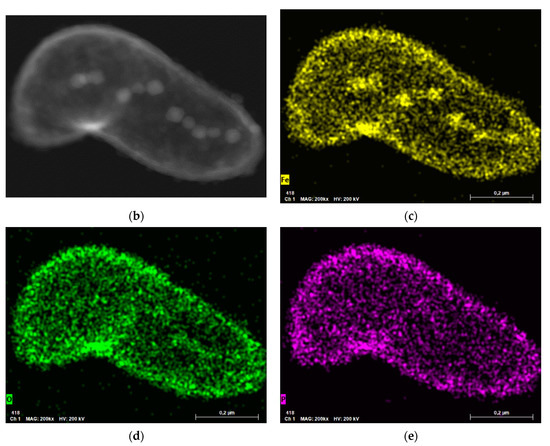
Figure 2.
Analysis of the elemental composition of magnetotactic bacteria (MTB) lyophilizate: (a) X-ray energy dispersive analysis results; (b) internal structure of MTB cell fragment; (c–e) X-ray Fe, O, and P mapping of an MTB cell, respectively.
Elemental composition of the MTB lyophilizate confirmed that the observed crystal grains were iron-containing inclusions, and not, e.g., granules of phosphates or hydroxides, also formed by MTB [43], since there was no evidence of P in the X-ray map. The copper peaks observed in the spectra arose due to a relatively massive copper support grid of the TEM sample. Silicon peaks may be the contribution of the supporting film of the TEM sample, but there was no reliable explanation within the framework of the current study, and therefore it requires further investigations to confirm or to exclude the presence of this element in the form of amorphous silica or other chemical compounds in the MTB lyophilizate.
The results of TEM analysis of the isolated magnetosomes are shown in Figure 3.
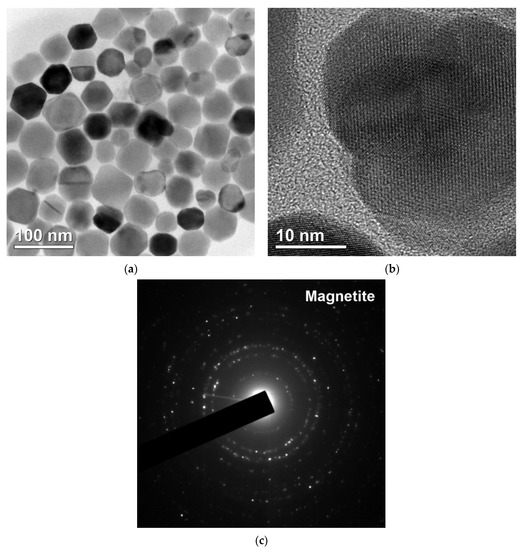
Figure 3.
Transmission electron microscopy images of the isolated magnetosomes: (a) crystals of magnetosomes without membrane, (b) crystal lattice of an individual magnetite grain, (c) electron diffraction pattern.
The shape of the isolated magnetosomes was close to cube-octahedral, and the characteristic sizes were 40–60 nm, in agreement with the previously obtained data [44,45,46].
The presence of both isolated magnetosomes and their aggregates resulted in a multimodal particle size distribution obtained by the DLS method (Figure 4). A local intensity maximum at about 100 nm corresponded to an average hydrodynamic diameter of individual magnetosomes. The next maximum at 200 nm may indicate the formation of aggregates of several isolated magnetosomes due to disruption of membrane integrity, since under the condition of membrane integrity magnetosomes isolated from MTB were characterized by high aggregate stability [47]. Particle size distribution, obtained for synthetic magnetite-silica nanoparticles using the same DLS technique, is shown in Figure 4b.
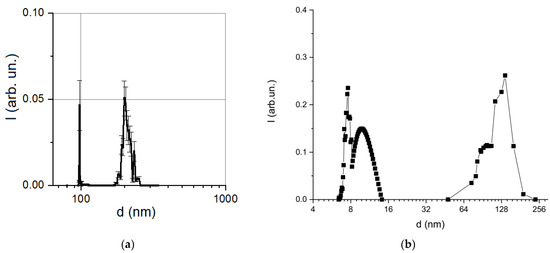
Figure 4.
Comparison of particle size distribution obtained by the dynamic light scattering method: (a) the isolated bacterial magnetosomes; (b) synthetic magnetite-silica nanoparticles (reprinted from [37], Velichko, E.; Nepomnyashchaya, E.K.; Gareev, K.G.; Martínez, J.; Maicas, M.C. Characterization of Magnetite–Silica Magnetic Fluids by Laser Scattering. Appl. Sci. 2021, 11, 183, doi:10.3390/app11010183, license CC BY 4.0).
As shown in Figure 4b, the size distribution of the synthetic nanoparticles was also bimodal and was much wider due to the aggregation processes provoked by dilution [37]; therefore, as compared to the studied bacterial magnetosomes, such synthetic nanoparticles were not suitable for biomedical use.
XRD and Raman spectroscopy were used to confirm the crystal structure and chemical composition of bacterial magnetite grains. The results are shown in Figure 5 and Figure 6, respectively. Crystals appeared to consist of magnetite (98%) and minor goethite (2%). The convergence factor of the calculated and experimental X-ray profiles is as follows:
where yi is the intensity at each experimental point of the X-ray diffraction pattern. The lattice parameter of magnetite was a = 0.8388 nm, which was slightly lower than the value for the stoichiometric composition (0.8398 nm, [48]) and approximately corresponded to the formula Fe2.95O4.05 [49].
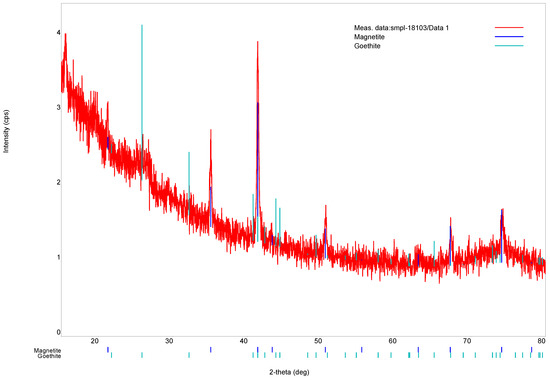
Figure 5.
X-ray diffraction pattern of the isolated magnetosomes.
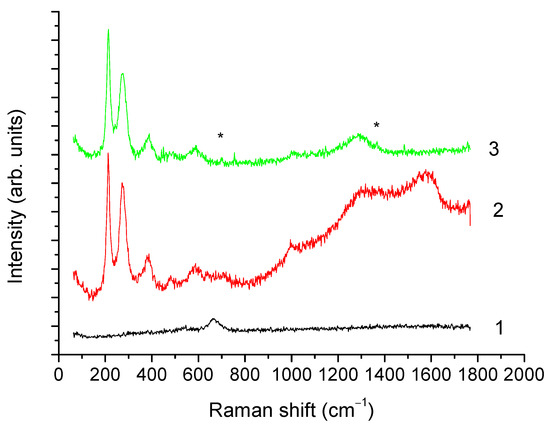
Figure 6.
Raman spectra of the isolated magnetosomes; obtained at laser power 0.08 (curve 1), 0.8 (curve 2), and 2 mW (curve 3). * The 700 and 1370 cm−1 bands.
XRD results are confirmed by the Raman spectroscopy data (Figure 6). At the minimum laser power (curve 1, laser power 0.08 mW), a single band at 670 cm−1 was observed, attributed to A1g vibrations of magnetite [50]. Under the action of 0.8 mW power laser radiation (curve 2), annealing of the sample was observed, leading to the appearance of narrow lines in the range from 200 to 500 cm−1 and of broad bands between 1200 and 1650 cm−1. Presence of narrow lines with maxima near 220, 247, 412, and 498 cm−1 indicated the recrystallization of magnetite into hematite. The appearance of broad bands in the range from 1200 to 1650 cm−1, characteristic of various forms of carbon, may be related to the presence of organic matter. Further increase of the laser radiation power to 2 mW carried out for laser annealing of the sample (curve 3) similar to [50], led to a decrease in the intensity of the 1200 to 1650 cm−1 bands, likely caused by a partial removal of organic matter of magnetosomes membrane, whereas the lines characteristic of hematite remained unchanged.
It is worth noting that the observed shift of hematite lines towards lower frequencies relative to the bulk material [51] is characteristic of nanosized iron oxide particles [50,52]. In addition, in the spectra after laser annealing, narrow low-intensity lines near 700 and 1370 cm−1 (marked with asterisks) were observed, which may indicate the coexistence of maghemite (characteristic lines 700, 1370, 1560 cm−1) and hematite (lines 220, 247, 412, 498, 613, 1320 cm−1) phases.
Concordant results yielded by the above analytical methods indicate that the main volume of the isolated magnetosomes crystalline phase consisted of magnetite with grain size ranging from tens to the first hundreds of nm. Furthermore, despite the partial destruction of the magnetosome membrane, magnetite is characterized by a high chemical stability incomparable with respect to the chemical stability of synthetic nanoparticles subject to intense maghemitization [41].
3.2. Magnetic Properties
The static hysteresis loop and SIRM backfield curve measured at 295 K are shown in Figure 7. The hysteresis parameters were as follows: saturation magnetization was Ms = 20.46 Am2/kg; saturation remanent magnetization Mrs = 4.11 Am2/kg; their ratio (squareness) Mrs/Ms = 0.201; coercive force μ0Hc = 9.09 mT; remanent coercivity μ0Hcr = 16.03 mT; and ratio Hcr/Hc = 1.76. The value of saturation magnetization, Ms, was about 20% of the saturation magnetization of magnetite or about 26% of that of maghemite [53]. Hc and Hcr values lay in the range reported in the literature. On the other hand, the Mrs/Ms ratio was approximately two times lower than for magnetosomes isolated from cells of other representatives of the genus Magnetospirillum (Table 1) and was closer to that for synthetic interacting single-domain magnetite particles [54]. The main reason for this discrepancy seemed to be that in our samples, magnetosome chains were mostly dismembered and, in fact, we were dealing with nearly isometric clusters of magnetite particles (cf. Figure 3a).
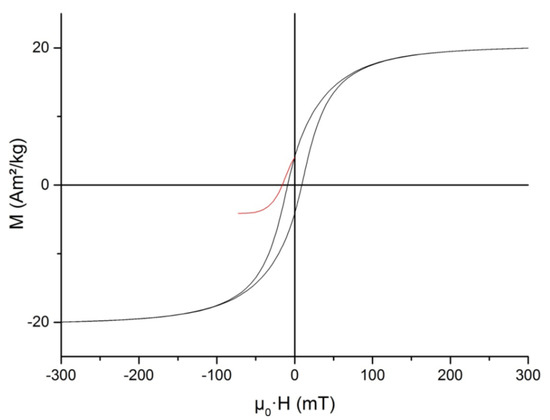
Figure 7.
Central part of static hysteresis loop and saturation isothermal remanent magnetization backfield curve of the isolated magnetosomes measured at 295 K.

Table 1.
Comparison of the hysteresis characteristics of bacterial magnetosomes isolated from various species (strains) of MTB at room temperature.
Another reason for a decrease of the Mrs/Ms ratio may be partial oxidation of magnetite grains, which manifested itself in a significant, down to 89.8 K, decrease in the Verwey transition temperature (Figure 8a) compared to the 125 K characteristic of stoichiometric magnetite [59].
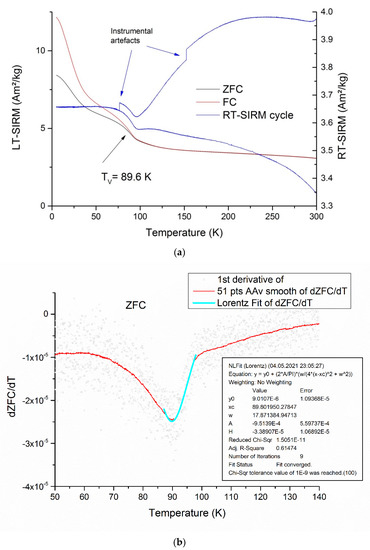
Figure 8.
Thermal magnetic properties of the isolated magnetosomes: (a) zero field cooling (ZFC) and cooling in a strong (5 T) field remanence curves (left ordinate axis) and zero-field cycling of saturation isothermal remanent magnetization given at 300 K; (b) determining the Verwey transition temperature by Lorentz approximation of ZFC/dT temperature dependence.
A relatively fast decrease of SIRM given at a low (say, 10 K and below) temperature with a gentle break-in-slope at 40–50 K is a hallmark of nonstoichiometric magnetite, both of inorganic [53,60,61] and of biogenic origin [33,62,63]. A Tv value of about 90 K corresponded to Fe3(1–δ)O4 compositions with δ = 0.008–0.012 [64,65], which generally agreed with that inferred from the XRD data. It is worth noting that Mrs/Ms values of the order of 0.2, which are not typical for magnetosome chains, are known to occur for nonstoichiometric magnetite with a grain size of about 40 nm [53,60].
Figure 9 shows the EPR spectrum of the isolated magnetosomes (a) and its approximation with two individual bands using the Gaussian function (b).
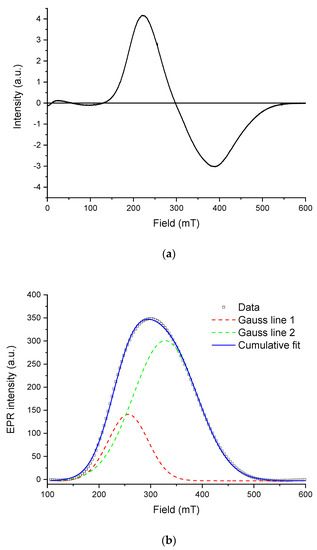
Figure 9.
Electron paramagnetic resonance (EPR) spectroscopy of the isolated magnetosomes: (a) EPR spectrum measured at room temperature; (b) decomposition of the first derivative (solid line) of the EPR signal (absorption spectrum) into two Gaussian components (colored dashed lines). Bold line shows the cumulative fit.
The spectrum is an asymmetric inhomogeneously broadened line (∆Bpp~167 mT), with the shape characteristic for EPR spectra of Fe3+ cations coupled by a strong exchange interaction between ions in different charge states [66]. This shape of the resonance curve is commonly observed in magnetite from fossilized MTB [21,67,68], where the grains have a lognormal size distribution and are arranged mainly in chaotic aggregates rather than in ordered chains [69], in agreement with electron microscopy observations. The spectrum can be decomposed into two symmetric Gaussian components with g-factors of 2.01 and 2.32, respectively. This may be viewed as evidence for the presence of two types of particles and/or their aggregates in the sample. In this line, it is noteworthy that oxidation of magnetite in magnetofossils is expressed in the EPR spectra by a significant increase of the effective g-factor, which is close to 2.00 for stoichiometric magnetite [28,68,70].
3.3. Theoretical Modeling
In accordance with DLS data (Figure 4), for further modeling of the magnetic characteristics, aggregates about 100–200 nm in size, containing 1 or 2 isolated magnetosomes which correspond to both maxima in Figure 4a, were assumed.
The characteristic size of individual grains in both aggregates (cf. Figure 3) was assumed to be 40 nm. For an aggregate of the first type, in which approximately 10 grains were arranged in a chain, the size of the cluster (cylinder) corresponded to the size of the bacterium (Figure 1) with the height of about 750 nm and the diameter of about 300 nm. For an aggregate of the second type, in which we assume a uniform distribution of grains of the same size (40 nm), the height and diameter of the cluster were chosen to be about 6 µm. From Figure 4, the relative volumetric fractions of two types of aggregates (clusters) were estimated to be 0.06 and 0.94, respectively.
The theoretical value of the magnetization reversal field (microcoercivity) of an isometric single-domain magnetite grain , where J/m3 is the constant of crystallographic anisotropy and kA/m is the spontaneous saturation magnetization [71]. This corresponds to μ0H0 = 37.5 mT. Experimentally, average microcoercivity was expected to be close to a measured value of remanent coercivity. Our experimental value of the latter was μ0Hcr = 16.0 mT. In the case of an aggregate of the first type, remanent coercivity Hcr can be estimated using the Jacobs–Bean model [72] for a chain of 10 magnetic spheres as follows:
- (1).
- With parallel rotation of the magnetic moments of the spheres (μ0Hc1 = 62.9 mT);
- (2).
- With fan-shaped magnetization reversal (μ0Hc2 = 25.3 mT).
The size of single-domain magnetite of spherical shape is 29–36 nm [54]. In our case, grains have not spherical but parallelepipedal form and their characteristic size exceeds 40 nm. It should be noted that the presence of goethite according to the XRD data (see Figure 5) and the fact that the characteristic grain size exceeds the size of single-domain magnetite leads to nonuniform distribution of the magnetic moment in the grain. This leads to an underestimation of the spontaneous saturation magnetization Is of the grain. Taking into consideration the chemical and magnetic inhomogeneity of distribution of the magnetic moment in the grain and the relative contribution of the two types of aggregates to the magnetic parameters, based on the model of magnetostatically interacting two-phase particles [40,41], measurements of static hysteresis loops consistent with the experimental data were carried out (see Paragraph 3.2 and Figure 7) theoretical modeling of these parameters (Ms, Mrs, Hc Hcr).
If we assume that the effective (average) spontaneous magnetization Ieff of a two-phase “magnetite/goethite” grain in a ratio of 0.98/0.02 at saturation is about 450 kA/m, then the best agreement with experiment is achieved at the following values of the parameters:
- (1).
- By remanent magnetization Mrs − Ieff (chain) = 380 kA/m, Ieff (group) by Mrs = 280 kA/m and average over the sample Ieff (theory) = 286 kA/m;
- (2).
- In coercivity Hcr − μ0H0(chain) = 41 mT, μ0H0(group) = 15 mT, and average over the sample μ0Hcr (theory) = 16.5 mT.
Therefore, it can be assumed that magnetostatically interacting grains in the isolated bacterial magnetosomes are chemically and magnetically inhomogeneous, which leads to a decrease in magnetization and average coercivity of the sample.
4. Conclusions
We experimentally for the first time studied the morphology, chemical composition, and magnetic properties of magnetosomes isolated from magnetotactic bacterium Magnetospirillum caucaseum SO-1, a high-productivity MTB strain which is promising for various biomedical applications. Magnetofossils of SO-1 can be considered as potential carriers of paleomagnetic and/or paleoenvironmental signals in the local geographical area of their habitat. Despite the absence of special conditions such as an inert atmosphere and controlled storage medium pH, the bacterial magnetosomes demonstrated very high aggregate and chemical stability and changed only slightly compared to the reference one for this MTB species and compared to the synthetic iron oxide nanoparticles.
Bacterial magnetite grains apparently become considerably oxidized at the surface, as indicated by the presence of goethite, while the grain volume develops a weaker (the volume of the crystal becomes smaller), of the order of δ = 0.008–0.012 in the Fe3(1–δ)O4 formula, a deviation from stoichiometry which manifests itself in a decrease in the Verwey transition temperature to 89.8 K. Magnetic properties of the sample appeared to be controlled mostly by random aggregates of magnetosomes, with a minor contribution from preserved magnetosome chains, and showed a striking contrast with the properties of isolated, non-interacting single-domain particles of magnetite. Chemical and, by inference, magnetic properties of magnetofossils were thus expected to be highly stable compared to abiogenic magnetite particles.
Author Contributions
Conceptualization, K.G.G.; methodology, K.G.G., D.S.G., P.V.K., A.K., V.V.K., and E.S.S.; validation, M.S. and G.M.; investigation, D.A.K., V.V.K., V.S.L., E.K.N., A.V.N., A.N., E.S.S., S.M.S., E.I.T., and V.V.T.; resources, V.V.K.; data curation, P.V.K. and A.K.; writing—original draft preparation, K.G.G.; writing—review and editing, D.S.G., P.V.K., A.K., V.V.K., G.M., E.S.S., and M.S.; funding acquisition, M.S. and G.M. All authors have read and agreed to the published version of the manuscript.
Funding
The study was supported by the Russian Foundation for Basic Research (RFBR) in accordance with the research project No. 19-08-00024 and DFG grant (SFB824/3) (G.M. and M.S.), Technische Universität München (TUM) within the DFG funding program Open Access Publishing. MTB cultivation and magnetosome isolation were supported by the Ministry of Science and Higher Education of the Russian Federation (V.V.K.). The DLS measurement technique was developed with the support of Russian Science Foundation, grant No. 21-72-20029 (E.K.N.). Static hysteresis and thermal magnetic properties were measured with the support of RFBR, project No. 19-05-00471 (A.K.).
Institutional Review Board Statement
Not applicable.
Informed Consent Statement
Not applicable.
Data Availability Statement
Not applicable.
Acknowledgments
The TEM study was carried out in the “Material science and characterization in advanced technology” Federal Joint Research Center supported by the Ministry of Education and Science of the Russian Federation (id RFMEFI62119x0021). The study of the crystal structure, magnetic properties, and measurement of the EPR spectrum were carried out at the resource centers “X-ray diffraction methods of research”, “Center for Diagnostics of Functional Materials for Medicine, Pharmacology and Nanoelectronics”, and Magnetic Resonance Research Center of the Science Park of St. Petersburg University.
Conflicts of Interest
The authors declare no conflict of interest.
References
- Vali, H.; Kirschvink, J.L. Observations of Magnetosome Organization, Surface Structure, and Iron Biomineralization of Undescribed Magnetic Bacteria: Evolutionary Speculations. In Iron Biominerals; Frankel, R.B., Blakemore, R.P., Eds.; Plenum Press: New York, NY, USA, 1991; pp. 97–115. [Google Scholar] [CrossRef]
- Bennet, M.A.; Eder, S.H.K. Magnetoreception and Magnetotaxis. In Iron Oxides: From Nature to Applications; Faivre, D., Ed.; Wiley-VCH Verlag GmbH & Co. KGaA: Weinheim, Germany, 2016; pp. 567–590. [Google Scholar] [CrossRef]
- Blakemore, R. Magnetotactic bacteria. Science 1975, 190, 377–379. [Google Scholar] [CrossRef]
- Lowenstam, H.A. Magnetite in denticle capping in recent chitons (polyplacophora). Bull. Geol. Soc. Am. 1962, 73, 435–438. [Google Scholar] [CrossRef]
- Frankel, R.B.; Blakemore, R.P.; Wolfe, R.S. Magnetite in freshwater magnetotactic bacteria. Science 1979, 203, 1355–1356. [Google Scholar] [CrossRef]
- Vali, H.; Förster, O.; Amarantidis, G.; Petersen, N. Magnetotactic bacteria and their magnetofossils in sediments. Earth Planet. Sci. Lett. 1987, 86, 389–400. [Google Scholar] [CrossRef]
- Peck, J.A.; King, J.W. Magnetofossils in the sediment of Lake Baikal, Siberia. Earth Planet. Sci. Lett. 1996, 140, 159–172. [Google Scholar] [CrossRef]
- Egli, R. Characterization of individual rock magnetic components by analysis of remanence curves. 3. Bacterial magnetite and natural processes in lakes. Phys. Chem. Earth 2004, 29, 869–884. [Google Scholar] [CrossRef]
- Petermann, H.; Bleil, U. Detection of live magnetotactic bacteria in South Atlantic deep-sea sediments. Earth Planet. Sci. Lett. 1993, 117, 223–228. [Google Scholar] [CrossRef]
- Yamazaki, T.; Shimono, T. Abundant bacterial magnetite occurrence in oxic red clay. Geology 2013, 41, 1191–1194. [Google Scholar] [CrossRef]
- Larrasoaña, J.C.; Liu, Q.; Hu, P.; Roberts, A.P.; Mata, P.; Civis, J.; Sierro, F.J.; Pérez-Asensio, J.N. Paleomagnetic and paleoenvironmental implications of magnetofossil occurrences in late Miocene marine sediments from the Guadalquivir Basin, SW Spain. Front. Microbiol. 2014, 5, 71. [Google Scholar] [CrossRef]
- Roberts, A.P.; Chang, L.; Heslop, D.; Florindo, F.; Larrasoaa, J.C. Searching for single domain magnetite in the “pseudo-single- domain” sedimentary haystack: Implications of biogenic magnetite preservation for sediment magnetism and relative paleointensity determinations. J. Geophys. Res. Solid Earth 2012, 117, B08104. [Google Scholar] [CrossRef]
- Moskowitz, B.M.; Frankel, R.B.; Flanders, P.J.; Blakemore, R.P.; Schwartz, B.B. Magnetic properties of magnetotactic bacteria. J. Magn. Magn. Mater. 1988, 73, 273–288. [Google Scholar] [CrossRef]
- Wagner, C.L.; Egli, R.; Lascu, I.; Lippert, P.C.; Livi, K.J.T.; Sears, H.B. In situ magnetic identification of giant, needle-shaped magnetofossils in paleocene-eocene thermal maximum sediments. Proc. Natl. Acad. Sci. USA 2021, 118, e2018169118. [Google Scholar] [CrossRef]
- Ionescu, A.; Darton, N.J.; Vyas, K.; Llandro, J. Detection of endogenous magnetic nanoparticles with a tunnelling magneto resistance sensor. Proc. Phil. Trans. R. Soc. A 2010, 368, 4371–4387. [Google Scholar] [CrossRef]
- Muxworthy, A.R.; Williams, W. Critical superparamagnetic/single-domain grain sizes in interacting magnetite particles: Implications for magnetosome crystals. J. R. Soc. Interface 2009, 6, 1207–1212. [Google Scholar] [CrossRef] [PubMed]
- Gareev, K.G.; Grouzdev, D.S.; Kharitonskii, P.V.; Kosterov, A.; Koziaeva, V.V.; Sergienko, E.S.; Shevtsov, M.A. Magnetotactic Bacteria and Magnetosomes: Basic Properties and Applications. Magnetochemistry 2021, 7, 86. [Google Scholar] [CrossRef]
- Paterson, G.A.; Wang, Y.; Pan, Y. The fidelity of paleomagnetic records carried by magnetosome chains. Earth Planet. Sci. Lett. 2013, 383, 82–91. [Google Scholar] [CrossRef]
- Yamazaki, T. Reductive dissolution of biogenic magnetite. Earth Planets Space 2020, 72, 150. [Google Scholar] [CrossRef]
- Moskowitz, B.M.; Frankel, R.B.; Bazylinski, D.A. Rock magnetic criteria for the detection of biogenic magnetite. Earth Planet. Sci. Lett. 1993, 120, 283–300. [Google Scholar] [CrossRef]
- Blattmann, T.M.; Lesniak, B.; García-Rubio, I.; Charilaou, M.; Wessels, M.; Eglinton, T.I.; Gehring, A.U. Ferromagnetic resonance of magnetite biominerals traces redox changes. Earth Planet. Sci. Lett. 2020, 545, 116400. [Google Scholar] [CrossRef]
- Petersen, N.; Weiss, D.G.; Vali, H. Magnetic Bacteria in Lake Sediments. In Geomagnetism and Palaeomagnetism; Lowes, F.J., Ed.; Kluwer Academic Publishers: Amsterdam, The Netherlands, 1989; pp. 231–241. [Google Scholar] [CrossRef]
- Yamazaki, T.; Kawahata, H. Organic carbon flux controls the morphology of magnetofossils in marine sediments. Geology 1998, 26, 1064–1066. [Google Scholar] [CrossRef]
- Fischer, H.; Mastrogiacomo, G.; Löffler, J.F.; Warthmann, R.J.; Weidler, P.G.; Gehring, A.U. Ferromagnetic resonance and magnetic characteristics of intact magnetosome chains in Magnetospirillum gryphiswaldense. Earth Planet. Sci. Lett. 2008, 270, 200–208. [Google Scholar] [CrossRef]
- Pan, Y.; Petersen, N.; Winklhofer, M.; Davila, A.F.; Liu, Q.; Frederichs, T.; Hanzlik, M.; Zhu, R. Rock magnetic properties of uncultured magnetotactic bacteria. Earth Planet. Sci. Lett. 2005, 237, 311–325. [Google Scholar] [CrossRef]
- Zhang, T.; Pan, Y. Constraining the magnetic properties of ultrafine- and fine-grained biogenic magnetite. Earth Planets Space 2018, 70, 206. [Google Scholar] [CrossRef]
- Yang, J.; Li, S.; Huang, X.; Li, J.; Li, L.; Pan, Y.; Li, Y. MamX encoded by the mamXY operon is involved in control of magnetosome maturation in Magnetospirillum gryphiswaldense MSR-1. BMC Microbiol. 2013, 13, 203. [Google Scholar] [CrossRef]
- Gehring, A.U.; Charilaou, M.; García-Rubio, I. Oxidized magnetosomes in magnetotactic bacteria. J. Magn. Magn. Mater. 2012, 324, 1281–1284. [Google Scholar] [CrossRef]
- Li, J.H.; Pan, Y.X.; Liu, Q.S.; Qin, H.F.; Deng, C.L.; Che, R.C.; Yang, X.A. A comparative study of magnetic properties between whole cells and isolated magnetosomes of Magnetospirillum magneticum AMB-1. Chin. Sci. Bull. 2010, 55, 38–44. [Google Scholar] [CrossRef]
- Chen, A.P.; Berounsky, V.M.; Chan, M.K.; Blackford, M.G.; Cady, C.; Moskowitz, B.M.; Kraal, P.; Lima, E.A.; Kopp, R.E.; Lumpkin, G.R.; et al. Magnetic properties of uncultivated magnetotactic bacteria and their contribution to a stratified estuary iron cycle. Nat. Commun. 2014, 5, 4797. [Google Scholar] [CrossRef] [PubMed]
- Verwey, E.J.W. Electronic conduction of magnetite (Fe3O4) and its transition point at low temperatures. Nature 1939, 144, 327–328. [Google Scholar] [CrossRef]
- Prozorov, R.; Prozorov, T.; Mallapragada, S.K.; Narasimhan, B.; Williams, T.J.; Bazylinski, D.A. Magnetic irreversibility and the Verwey transition in nanocrystalline bacterial magnetite. Phys. Rev. B Condens. Matter. Mater. Phys. 2007, 76, 054406. [Google Scholar] [CrossRef]
- Kopp, R.E.; Nash, C.Z.; Kobayashi, A.; Weiss, B.P.; Bazylinski, D.A.; Kirschvink, J.L. Ferromagnetic resource spectroscopy for assessment of magnetic anisotropy and magnetostatic interactions: A case study of mutant magnetotactic bacteria. J. Geophys. Res. Solid Earth 2006, 111, B12S25. [Google Scholar] [CrossRef]
- Li, J.; Menguy, N.; Arrio, M.A.; Sainctavit, P.; Juhin, A.; Wang, Y.; Chen, H.; Bunau, O.; Otero, E.; Ohresser, P.; et al. Controlled cobalt doping in the spinel structure of magnetosome magnetite: New evidences from element- and site-specific X-ray magnetic circular dichroism analyses. J. R. Soc. Interface 2016, 13, 20160355. [Google Scholar] [CrossRef]
- Dziuba, M.; Koziaeva, V.; Grouzdev, D.; Burganskaya, E.; Baslerov, R.; Kolganova, T.; Chernyadyev, A.; Osipov, G.; Andrianova, E.; Gorlenko, V.; et al. Magnetospirillum caucaseum sp. Nov., Magnetospirillum marisnigri sp. Nov. and Magnetospirillum moscoviense sp. Nov., freshwater magnetotactic bacteria isolated from three distinct geographical locations in European Russia. Int. J. Syst. Evol. Microbiol. 2016, 66, 2069–2077. [Google Scholar] [CrossRef]
- Grouzdev, D.S.; Dziuba, M.V.; Kurek, D.V.; Ovchinnikov, A.I.; Zhigalova, N.A.; Kuznetsov, B.B.; Skryabin, K.G. Optimized method for preparation of IgG-binding bacterial magnetic nanoparticles. PLoS ONE 2014, 9, e109914. [Google Scholar] [CrossRef]
- Velichko, E.N.; Nepomnyashchaya, E.K.; Gareev, K.G.; Martínez, J.; Maicas, M.C. Characterization of Magnetite–Silica Magnetic Fluids by Laser Scattering. Appl. Sci. 2021, 11, 183. [Google Scholar] [CrossRef]
- Savitzky, A.; Golay, M.J.E. Smoothing and Differentiation of Data by Simplified Least Squares Procedures. Anal. Chem. 1964, 36, 1627–1639. [Google Scholar] [CrossRef]
- Kharitonskii, P.; Kirillova, S.; Gareev, K.; Kamzin, A.; Gurylev, A.; Kosterov, A.; Sergienko, E.; Valiullin, A.; Shevchenko, E. Magnetic Granulometry and Mössbauer Spectroscopy of Synthetic FemOn-TiO2 Composites. IEEE Trans. Magn. 2020, 56, 7200209. [Google Scholar] [CrossRef]
- Vezo, O.S.; Gareev, K.G.; Korolev, D.V.; Kuryshev, I.A.; Lebedev, S.V.; Moshnikov, V.A.; Sergienko, E.S.; Kharitonskii, P.V. Aggregate stability and magnetic characteristics of colloidal FemOn–SiO2 particles obtained by sol–gel method. Phys. Solid State 2017, 59, 1008–1013. [Google Scholar] [CrossRef]
- Kharitonskii, P.; Kamzin, A.; Gareev, K.; Valiullin, A.; Vezo, O.; Sergienko, E.; Korolev, D.; Kosterov, A.; Lebedev, S.; Gurylev, A.; et al. Magnetic granulometry and Mössbauer spectroscopy of FemOn–SiO2 colloidal nanoparticles. J. Magn. Magn. Mater. 2018, 461, 30–36. [Google Scholar] [CrossRef]
- Koziaeva, V.V.; Rusakova, S.A.; Slobodova, N.V.; Uzun, M.; Kolganova, T.V.; Skryabin, K.G.; Grouzdev, D.S. Magnetospirillum kuznetsovii sp. nov., a novel magnetotactic bacterium isolated from a lake in the Moscow region. Int. J. Syst. Evol. Microbiol. 2019, 69, 1953–1959. [Google Scholar] [CrossRef] [PubMed]
- Konhauser, K.O. Bacterial iron biomineralisation in nature. FEMS Microbiol. Rev. 1997, 20, 315–326. [Google Scholar] [CrossRef]
- Dziuba, M.V.; Kolganova, T.V.; Gorlenko, V.M.; Kuznetsov, B.B. Species diversity of magnetotactic bacteria from the Ol’khovka River, Russia. Microbiology 2013, 82, 335–340. [Google Scholar] [CrossRef]
- Pósfai, M.; Lefèvre, C.T.; Trubitsyn, D.; Bazylinski, D.A.; Frankel, R.B. Phylogenetic significance of composition and crystal morphology of magnetosome minerals. Front. Microbiol. 2013, 4, 344. [Google Scholar] [CrossRef] [PubMed]
- Monteil, C.L.; Grouzdev, D.S.; Perrière, G.; Alonso, B.; Rouy, Z.; Cruveiller, S.; Ginet, N.; Pignol, D.; Lefevre, C.T. Repeated horizontal gene transfers triggered parallel evolution of magnetotaxis in two evolutionary divergent lineages of magnetotactic bacteria. ISME J. 2020, 14, 1783–1794. [Google Scholar] [CrossRef]
- Alphandéry, E.; Guyot, F.; Chebbi, I. Preparation of chains of magnetosomes, isolated from Magnetospirillum magneticum strain AMB-1 magnetotactic bacteria, yielding efficient treatment of tumors using magnetic hyperthermia. Int. J. Pharm. 2012, 434, 444–452. [Google Scholar] [CrossRef] [PubMed]
- Goss, C.J. Saturation magnetisation, coercivity and lattice parameter changes in the system Fe3O4-γFe2O3, and their relationship to structure. Phys. Chem. Miner. 1988, 16, 164–171. [Google Scholar] [CrossRef]
- Cervellino, A.; Frison, R.; Cernuto, G.; Guagliardi, A.; Masciocchi, N. Lattice parameters and site occupancy factors of magnetite-maghemite core-shell nanoparticles. A critical study. J. Appl. Crystallogr. 2014, 47, 1755–1761. [Google Scholar] [CrossRef]
- Al’myashev, V.I.; Gareev, K.G.; Ionin, S.A.; Levitskii, V.S.; Moshnikov, V.A.; Terukov, E.I. Investigation of the structure, elemental and phase compositions of Fe3O4-SiO2 composite layers by scanning electron microscopy, X-ray spectroscopy, and thermal nitrogen desorption methods. Phys. Solid State 2014, 56, 2155–2159. [Google Scholar] [CrossRef]
- Jubb, A.M.; Allen, H.C. Vibrational spectroscopic characterization of hematite, maghemite, and magnetite thin films produced by vapor deposition. ACS Appl. Mater. Interfaces 2010, 2, 2804–2812. [Google Scholar] [CrossRef]
- Slavov, L.; Abrashev, M.V.; Merodiiska, T.; Gelev, C.; Vandenberghe, R.E.; Markova-Deneva, I.; Nedkov, I. Raman spectroscopy investigation of magnetite nanoparticles in ferrofluids. J. Magn. Magn. Mater. 2010, 322, 1904–1911. [Google Scholar] [CrossRef]
- Özdemir, Ö.; Dunlop, D.J.; Moskowitz, B.M. The effect of oxidation on the Verwey transition in magnetite. Geophys. Res. Lett. 1993, 20, 1671–1674. [Google Scholar] [CrossRef]
- Dunlop, D.J. Superparamagnetic and single-domain threshold sizes in magnetite. J. Geophys. Res. 1973, 78, 1780–1793. [Google Scholar] [CrossRef]
- Amor, M.; Ceballos, A.; Wan, J.; Simon, C.P.; Aron, A.T.; Chang, C.J.; Hellman, F.; Komeili, A. Magnetotactic Bacteria Accumulate a Large Pool of Iron Distinct from Their Magnetite Crystals. Appl. Environ. Microbiol. 2020, 86, e01278-20. [Google Scholar] [CrossRef]
- Blondeau, M.; Guyodo, Y.; Guyot, F.; Gatel, C.; Menguy, N.; Chebbi, I.; Haye, B.; Durand-Dubief, M.; Alphandery, E.; Brayner, R.; et al. Magnetic-field induced rotation of magnetosome chains in silicified magnetotactic bacteria. Sci. Rep. 2018, 8, 7699. [Google Scholar] [CrossRef]
- Gehring, A.U.; Kind, J.; Charilaou, M.; García-Rubio, I. The detection of magnetotactic bacteria and magnetofossils by means of magnetic anisotropy. Earth Planet. Sci. Lett. 2011, 309, 113–117. [Google Scholar] [CrossRef]
- Bender, P.; Marcano, L.; Orue, I.; Alba Venero, D.; Honecker, D.; Fernández Barquín, L.; Muela, A.; Fdez-Gubieda, M.L. Probing the stability and magnetic properties of magnetosome chains in freeze-dried magnetotactic bacteria. Nanoscale Adv. 2020, 2, 1115–1121. [Google Scholar] [CrossRef]
- Walz, F. The Verwey transition—A topical review. J. Phys. Condens. Matter 2002, 14, R285–R340. [Google Scholar] [CrossRef]
- Kosterov, A. Low-temperature magnetization and AC susceptibility of magnetite: Effect of thermomagnetic history. Geophys. J. Int. 2003, 154, 58–71. [Google Scholar] [CrossRef]
- Özdemir, Ö.; Dunlop, D.J. Hallmarks of maghemitization in low-temperature remanence cycling of partially oxidized magnetite nanoparticles. J. Geophys. Res. 2010, 115, B02101. [Google Scholar] [CrossRef]
- Moskowitz, B.M.; Bazylinski, D.A.; Egli, R.; Frankel, R.B.; Edwards, K.J. Magnetic properties of marine magnetotactic bacteria in a seasonally stratified coastal pond (Salt Pond, MA, USA). Geophys. J. Int. 2008, 174, 75–92. [Google Scholar] [CrossRef]
- Li, J.; Wu, W.; Liu, Q.; Pan, Y. Magnetic anisotropy, magnetostatic interactions and identification of magnetofossils. Geochem. Geophys. Geosyst. 2012, 13, Q10Z51. [Google Scholar] [CrossRef]
- Ka̧kol, Z.; Honig, J.M. The variation of Verwey transition temperature with oxygen stoichiometry in magnetite. Solid State Commun. 1989, 70, 967–969. [Google Scholar] [CrossRef]
- Aragón, R.; Buttrey, D.J.; Shepherd, J.P.; Honig, J.M. Influence of nonstoichiometry on the Verwey transition. Phys. Rev. B 1985, 31, 430–436. [Google Scholar] [CrossRef]
- Noginov, M.M.; Noginova, N.; Amponsah, O.; Bah, R.; Rakhimov, R.; Atsarkin, V.A. Magnetic resonance in iron oxide nanoparticles: Quantum features and effect of size. J. Magn. Magn. Mater. 2008, 320, 2228–2232. [Google Scholar] [CrossRef]
- Yuan, W.; Zhou, H.; Yang, Z.; Hein, J.R.; Yang, Q. Magnetite magnetofossils record biogeochemical remanent magnetization in hydrogenetic ferromanganese crusts. Geology 2020, 48, 298–302. [Google Scholar] [CrossRef]
- Kopp, R.E.; Weiss, B.P.; Maloof, A.C.; Vali, H.; Nash, C.Z.; Kirschvink, J.L. Chains, clumps, and strings: Magnetofossil taphonomy with ferromagnetic resonance spectroscopy. Earth Planet. Sci. Lett. 2006, 247, 10–25. [Google Scholar] [CrossRef]
- Kind, J.; Gehring, A.U.; Winklhofer, M.; Hirt, A.M. Combined use of magnetometry and spectroscopy for identifying magnetofossils in sediments. Geochem. Geophys. Geosyst. 2011, 12, Q08008. [Google Scholar] [CrossRef]
- Fischer, H.; Luster, J.; Gehring, A.U. EPR evidence for maghemitization of magnetite in a tropical soil. Geophys. J. Int. 2007, 169, 909–916. [Google Scholar] [CrossRef][Green Version]
- Kirshvink, J.L. (Ed.) Magnetite Biomineralization and Magnetoreception in Organisms. A New Biomagnetism; Plenum Press: New York, NY, USA, 1985; pp. 16–17. [Google Scholar]
- Jacobs, I.S.; Bean, C.P. An approach to elongated fine-particle magnets. Phys. Rev. 1955, 100, 1060–1067. [Google Scholar] [CrossRef]
Publisher’s Note: MDPI stays neutral with regard to jurisdictional claims in published maps and institutional affiliations. |
© 2021 by the authors. Licensee MDPI, Basel, Switzerland. This article is an open access article distributed under the terms and conditions of the Creative Commons Attribution (CC BY) license (https://creativecommons.org/licenses/by/4.0/).