
Bacterial Consumption of T4 Phages

 , , , ,
Abstract
:
1. Introduction
2. Materials and Methods
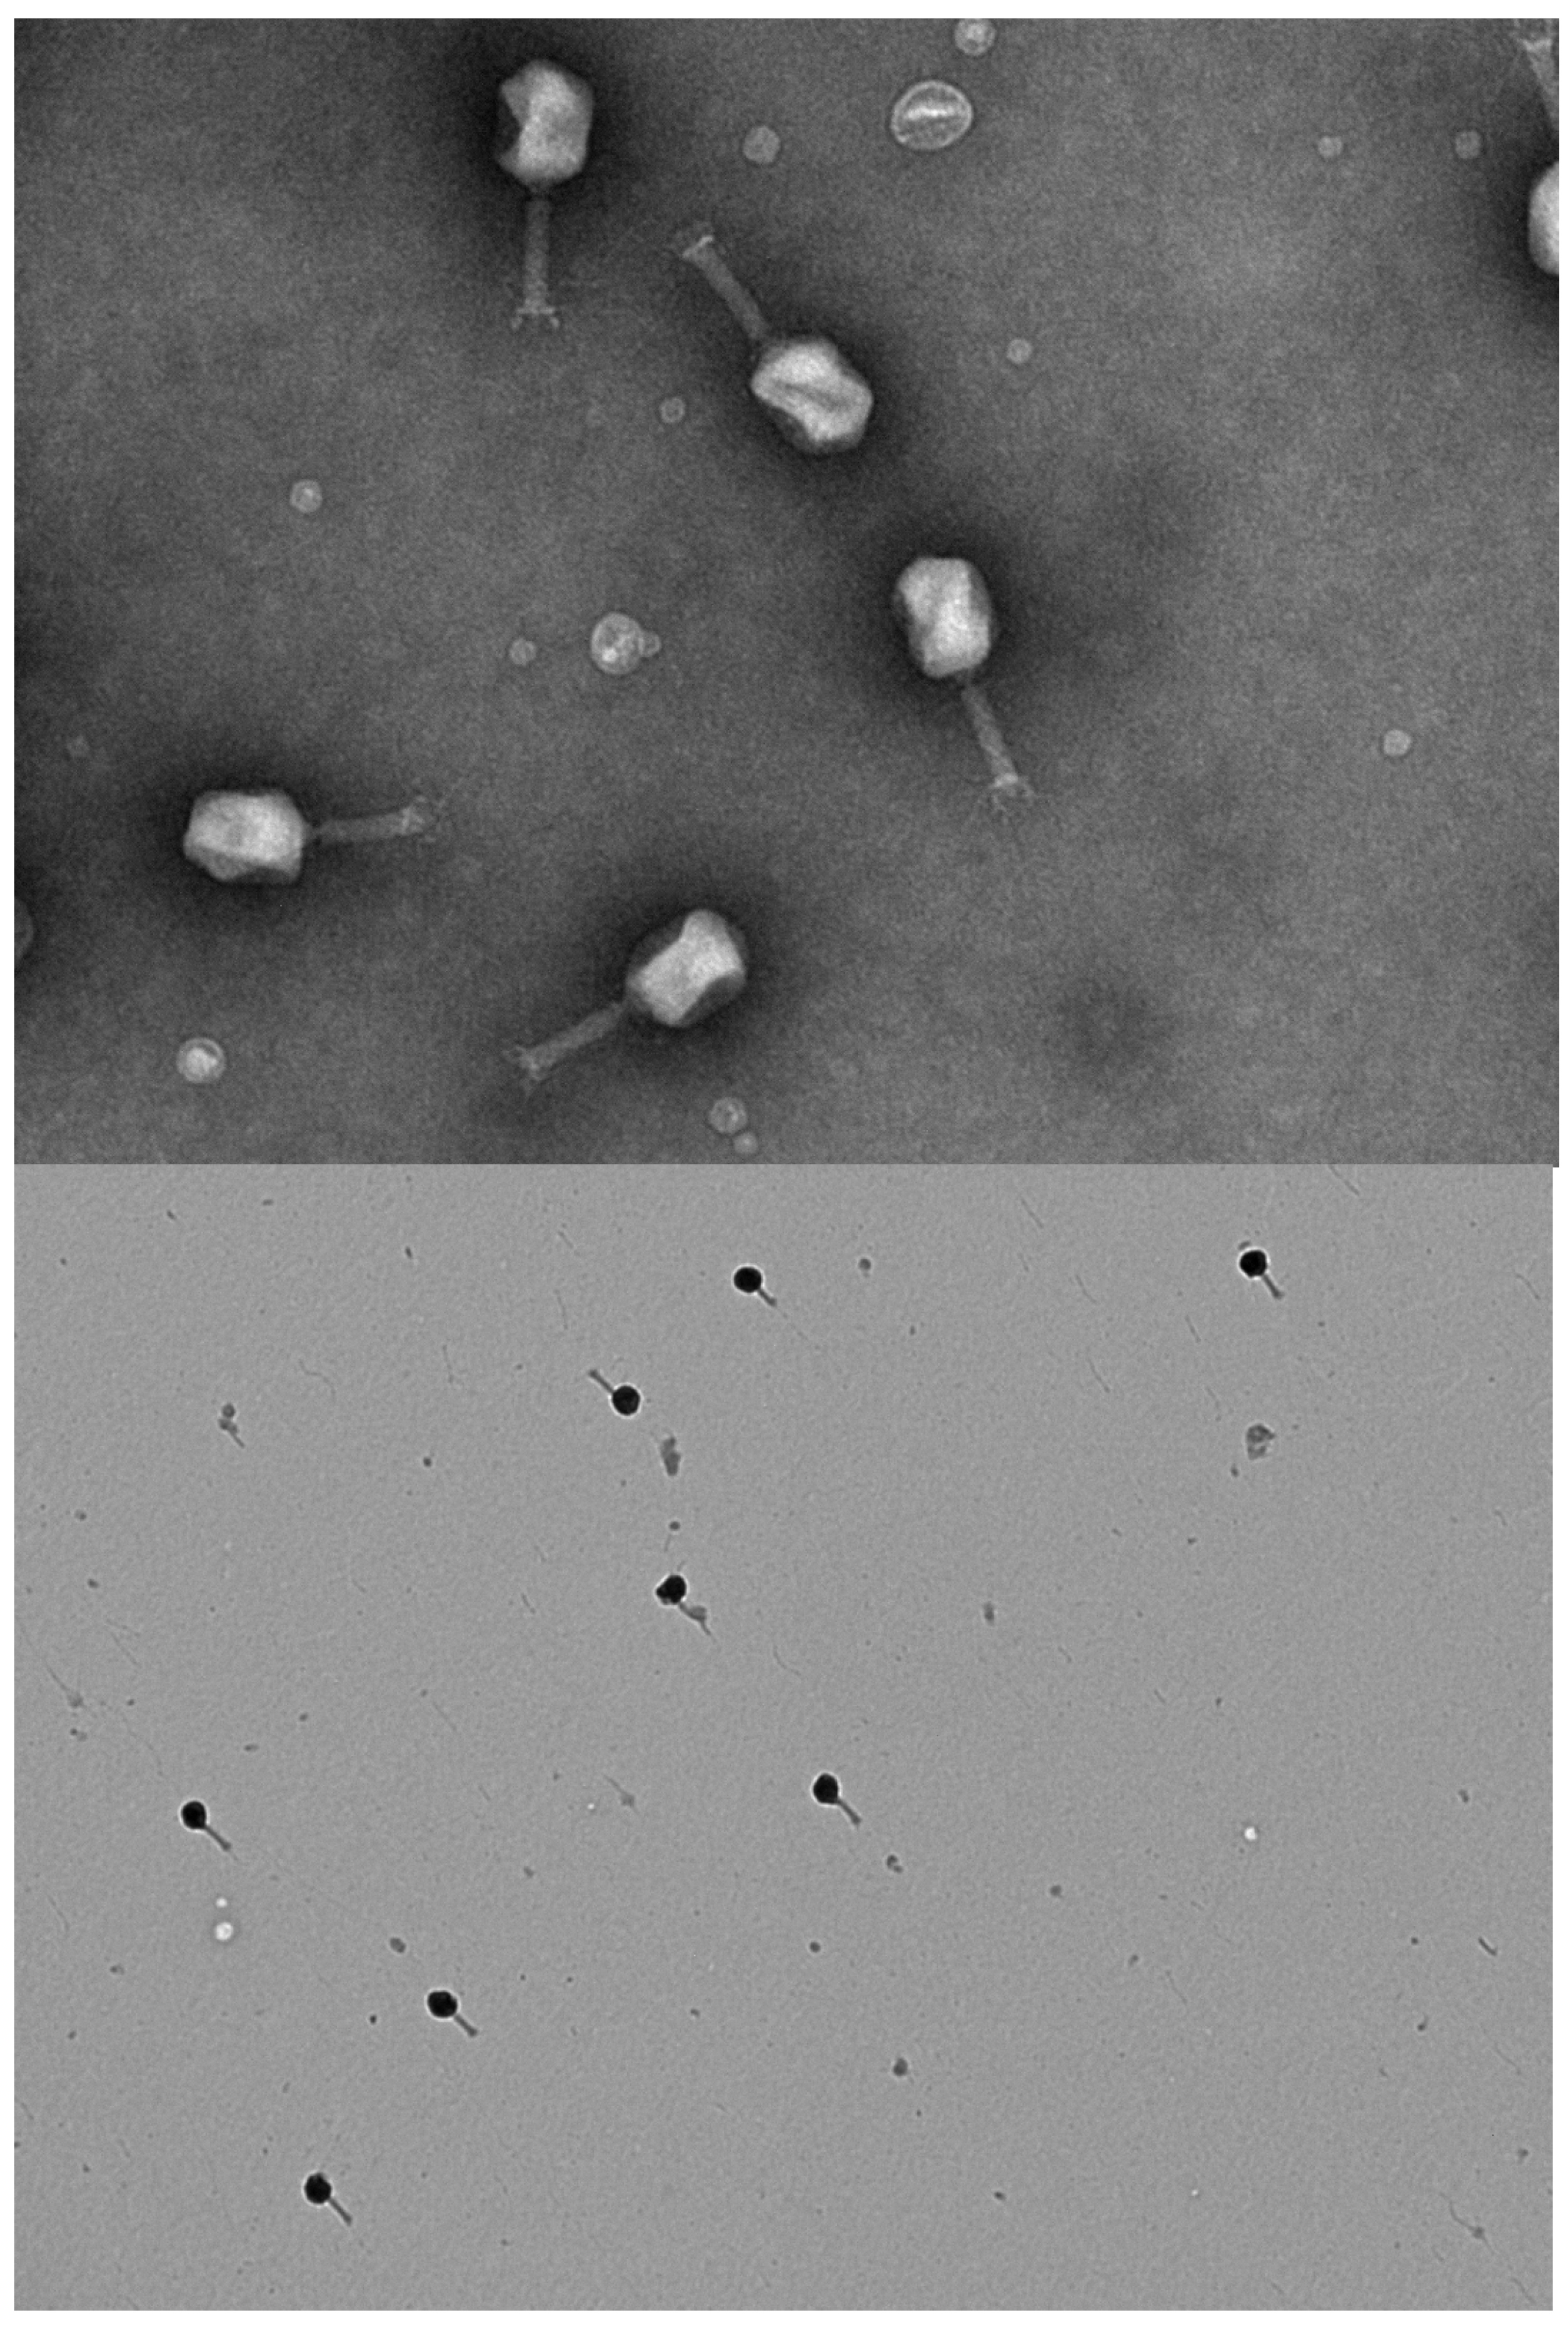
2.1. Preparation of the 13C-Labeled T4 Bacteriophages
2.2. Incubation of 13C-Labeled T4 Bacteriophages with Aerobic Sludge
2.3. DNA Extraction and 16S rDNA Analysis
2.4. Detailed Calculations of the 13C Mass Balance
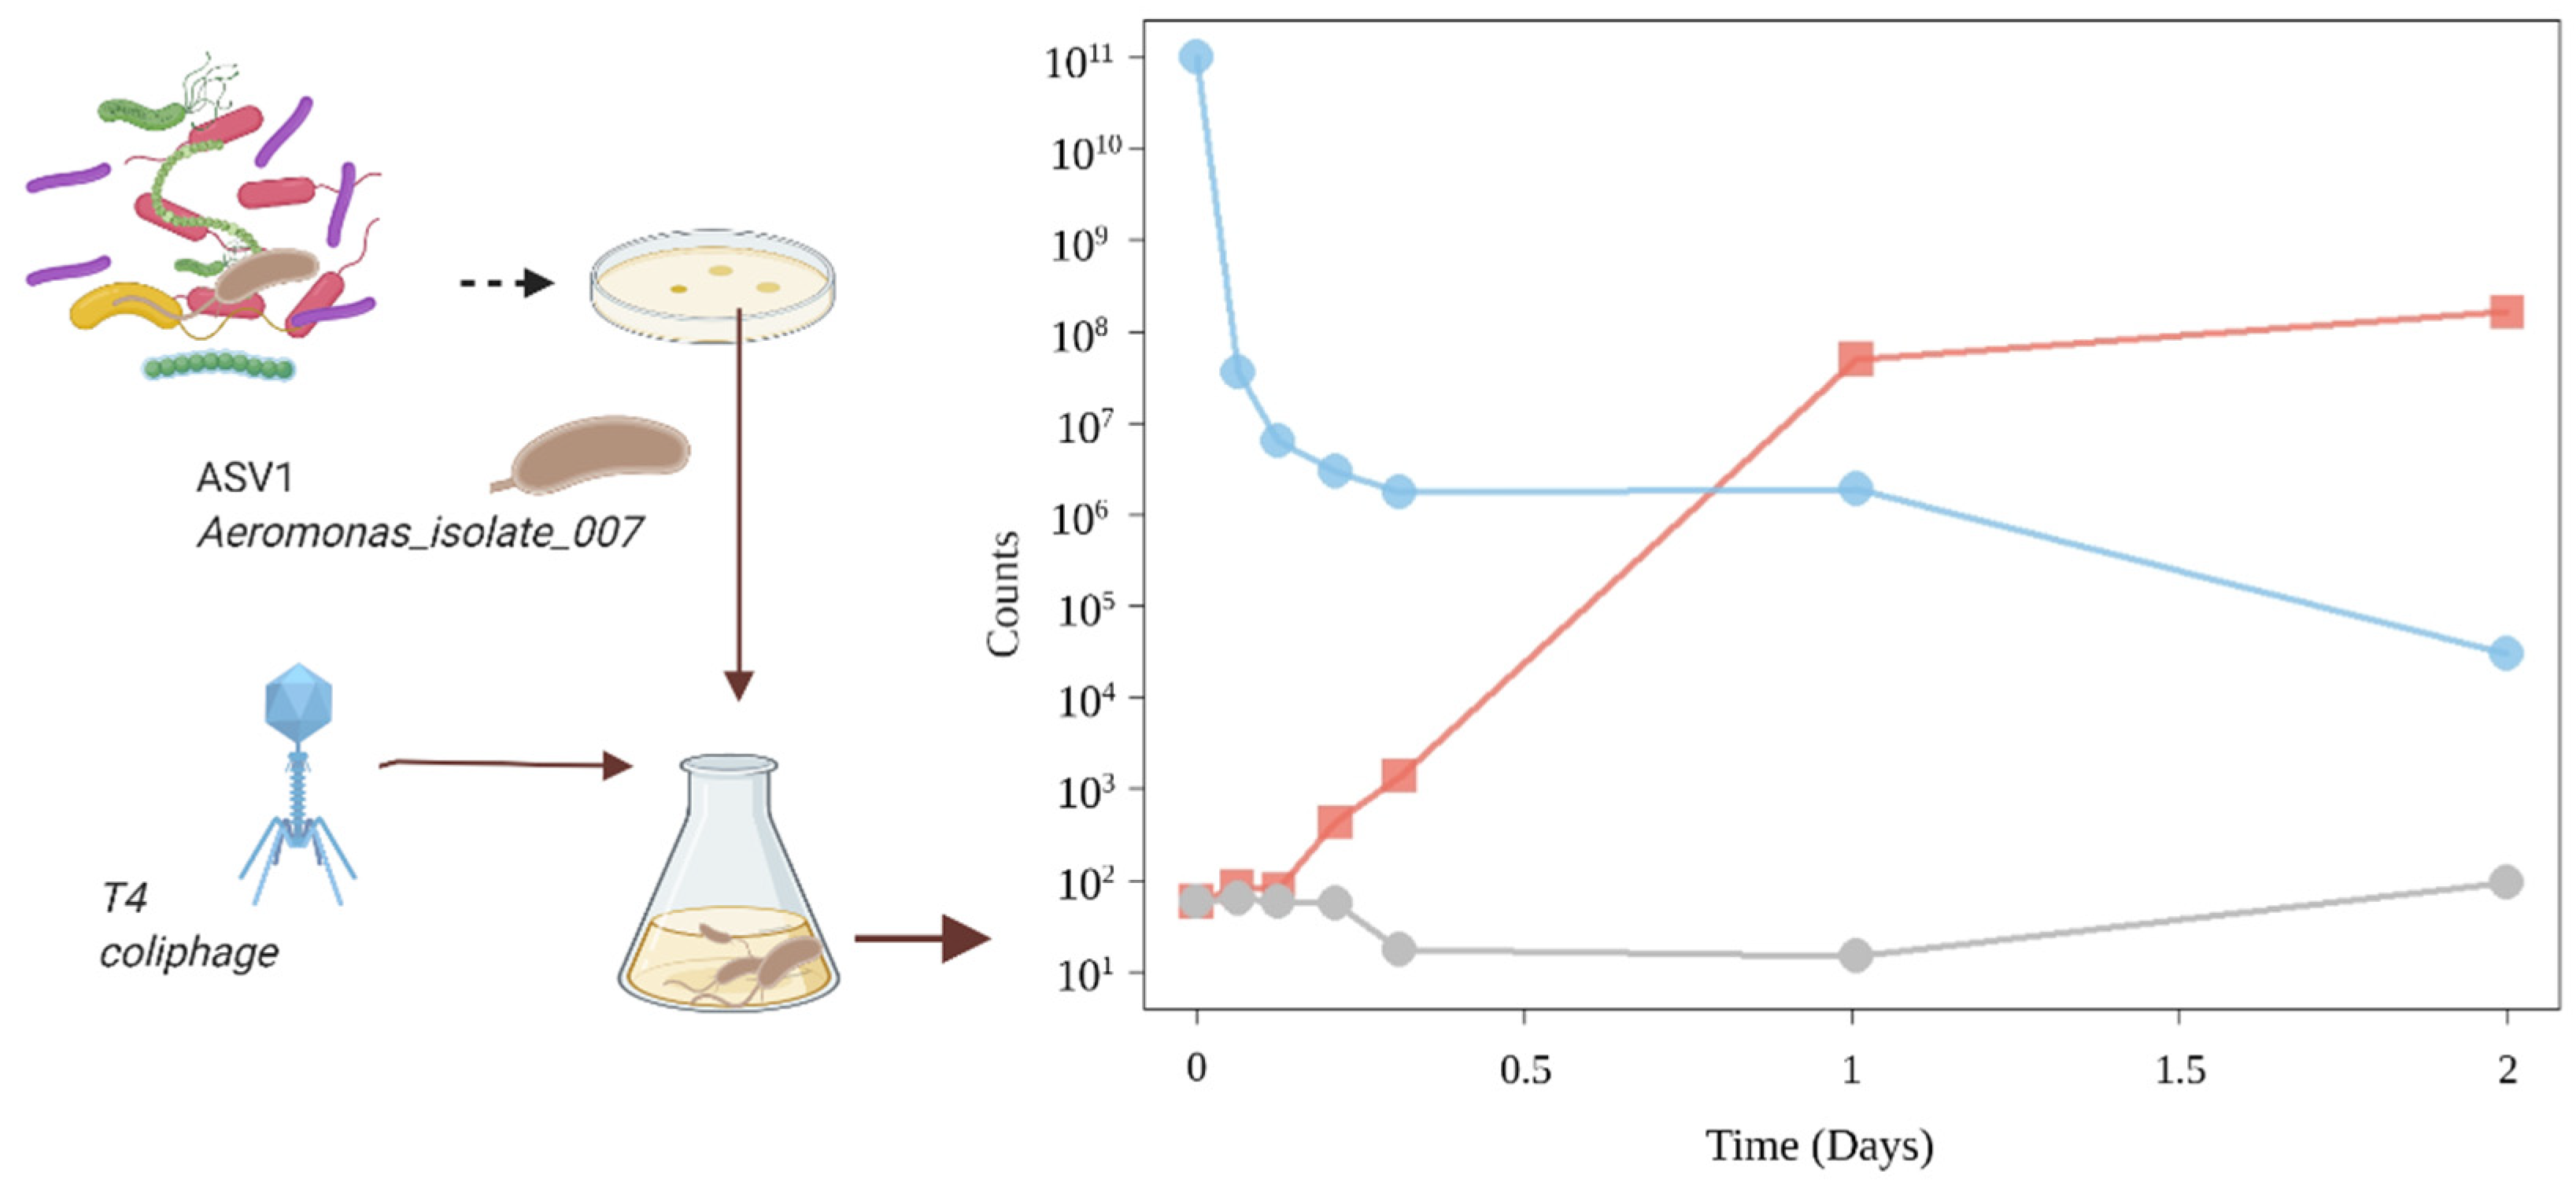
2.5. Isolation of Aeromonas_Isolate_007 and Subsequent Experiments
2.6. Sequencing of Aeromonas_Isolate_007
3. Results
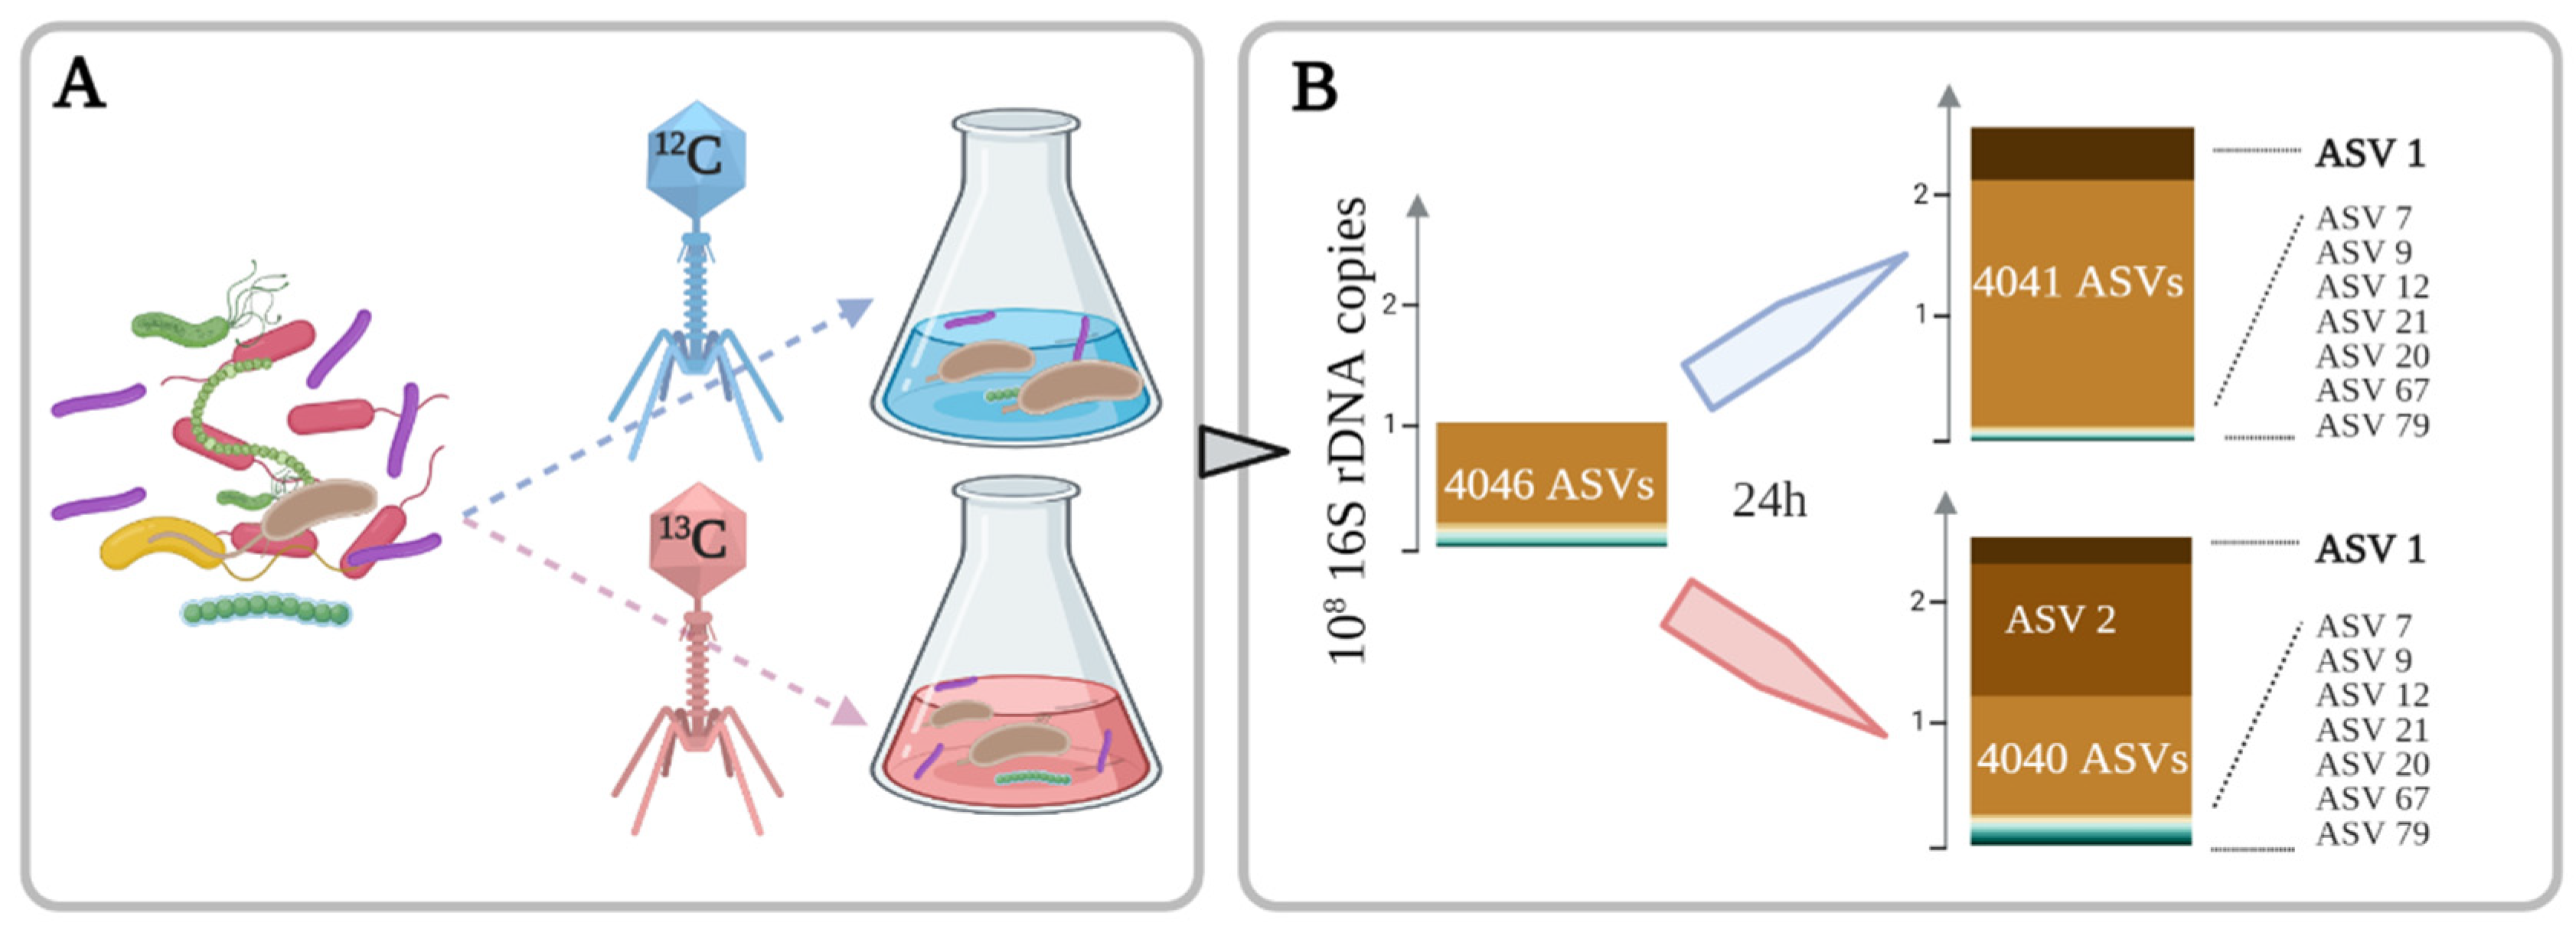
3.1. Stable Isotope Probing Experiment with T4 Bacteriophage
3.1.1. T4 Phages Support Bacterial Growth
3.1.2. Increase of DNA Density of 9 Microbial Species after 24 h
3.2. Validation in a Pure Culture Experiment
3.2.1. Pure Culture with High Phages Concentrations
3.2.2. Pure Culture with Low Phages Concentrations
3.2.3. Sequencing Aeromonas_Isolate_007
4. Discussion
Author Contributions
Funding
Institutional Review Board Statement
Informed Consent Statement
Data Availability Statement
Acknowledgments
Conflicts of Interest
Appendix A

Appendix B

| Putative Function | RAST Protein Id | Contig Id | RAST_Function | TMHMM Inside | TMHMM Transmembrane | TMHMM Outside |
|---|---|---|---|---|---|---|
| CAPTURE | fig|642.770.peg.2774 | NODE_2_length_947468_cov_91.192050 | Outer_membrane_porin_OmpC | 1 | 1 | 1 |
| fig|642.770.peg.1967 | NODE_1_length_1964260_cov_90.024368 | 0 | 0 | 1 | ||
| fig|642.770.peg.3181 | NODE_3_length_439005_cov_94.027299 | 0 | 0 | 1 | ||
| Extracellular DIGESTION of large proteins | fig|642.770.peg.202 | NODE_1_length_1964260_cov_90.024368 | putative_extracellular_serine_protease | 0 | 0 | 1 |
| fig|642.770.peg.309 | NODE_1_length_1964260_cov_90.024368 | Uncharacterized_protease_YhbU | 0 | 0 | 1 | |
| fig|642.770.peg.653 | NODE_1_length_1964260_cov_90.024368 | Tail-specific_protease_precursor_(EC_3.4.21.102) | 0 | 0 | 1 | |
| fig|642.770.peg.664 | NODE_1_length_1964260_cov_90.024368 | Lon_protease_homolog_YcbZ | 0 | 0 | 1 | |
| fig|642.770.peg.903 | NODE_1_length_1964260_cov_90.024368 | ATP-dependent_protease_La_(EC_3.4.21.53)_Type_I | 0 | 0 | 1 | |
| fig|642.770.peg.904 | NODE_1_length_1964260_cov_90.024368 | ATP-dependent_Clp_protease_ATP-binding_subunit_ClpX | 0 | 0 | 1 | |
| fig|642.770.peg.905 | NODE_1_length_1964260_cov_90.024368 | ATP-dependent_Clp_protease_proteolytic_subunit_ClpP_(EC_3.4.21.92) | 0 | 0 | 1 | |
| fig|642.770.peg.919 | NODE_1_length_1964260_cov_90.024368 | Protease_III_precursor_(EC_3.4.24.55) | 0 | 0 | 1 | |
| fig|642.770.peg.976 | NODE_1_length_1964260_cov_90.024368 | ATP-dependent_Clp_protease_ATP-binding_subunit_ClpA | 0 | 0 | 1 | |
| fig|642.770.peg.1312 | NODE_1_length_1964260_cov_90.024368 | Protease_II_(EC_3.4.21.83) | 0 | 0 | 1 | |
| fig|642.770.peg.1793 | NODE_1_length_1964260_cov_90.024368 | Uncharacterized_protease_YegQ | 0 | 0 | 1 | |
| fig|642.770.peg.1989 | NODE_1_length_1964260_cov_90.024368 | Vibriolysin__extracellular_zinc_protease_(EC_3.4.24.25)_@_Pseudolysin__extracellular_zinc_protease_(EC_3.4.24.26) | 0 | 0 | 1 | |
| fig|642.770.peg.2147 | NODE_2_length_947468_cov_91.192050 | Uncharacterized_protease_YdcP | 0 | 0 | 1 | |
| fig|642.770.peg.3280 | NODE_3_length_439005_cov_94.027299 | Protease_II_(EC_3.4.21.83) | 0 | 0 | 1 | |
| fig|642.770.peg.3795 | NODE_5_length_206066_cov_93.597574 | ATP-dependent_hsl_protease_ATP-binding_subunit_HslU | 0 | 0 | 1 | |
| fig|642.770.peg.3796 | NODE_5_length_206066_cov_93.597574 | ATP-dependent_protease_subunit_HslV_(EC_3.4.25.2) | 0 | 0 | 1 | |
| fig|642.770.peg.12 | NODE_10_length_72653_cov_95.226534 | Oligopeptidase_A_(EC_3.4.24.70) | 0 | 0 | 1 | |
| fig|642.770.peg.67 | NODE_10_length_72653_cov_95.226534 | Xaa-Pro_dipeptidase_PepQ_(EC_3.4.13.9) | 0 | 0 | 1 | |
| fig|642.770.peg.308 | NODE_1_length_1964260_cov_90.024368 | Uncharacterized_peptidase_U32_family_member_YhbV | 0 | 0 | 1 | |
| fig|642.770.peg.319 | NODE_1_length_1964260_cov_90.024368 | Peptidase_B_(EC_3.4.11.23) | 0 | 0 | 1 | |
| fig|642.770.peg.324 | NODE_1_length_1964260_cov_90.024368 | Peptidase_B_(EC_3.4.11.23) | 0 | 0 | 1 | |
| fig|642.770.peg.496 | NODE_1_length_1964260_cov_90.024368 | Aminopeptidase_PepA-related_protein | 0 | 0 | 1 | |
| fig|642.770.peg.654 | NODE_1_length_1964260_cov_90.024368 | Membrane_alanine_aminopeptidase_N_(EC_3.4.11.2) | 0 | 0 | 1 | |
| fig|642.770.peg.1189 | NODE_1_length_1964260_cov_90.024368 | Oligoendopeptidase_F-like_protein | 0 | 0 | 1 | |
| fig|642.770.peg.1360 | NODE_1_length_1964260_cov_90.024368 | Tripeptide_aminopeptidase_(EC_3.4.11.4) | 0 | 0 | 1 | |
| fig|642.770.peg.1462 | NODE_1_length_1964260_cov_90.024368 | Probable_endopeptidase_NlpC | 0 | 0 | 1 | |
| Extracellular DIGESTION of large proteins | fig|642.770.peg.1502 | NODE_1_length_1964260_cov_90.024368 | FIG009095:_D_D-carboxypeptidase_family_protein | 0 | 0 | 1 |
| fig|642.770.peg.1638 | NODE_1_length_1964260_cov_90.024368 | Peptidase__M23/M37_family | 0 | 0 | 1 | |
| fig|642.770.peg.1722 | NODE_1_length_1964260_cov_90.024368 | Membrane_proteins_related_to_metalloendopeptidases | 0 | 0 | 1 | |
| fig|642.770.peg.1792 | NODE_1_length_1964260_cov_90.024368 | L_D-transpeptidase_>_YbiS | 0 | 0 | 1 | |
| fig|642.770.peg.1981 | NODE_1_length_1964260_cov_90.024368 | L_D-transpeptidase_>_YbiS | 0 | 0 | 1 | |
| fig|642.770.peg.2129 | NODE_2_length_947468_cov_91.192050 | Alpha-aspartyl_dipeptidase_Peptidase_E_(EC_3.4.13.21) | 0 | 0 | 1 | |
| fig|642.770.peg.2153 | NODE_2_length_947468_cov_91.192050 | Thermostable_carboxypeptidase_1_(EC_3.4.17.19) | 0 | 0 | 1 | |
| fig|642.770.peg.2266 | NODE_2_length_947468_cov_91.192050 | Methionine_aminopeptidase_(EC_3.4.11.18) | 0 | 0 | 1 | |
| fig|642.770.peg.2291 | NODE_2_length_947468_cov_91.192050 | Peptidase__M13_family | 0 | 0 | 1 | |
| fig|642.770.peg.2456 | NODE_2_length_947468_cov_91.192050 | γ-glutamyltranspeptidase_(EC_2.3.2.2)_ @_Glutathione_hydrolase_(EC_3.4.19.13) | 0 | 0 | 1 | |
| fig|642.770.peg.3506 | NODE_4_length_411610_cov_92.800192 | Xaa-Pro_aminopeptidase_(EC_3.4.11.9) | 0 | 0 | 1 | |
| fig|642.770.peg.3576 | NODE_4_length_411610_cov_92.800192 | Prolyl_endopeptidase_(EC_3.4.21.26) | 0 | 0 | 1 | |
| fig|642.770.peg.4017 | NODE_6_length_154685_cov_89.330397 | Oligoendopeptidase_F-like_protein | 0 | 0 | 1 | |
| fig|642.770.peg.4147 | NODE_7_length_126480_cov_93.962673 | Bacterial_leucyl_aminopeptidase_(EC_3.4.11.10) | 0 | 0 | 1 | |
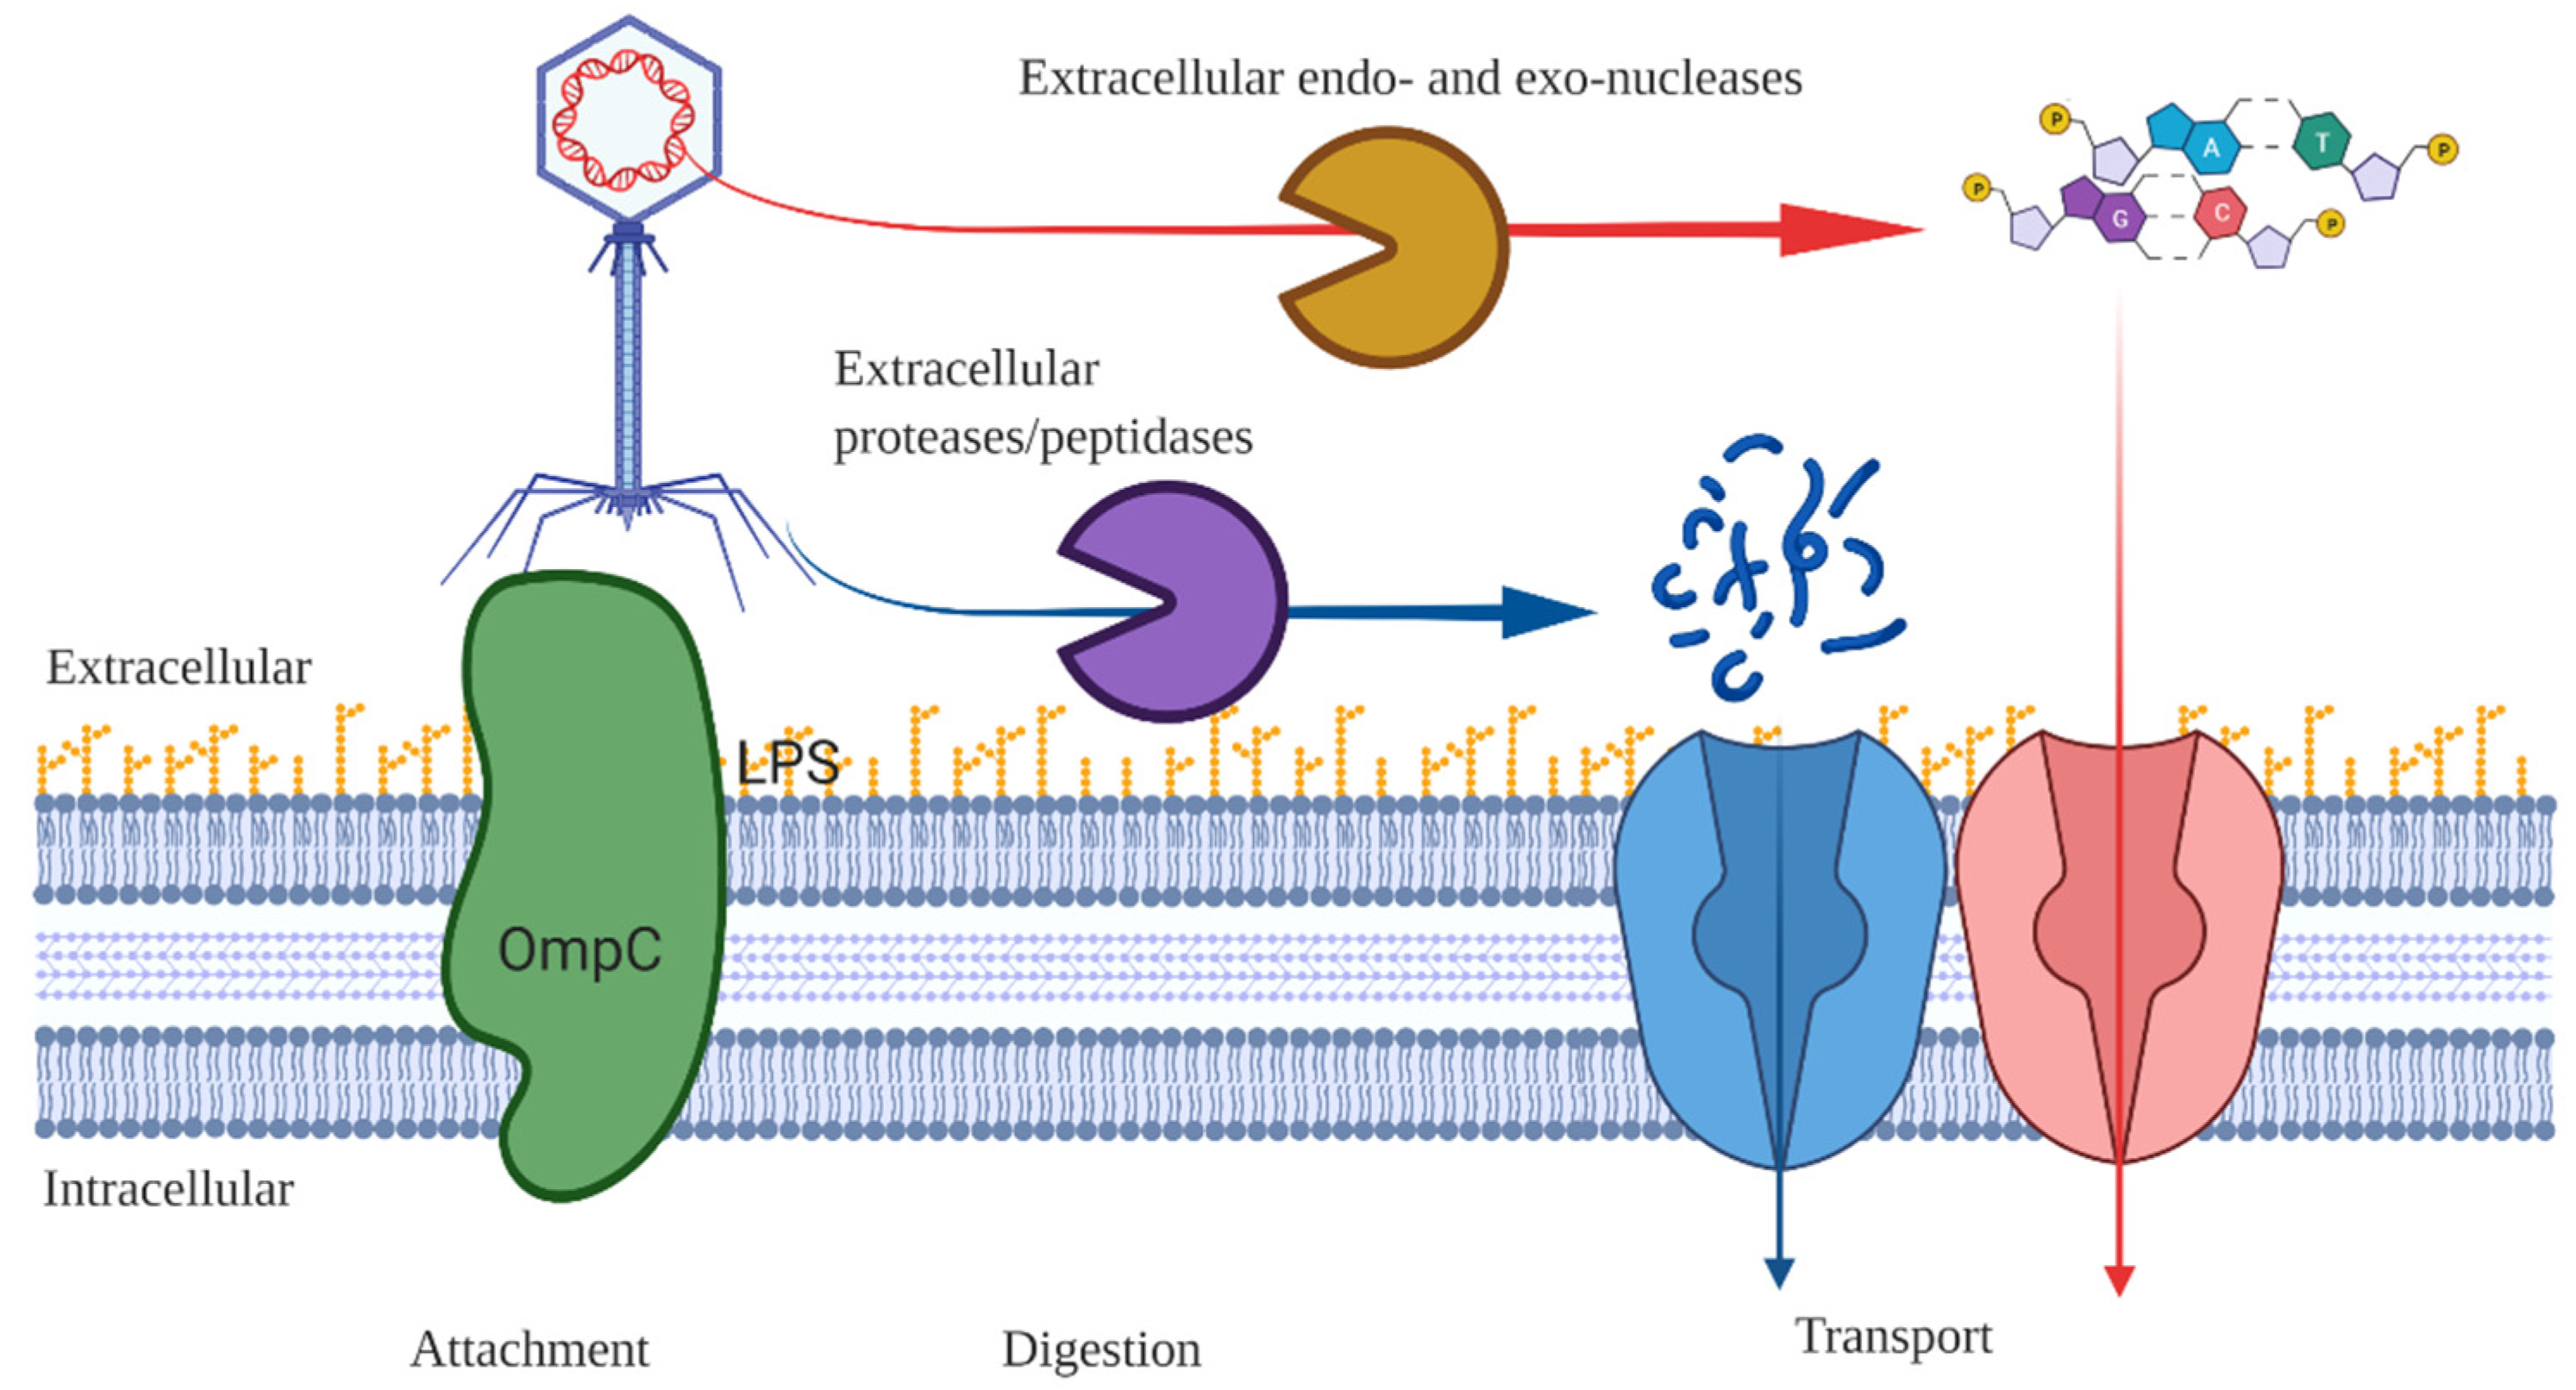
| DNA DIGESTION | fig|642.770.peg.760 | NODE_1_length_1964260_cov_90.024368 | Extracellular_and/or_outer_membrane_deoxyribonuclease_NucH/SO1066 | 0 | 0 | 1 |
| fig|642.770.peg.1409 | NODE_1_length_1964260_cov_90.024368 | UPF0294_protein_YafD (exo- and endo- nuclease family) | 0 | 0 | 1 | |
| fig|642.770.peg.1884 | NODE_1_length_1964260_cov_90.024368 | DNA/RNA_endonuclease_G | 1 | 1 | 1 | |
| fig|642.770.peg.1925 | NODE_1_length_1964260_cov_90.024368 | Extracellular_and/or_outer_membrane_deoxyribonuclease_NucH/SO1066 | 0 | 0 | 1 | |
| Peptide TRANSPORT into the cell | fig|642.770.peg.2135 | NODE_2_length_947468_cov_91.192050 | Succinyl-CoA_synthetase__alpha_subunit | 0 | 0 | 1 |
| fig|642.770.peg.274 | NODE_1_length_1964260_cov_90.024368 | ABC_transporter__permease_protein_1_(cluster_5__nickel/peptides/opines) | 4 | 6 | 3 | |
| fig|642.770.peg.275 | NODE_1_length_1964260_cov_90.024368 | ABC_transporter__permease_protein_2_(cluster_5__nickel/peptides/opines) | 3 | 5 | 3 | |
| fig|642.770.peg.1213 | NODE_1_length_1964260_cov_90.024368 | Oligopeptide_ABC_transporter__permease_protein_OppC_(TC_3.A.1.5.1) | 4 | 6 | 3 | |
| fig|642.770.peg.1214 | NODE_1_length_1964260_cov_90.024368 | Oligopeptide_ABC_transporter__permease_protein_OppB_(TC_3.A.1.5.1) | 4 | 6 | 3 | |
| fig|642.770.peg.1215 | NODE_1_length_1964260_cov_90.024368 | Oligopeptide_ABC_transporter__substrate-binding_protein_OppA_(TC_3.A.1.5.1) | 1 | 1 | 1 | |
| fig|642.770.peg.1819 | NODE_1_length_1964260_cov_90.024368 | Dipeptide_ABC_transporter__permease_protein_DppC_(TC_3.A.1.5.2) | 4 | 6 | 3 | |
| fig|642.770.peg.1820 | NODE_1_length_1964260_cov_90.024368 | ABC_transporter__permease_protein_1_(cluster_5__nickel/peptides/opines) | 4 | 6 | 3 | |
| fig|642.770.peg.1913 | NODE_1_length_1964260_cov_90.024368 | ABC_transporter__permease_protein_2_(cluster_5__nickel/peptides/opines) | 4 | 6 | 3 | |
| fig|642.770.peg.1914 | NODE_1_length_1964260_cov_90.024368 | ABC_transporter__permease_protein_1_(cluster_5__nickel/peptides/opines) | 4 | 6 | 3 | |
| DNA TRANSPORT into the cell | fig|642.770.peg.2922 | NODE_3_length_439005_cov_94.027299 | Na+_dependent_nucleoside_transporter_NupC | 5 | 9 | 4 |
| fig|642.770.peg.2967 | NODE_3_length_439005_cov_94.027299 | Na+_dependent_nucleoside_transporter_NupC | 4 | 8 | 4 | |
| fig|642.770.peg.3112 | NODE_3_length_439005_cov_94.027299 | Na+_dependent_nucleoside_transporter_NupC | 4 | 8 | 4 | |
| fig|642.770.peg.4145 | NODE_7_length_126480_cov_93.962673 | Predicted_nucleoside_ABC_transporter__permease_1_component | 6 | 10 | 5 | |
| fig|642.770.peg.4146 | NODE_7_length_126480_cov_93.962673 | Predicted_nucleoside_ABC_transporter__permease_2_component | 4 | 7 | 4 | |
| fig|642.770.peg.177 | NODE_13_length_22868_cov_91.969299 | DNA_uptake_protein | 0 | 0 | 1 |
Appendix C
References
- Bar-On, Y.M.; Phillips, R.; Milo, R. The biomass distribution on Earth. Proc. Natl. Acad. Sci. USA 2018, 115, 6506–6511. [Google Scholar] [CrossRef] [Green Version]
- Comeau, A.M.; Krisch, H.M. The capsid of the T4 phage superfamily: The evolution, diversity, and structure of some of the most prevalent proteins in the biosphere. Mol. Biol. Evol. 2008, 25, 1321–1332. [Google Scholar] [CrossRef]
- Jover, L.F.; Effler, T.C.; Buchan, A.; Wilhelm, S.W.; Weitz, J.S. The elemental composition of virus particles: Implications for marine biogeochemical cycles. Nat. Rev. Microbiol. 2014, 12, 519–528. [Google Scholar] [CrossRef] [PubMed]
- Mondal, T.; Rouch, D.A.; Thurbon, N.; Smith, S.R.; Deighton, M.A. Factors affecting decay of Salmonella Birkenhead and coliphage MS2 during mesophilic anaerobic digestion and air drying of sewage sludge. J. Water Health 2015, 13, 459–472. [Google Scholar] [CrossRef] [PubMed]
- Nasser, A.M.; Glozman, R.; Nitzan, Y. Contribution of microbial activity to virus reduction in saturated soil. Water Res. 2002, 36, 2589–2595. [Google Scholar] [CrossRef]
- Gonzalez, J.M.; Suttle, C.A. Grazing by Marine Nanoflagellates on Viruses and Virus-Sized Particles—Ingestion and Digestion. Mar. Ecol. Prog. Ser. 1993, 94, 1–10. [Google Scholar] [CrossRef]
- Brown, J.M.; Labonté, J.M.; Brown, J.; Record, N.R.; Poulton, N.J.; Sieracki, M.E.; Logares, R.; Stepanauskas, R. Single Cell Genomics Reveals Viruses Consumed by Marine Protists. Front. Microbiol. 2020, 11, 524828. [Google Scholar] [CrossRef]
- Zemb, O.; Achard, C.S.; Hamelin, J.; De Almeida, M.-L.; Gabinaud, B.; Cauquil, L.; Verschuren, L.M.G.; Godon, J.-J. Absolute quantitation of microbes using 16S rRNA gene metabarcoding: A rapid normalization of relative abundances by quantitative PCR targeting a 16S rRNA gene spike-in standard. Microbiologyopen 2020, 9, e977. [Google Scholar] [CrossRef] [PubMed]
- Magoc, T.; Salzberg, S.L. FLASH: Fast length adjustment of short reads to improve genome assemblies. Bioinformatics 2011, 27, 2957–2963. [Google Scholar] [CrossRef]
- Callahan, B.J.; McMurdie, P.J.; Rosen, M.J.; Han, A.W.; Johnson, A.J.; Holmes, S.P. DADA2: High-resolution sample inference from Illumina amplicon data. Nat. Methods 2016, 13, 581–583. [Google Scholar] [CrossRef] [Green Version]
- Quast, C.; Pruesse, E.; Yilmaz, P.; Gerken, J.; Schweer, T.; Yarza, P.; Peplies, J.; Glockner, F.O. The SILVA ribosomal RNA gene database project: Improved data processing and web-based tools. Nucleic Acids Res. 2013, 41, D590–D596. [Google Scholar] [CrossRef]
- Větrovský, T.; Baldrian, P. The Variability of the 16S rRNA Gene in Bacterial Genomes and Its Consequences for Bacterial Community Analyses. PLoS ONE 2013, 8, e57923. [Google Scholar] [CrossRef] [PubMed] [Green Version]
- Trousselier, M.; Bouvy, M.; Courties, C.; Dupuy, C. Variation of carbon content among bacterial species under starvation condition. Aquat. Microb. Ecol. 1997, 13, 113–119. [Google Scholar] [CrossRef]
- Buckley, D.H.; Huangyutitham, V.; Hsu, S.F.; Nelson, T.A. Stable isotope probing with 15N achieved by disentangling the effects of genome G+C content and isotope enrichment on DNA density. Appl. Environ. Microbiol. 2007, 73, 3189–3195. [Google Scholar] [CrossRef] [PubMed] [Green Version]
- Janda, J.M.; Abbott, S.L. The genus Aeromonas: Taxonomy, pathogenicity, and infection. Clin. Microbiol. Rev. 2010, 23, 35–73. [Google Scholar] [CrossRef] [PubMed] [Green Version]
- Ye, L.; Zhang, T.; Wang, T.; Fang, Z. Microbial structures, functions, and metabolic pathways in wastewater treatment bioreactors revealed using high-throughput sequencing. Environ. Sci. Technol. 2012, 46, 13244–13252. [Google Scholar] [CrossRef] [PubMed]
- Noonan, B.; Trust, T.J. The synthesis, secretion and role in virulence of the paracrystalline surface protein layers of Aeromonas salmonicida and A. hydrophila. FEMS Microbiol. Lett. 1997, 154, 1–7. [Google Scholar] [CrossRef] [PubMed]
- Sleytr, U.B.; Schuster, B.; Egelseer, E.-M.; Pum, D. S-layers: Principles and applications. FEMS Microbiol. Rev. 2014, 38, 823–864. [Google Scholar] [CrossRef]
- Islam, M.Z.; Fokine, A.; Mahalingam, M.; Zhang, Z.; Garcia-Doval, C.; van Raaij, M.J.; Rossmann, M.G.; Rao, V.B. Molecular anatomy of the receptor binding module of a bacteriophage long tail fiber. PLoS Pathog. 2019, 15, e1008193. [Google Scholar] [CrossRef] [Green Version]
- Janda, J.M. Biochemical and exoenzymatic properties of Aeromonas species. Diagn. Microbiol. Infect. Dis. 1985, 3, 223–232. [Google Scholar] [CrossRef]
- Seshadri, R.; Joseph, S.W.; Chopra, A.K.; Sha, J.; Shaw, J.; Graf, J.; Haft, D.; Wu, M.; Ren, Q.; Rosovitz, M.J.; et al. Genome Sequence of Aeromonas hydrophila ATCC 7966T: Jack of All Trades. J. Bacteriol. 2006, 188, 8272–8282. [Google Scholar] [CrossRef] [PubMed] [Green Version]
| Time (min) | T4 Phages in 12C Bottle | T4 Phages in 13C Bottle | T4 Phages in 12C Bottle | T4 Phages in 13C Bottle |
|---|---|---|---|---|
| 0 | 2.8 × 10¹⁰ | 2.2 × 10¹⁰ | 100% | 100% |
| 24 | 5.2 × 10⁸ | 9.4 × 10⁸ | 1.9% | 4.2% |
| 122 | 2.6 × 10⁷ | 4.1 × 10⁸ | 0.9% | 1.8% |
| 445 | 3.2 × 10⁷ | 3.3 × 10⁸ | 1.2% | 1.5% |
| 1375 | 5 × 10² | 5.7 × 10⁵ | 0% | 0% |
| Sample Name | Primers | Efficiency | Cycle Threshold | Spiked Internal Standard | 16S rDNA |
|---|---|---|---|---|---|
| Initial sample | Internal standard | 79.8% | 23.462 | 3 × 10⁵ copies | 9.78 × 10⁷ copies |
| V4V5 | 82.8% | 13.215 | |||
| Final 13C sample | Internal standard | 80.1% | 14.133 | 3 × 10⁵ copies | 2.35 × 10⁸ copies |
| V4V5 | 84.5% | 24.461 |
| seq_ID.x | Class | Order | Family | Genus |
|---|---|---|---|---|
| ASV 2 | Gammaproteobacteria | Aeromonadales | Aeromonadaceae | Tolumonas |
| ASV 1 | Gammaproteobacteria | Aeromonadales | Aeromonadaceae | Aeromonas |
| ASV 12 | Ignavibacteria | Ignavibacteriales | PHOS-HE36 | NA |
| ASV 21 | Ignavibacteria | Ignavibacteriales | PHOS-HE36 | NA |
| ASV 79 | Bacteroidia | Chitinophagales | Saprospiraceae | Haliscomenobacter |
| ASV 20 | Bacteroidia | Chitinophagales | Saprospiraceae | NA |
| ASV 67 | Anaerolineae | Ardenticatenales | NA | NA |
| ASV 7 | Gammaproteobacteria | Burkholderiales | Rhodocyclaceae | NA |
| ASV 9 | Gammaproteobacteria | Burkholderiales | Rhodocyclaceae | Dechloromonas |
| Description | ASV 1 | ASV 2 | ASV 7 | ASV 9 | ASV 12 | ASV 20 | ASV 21 | ASV 67 | ASV 79 | |
|---|---|---|---|---|---|---|---|---|---|---|
| STEP 1 | Absolute number of 16S rDNA copies in the initial sample | 9.78 × 10⁷ | ||||||||
| Absolute number of 16S rDNA copies in the final sample | 2.47 × 10⁸ | |||||||||
| STEP 2 | Counts in the initial sample (out of 3748 sequences) | 0 | 0 | 148 | 132 | 197 | 123 | 0 | 46 | 53 |
| Counts in the final 13C sample (out of 3578 sequences) | 303 | 1545 | 37 | 62 | 52 | 55 | 55 | 41 | 55 | |
| Relative initial abundance of 16S rDNA of each ASV | 0% | 0% | 4% | 4% | 5% | 3% | 0% | 1% | 1% | |
| Relative final abundance of 16S rDNA of each ASV | 8% | 43% | 1% | 2% | 1% | 2% | 2% | 1% | 2% | |
| Absolute number of 16S rDNA copies in the initial sample of each ASV | 0 | 0 | 3.86 × 10⁶ | 3.44 × 10⁶ | 5.14 × 10⁶ | 3.21 × 10⁶ | 0 | 1.20 × 10⁶ | 1.38 × 10⁶ | |
| Absolute number of 16S rDNA copies in the final sample of each ASV | 2.09 × 10⁷ | 1.07 × 10⁸ | 2.55 × 10⁶ | 4.28 × 10⁶ | 3.59 × 10⁶ | 3.80 × 10⁶ | 3.80 × 10⁶ | 2.83 × 10⁶ | 3.80 × 10⁶ | |
| Number of newly synthetized 16S copies | 2.09 × 10⁷ | 1.07 × 10⁸ | 0 | 8.36 × 10⁵ | 0 | 5.87 × 10⁵ | 3.80 × 10⁶ | 1.63 × 10⁶ | 2.41 × 10⁶ | |
| STEP 3 | Number of 16S rDNA copies per genome of each ASV [14] | 10 | 10 | 4 | 4 | 1 | 2 | 1 | 2 | 2 |
| Number of newly synthetized cells of each ASV | 2.09 × 10⁶ | 1.07 × 10⁷ | 0 | 2.09 × 10⁵ | 0 | 2.94 × 10⁵ | 3.80 × 10⁶ | 8.15 × 10⁵ | 1.21 × 10⁶ | |
| STEP 4 | Carbon content (g/cell) | 3.00 × 10⁻¹⁴ | ||||||||
| Total Carbon content in each ASV (g) | 6.28 × 10⁻⁸ | 3.20 × 10⁻⁷ | 0 | 6.27 × 10⁻⁹ | 0 | 8.81 × 10⁻⁹ | 1.14 × 10⁻⁷ | 2.45 × 10⁻⁸ | 3.62 × 10⁻⁸ | |
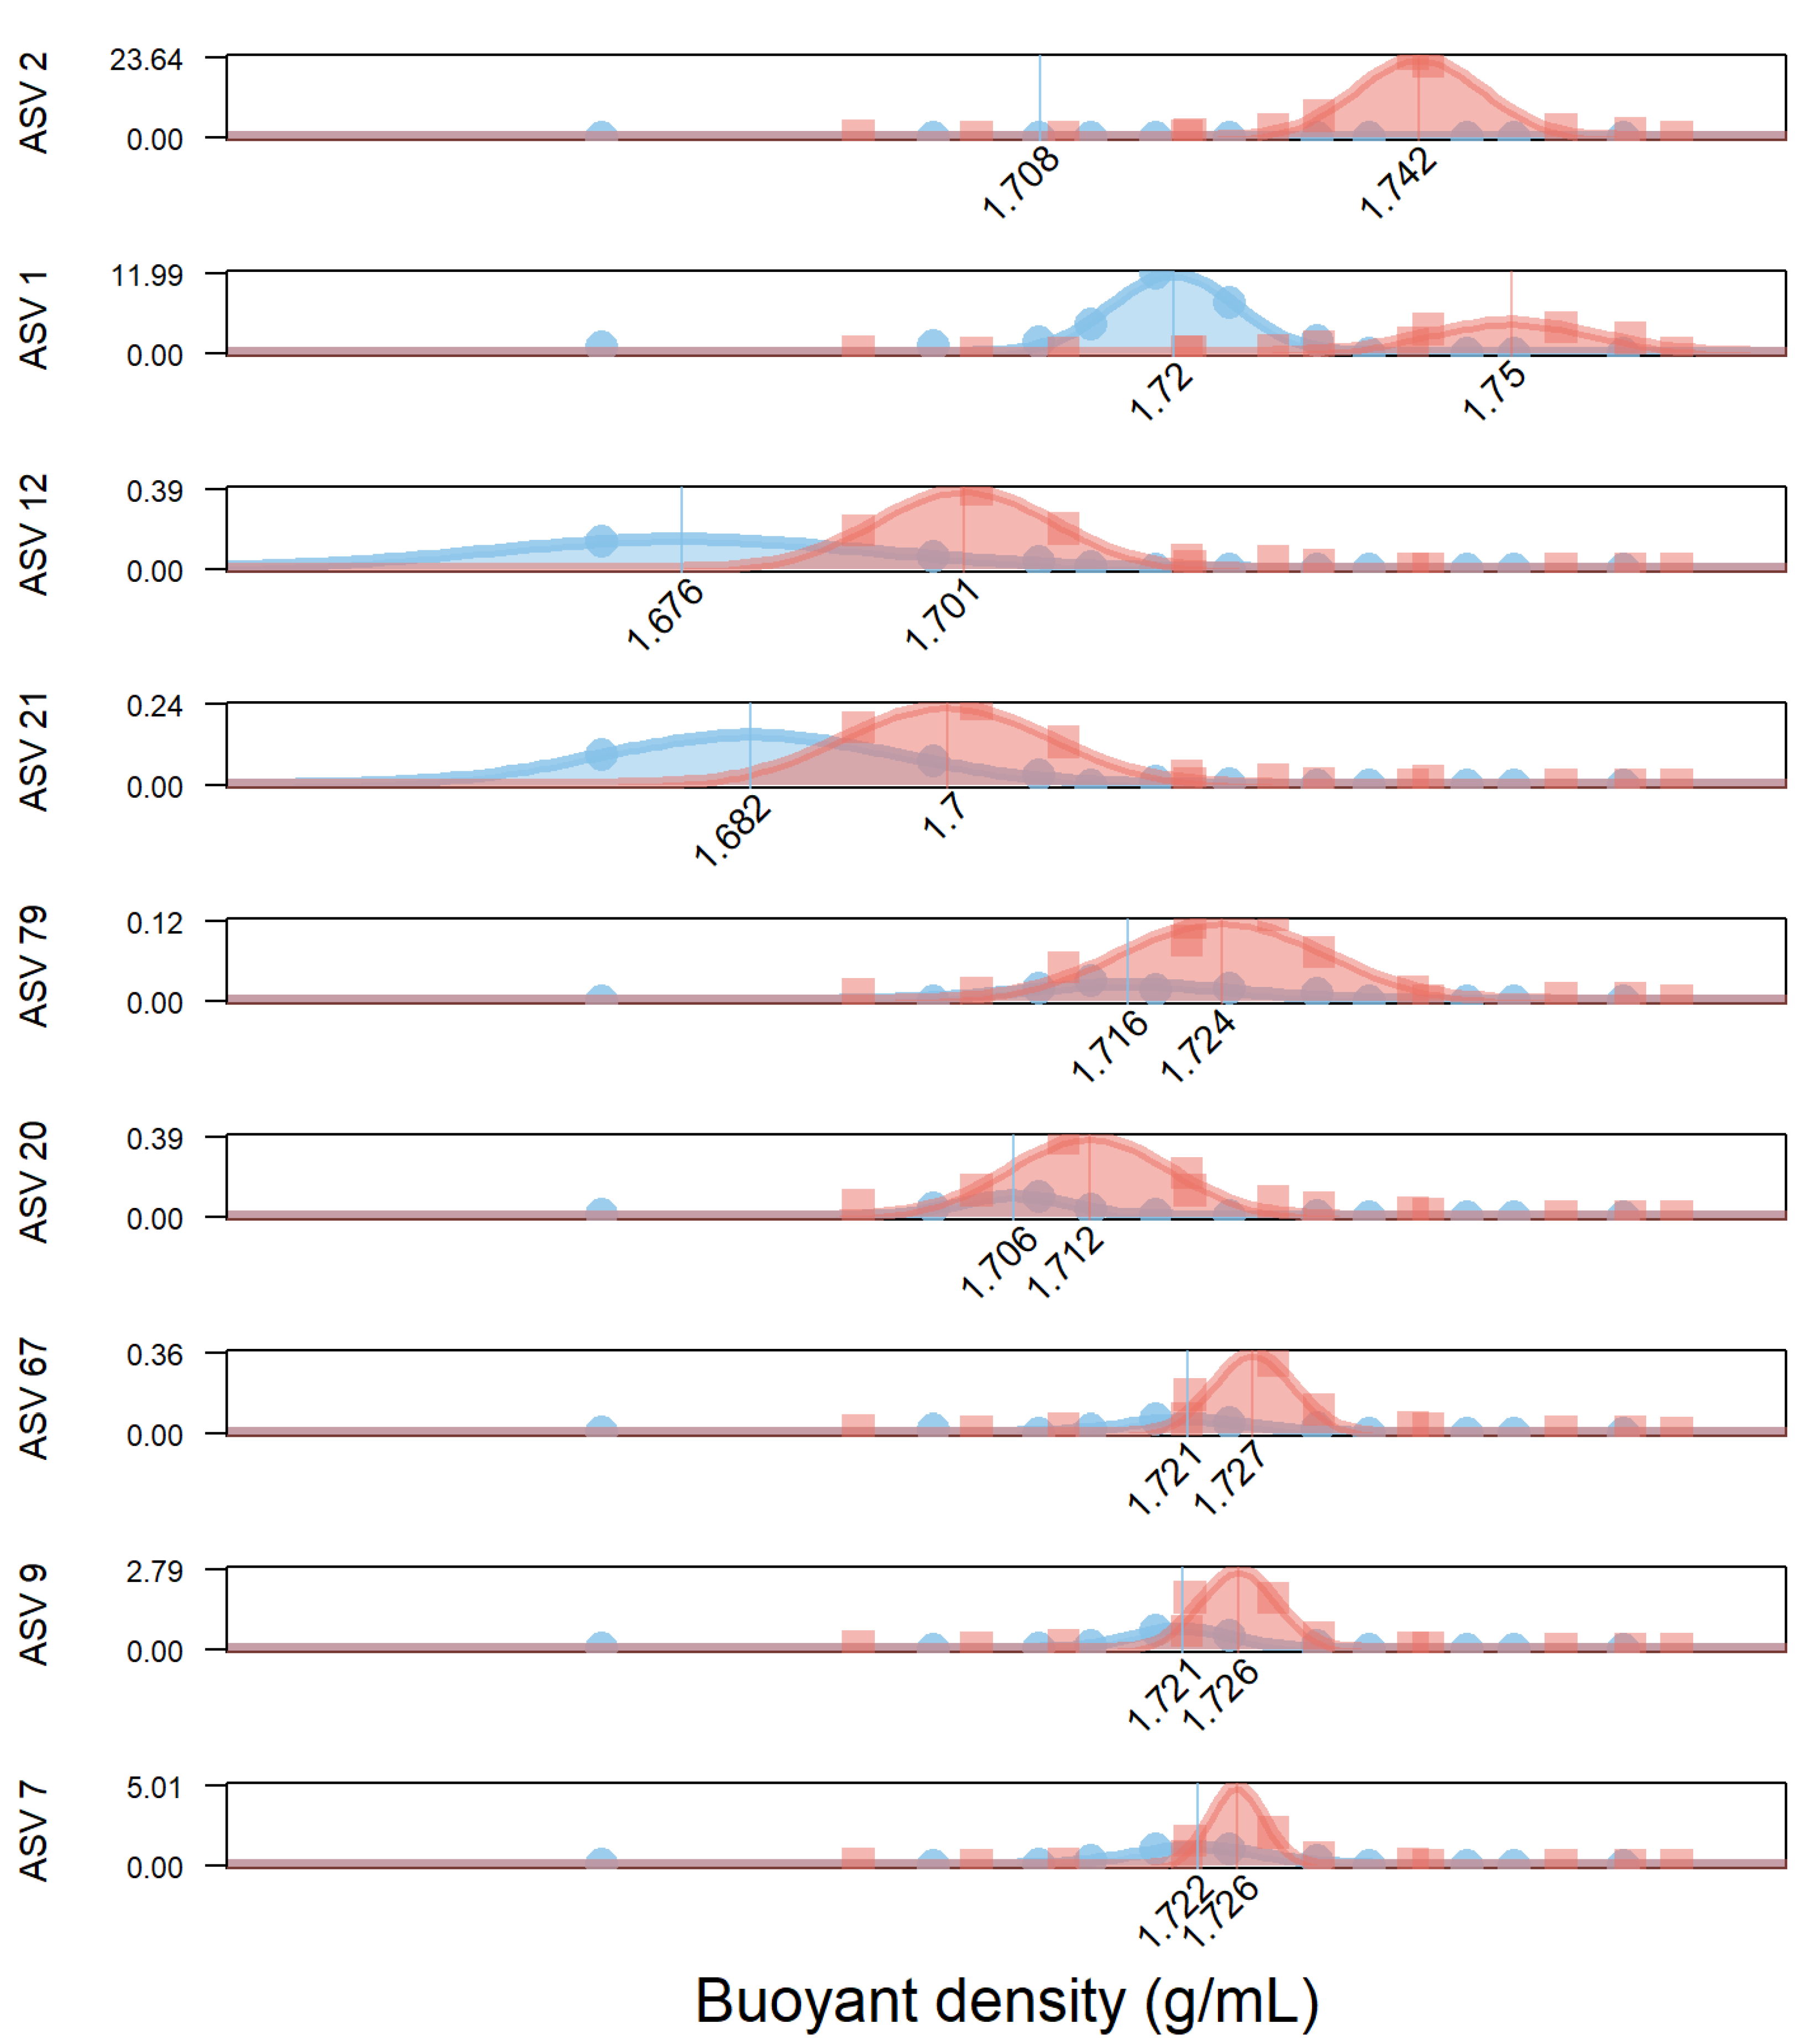
| STEP 5 | Mean 12C density (g/mL) | 1.72 | 1.7 | 1.72 | 1.72 | 1.68 | 1.71 | 1.68 | 1.72 | 1.72 |
| Goodness_fit_in_12C (R2) | 0.98 | 0.4 | 0.99 | 0.97 | 0.99 | 0.97 | 0.98 | 0.88 | 0.89 | |
| Mean corrected 12C density | 1.72 | 1.71 | 1.72 | 1.72 | 1.68 | 1.71 | 1.68 | 1.72 | 1.72 | |
| Mean 13C density | 1.75 | 1.74 | 1.73 | 1.73 | 1.7 | 1.71 | 1.7 | 1.73 | 1.72 | |
| Goodness_fit_in_13C (R2) | 0.89 | 0.99 | 0.9 | 0.89 | 0.98 | 0.93 | 0.99 | 0.94 | 0.94 | |
| Labeling Level (%) | 85% | 95% | 10% | 14% | 71% | 19% | 49% | 16% | 23% | |
| STEP 6 | 13C carbon content in each ASV (g) | 5.3 × 10⁻⁸ | 3.0 × 10⁻⁷ | 0 | 8.8 × 10⁻¹⁰ | 0 | 1.7 × 10⁻⁹ | 5.6 × 10⁻⁸ | 3.9 × 10⁻⁹ | 8.3 × 10⁻⁹ |
| STEP 7 | Carbon use efficiency (i.e., Bacterial yield) | 0.33 | ||||||||
| Contribution to the 13C mass balance (out of the 3.2 µg of 13C in the bacteriophages) | 5% 1 | 29% 1 | 0%1 | 0% 1 | 0% | 0% | 5% | 0% | 1% | |
| 13C mass balance | 41% | |||||||||
Publisher’s Note: MDPI stays neutral with regard to jurisdictional claims in published maps and institutional affiliations. |
© 2021 by the authors. Licensee MDPI, Basel, Switzerland. This article is an open access article distributed under the terms and conditions of the Creative Commons Attribution (CC BY) license (https://creativecommons.org/licenses/by/4.0/).
Share and Cite
Godon, J.-J.; Bize, A.; Ngo, H.; Cauquil, L.; Almeida, M.; Petit, M.-A.; Zemb, O. Bacterial Consumption of T4 Phages. Microorganisms 2021, 9, 1852. https://doi.org/10.3390/microorganisms9091852
Godon J-J, Bize A, Ngo H, Cauquil L, Almeida M, Petit M-A, Zemb O. Bacterial Consumption of T4 Phages. Microorganisms. 2021; 9(9):1852. https://doi.org/10.3390/microorganisms9091852
Chicago/Turabian StyleGodon, Jean-Jacques, Ariane Bize, Hoang Ngo, Laurent Cauquil, Mathieu Almeida, Marie-Agnès Petit, and Olivier Zemb. 2021. "Bacterial Consumption of T4 Phages" Microorganisms 9, no. 9: 1852. https://doi.org/10.3390/microorganisms9091852
APA StyleGodon, J.-J., Bize, A., Ngo, H., Cauquil, L., Almeida, M., Petit, M.-A., & Zemb, O. (2021). Bacterial Consumption of T4 Phages. Microorganisms, 9(9), 1852. https://doi.org/10.3390/microorganisms9091852